
August 17th Weekend Report
.
What is happening with these markets? A lot, really, so let’s discuss it.
.
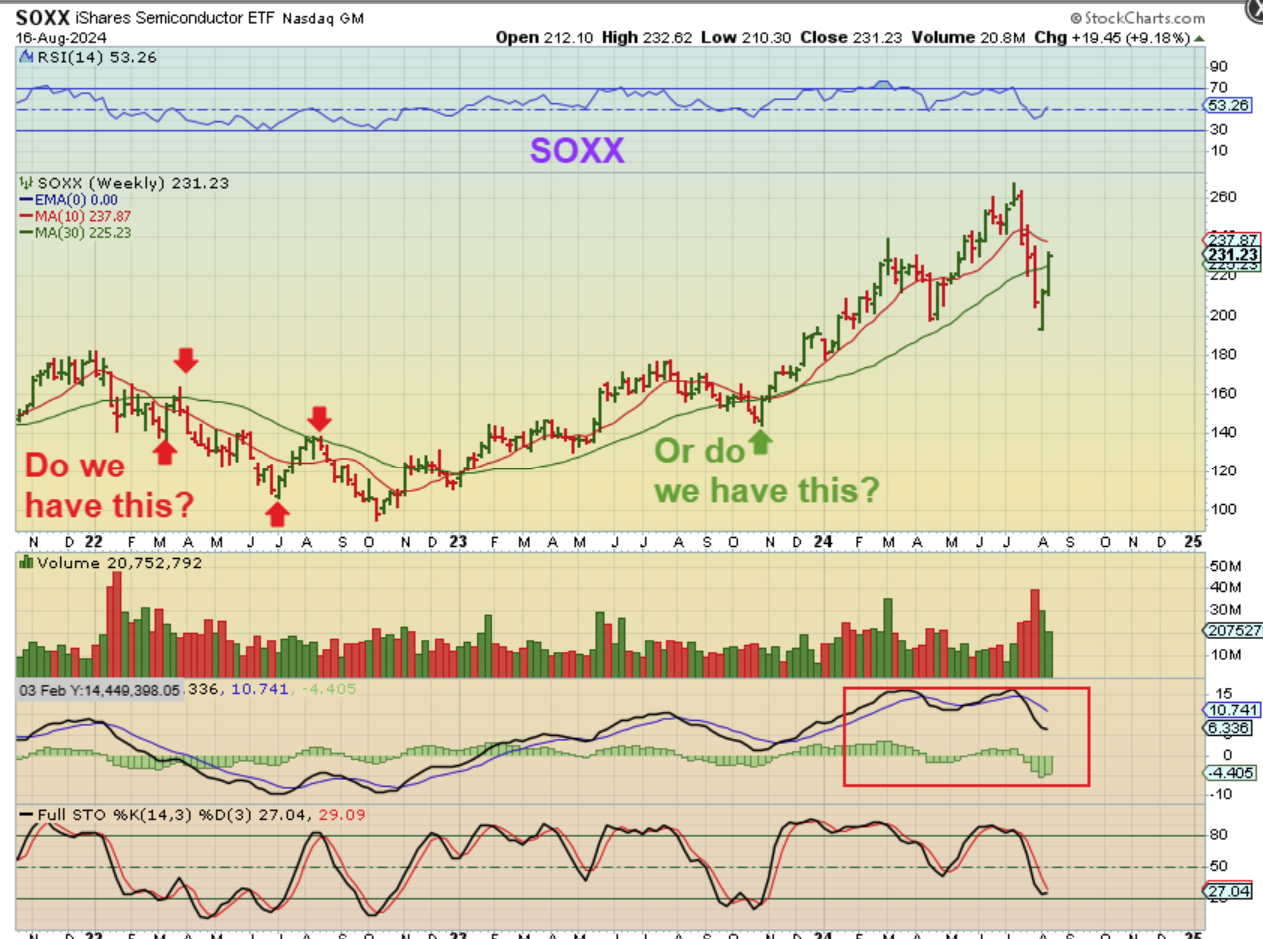
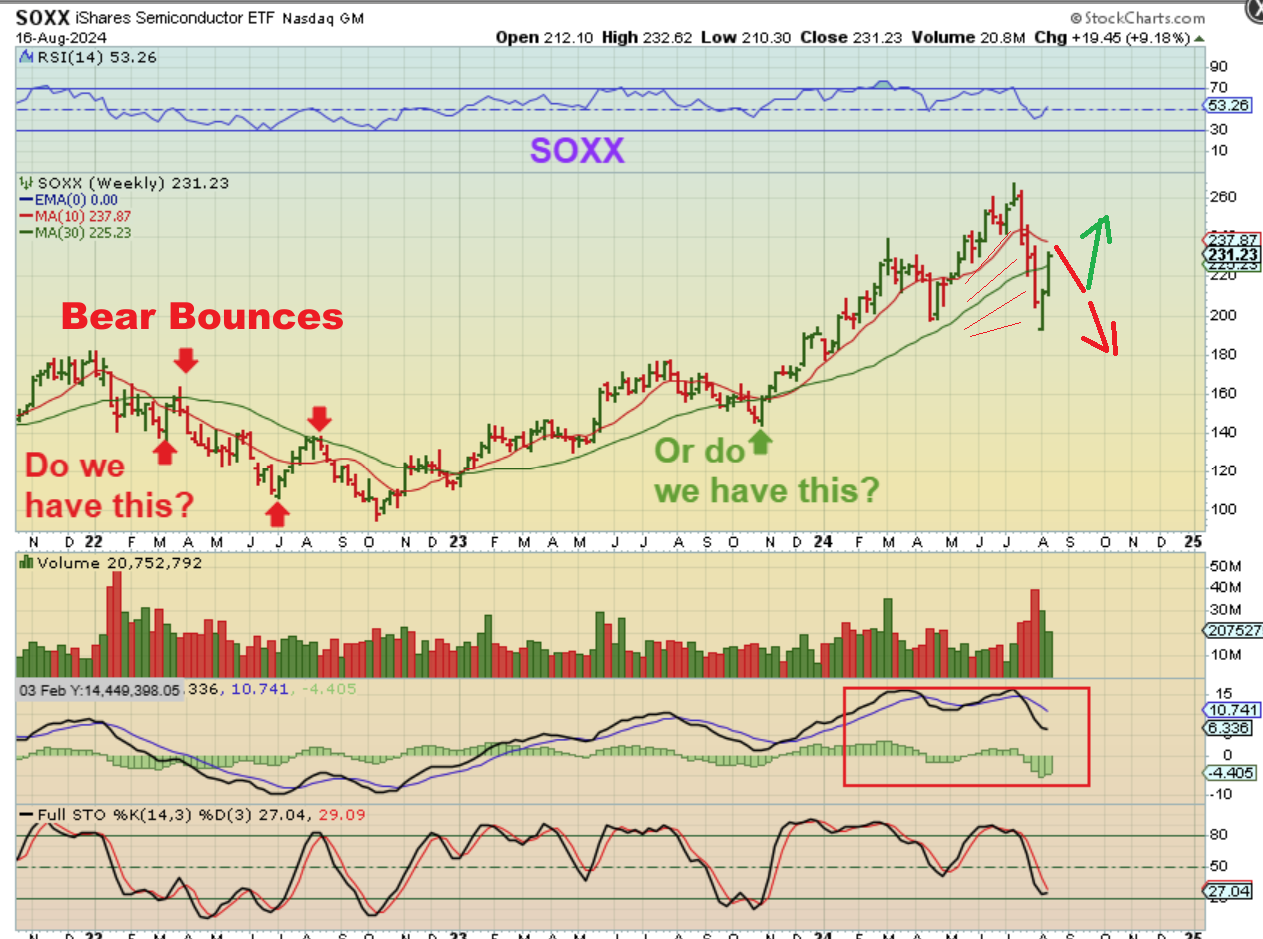
SOXX WEEKLY – We had 4 weeks straight of selling down, and that was a crash from the highs to new lows. The last ICL was in April and I have never seen a 3 month intermediate cycle, so I stated that we should get a pretty convincing bounce, and then roll over into the next ICL. Well, the last week of the crash became a reversal low. Now with that reversal low we saw a continuation higher all last week, despite some pretty important data.
.
Now with that reversal low we saw a continuation higher all last week, despite some pretty important data.
This is a very convincing move, but the set up still does call for a drop to new lows. We have failed daily cycles and a low that is only 3 months ahead of the last ICL. That said, I cannot rule out 100% that this was not some weird anomaly crash into a very early ICL, and now rate cuts will factor in bullishly, so how does one play this? We watch the next dip for clues. A higher low forms? Or it just sells off, but I will add that I am hearing about company lay offs, missed earnings, future earnings forecast to be lower, and small company failures.
.
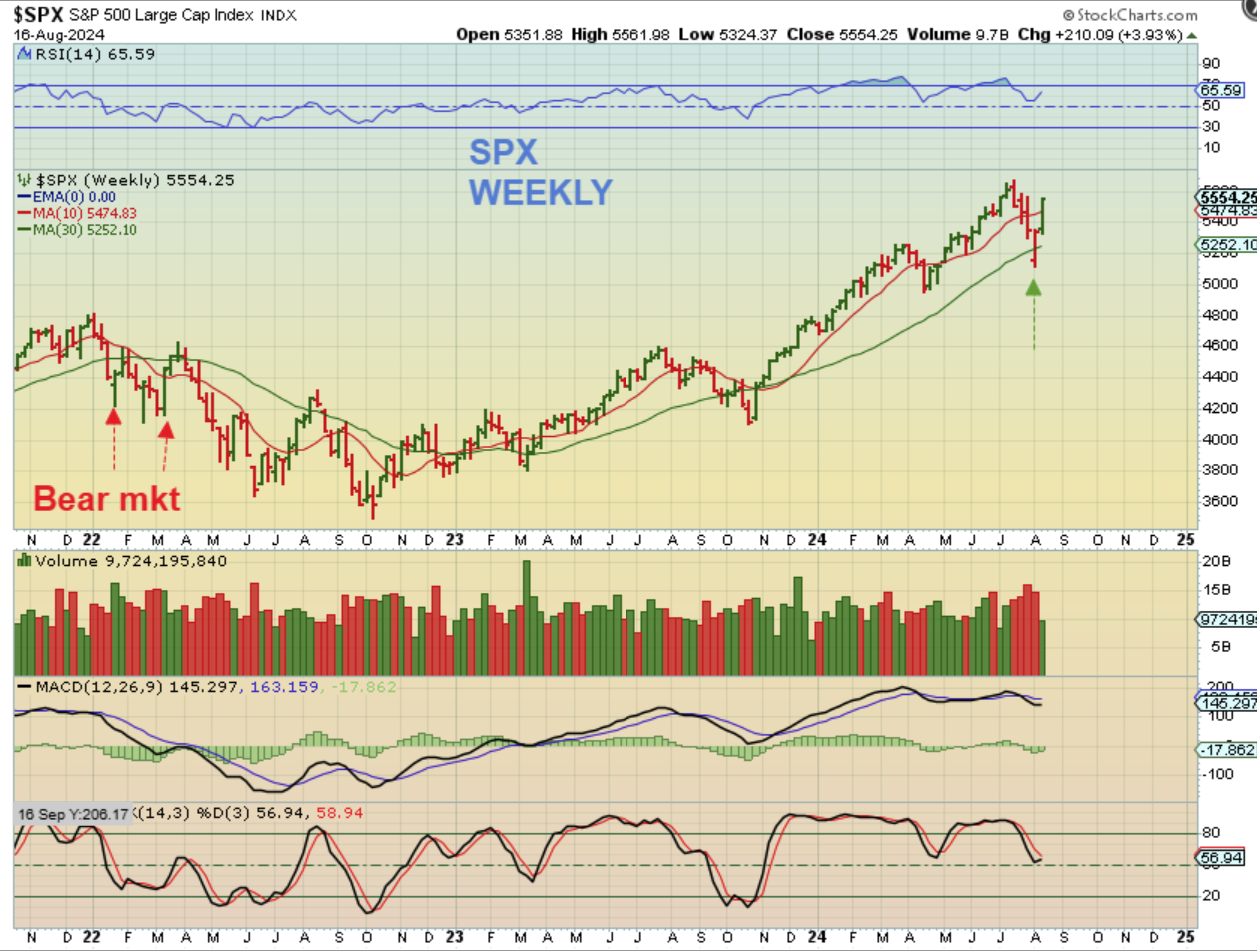
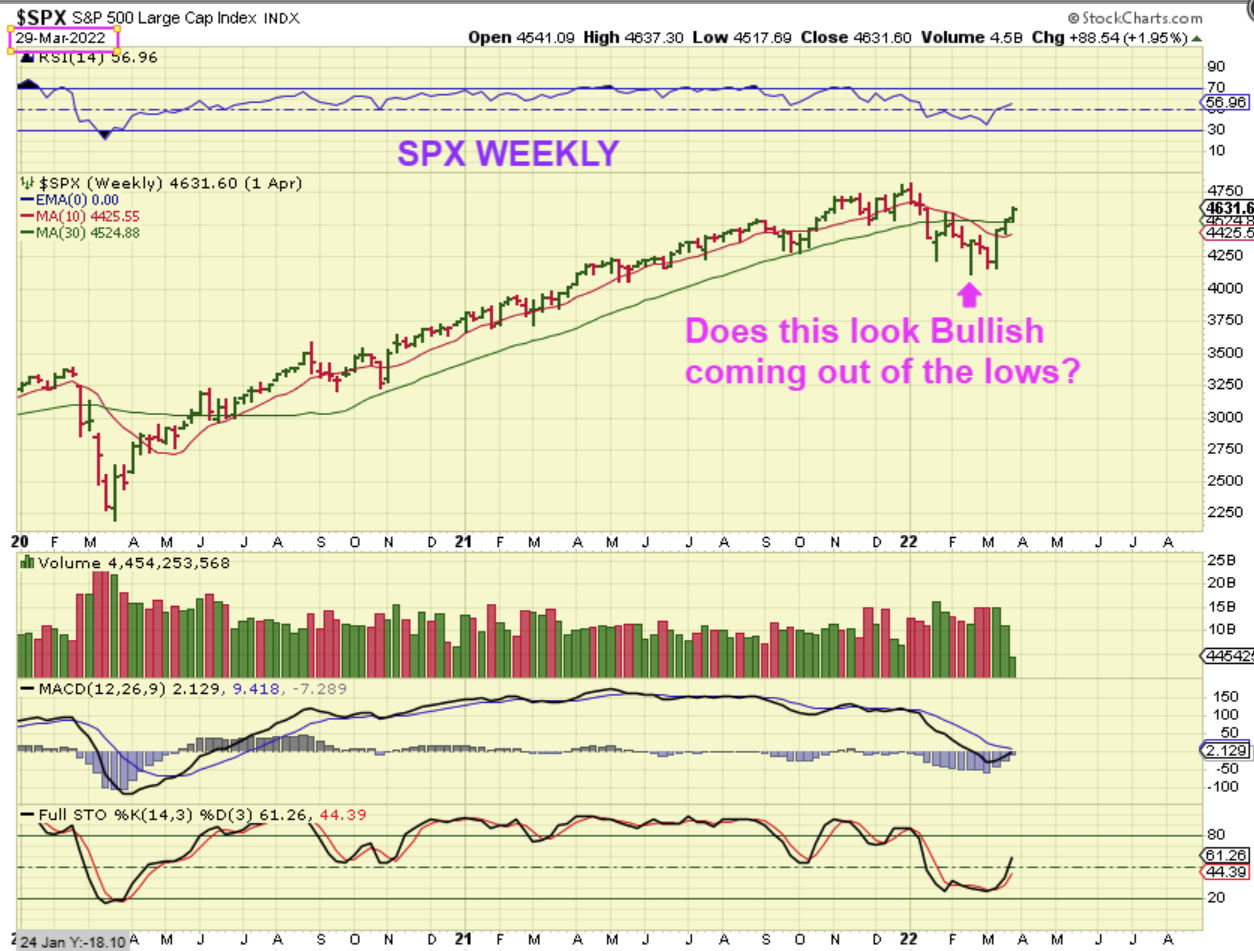
The SPX also has only had a 1 week reversal low and a follow through rally week, but it is already above the 10 & 30 week ma. I’m pointing out past sharp rallies in a bear market, just to show that they do exist and they do look very bullish and convincing too. Actually, let me show you a different view to show what I am saying…
let me show you a different view to show what I am saying:
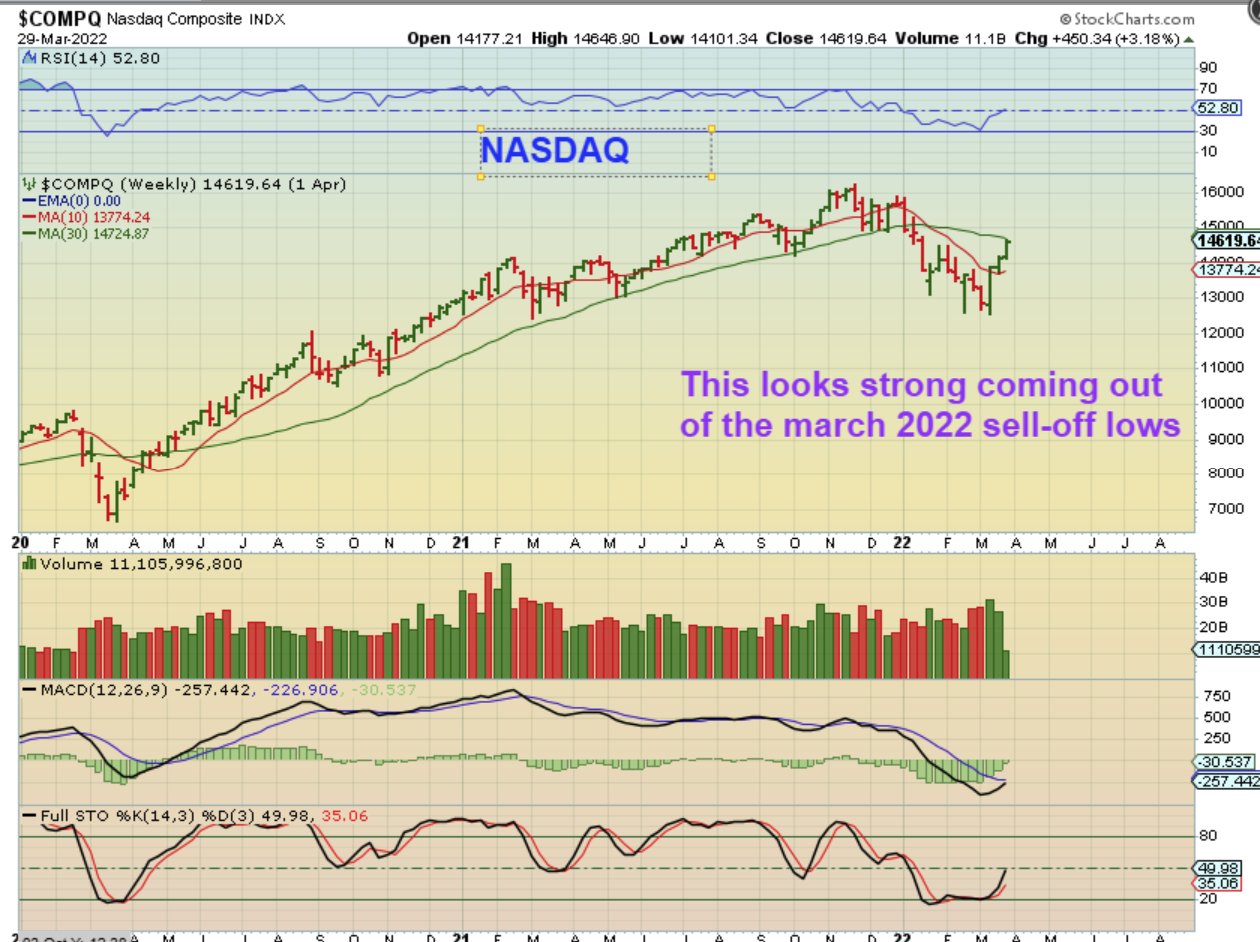
This is the March 2022 rally out of the lows and it looks very bullish as it moved out of the lows too, right? The MACD even curled up, but let’s take a look at what it looked like right after this 3 week rally…
.
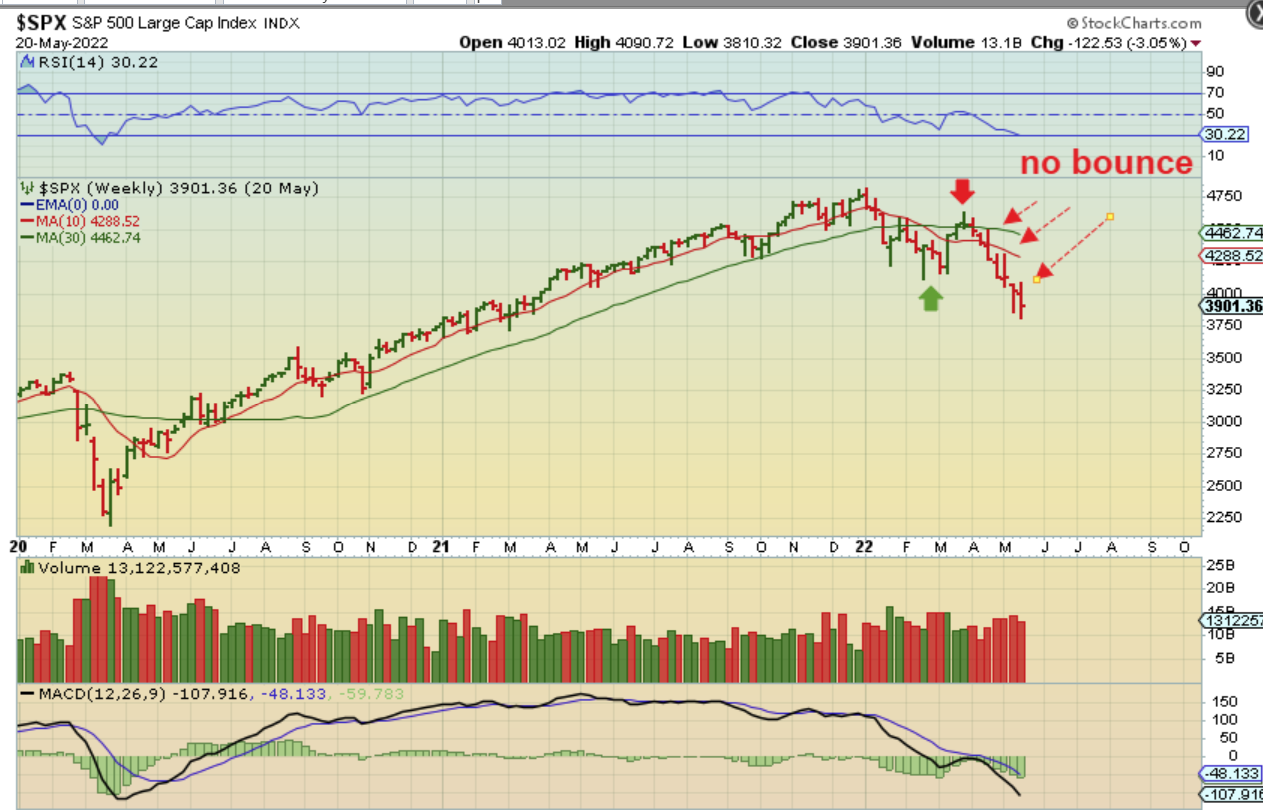
Take a look at what it looked like right after that 3rd week of the rally out of the lows.
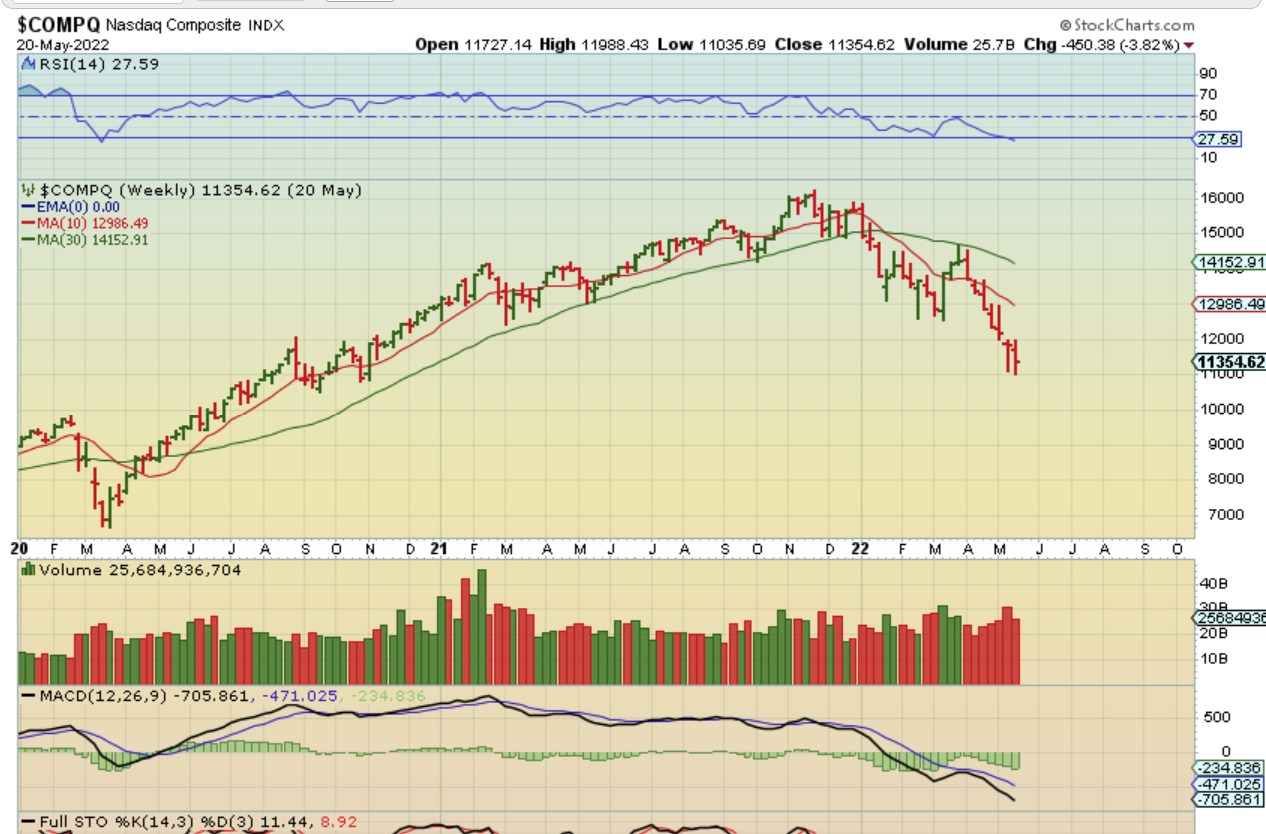
THE SPX also rallied out of the lows in March 2022 and broke above both the 10 & 30 week ma. THE SPX was just shy of new highs again, so this was Very bullish looking, right? This is recovery mode, until…
.
THE SPX also rallied out of the lows and broke above both the 10 & 30 week ma. Very bullish looking, right? Then it had a reversal candle at the top and sold off for 7 weeks without a bounce to new lows.
.
So my point is that we broke down very quickly in a flash crash 2 weeks ago, and suddenly there was a lot of fear in the air. Since then, we had a reversal move higher 1 week and a strong week last week. Now everything seems ok again and everyone is bullish. That is a very convincing rally out of the lows, but it is usually too early for a new ICL, and in the past I have seen these ‘bear market rallies’ that look very strong and convincing too, but the selling can return. I am hearing of weakening in the economy in recent earnings reports and earnings ‘misses’ with lay-offs. I actually am still looking to short this bounce when it reverses, and from then on I’ll watch for a bounce or higher low just to be cautious, but I am still thinking that what we are seeing is a strong bear market rally. If it is an ICL, then I called it wrong and I guess that the Fed saved the day with rate cuts, but that crash did come right after the fed mtg, didn’t it? THIS WEEK, we have the release of the Fed minutes, where they may have discussed the need for a cut due to the economy weakening and jobless claims reports. STAY FROSTY MY FRIENDS! If you are long, use stops.
.
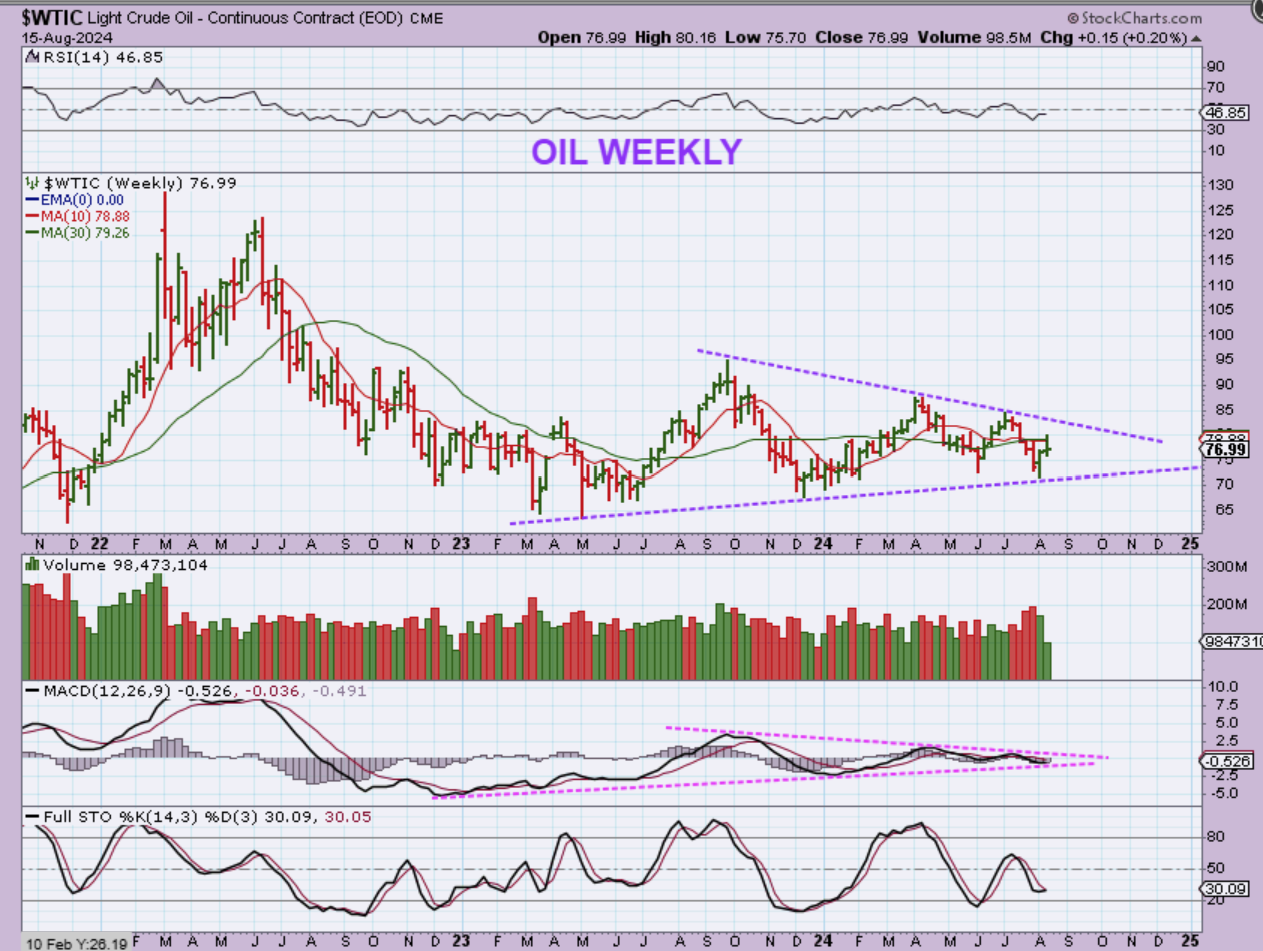
WTIC tagged the weekly resistance area and sold off gain, but this larger triangle pattern still remains in play, it just causes choppiness to tighten up as we enter the apex of that triangle.
.
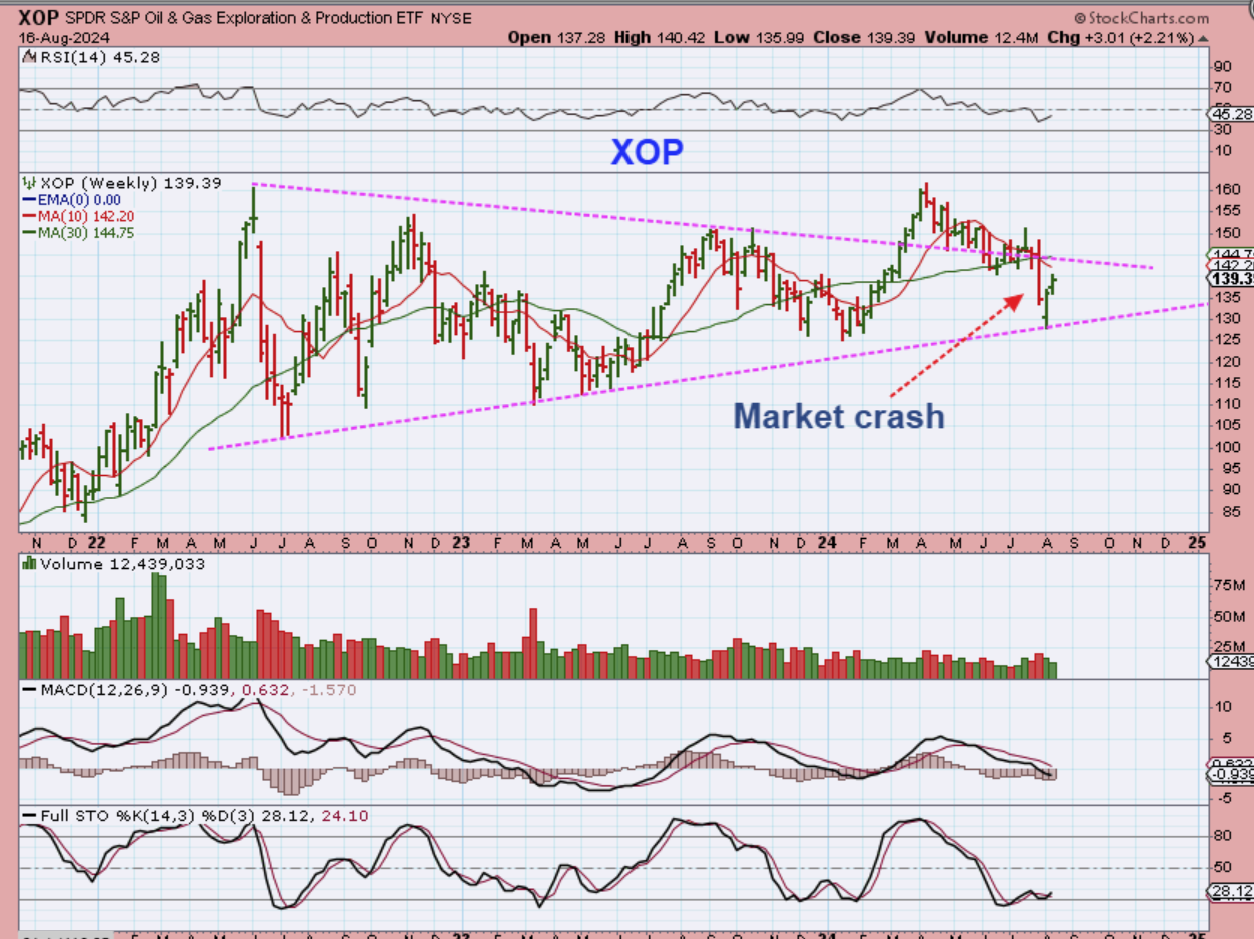
THE XOP had a breakout, but it chopped into a back test of that 30 week ma & downtrend and then it also got caught up in the crash. It landed at that lower trend line & reversed so far. Another choppy mess from that crash.
.
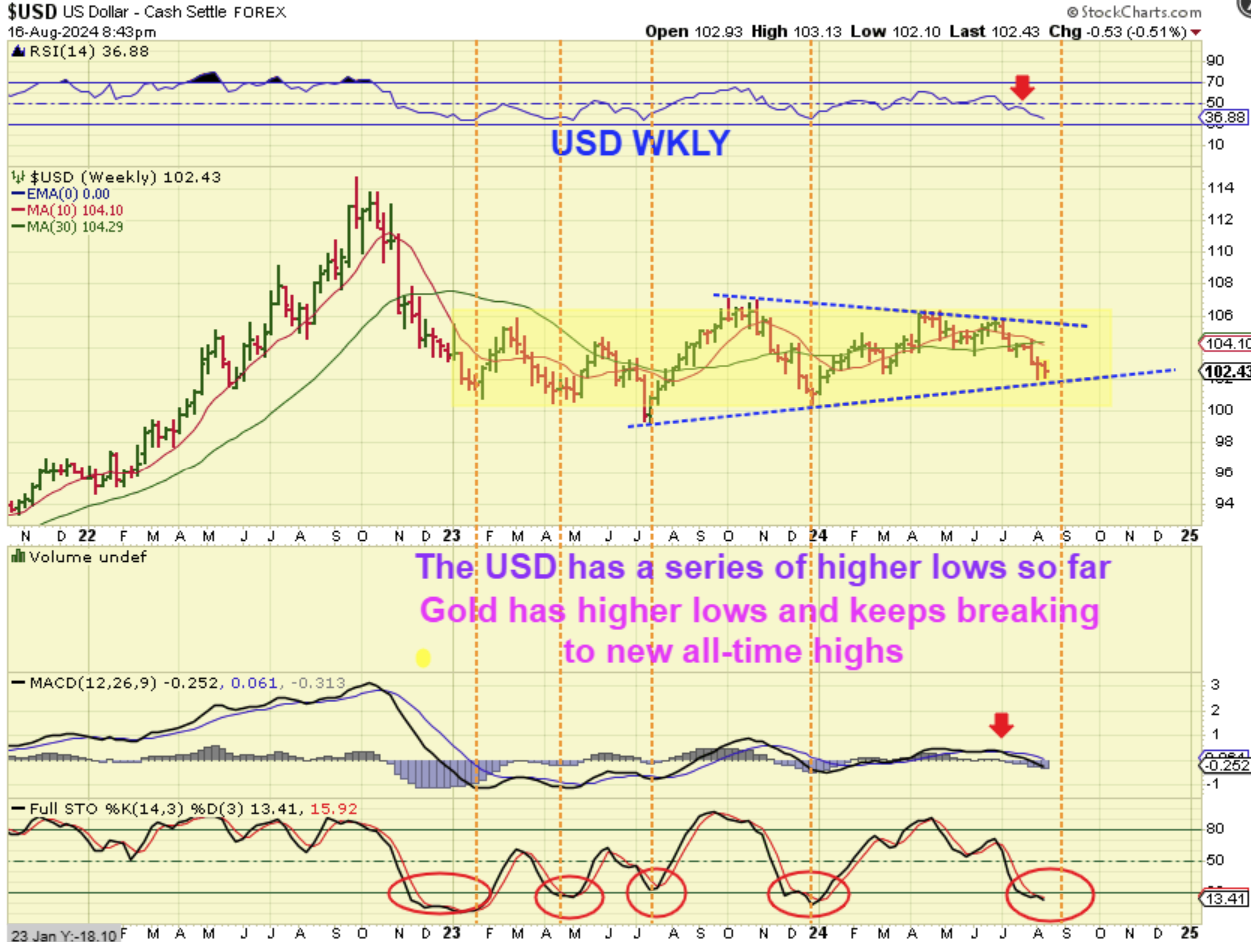
USD WEEKLY – For over a year I was posting about that 3 yr cycle low coming in 2023, and how that should push Gold to new all-time highs. Well, it does look like we actually did get that low then, but this series of higher lows in the USD is NOT stopping Gold at all, so I have focused less on the USD. That said, I was recently looking for a sell down to new lows and we are getting that now.
..
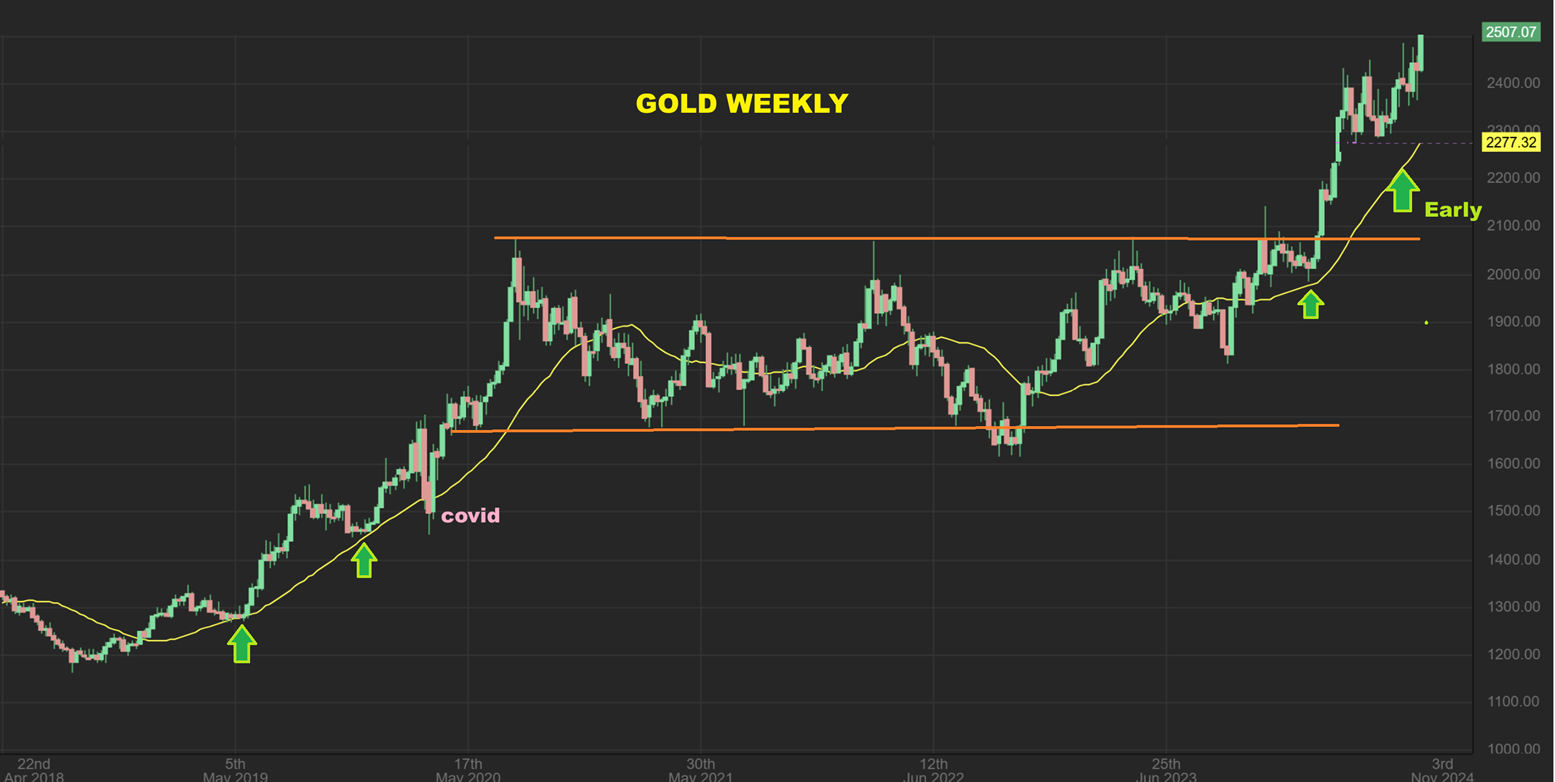
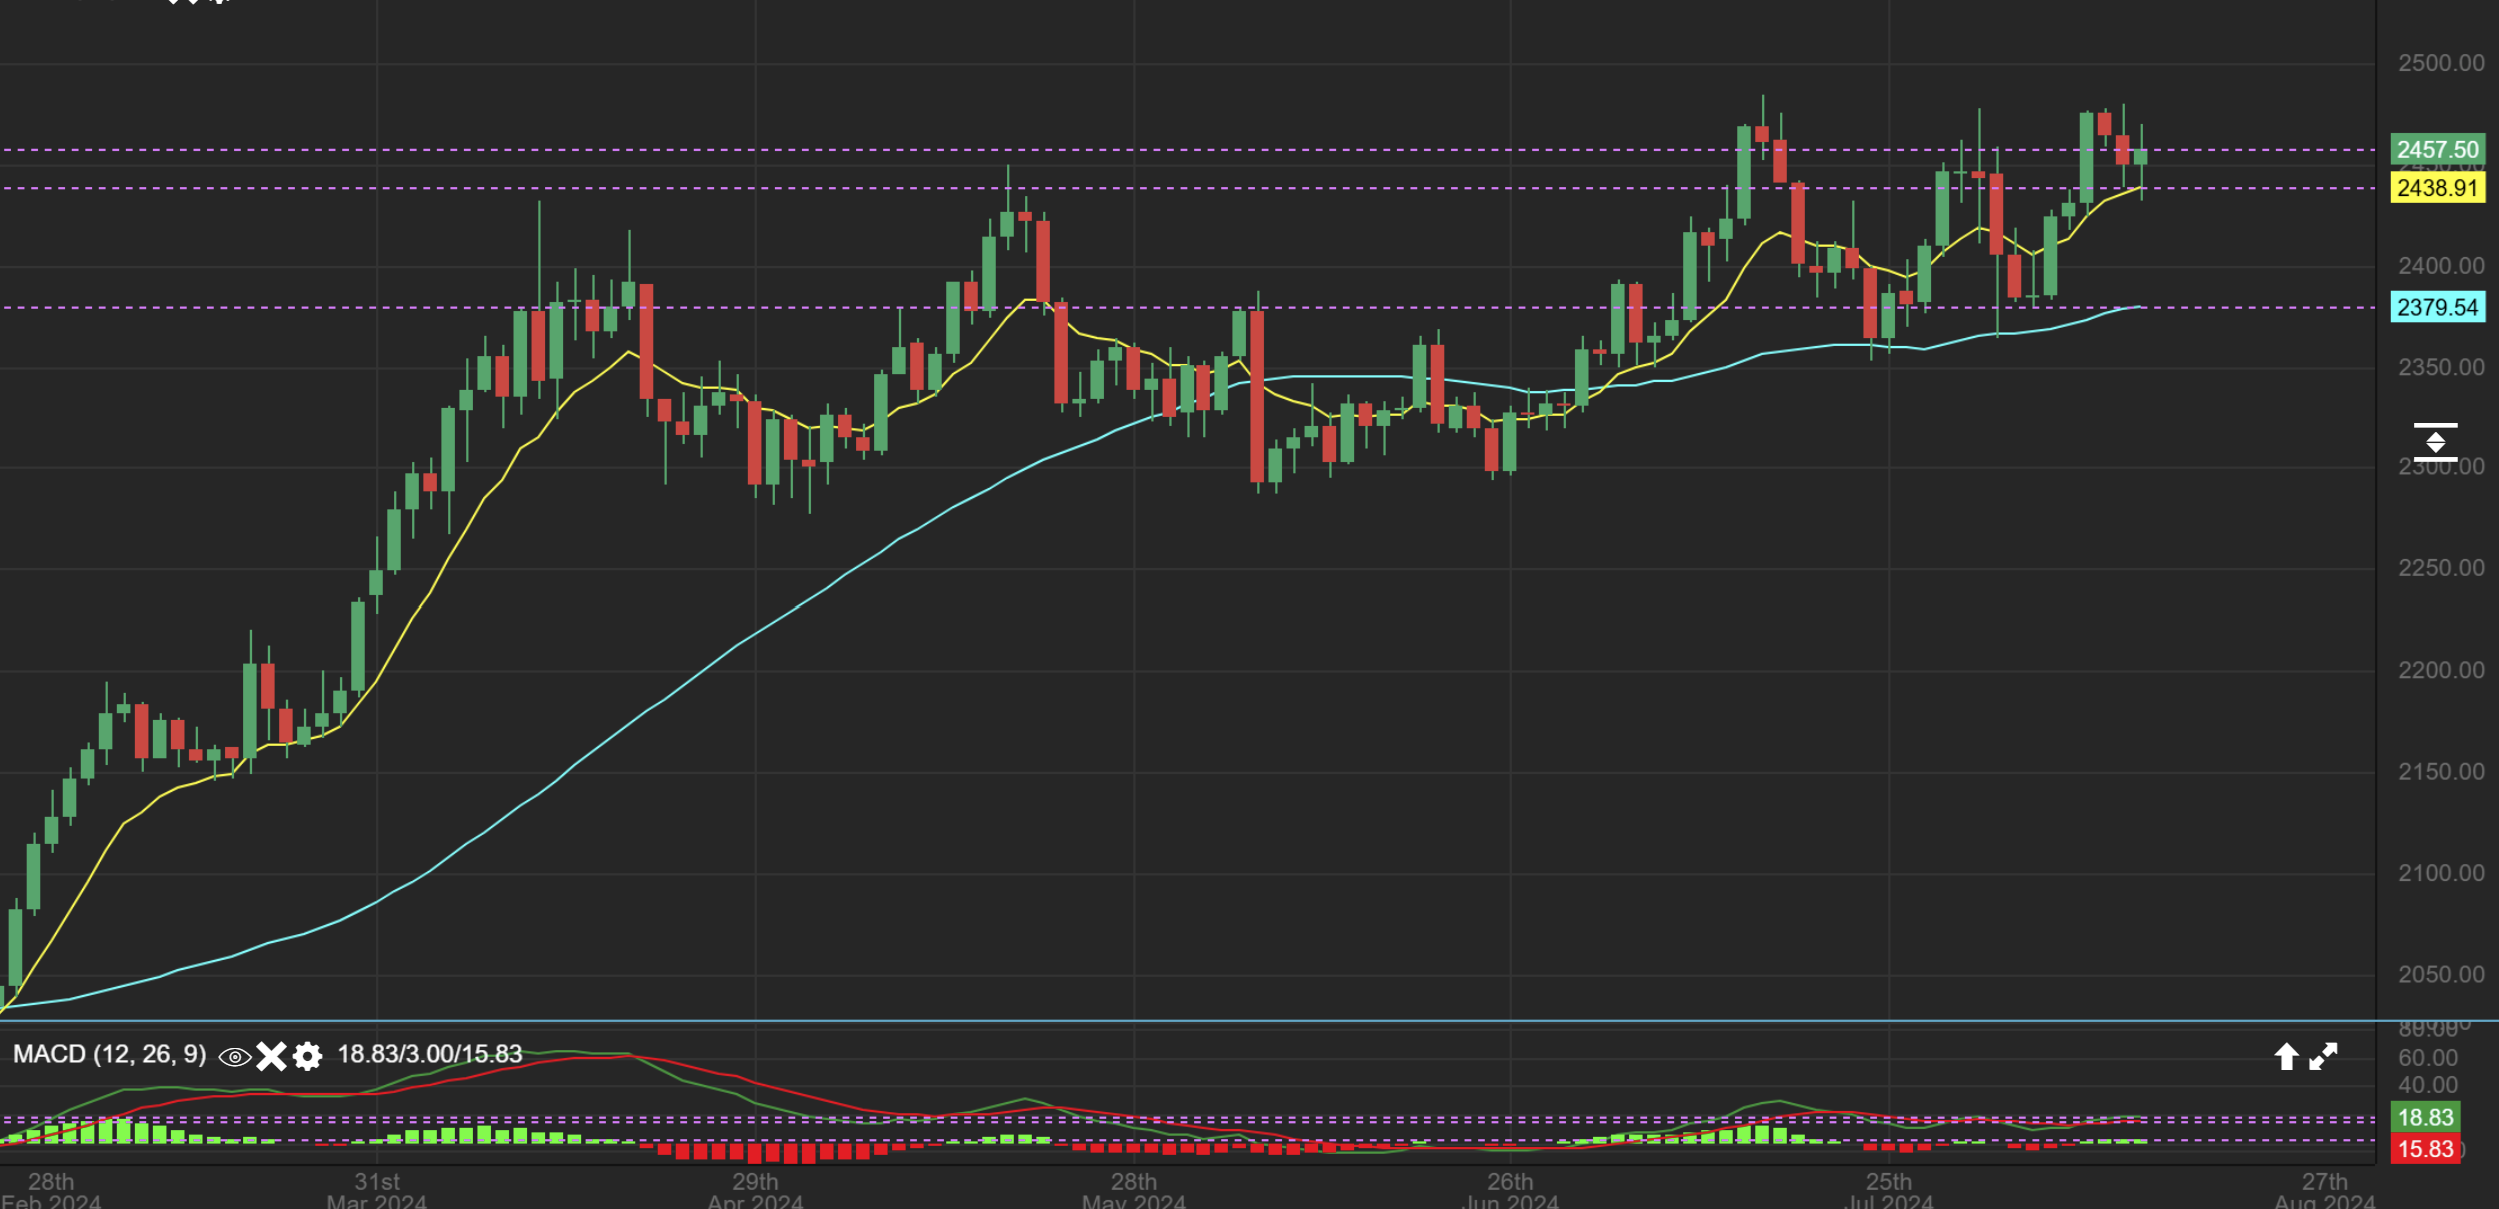
Let’s just take a Big Picture look at a beautiful chart of GOLD. That yellow line is the normal place for ICLs, but this became so strong, that it chopped sideways and then put in an early ICL when the Fed discussed rate cut probability and inflation slowing. It then took off to new highs and this Friday Gold surged to new all-time highs again in the 2nd daily cycle. Even though it gets choppy, Gold & the Gold Miners have been very profitable, especially since last Octobers ICL.
.
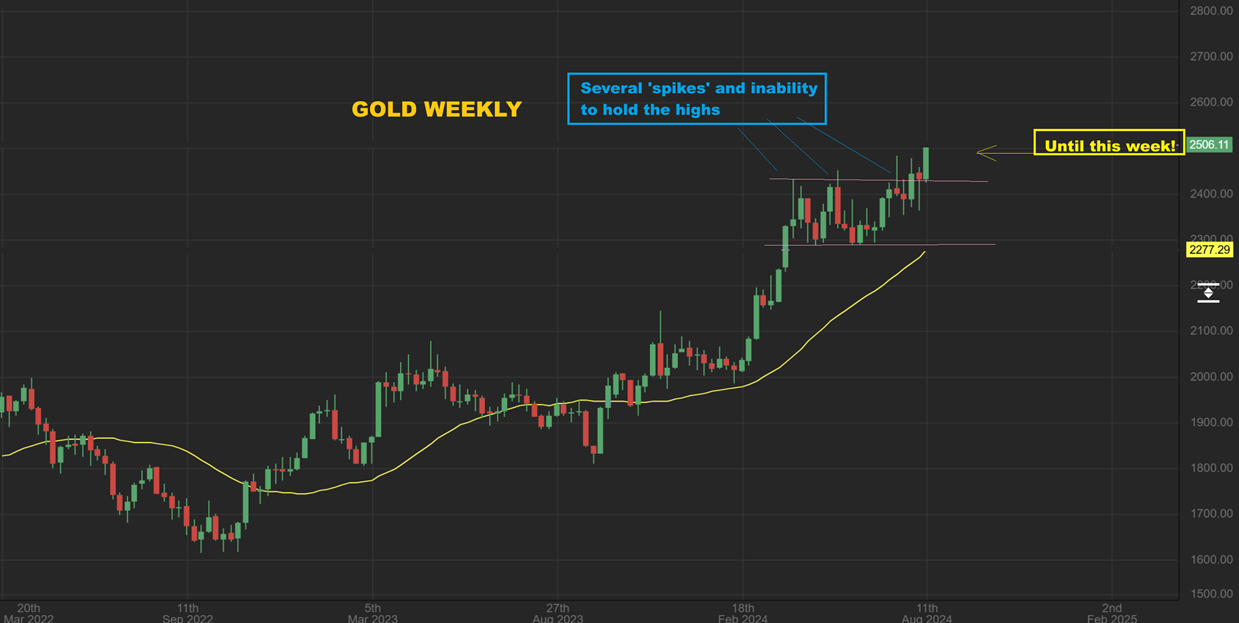
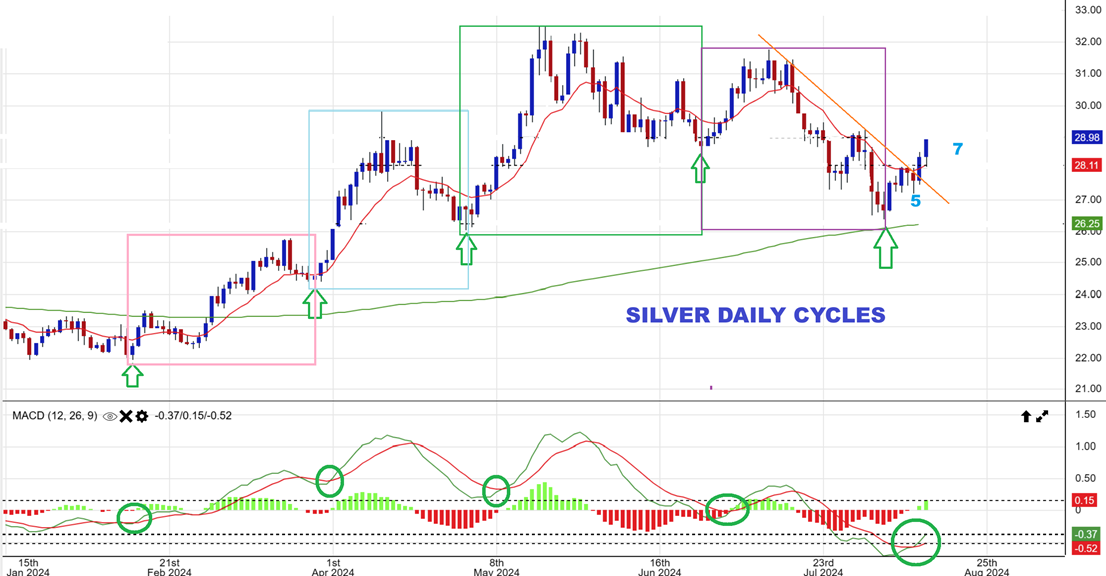
GOLD – Zooming in a bit we see that Gold had many weeks where it would spike higher and then sell off into Friday, so it couldn’t break out and hold the gains. We had another spike to new highs in the first daily cycle 4 weeks ago and now we had a dcl and started the second daily cycle chopping higher. Would it spike and drop into Friday again? Finally! Gold pushed higher and just kept climbing on this Friday! This is the 2nd daily cycle, so this can just keep running too! SO LET’s TALK ABOUT GOLD!
.
SO LET’s TALK ABOUT GOLD! This is the Good News!
.
I posted this in recent reports and this was Friday where I said that ,
“GOLD dropped to the 10sma again, and then bounced again, so that’s 2 days in a row. This looks like it could be forming a double bottomed cup & now a small handle.” This was Friday and Gold was on day 15 of the 2nd daily cycle. So…
.
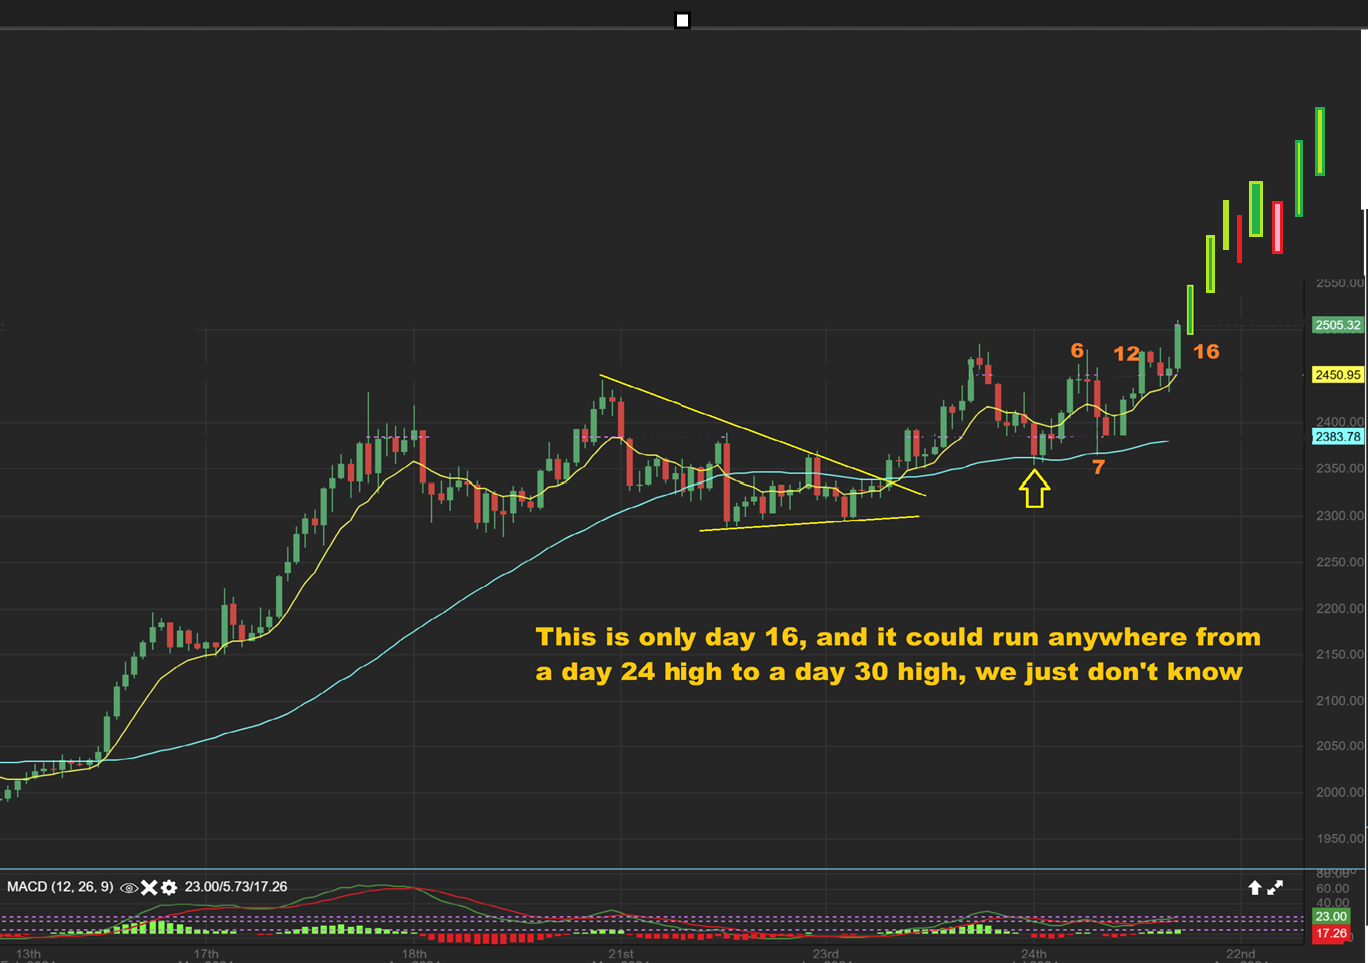
This was now GOLD on day 16, and I’d like to say that it broke out when it was ONLY DAY 16. Read what I wrote on the chart please.
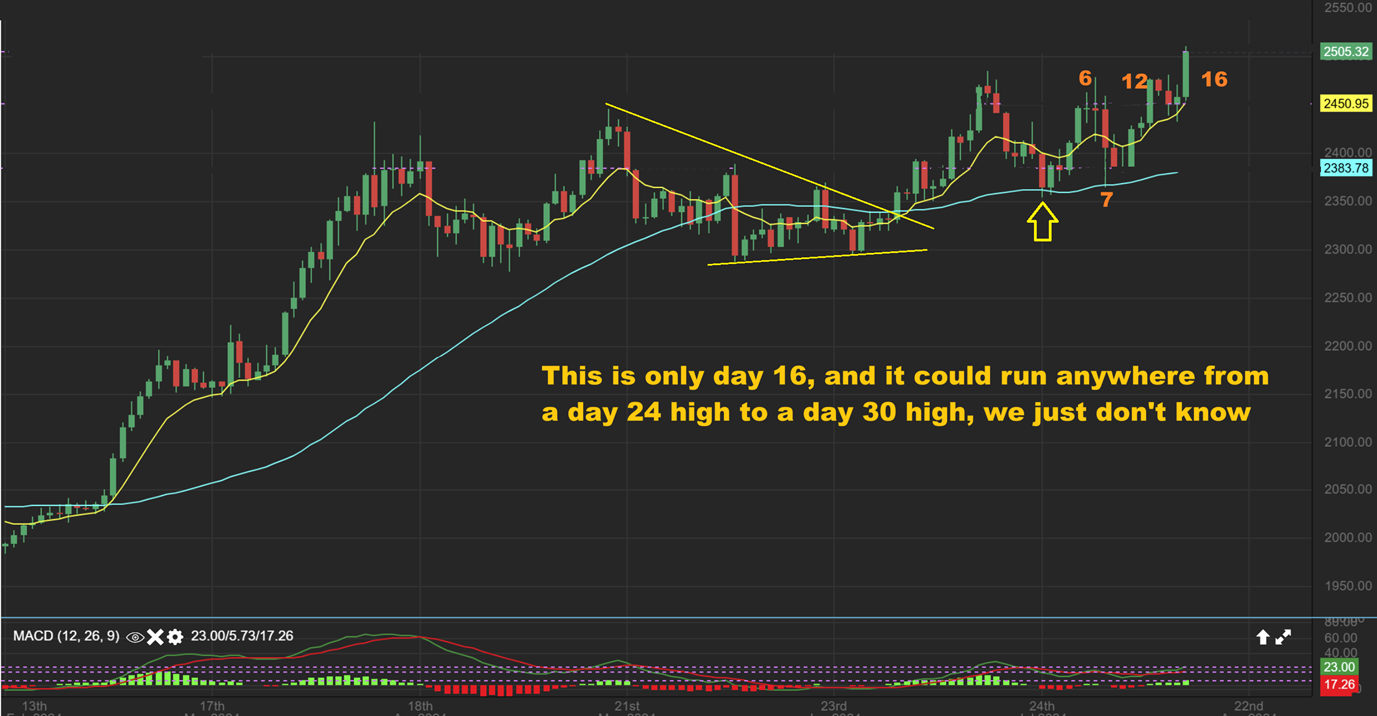
.
GOLD on day 16 could run a little parabolic if big money started to pile in on the successful breakout. I drew this as a day 23 high, and I may have made the candles slightly bigger than they should be, but you get the idea, right? Miners could be in for a very nice run if this breakout continues to push Gold higher. Gold is at $2500. Is a run to $3000 even possible? It could be, because this can ‘peak’ in the 3rd daily cycle!
Peak in the 3rd daily cycle? Yes. More good news!
.
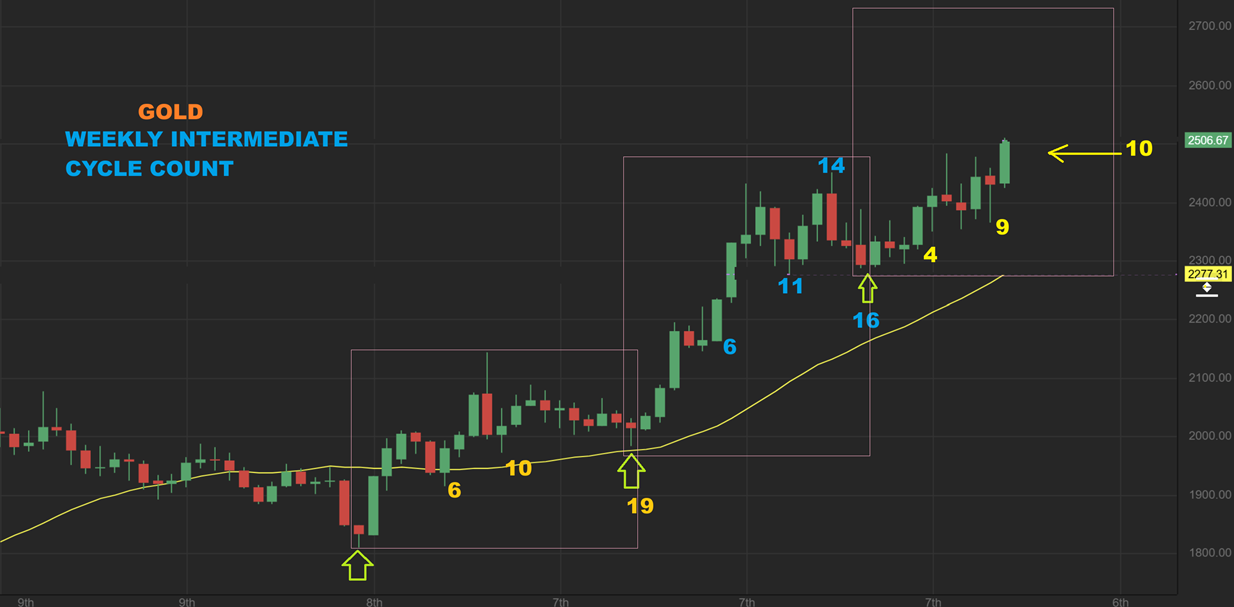
We are only on Week 10 of maybe 20. When we look at the weekly chart of GOLD, we know that Intermediate Cycles usually run about 6 months ICL to ICL on average, but they can be 5 or 7 months also. That 6 months would be an average of 20 weeks (sometimes 5 months, other times 7 months, so we can also consider 16-24 weeks). Now lets look at the current run just from Oct 2023 to now…
.
1. Gold put in a 19 week Intermediate Cycle out of the October ICL.
2. Next we saw a 16 week Intermediate Cycle with that early ICL, but it was also a steeper and stronger run.
3. And now we are on the 2nd daily cycle of the 3rd Intermediate Cycle, and it is only week 10. With a possible 10 weeks left, Gold could go higher for a couple more weeks, even go parabolic in the 3rd daily cycle. I’m not saying that it will, but we are breaking out and holding gains here on day 16 of the 2nd daily cycle.
.
SILVER WEEKLY – back tested the 30 week ma area and it also had a nice week, closing at the highs too. If Silver finally starts to run, the Silver stocks should join in, and they have definitely been lagging. In fact, we may be about to make some seriously good money with Silver stocks. I’ll discuss that later…
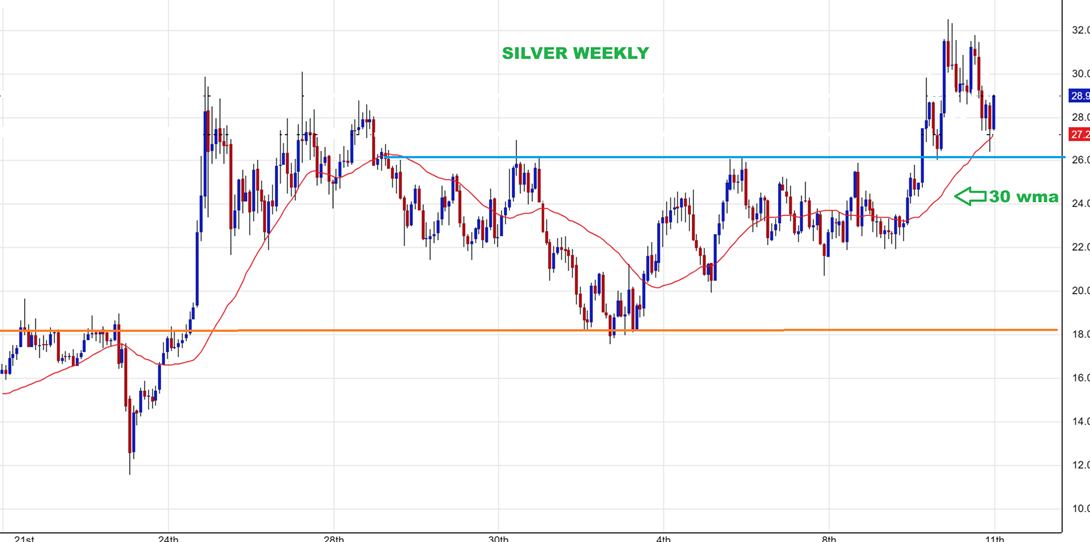
.
SILVER was due for an ICL, and I believe that we now have that in place. Silver looks great and is only on day 7. Silver lagged Gold, Silver stocks lagged Gold stocks. If Silver plays catch up, Silver stocks could make very big gains.
.
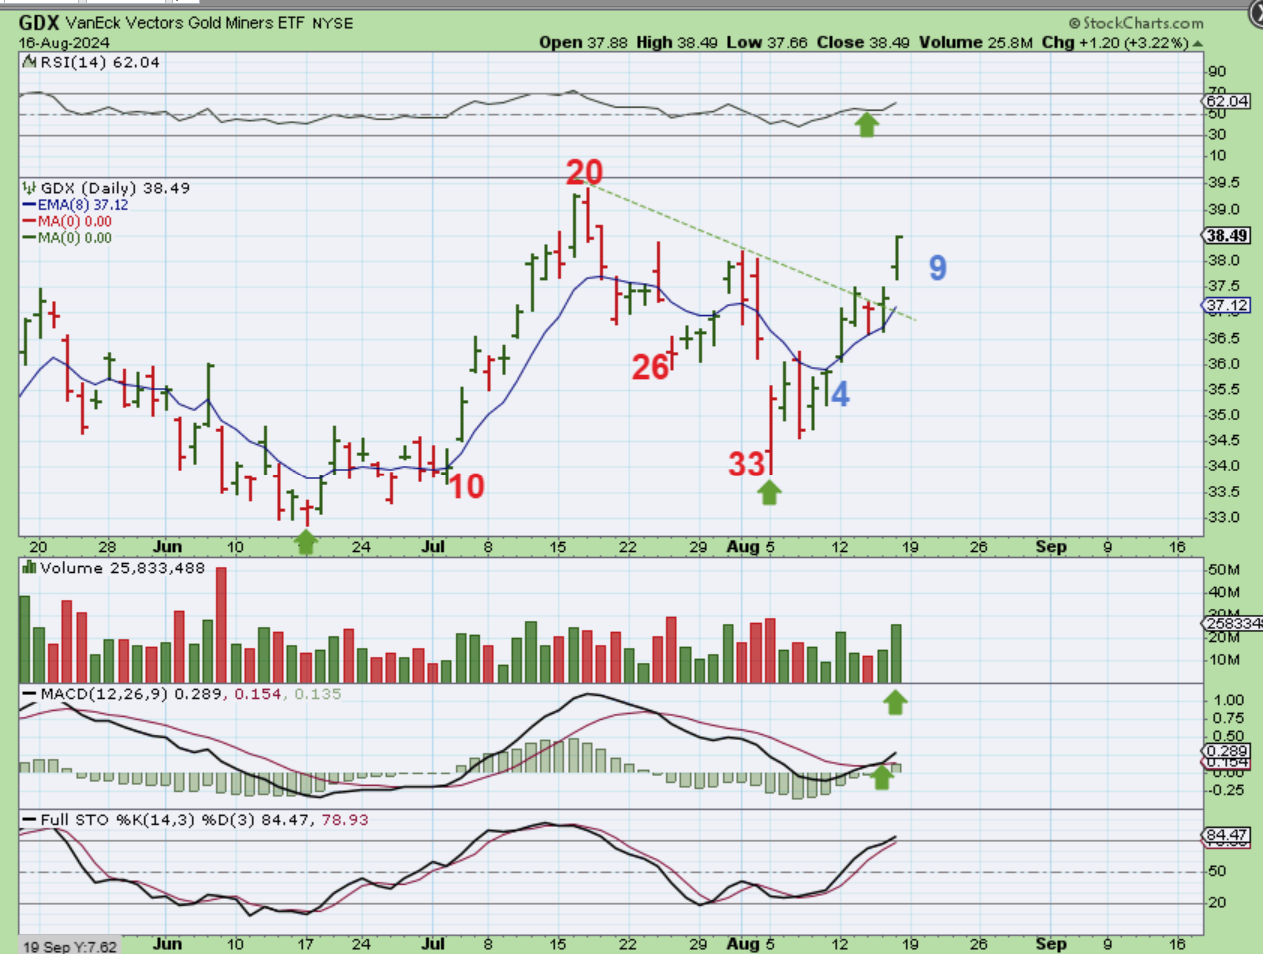
GDX gapped open, then it dropped to close that gap in the morning, and reversed and slowly climbed higher all-day-long! GDX closed at the highs, and this looks very promising too, since it is only on day 9. It was a little choppy at the lows into day 4, and then day 5,6,7,& * were sideways too above that 8 ema, but this break of the downtrend line is very promising. IF WE GET A DIP, it is a place to add or BUY.
.
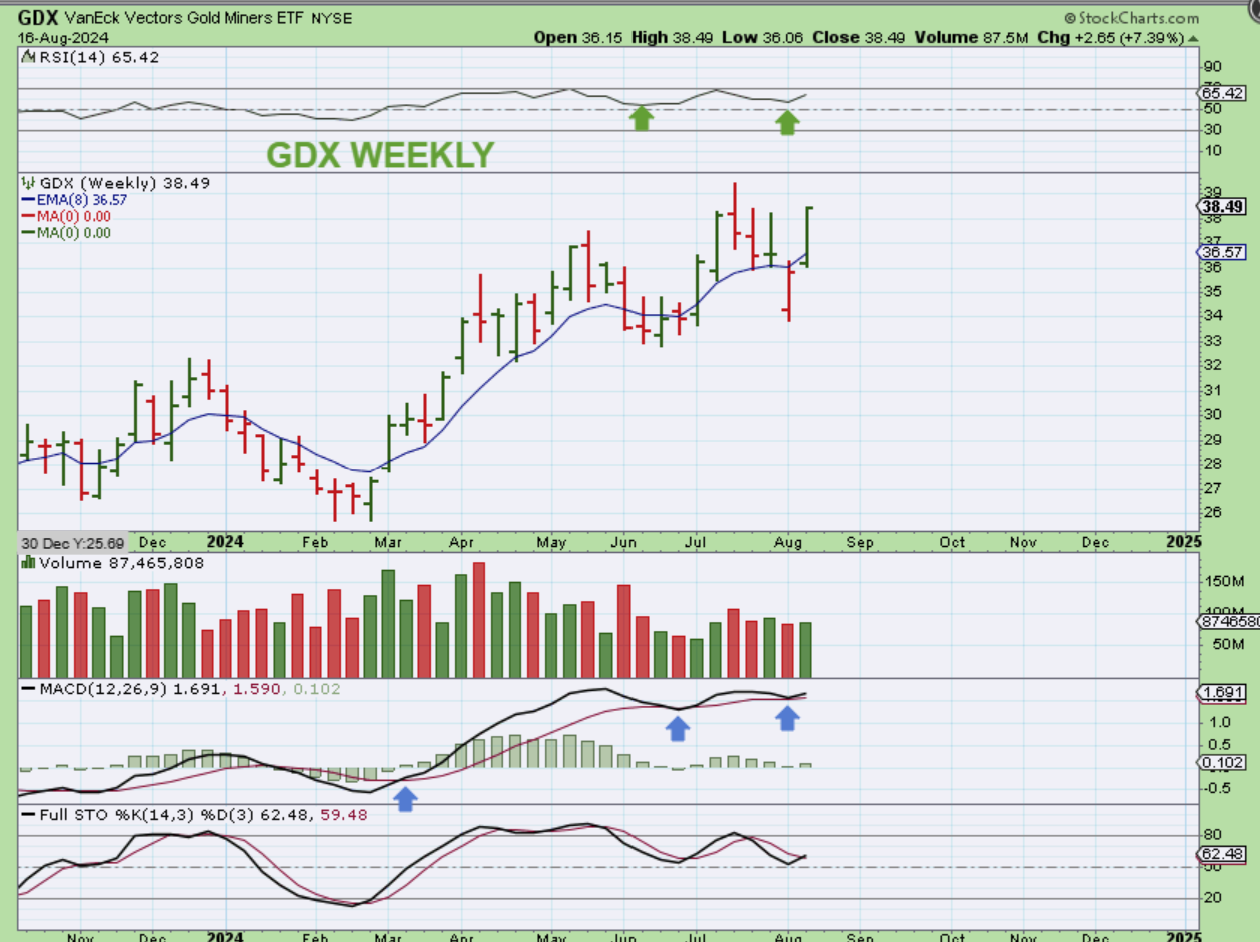
THE WEEKLY CHART OF GDX is actually very bullish looking after Thursday and Friday. As it dropped into the last dcl, it went deep, but you can see that it has pretty much recovered already in 2 weeks. The weekly MACD did a kiss on that drop, and now Price should break out and run to new 2024 highs here too.
.
LET’s DO A LESSON:
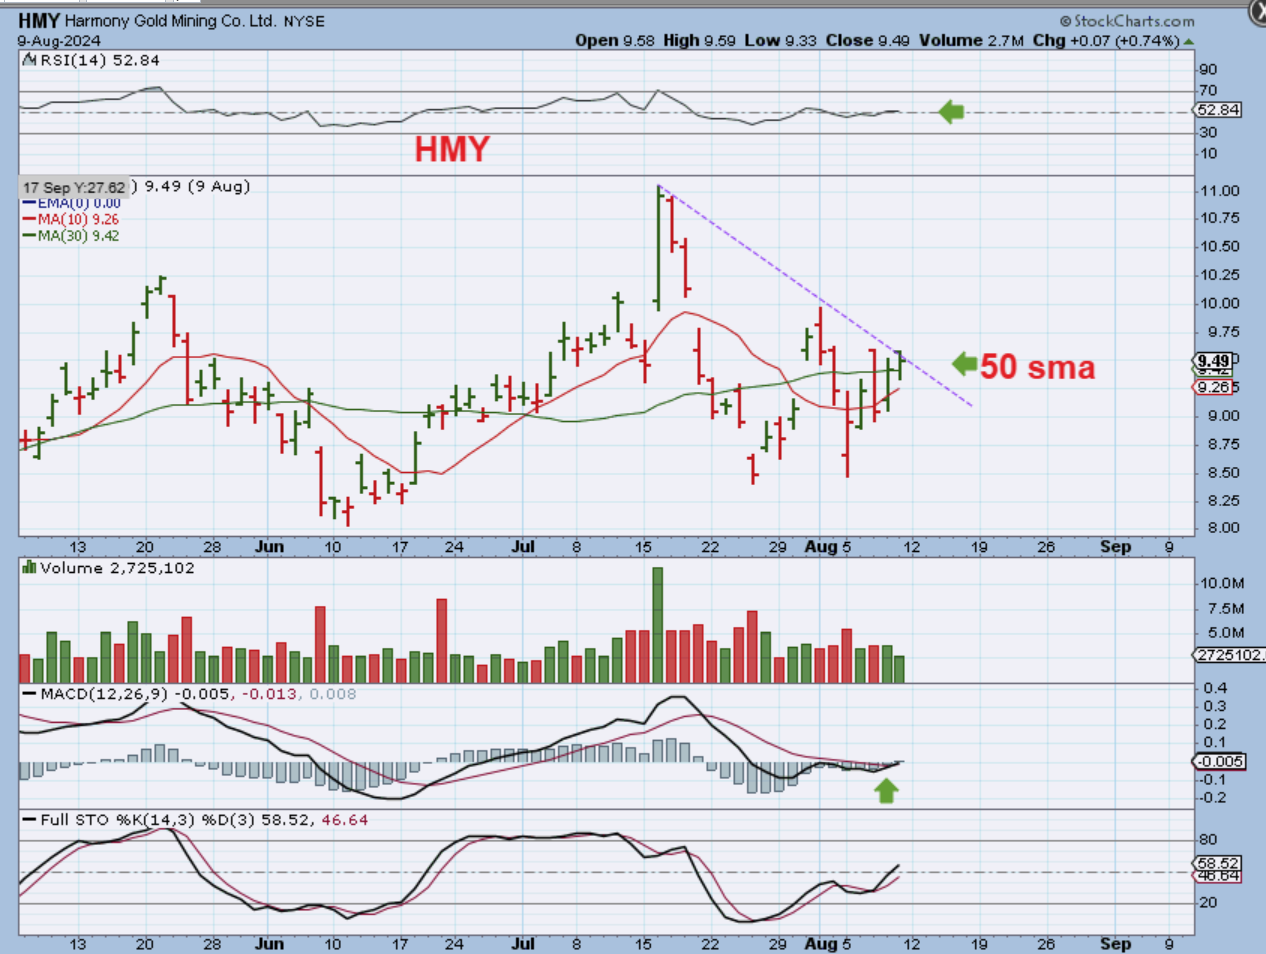
I have been putting some of my favorite Miners in the reports as ‘leaders’ over the past 2 weeks and as the week went on, several are now already up near the highs or at new highs, like BARRICK after earnings, EGO, AEM, AU, etc…and a few others. HMY lagged but it just caught up on Friday. They are starting to break out and can trend or run nicely. What about a good lagger? Are there any? Let me show you something about good laggers.
.
This was HMY on last Friday Aug 9th, and it was slow and choppy as it started to break the 30sma and downtrend line. The MACD was about to cross too. So that made this a bullish set up in the 2nd daily cycle and a buy, but it sure didn’t look like much, right?
.
HMY – Day after day it made only small moves higher. I owned it and some of these days were only 1% gains, again, that doesn’t seem like much, but Friday it stretched to 5% gain. Slow and steady wins the race sometimes. Well…
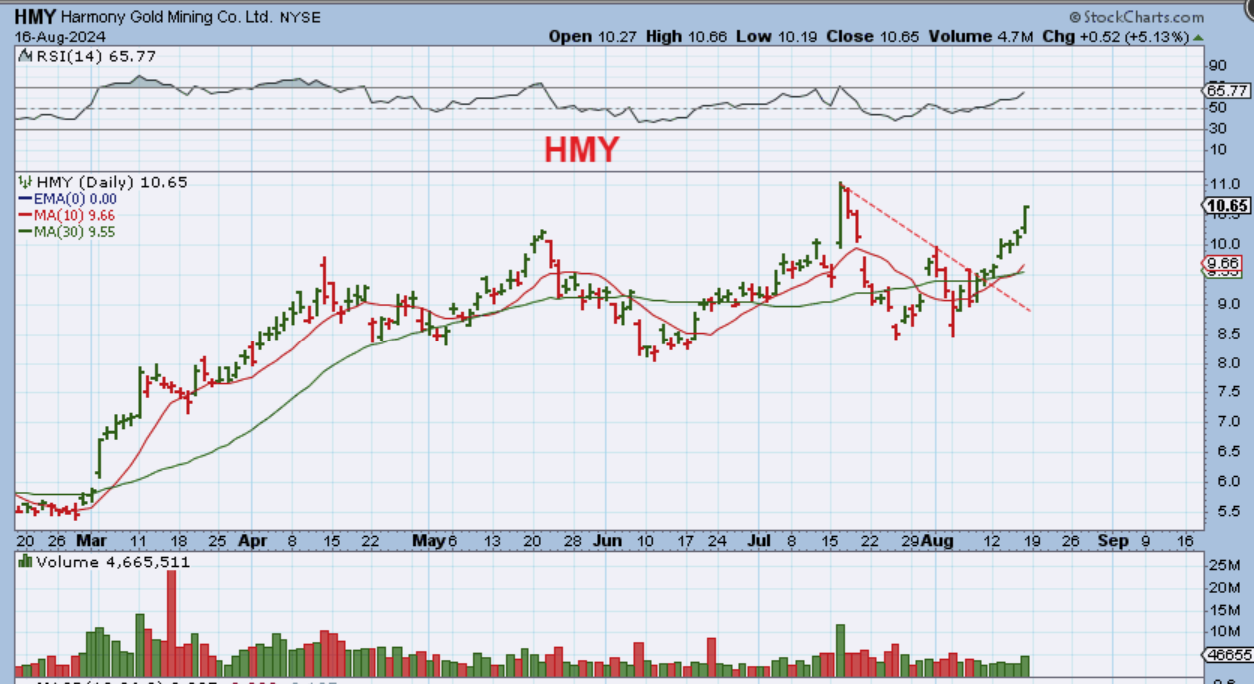
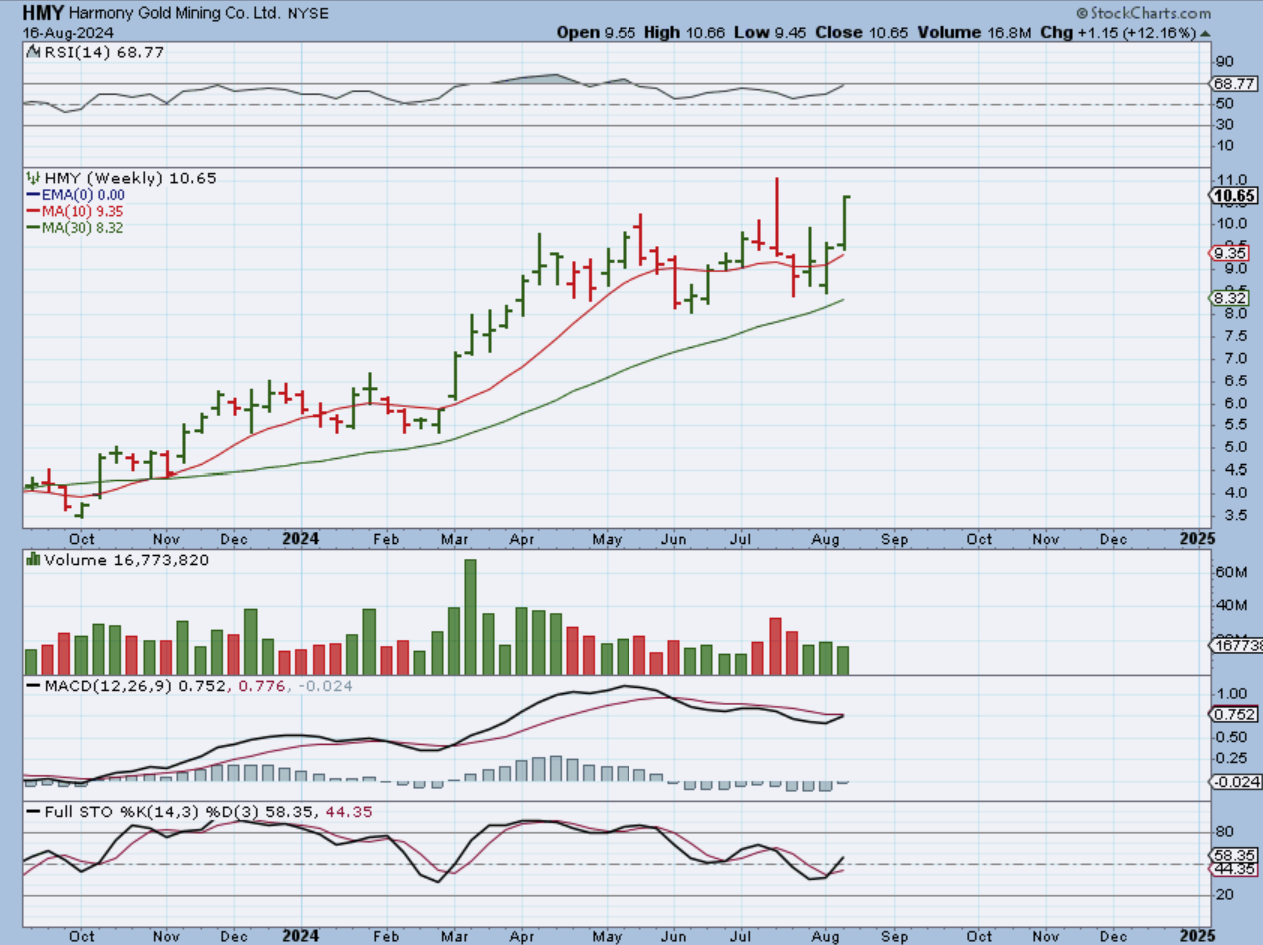
Now take a look at the Weekly Chart of HMY. It was up a total of 12% this week alone and its up near the highs now. Do you think this will run as Gold moves higher? The stochastics is NOT overbought so it should continue to run. This is a 4 month consolidation that has built up energy.
.
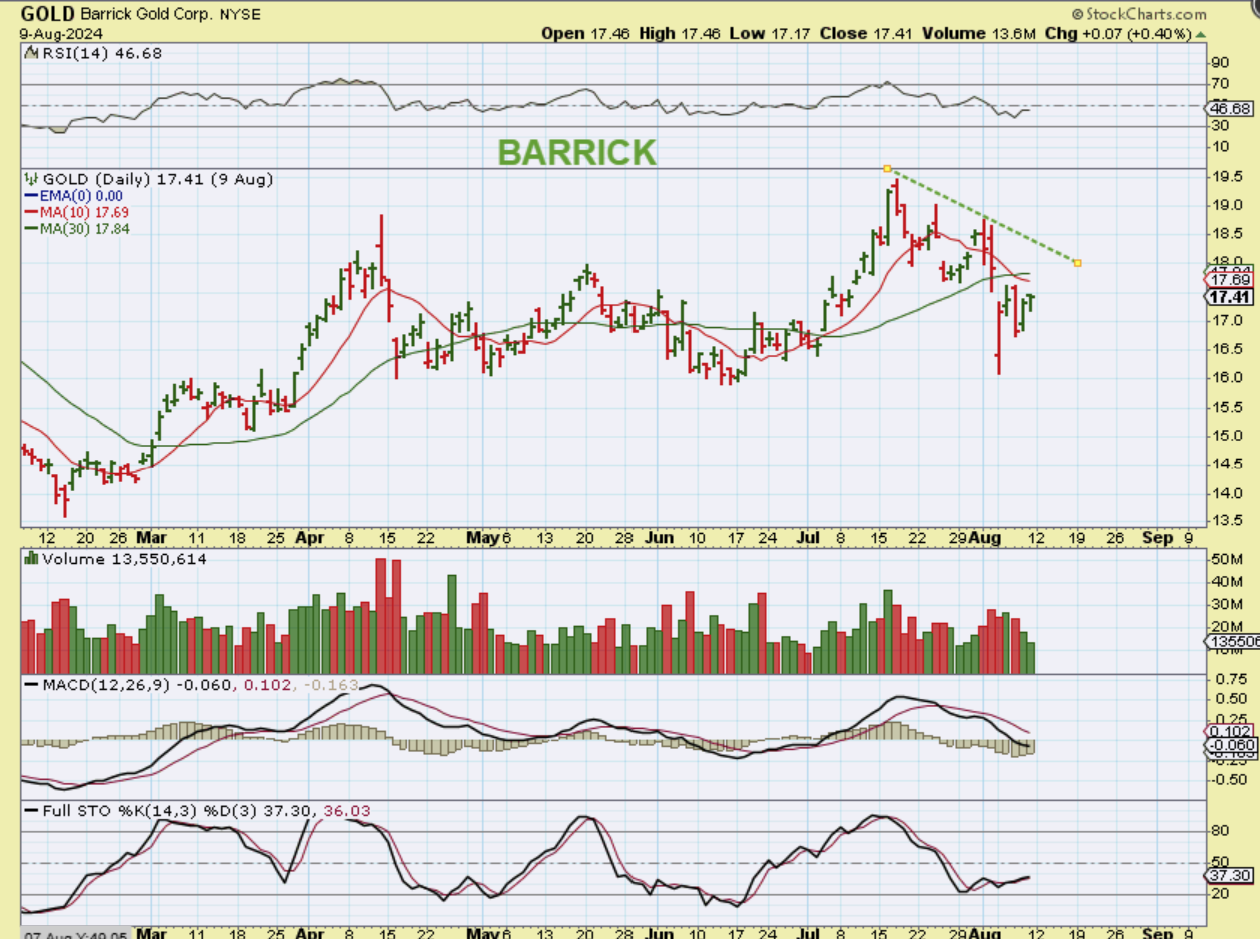
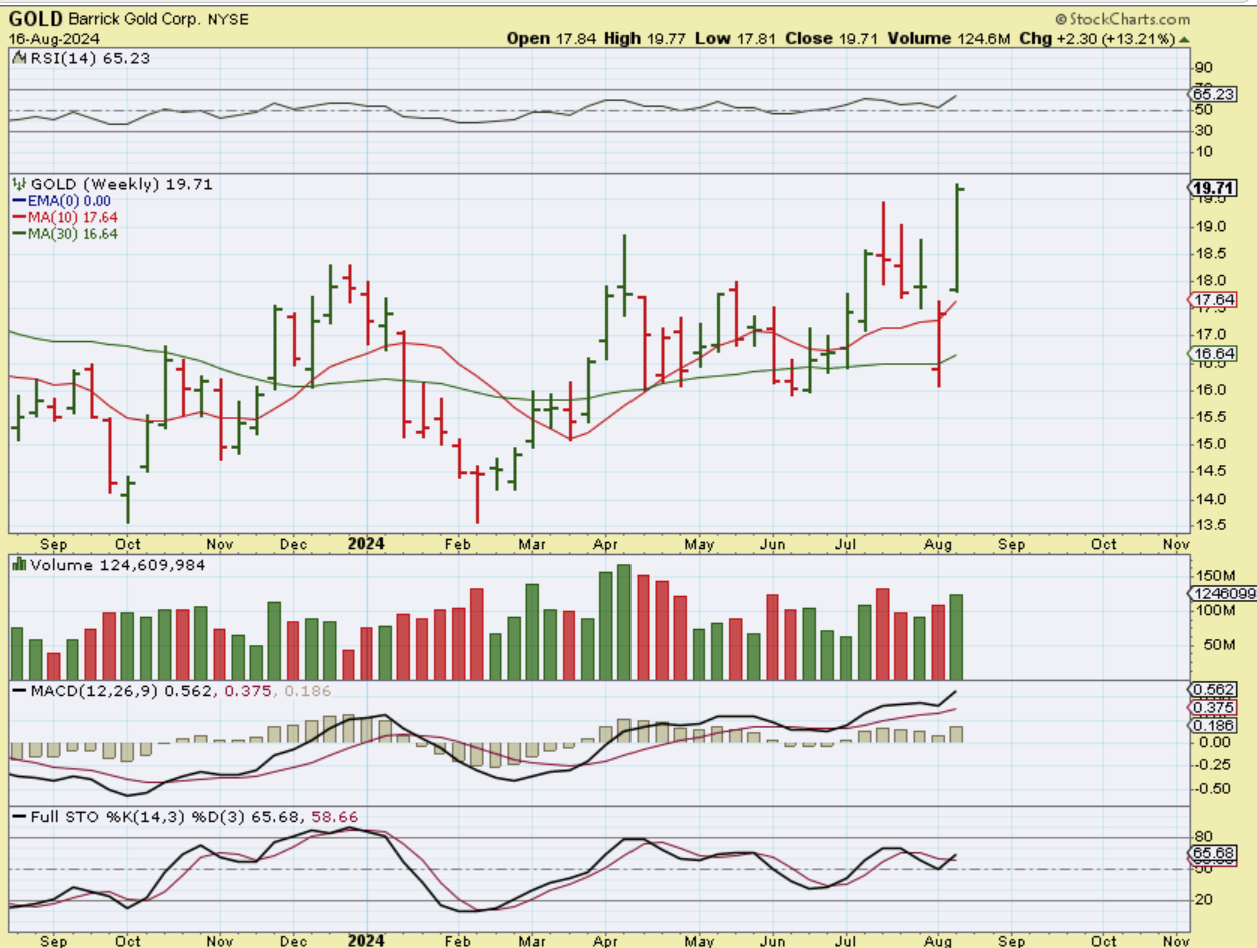
GOLD (Barrick) was a lagger last Friday too, and this was certainly not very eye-catching. It was 4 days of sideways chop down at the lows.
.
BARRICK One week later and this is the weekly chart. Barrick is breaking to new highs. IAG is also breaking to new highs. AU is at new highs. AEM is at new highs. They all lagged a week ago, but they can run out of these long consolidations for a while. So what might be a good lagger now? I look at the former runners…
.
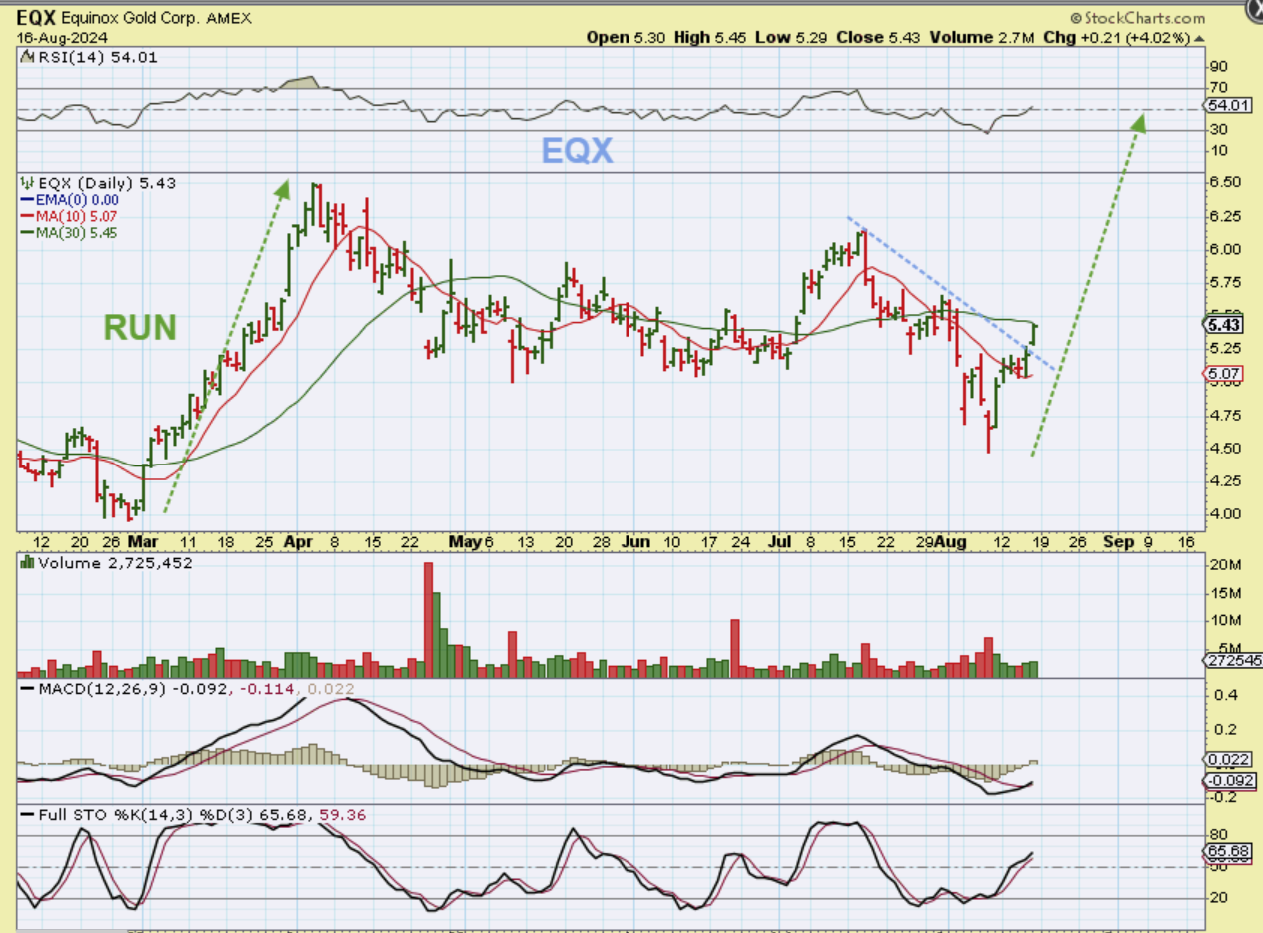
What might be a good lagger? EQX is lagging right now.
.
EQX already released earnings, broke the downtrend, is at the 30sma, and it had a nice run to new highs in the past. This is a good buy to me, it looks just like the others did.
.
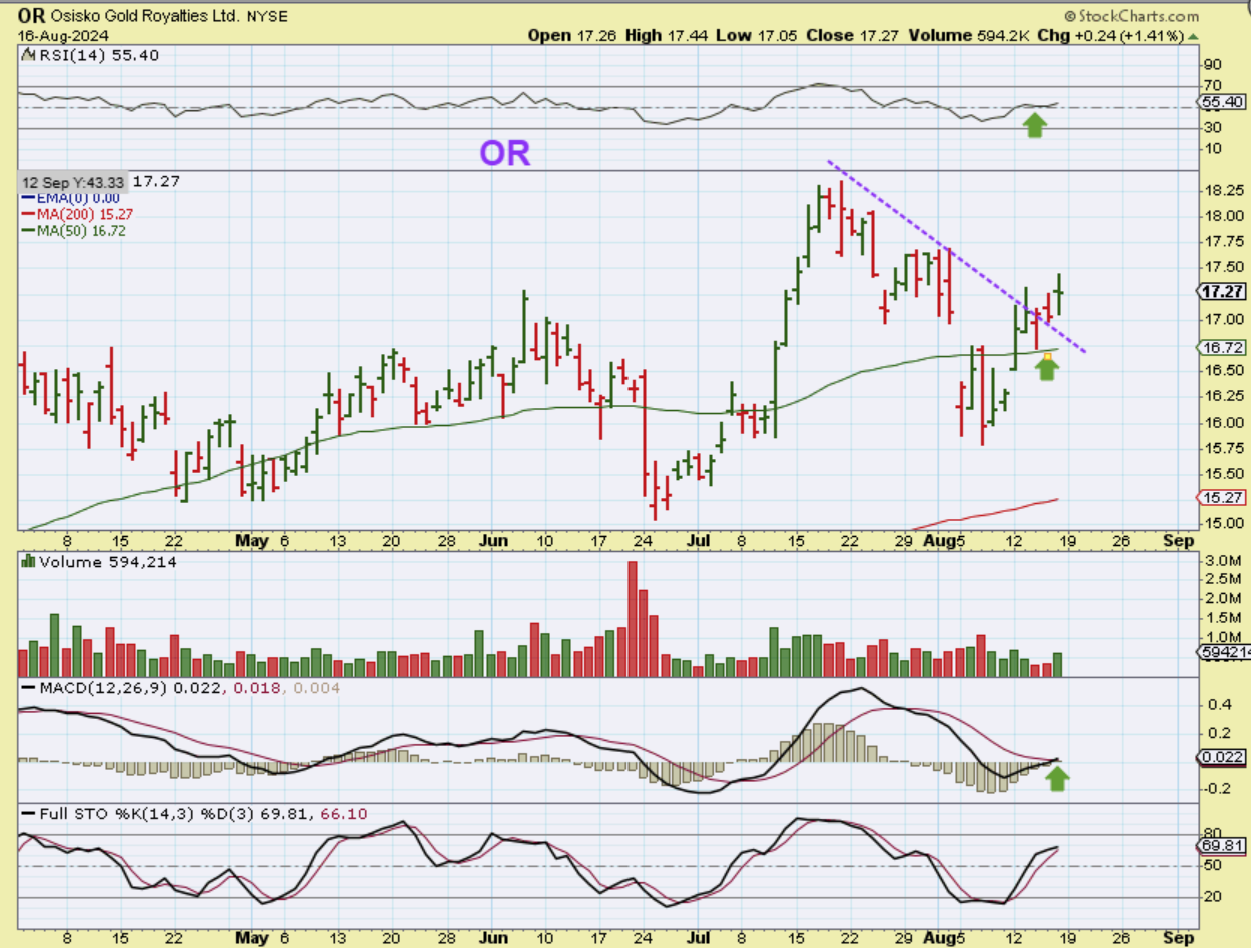
OR is a good looking lagger and they already released earnings too (& NG, SA, SAND, RGLD, NEM, etc) and don’t forget that if Silver stocks play catch up, we have some great laggers there like HL, CDE, MAG, AG, etc etc. I’ll cover those in the weekday reports as they start to pick up the pace. THEY can make 7-10% gains on a good day.
.
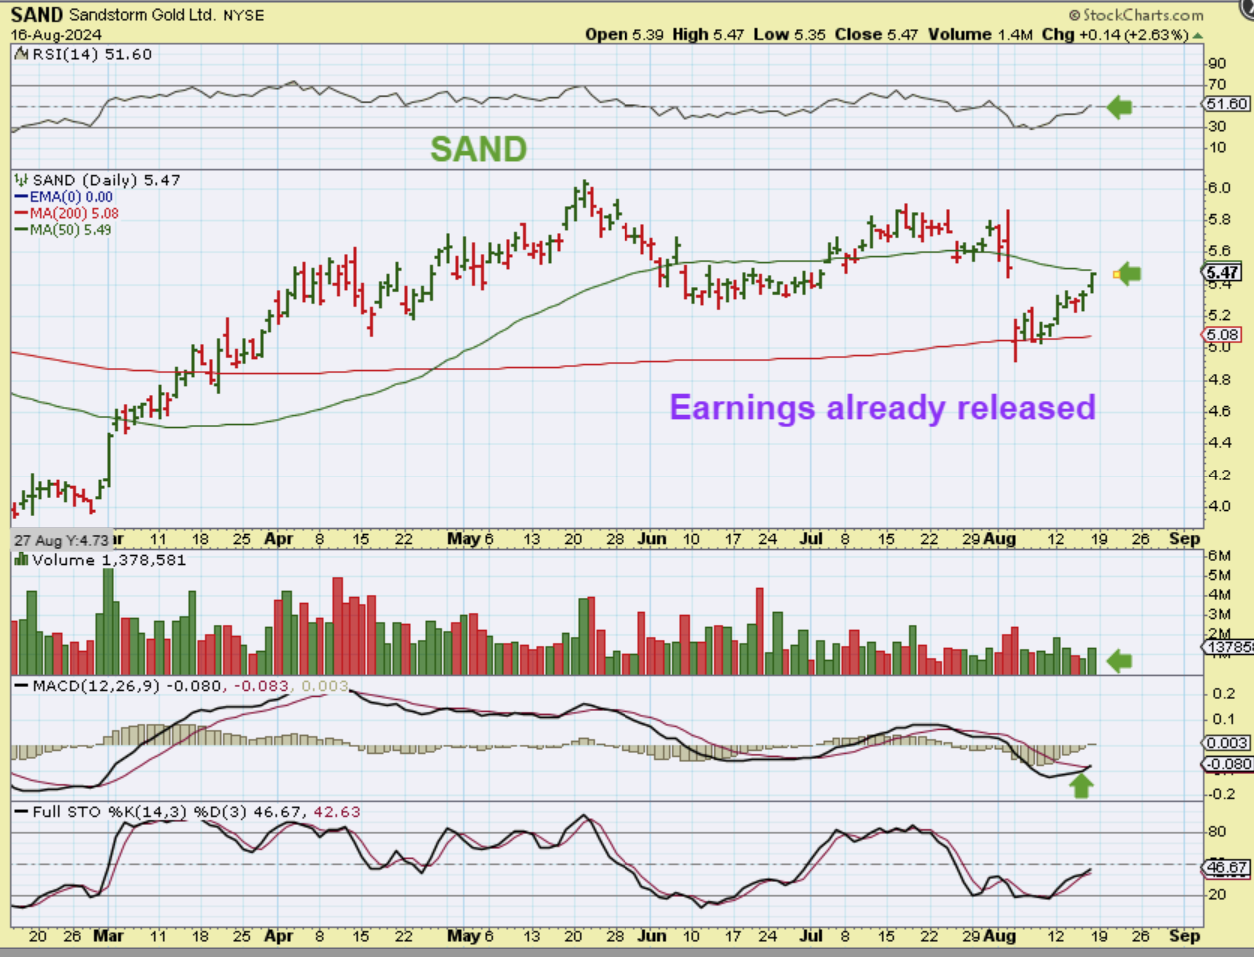
SAND is starting to run out of the crash down lows after a shake out at the 200sma. Earnings came out over 2 weeks ago.
.
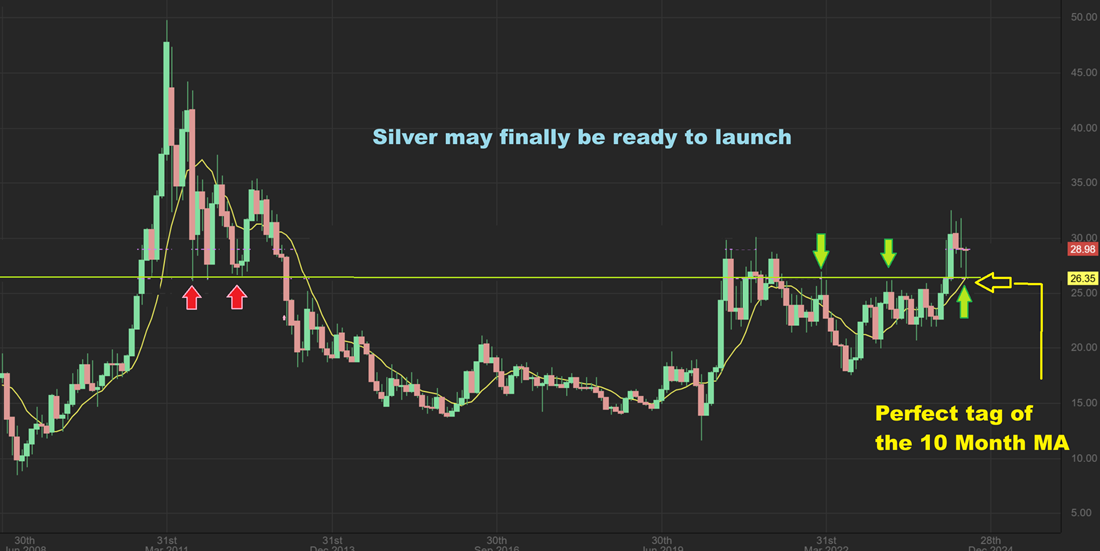
BACK TO SILVER I wanted to grab the Monthly chart even though this is only the 17th, because that Silver drop into an ICL bounced right off of the 10 Monthly MA & support. It already has a nice monthly reversal candle and if it starts running from here, it could really get up and go. Silver stocks like AG, MAG, HL, FSM, EXK, etc should make very big gains if this gets going, so let’s hope that we get a rocket launch out of this ICL, as Silver tries to catch up to Gold.
.
I’m looking forward to next week with the Precious Metals set up and seeing it close at the highs on Friday. Gold closed at all-time highs. The Fed Minutes come out Wednesday and if they talked about a rate cut and cooling inflation, that could help to cause Silver to ramp up quickly and also we could see these Miners just continue higher.
.
Enjoy your weekend, and thanks for being here with me at Chartfreak!
.
~ALEX
.
FROM FRIDAY BITCOIN 6:30 a.m. ET:
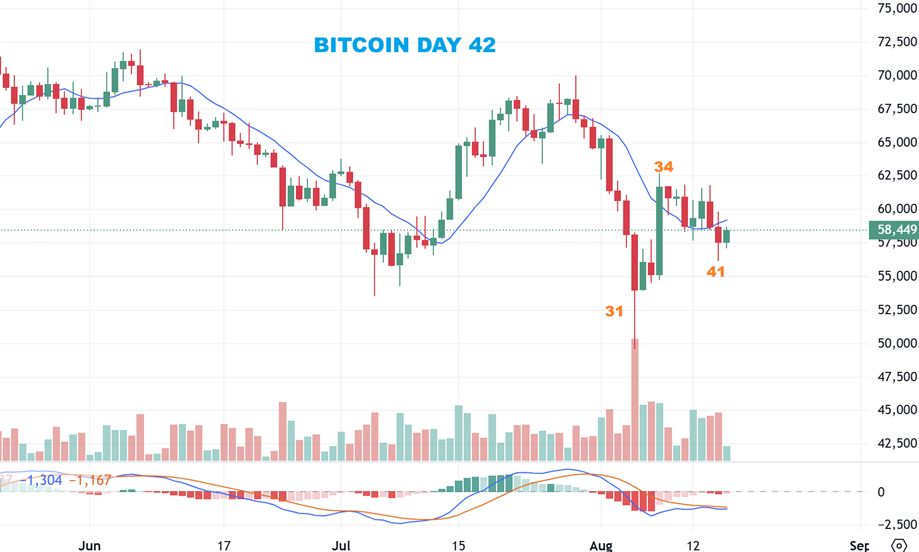
Bitcoin dropped lower on day 41 and then put in a reversal. We are now on day 42 today and slowly running out of time, but this could make a run higher and then drop into a higher day 60 dcl. THAT might lead to a good buy, but until this rallies there is also the risk of a new lower low on day 60(ish). Bitcoin got caught up in the General Market crash and broke to new lows, but it did NOT follow the General Market rally.
.
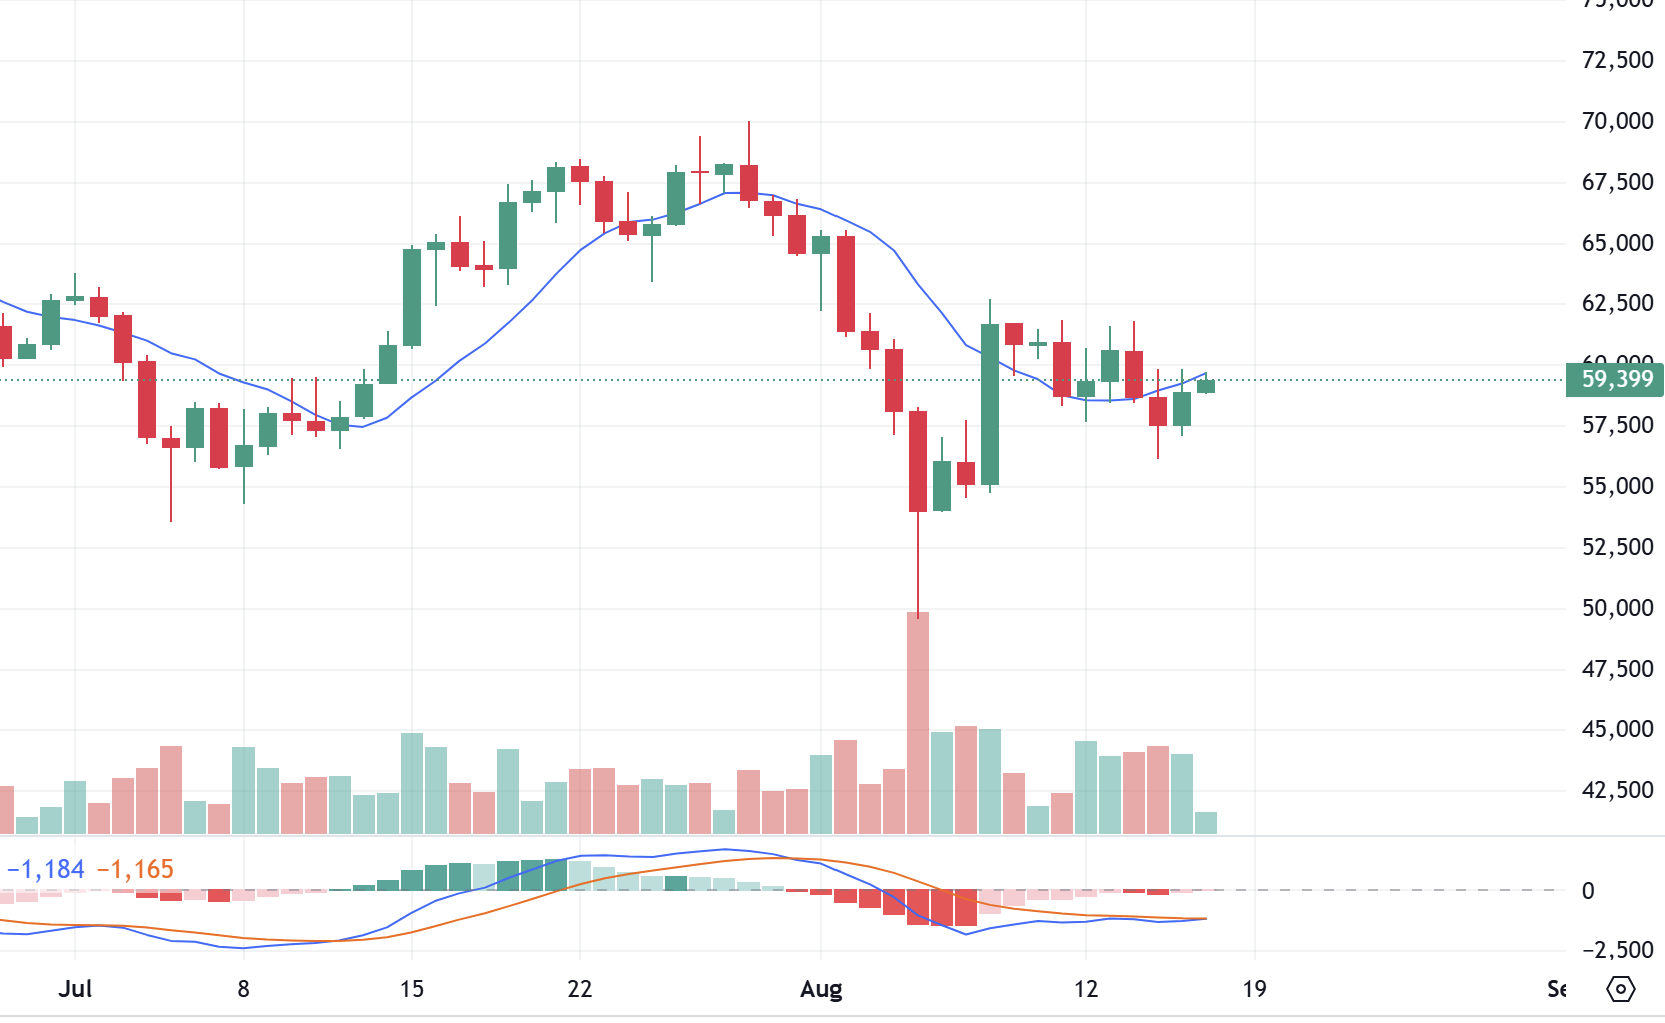
Bitcoin day 43- I like the way it looks and it does have time to push higher. I know that the crypto stocks have been choppy and at times only a ‘1 day wonder’, but a couple of them did start to look like they’re acting correctly again, and that was when Bitcoin was doing nothing (Friday). So I will continue to watch this sector for signs.
.
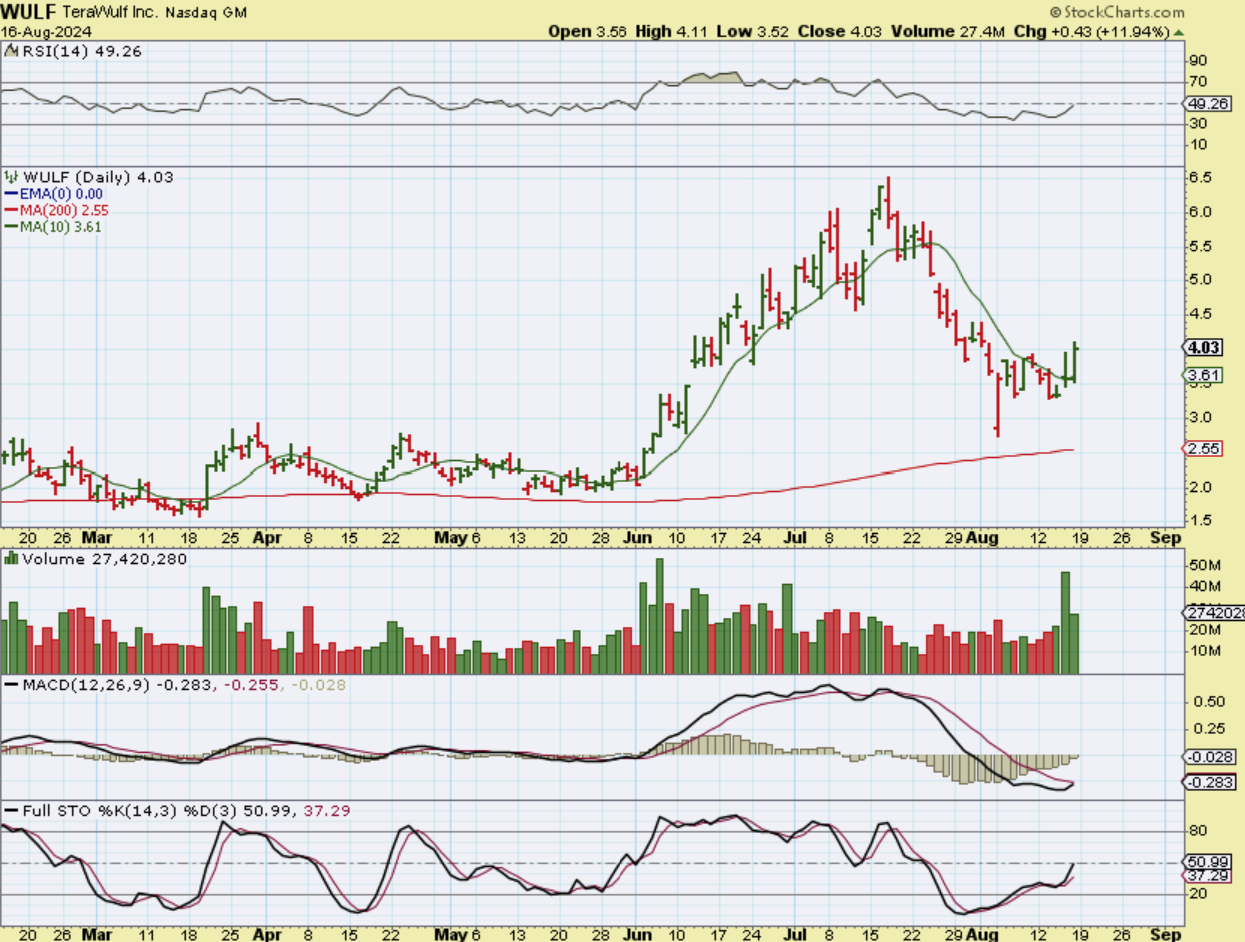
WULF is obviously starting to act correctly, since Bitcoin really didn’t do very much on Friday. It was up 12% and broke above the 10sma. Also…
.
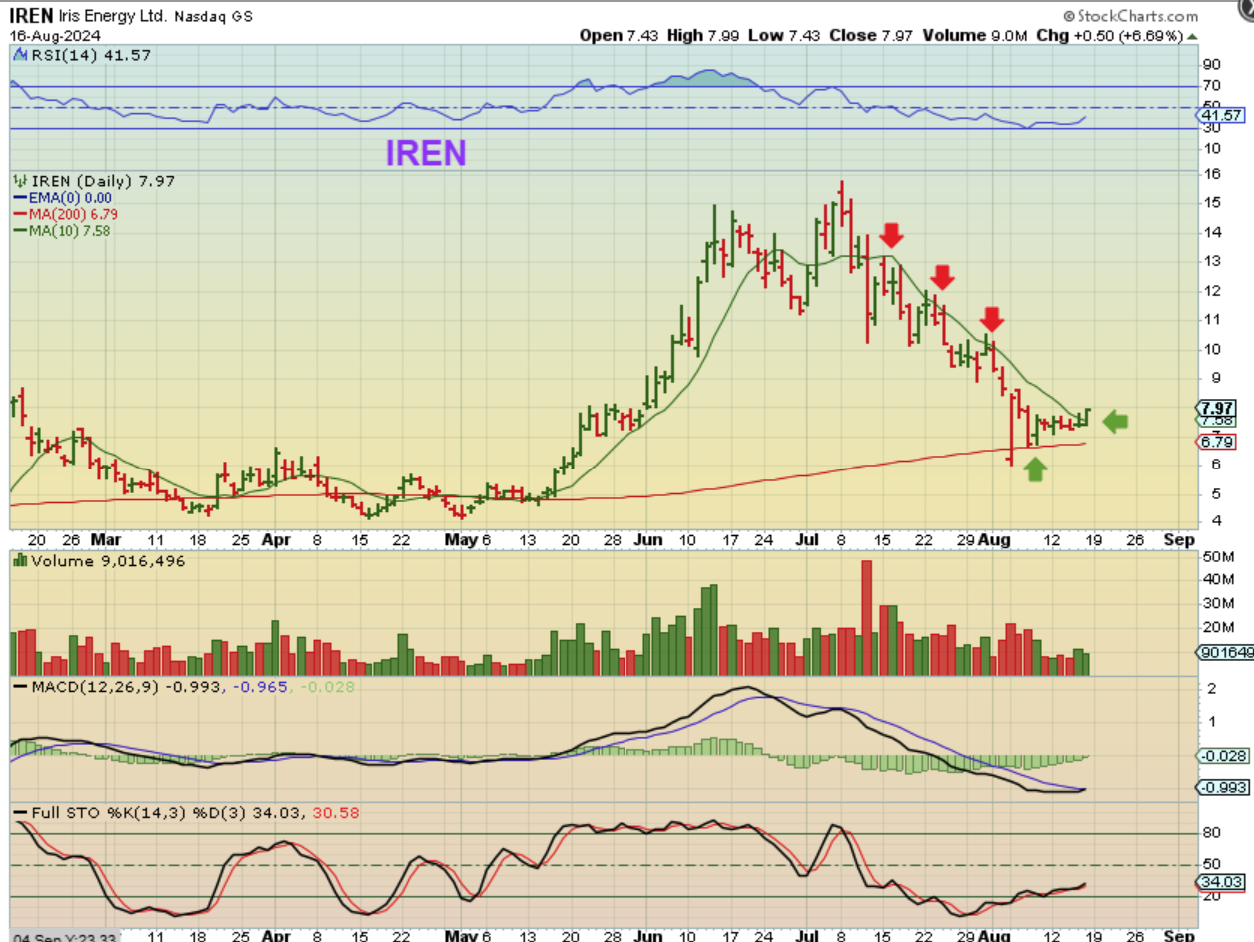
IREN is breaking above the 10sma, and this was on Friday when Bitcoin didn’t do very much too. On intraday charts I saw MARA, CLSK, and RIOT start to rally too, so these are worth watching. In fact…
.
In fact, if IREN simply returns to the highs after tagging the 200sma, that would be over 100% move off of the lows, and so would WULFS $3 to above $6.50 move. Stay Tuned! You can miss 30% of the move off of the lows and still grab the other 70%, and these run very quickly!

