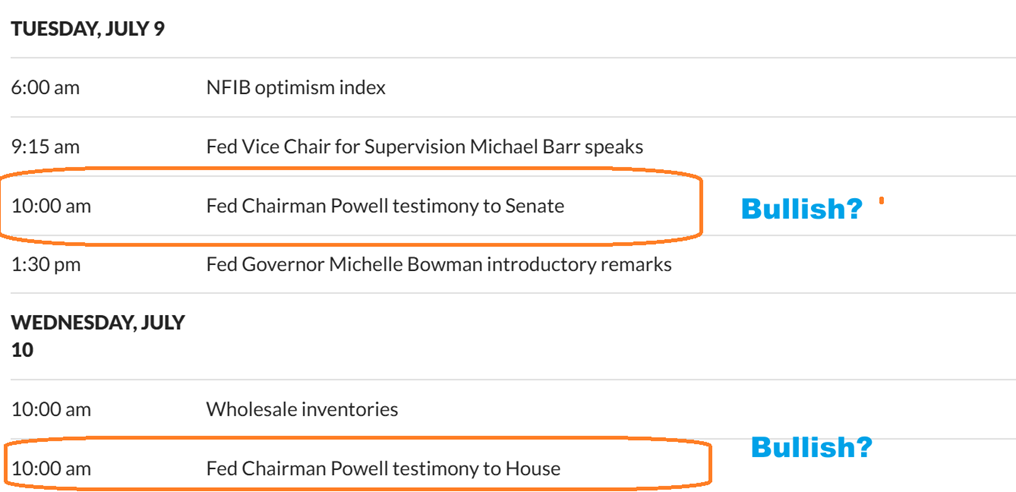
Tuesday July 9th – Bull Runs
DATA – I actually think that this economic data should be bullish, because Chairman Powell is likely going to testify something positive, like “Inflation is coming down, the economy has not been adversely affected, The job market is in check, though it will need monitoring.” Then he may not come right out and say this, but he could hint that rates could be cut later this year to prevent inflation from diving below their 2% goal. That is all bullish talk if you ask me.
.
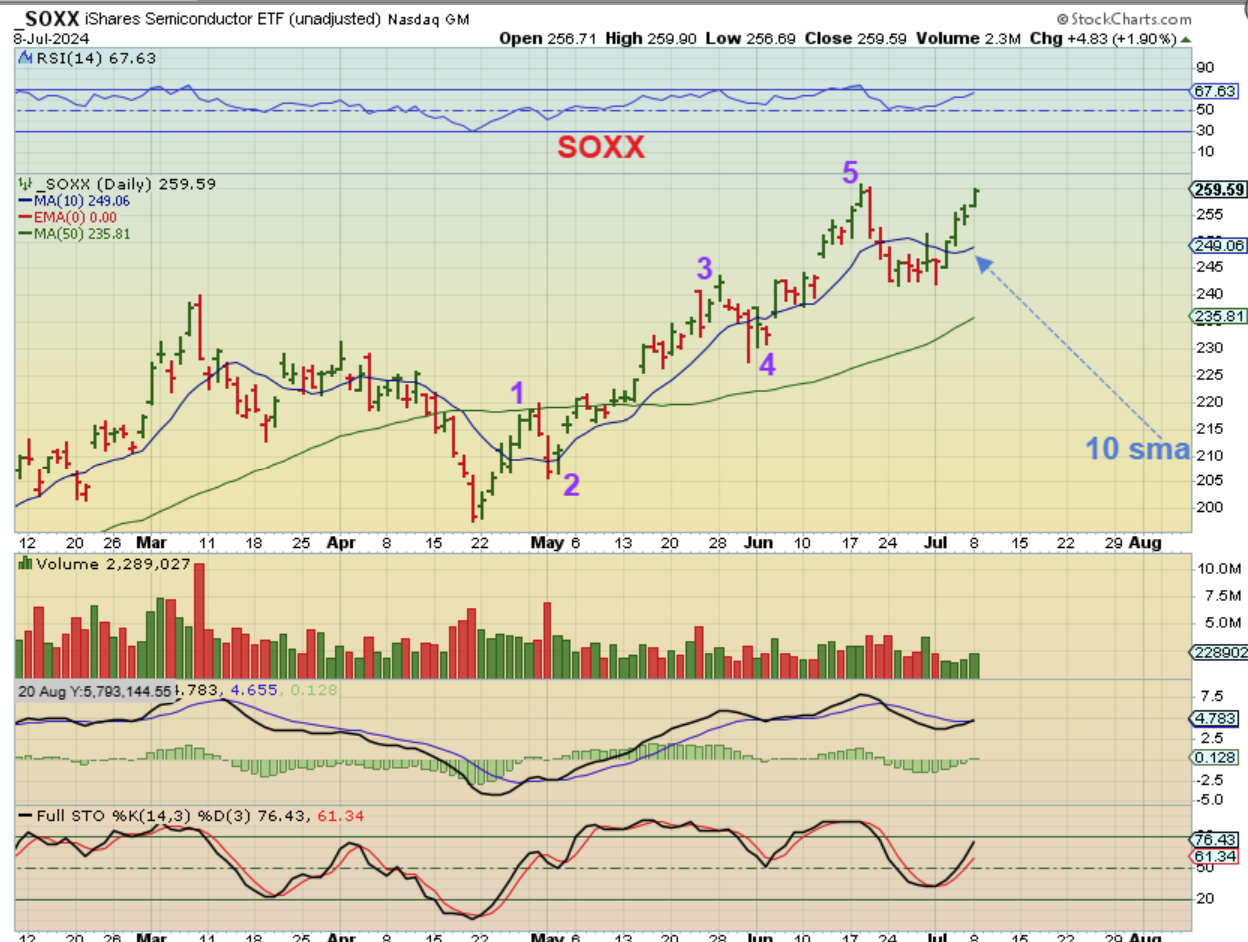
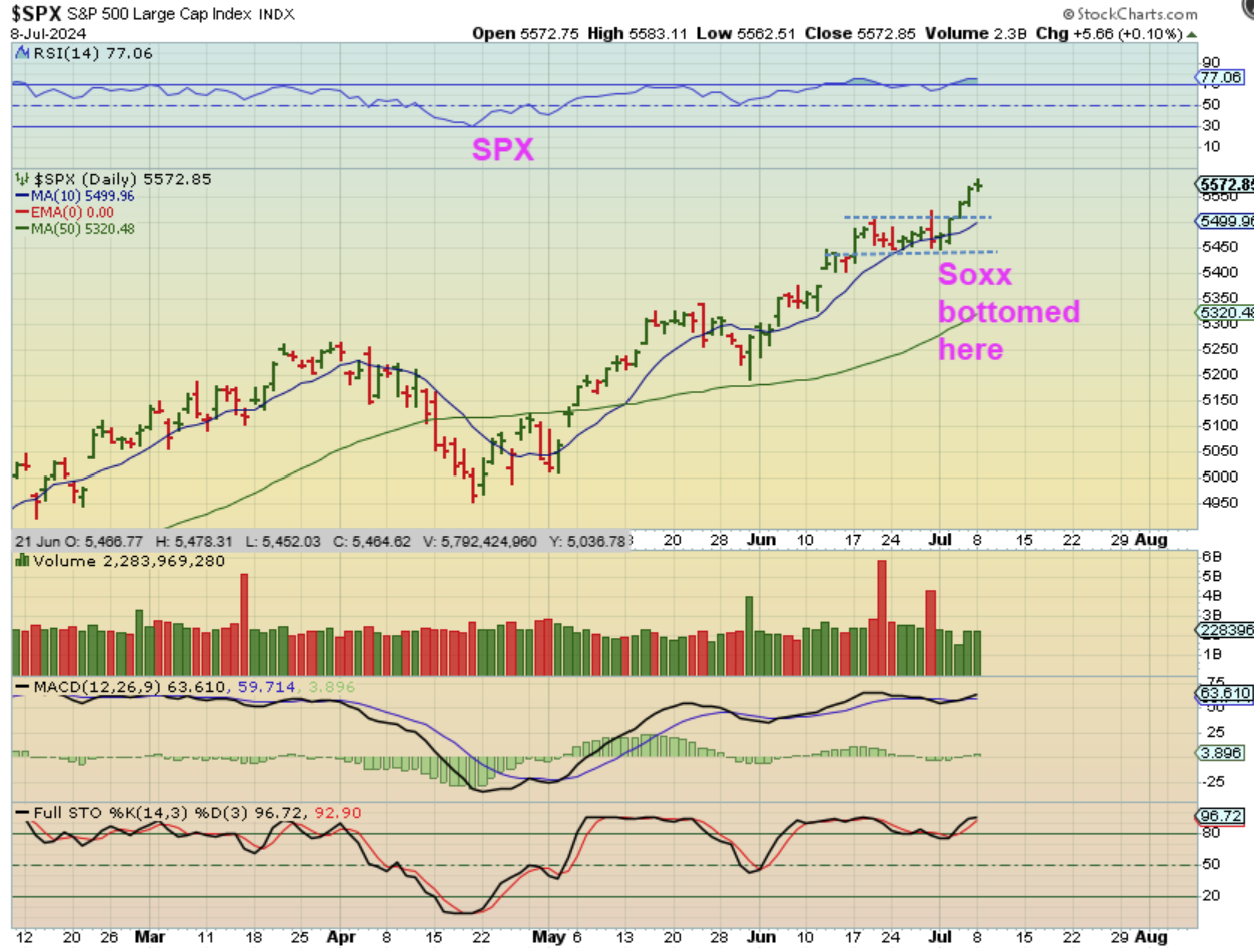
I pointed out that with the SPX it is hard to see a dcl, since it was more of a flat sideways chop. When you look at the semiconductor pullback however (SOXX), it looks like a clear 5 waves up and a dip into a dcl. The 10sma did curl downward and is now curling back up. This looks to be day 8.
.
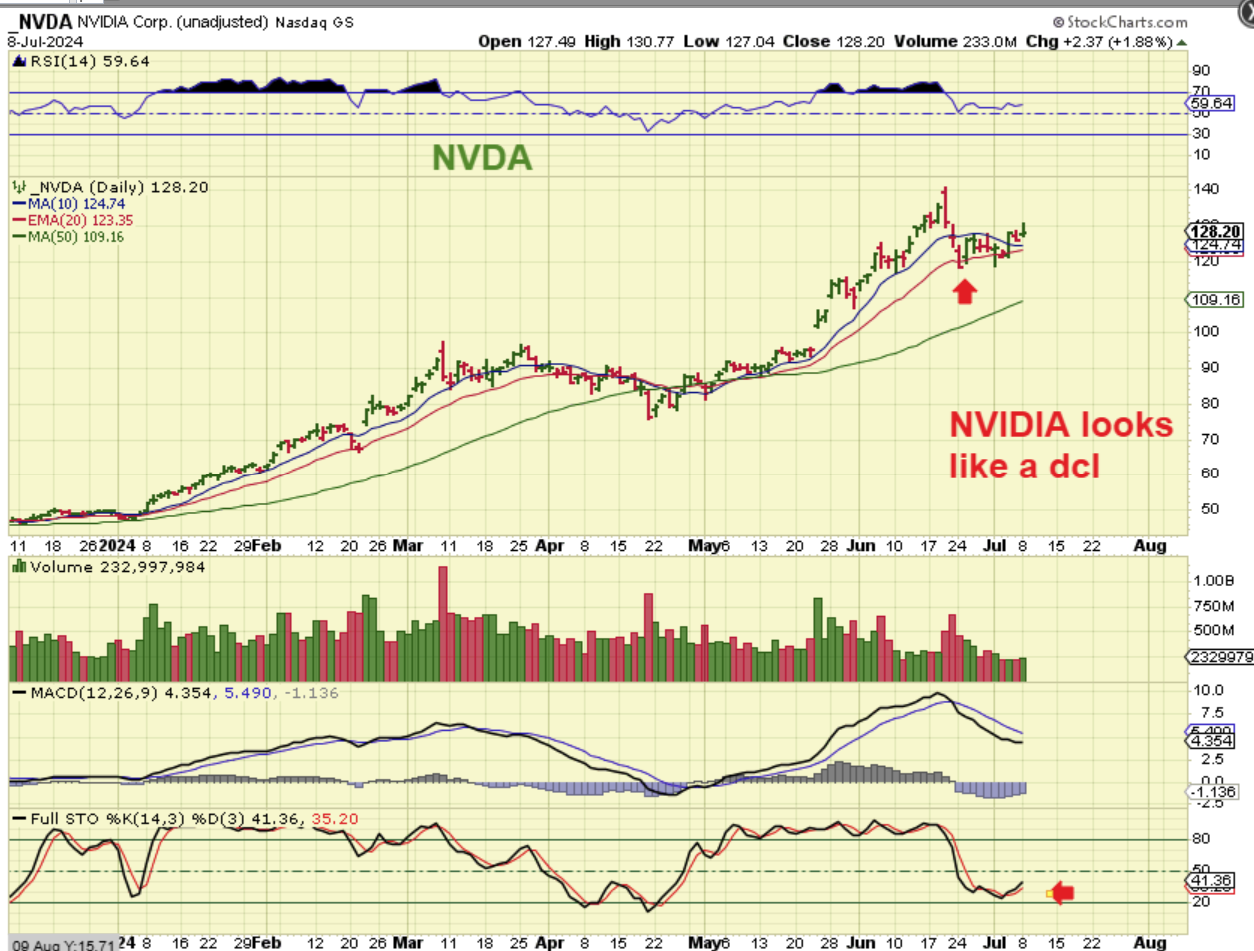
NVDA shows the same drop, and NVDA has been very bullish, so the SOXX and General Markets remain bullish. In fact, NVDA looks like a buy here.
.
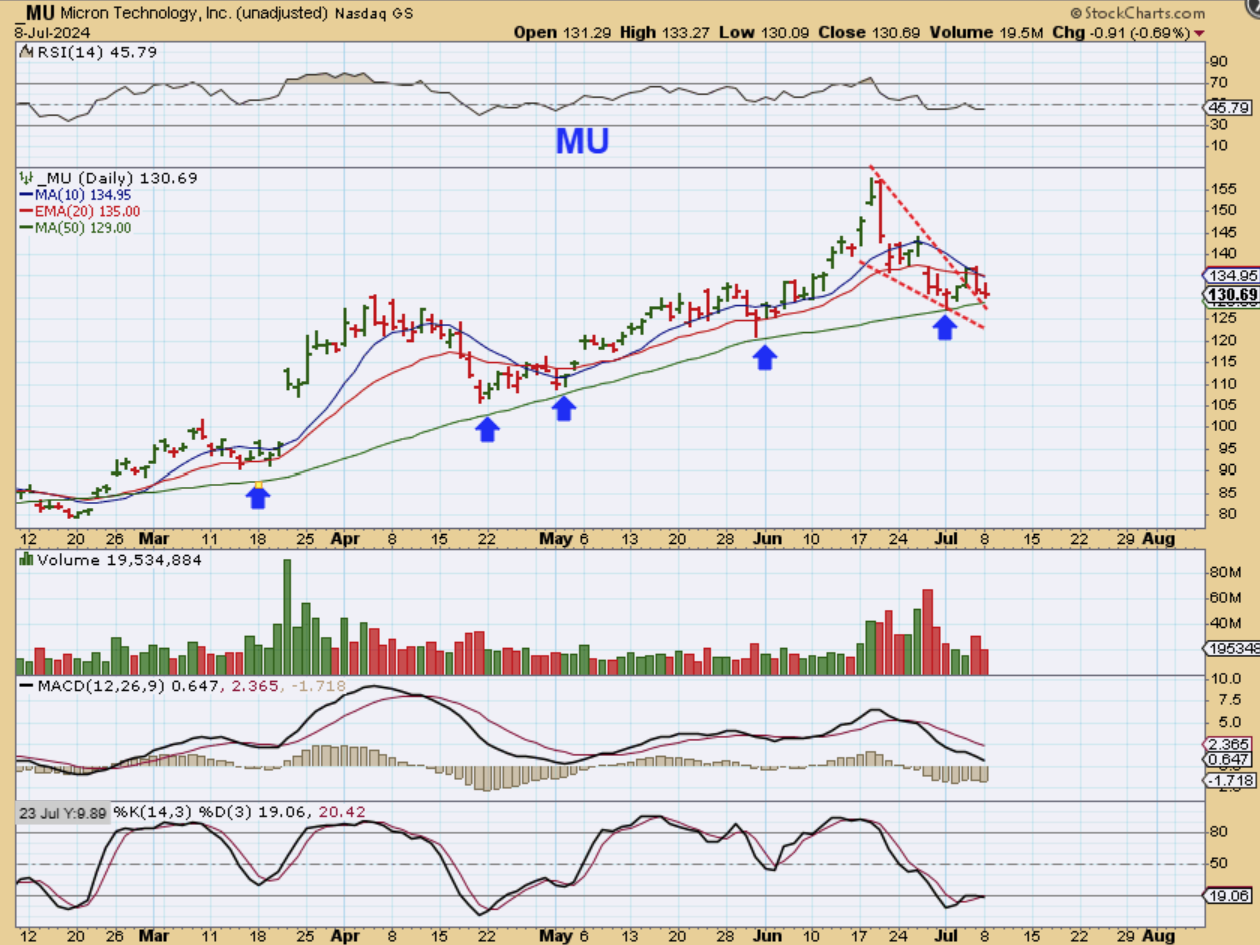
MU is a semiconductor company and it also had a much deeper drop and has now landed on the 50sma after a strong ramp up in mid-June. MU could be a buy here, but it may chop along the 50sma before it gets running again (see the Month of May, for example).
.
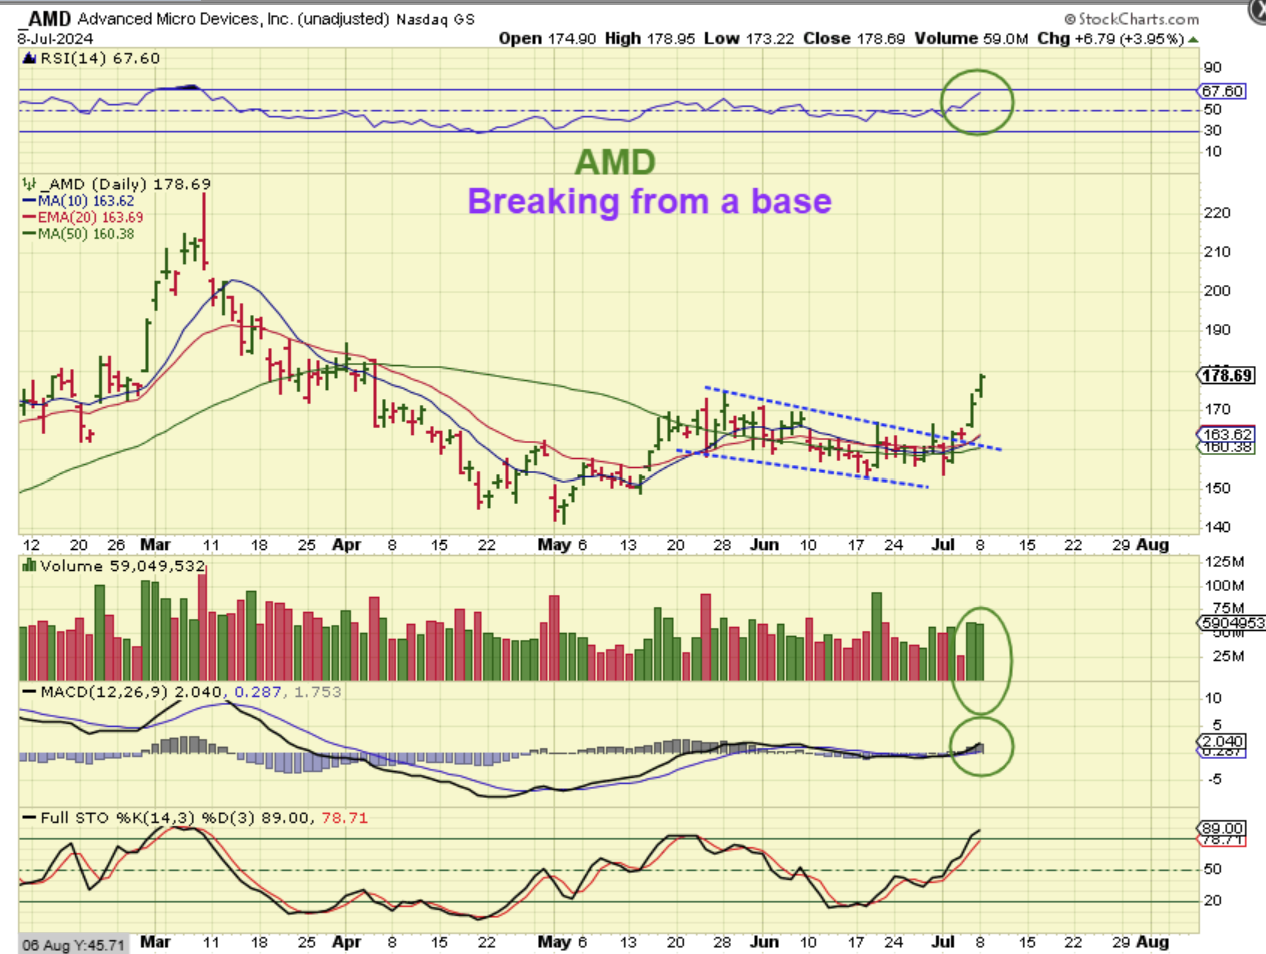
AMD put in a downward sloping base and is breaking out after that dcl. If I wanted to buy AMD, I’d start small and add on dips, since this may be a tad extended & could dip on any given day (that also goes for TSM and TSEM too) .
.
So now we get to THE SPX and the dcl is mute. We saw the SPX & NASDAQ churn sideways instead of dip, and that is a ‘Bullish Box Consolidation’. This can lead to…
.
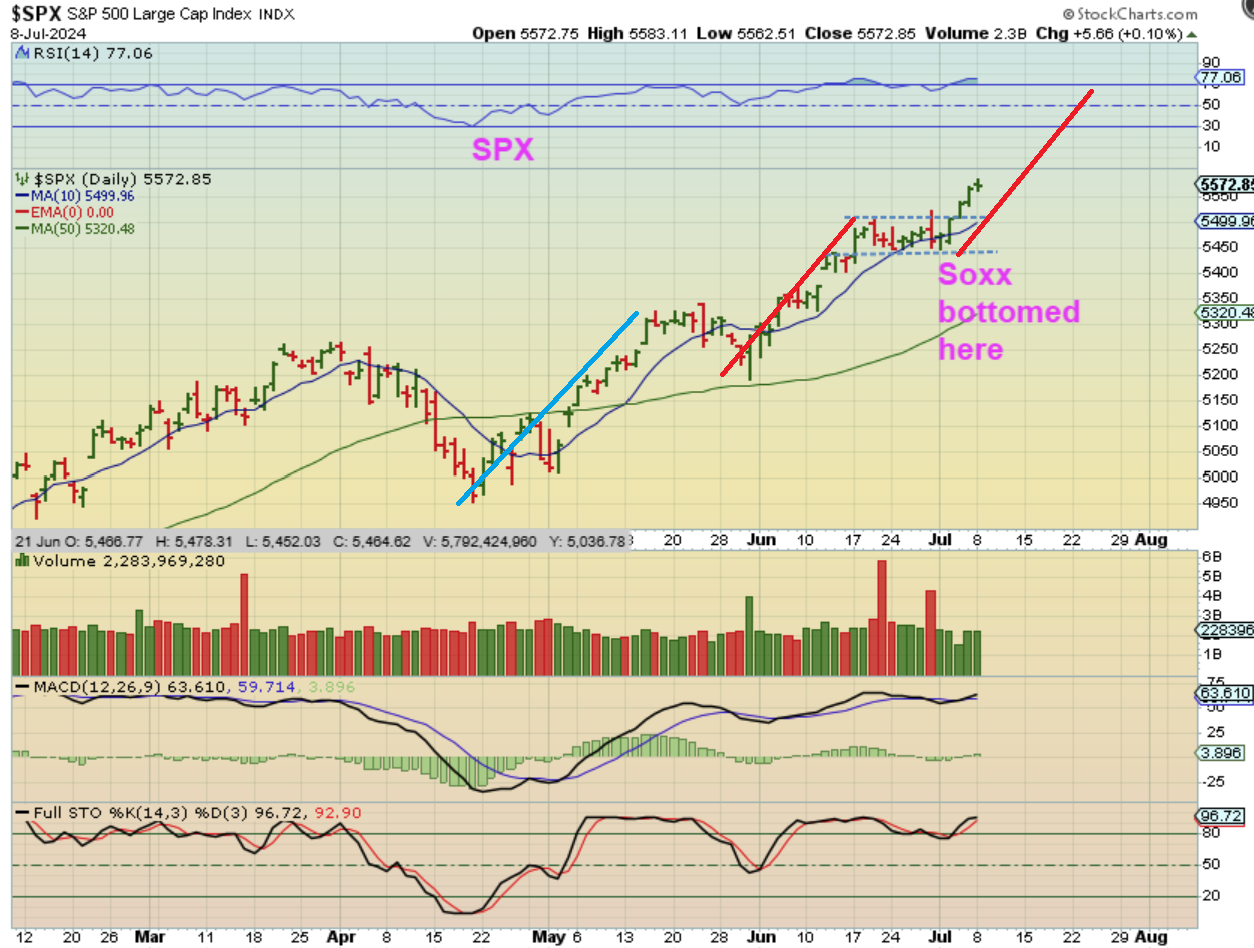
This Bullish Box Consolidation can lead to this.
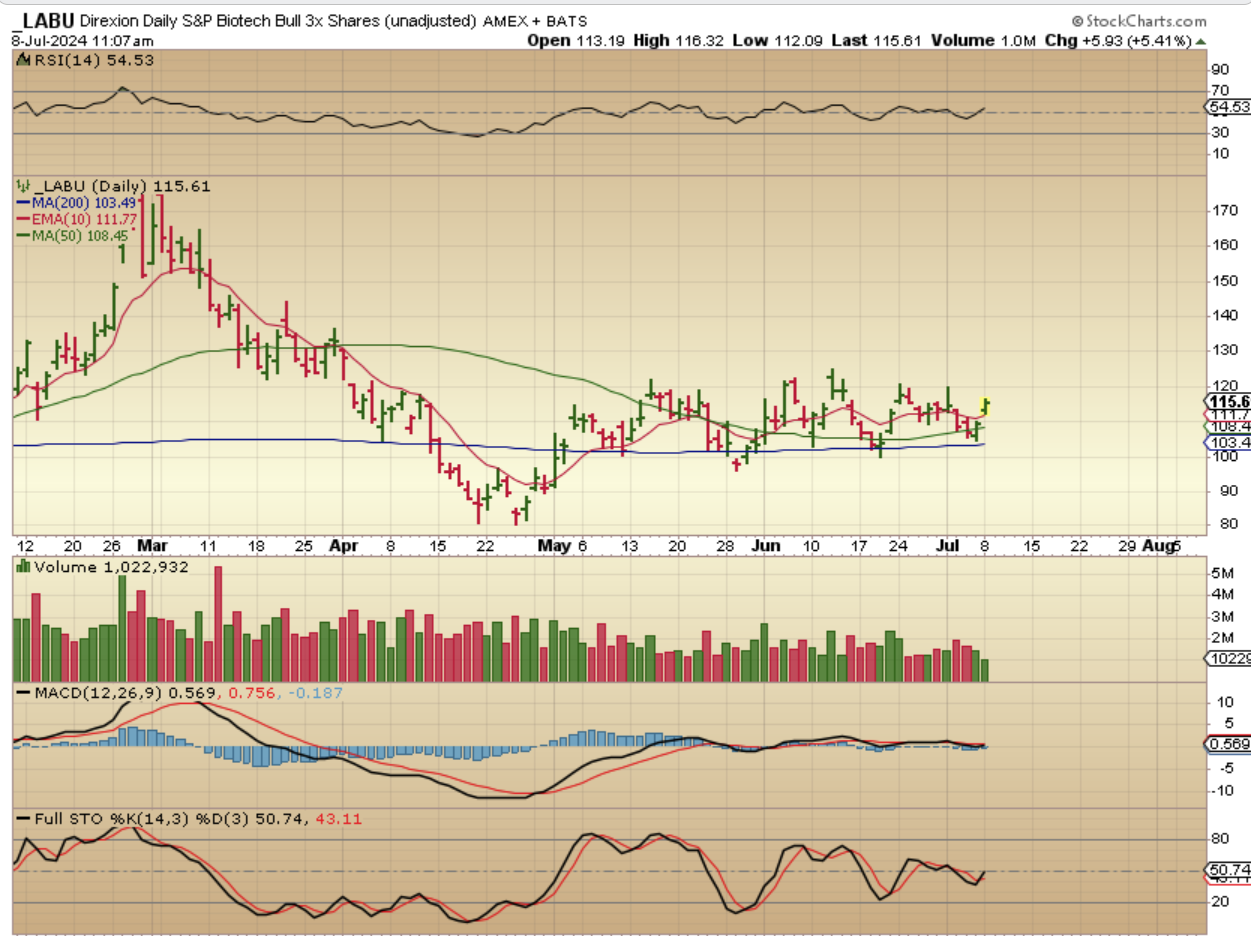
LABU has been bouncing sideways rather reliably along the 50sma nd 200sma. I posted this at 11 a.m. to show that it seems bullish and that it could break higher out of this range if the markets remain bullish. It closed exactly at $115 and is worth watching (or buy a small position and add if it breaks higher).
.
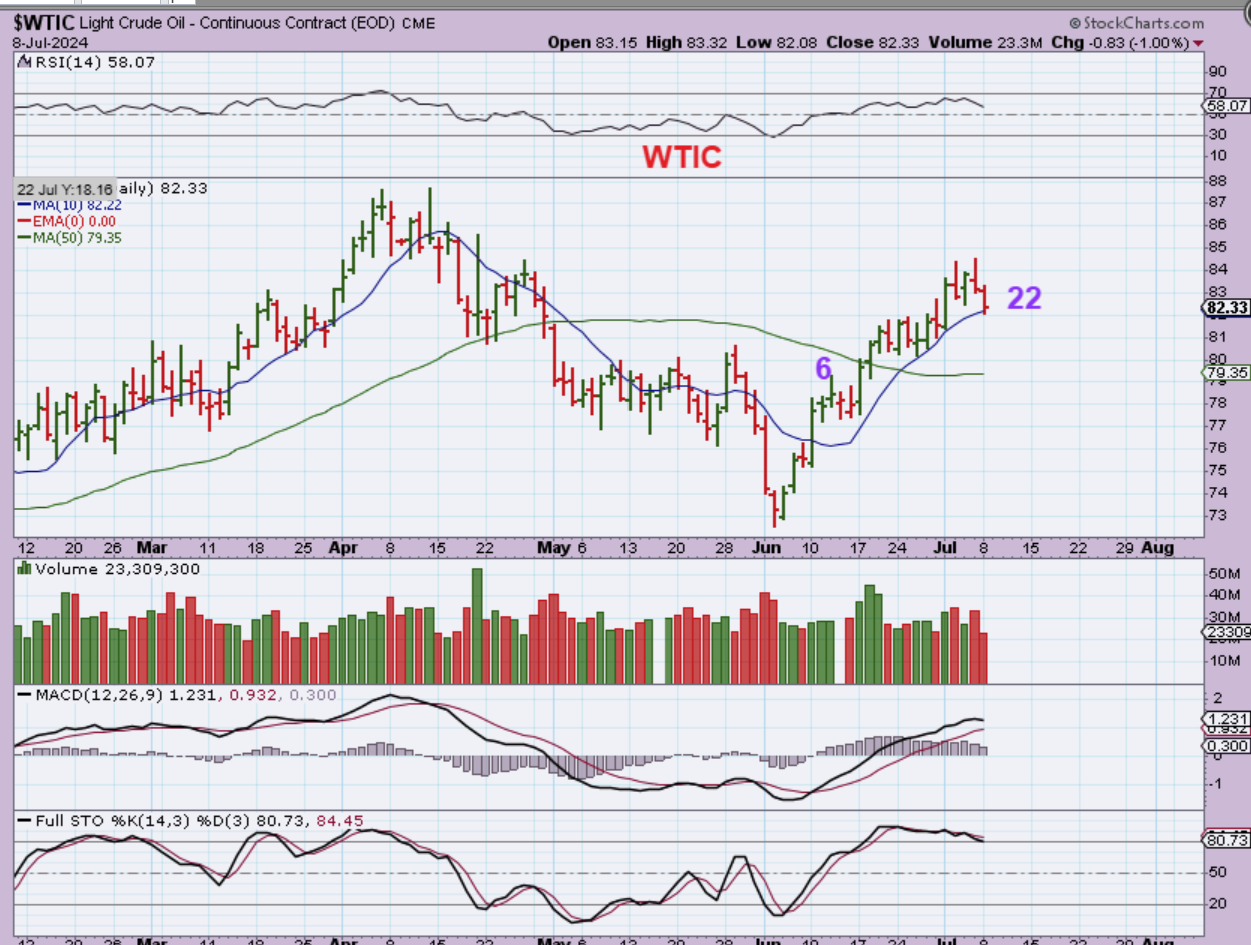
WTIC -Oil dropped, but it has been very bullishly climbing higher with an occasional drop to that 10sma.If it loses the 10sma, we could see a half cycle dip to the 50sma ( Buy the reversal). This also may just keep rising up off of the 10sma like it has (you could buy that reversal too).
.
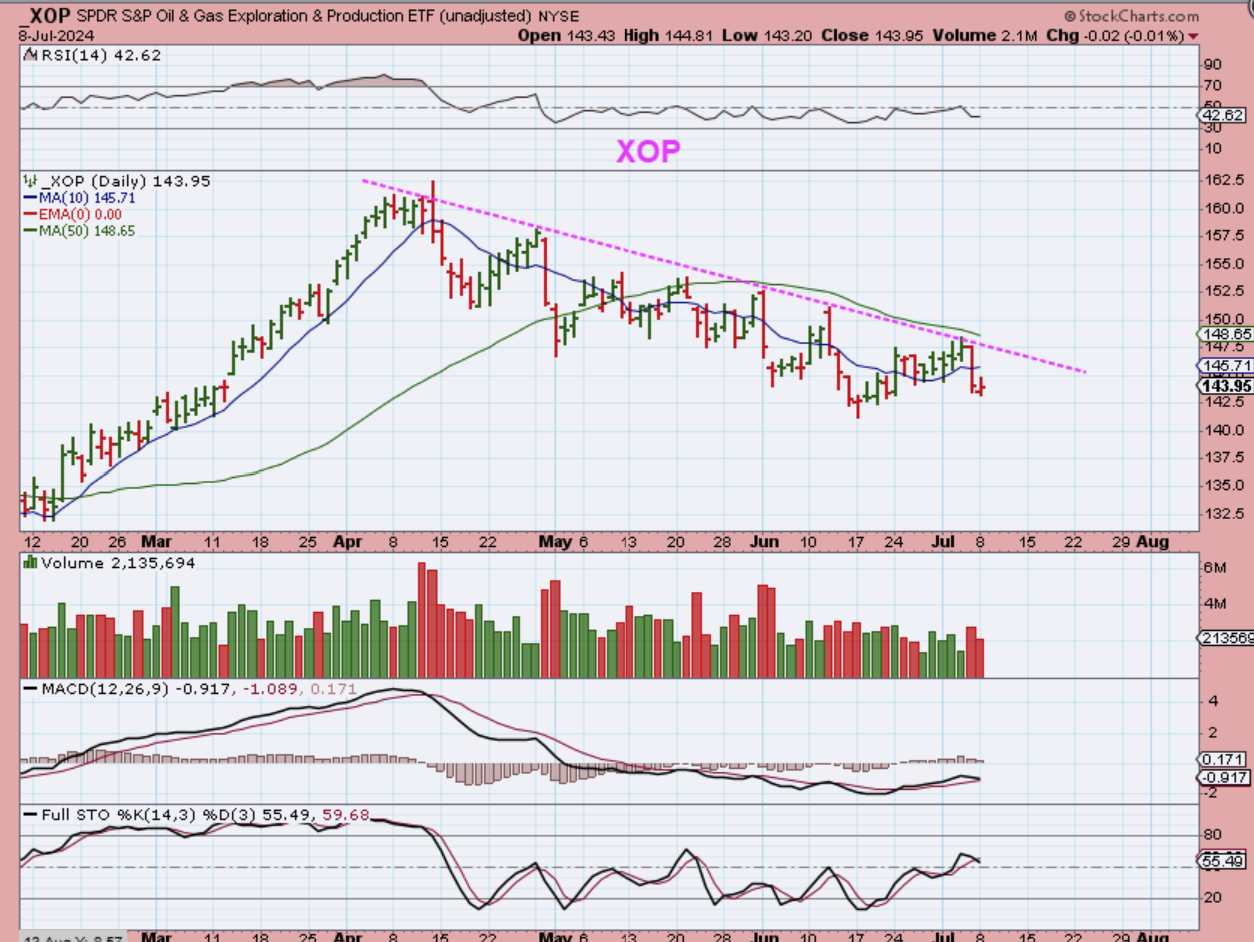
XOP -The oil stocks are still just not breaking out above the 50sma and keeping up with Oil. The XLE was rejected at the 50sma too. It is quite disappointing when you see a 1 day slam down last Friday that basically takes back all of the last 8 days climb.
.
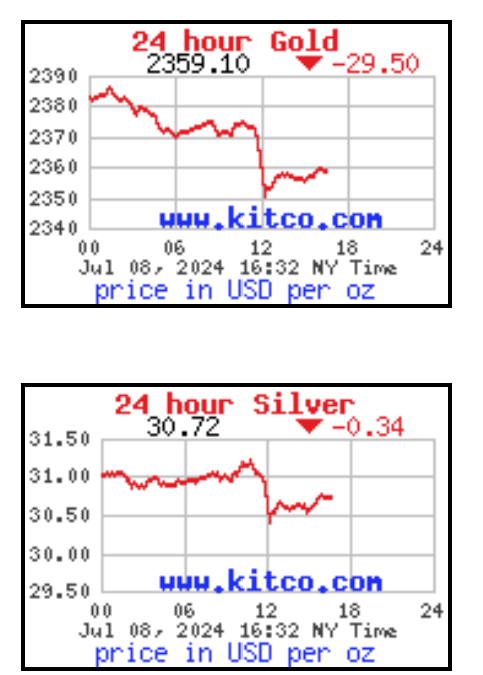
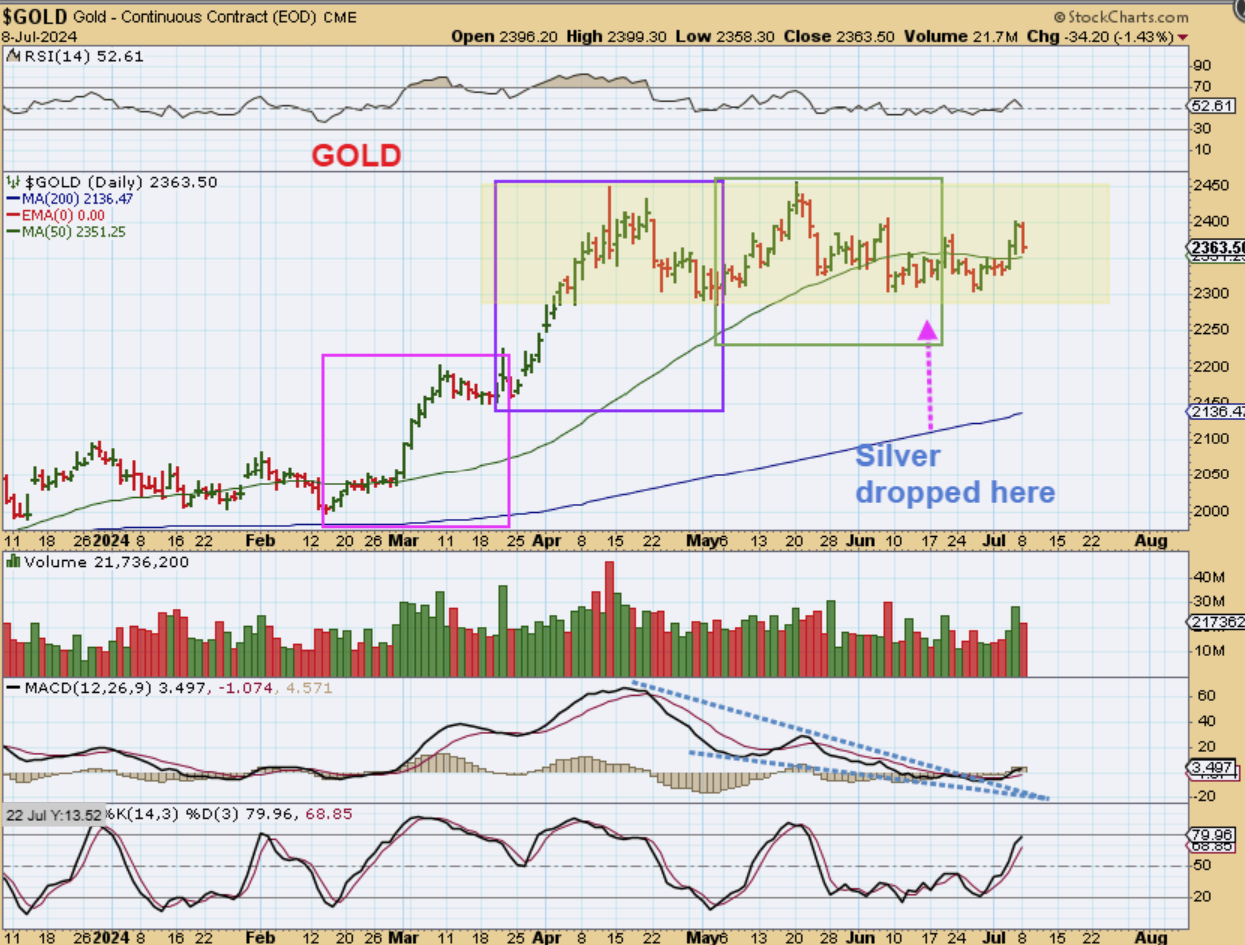
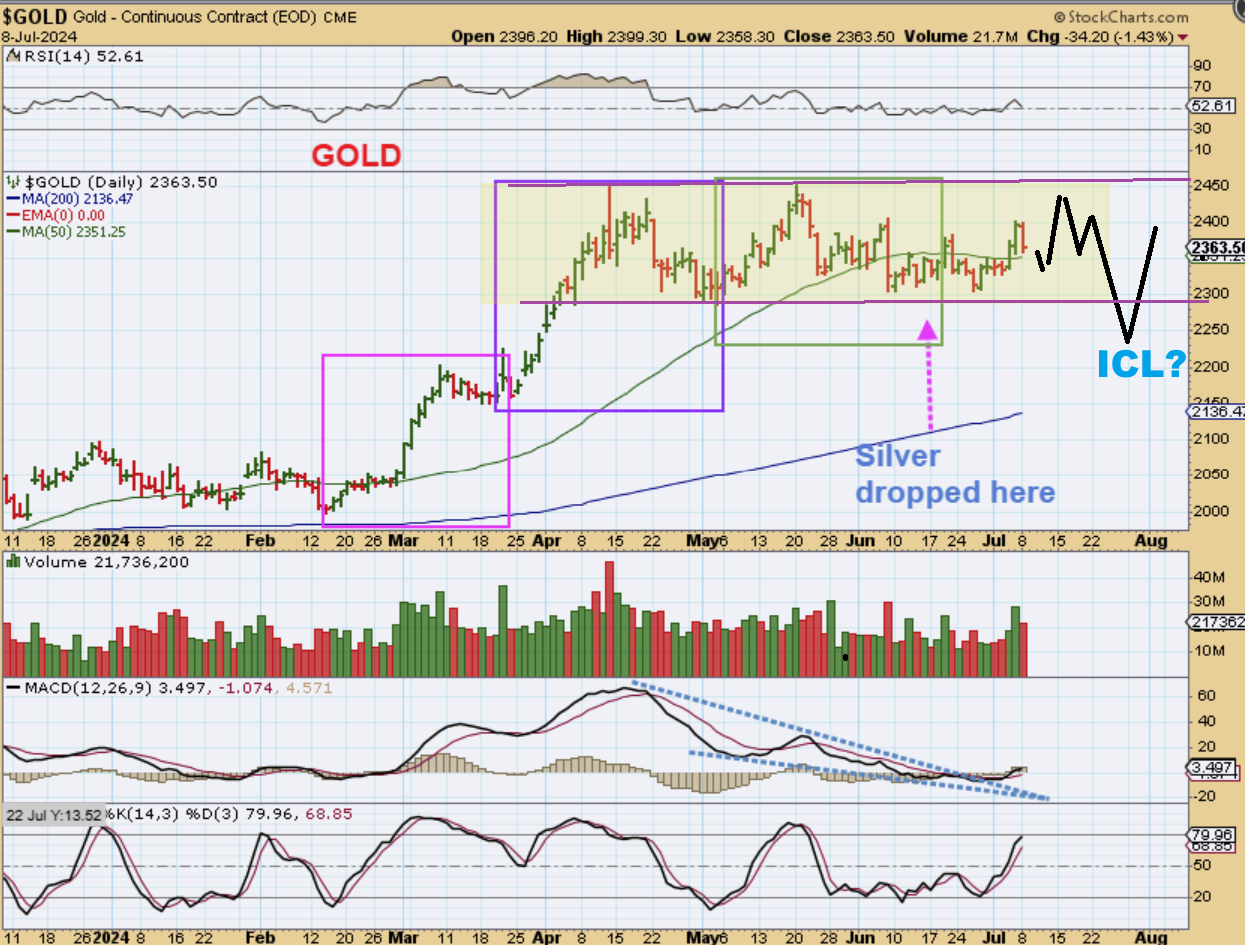
GOLD & SILVER DROP – I just grabbed this chart to show that GOLD & SILVER both crashed down out of nowhere yesterday at right about 12 p.m. ET. I saw it down over $33, but as that happened, I found some Gold stocks that looked just fine. That is considered bullish for this sector.
.
So GOLD was down $34 on Monday, but this is a bullish set up in technical analysis. Last week I mentioned the break of the downtrend, Gold recovery of the 50sma, and the MACD cross. We also have a peak above the prior peaks. That is bullish price action, and indicates the start of an uptrend, but it did come at an odd time. We have seen
1. The first box or daily cycle was very strong.
2. The second box or daily cycle was very strong too, but then you see how it sold off into that dcl.
3. The 3rd daily cycle or box should have seen price come down and break those prior lows in the yellow box. That would have caused a shake out and a stop run, with possibly increased selling, but the selling dried up when we started to get bullish inflation news / rate cut possibilities, etc. This flipped to bullish again.
4. Now we are just churning sideways in this large box consolidation and there is a chance that this could break out and run. Or, an ICL might simply be…
.
Now we are just churning sideways in this large box consolidation.
An ICL might simply be a final shake out of this box, and it could come at the end of this 4th daily cycle or a fifth. I know that this looks like we will have a R.T. 4th daily cycle, but consolidations and triangles can be misleading. I do find it hard to believe that Gold will just run up and break out right now (but it could under these bullish conditions). That MACD is bullish and I would want to own some Miners now (or the ETF), just in case this makes a run higher.
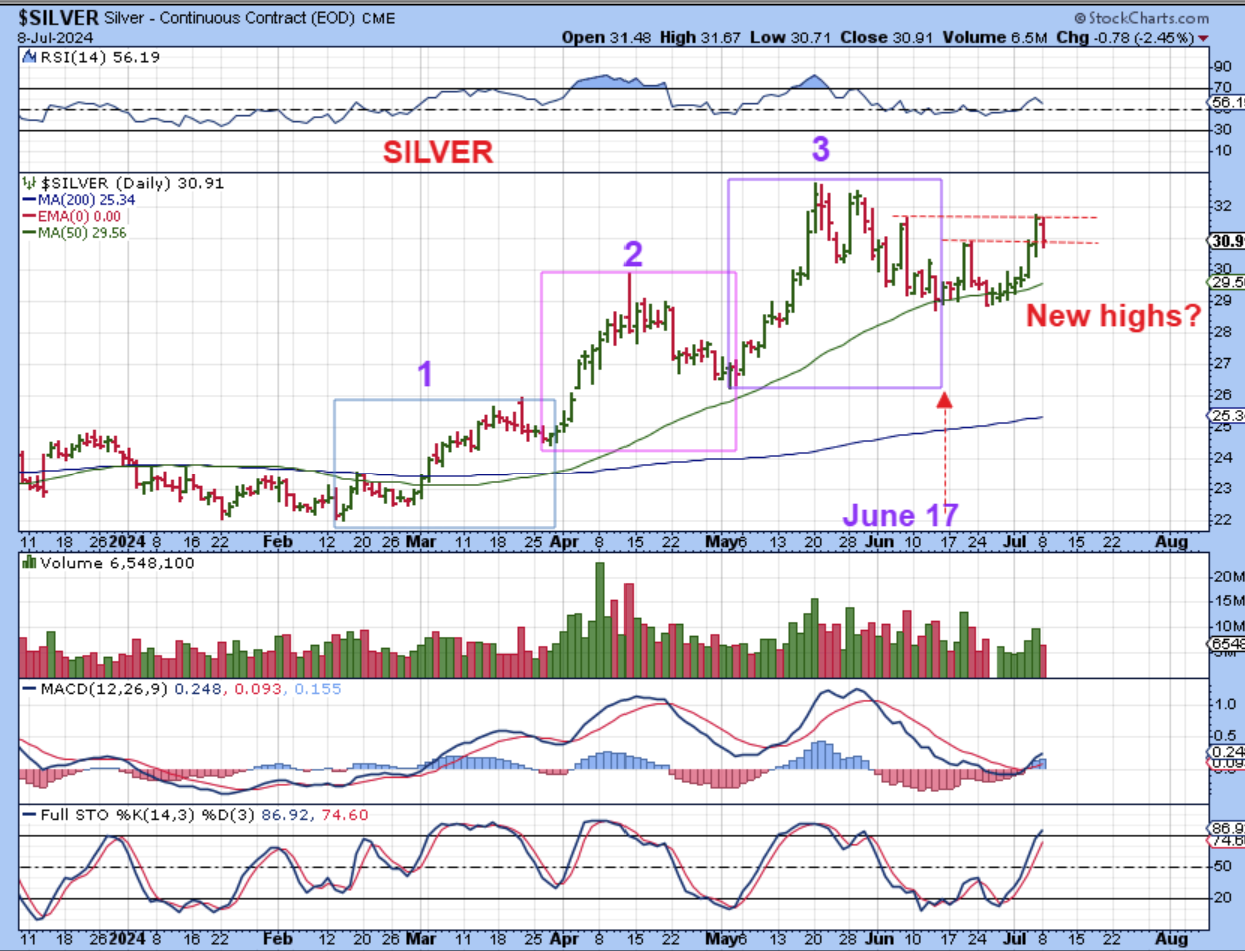
When I see both Gold & Silver making new highs above prior ‘peaks’ in June and even May, that is simply Bullish. Silver is trending higher all of a sudden. Yes, this was a L.T. 3rd daily cycle and it should have broken down, but it reversed at the 50sma and is making new peaks. Last week I pointed out that we broke a downtrend and the MACD crossed higher. Those are basic buy signals, with a stop.
.
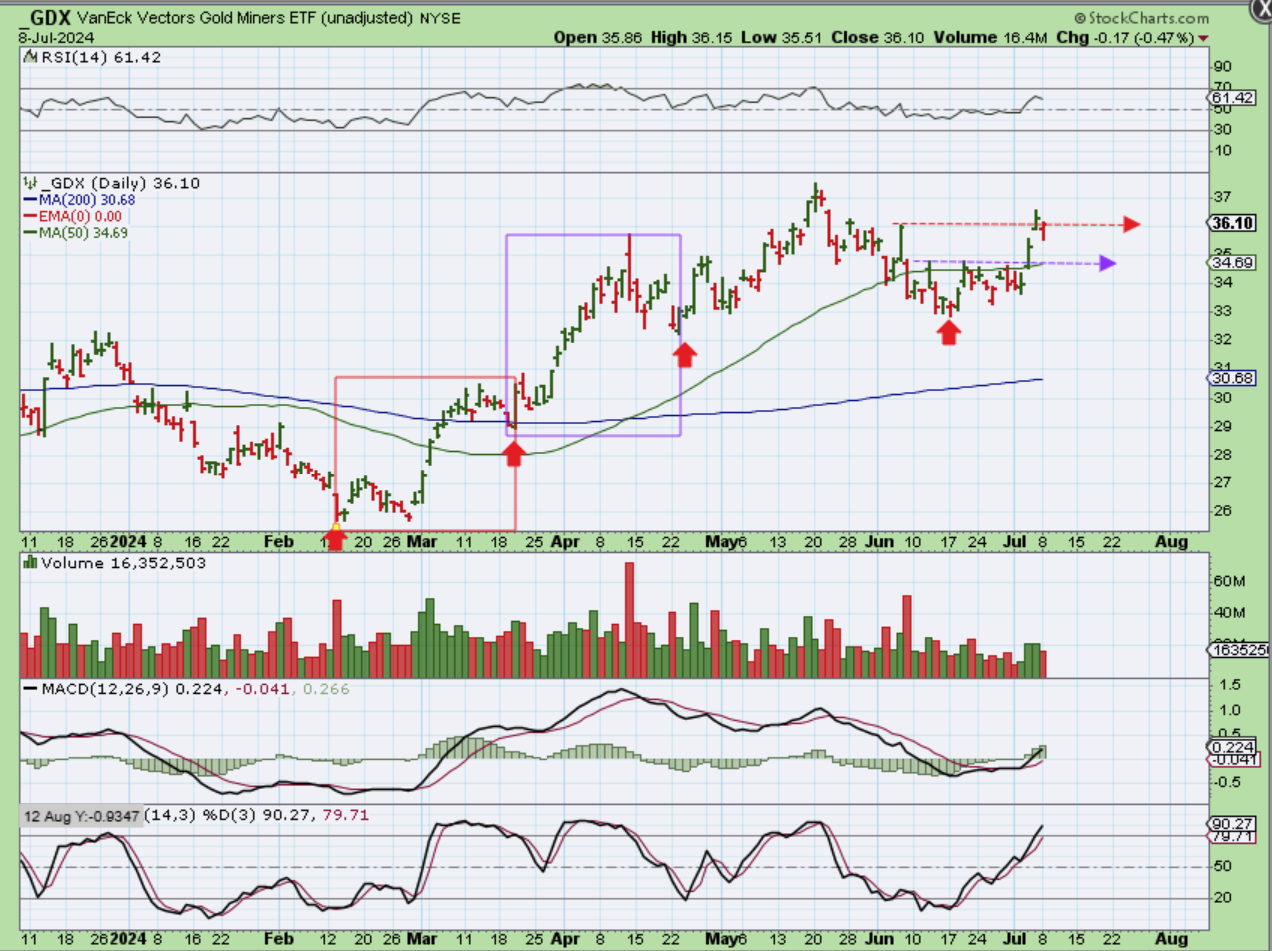
Take a look at The GDX ETF and you’ll see that it is making new highs above prior ‘peaks’ too.
1. The first daily cycle sell off was MILD into a dcl.
2. The second daily cycle sell off was also Mild into a dcl.
3. The 3rd daily cycle sell off was Deeper and prolonged. Using June 17 as that dcl, we are on day 13 for the GDX, so will this die & roll over, or can it keep running? It is hard to know because it really shouldn’t have moved this high in a 4th weaker daily cycle. This should roll over as a 4th daily cycle, but…
.
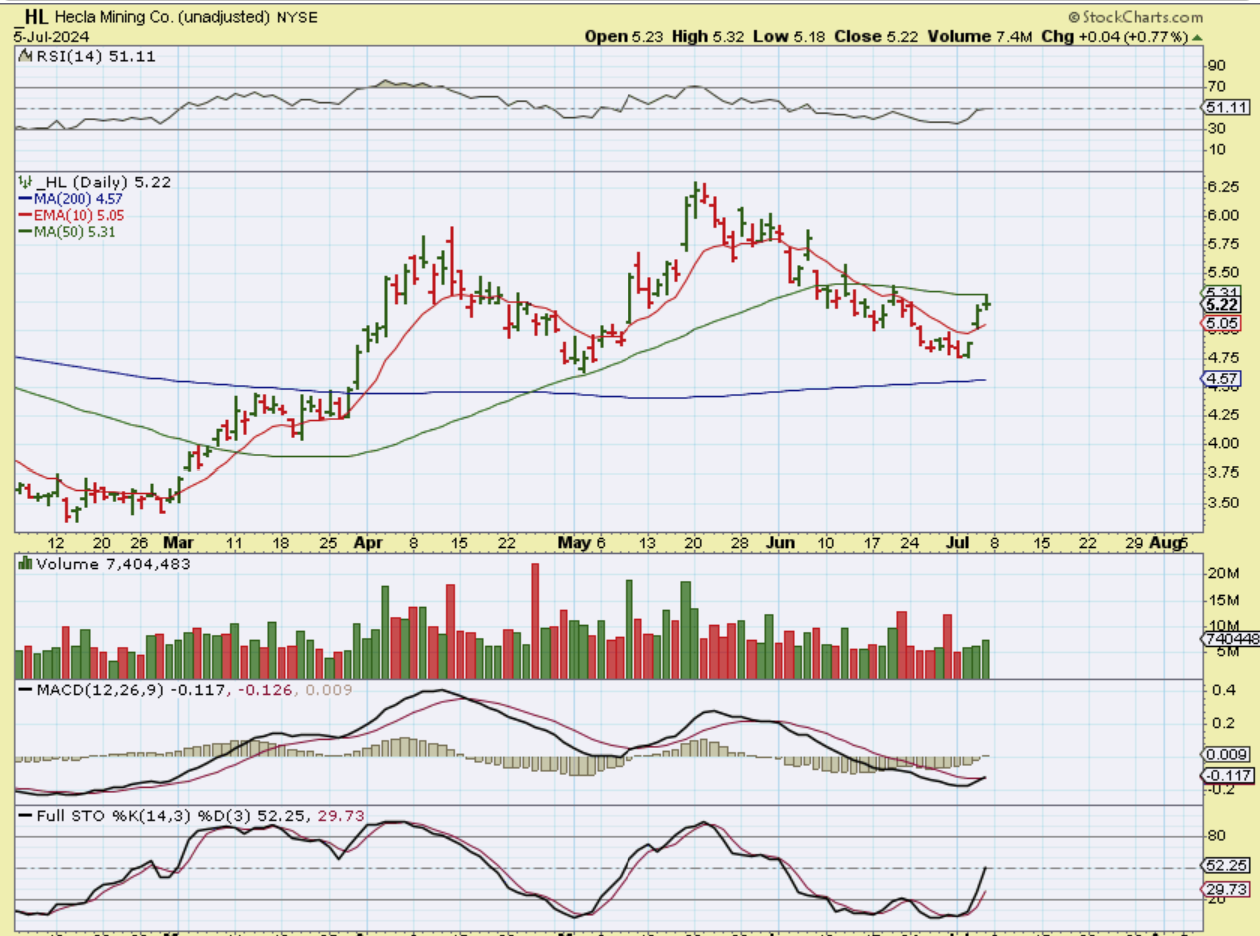
HL – While some miners remained weaker or trapped under resistance, like a 4th daily cycle should, others…
.
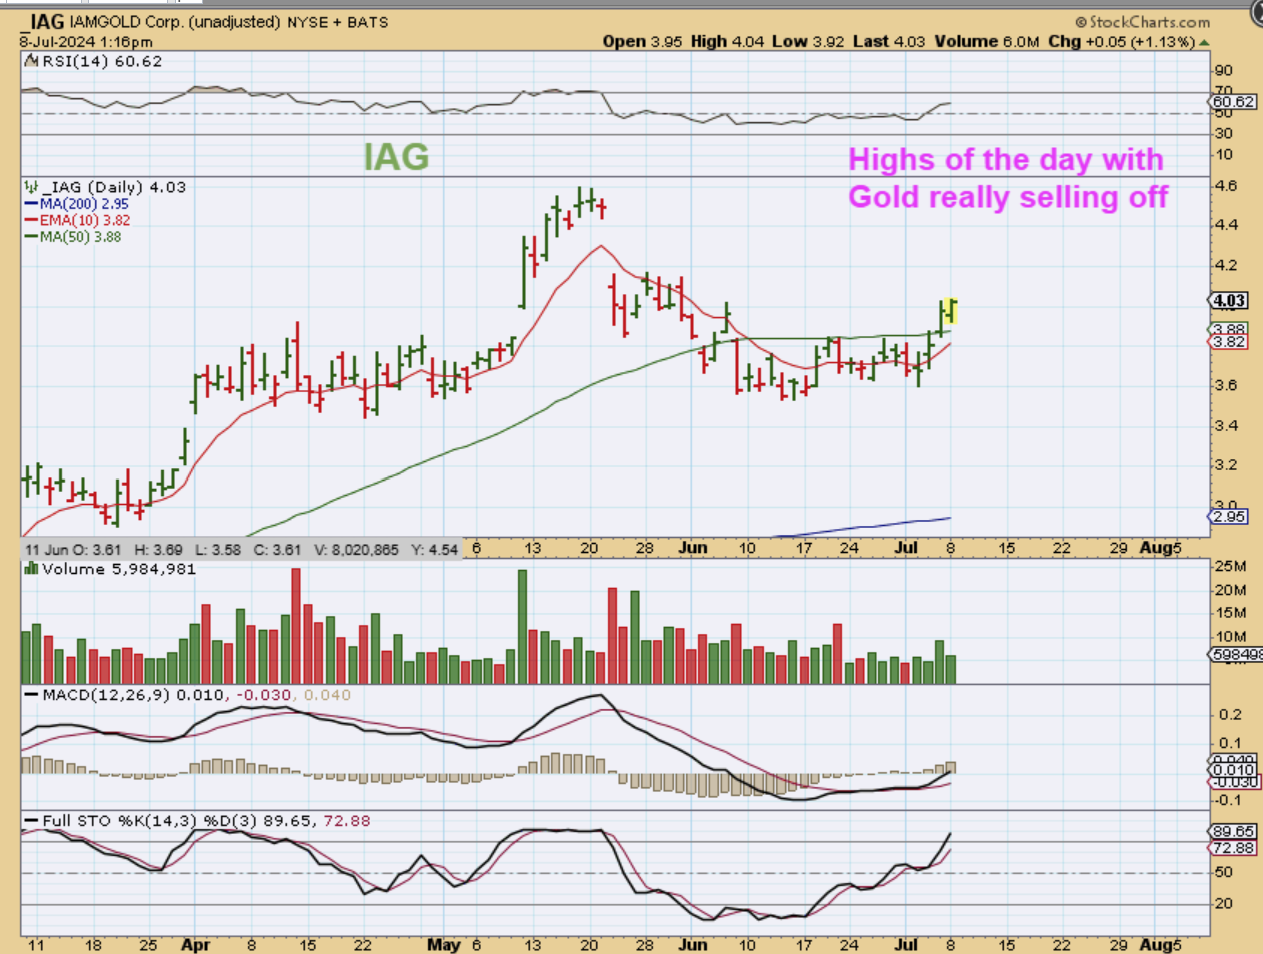
Other Miners like IAG look bullish and are giving buy signals. Last week this was a buy when it breaks above the 50sma, and today it closed a little higher at $4.07. THIS was taking place as GOLD dropped $35.
.
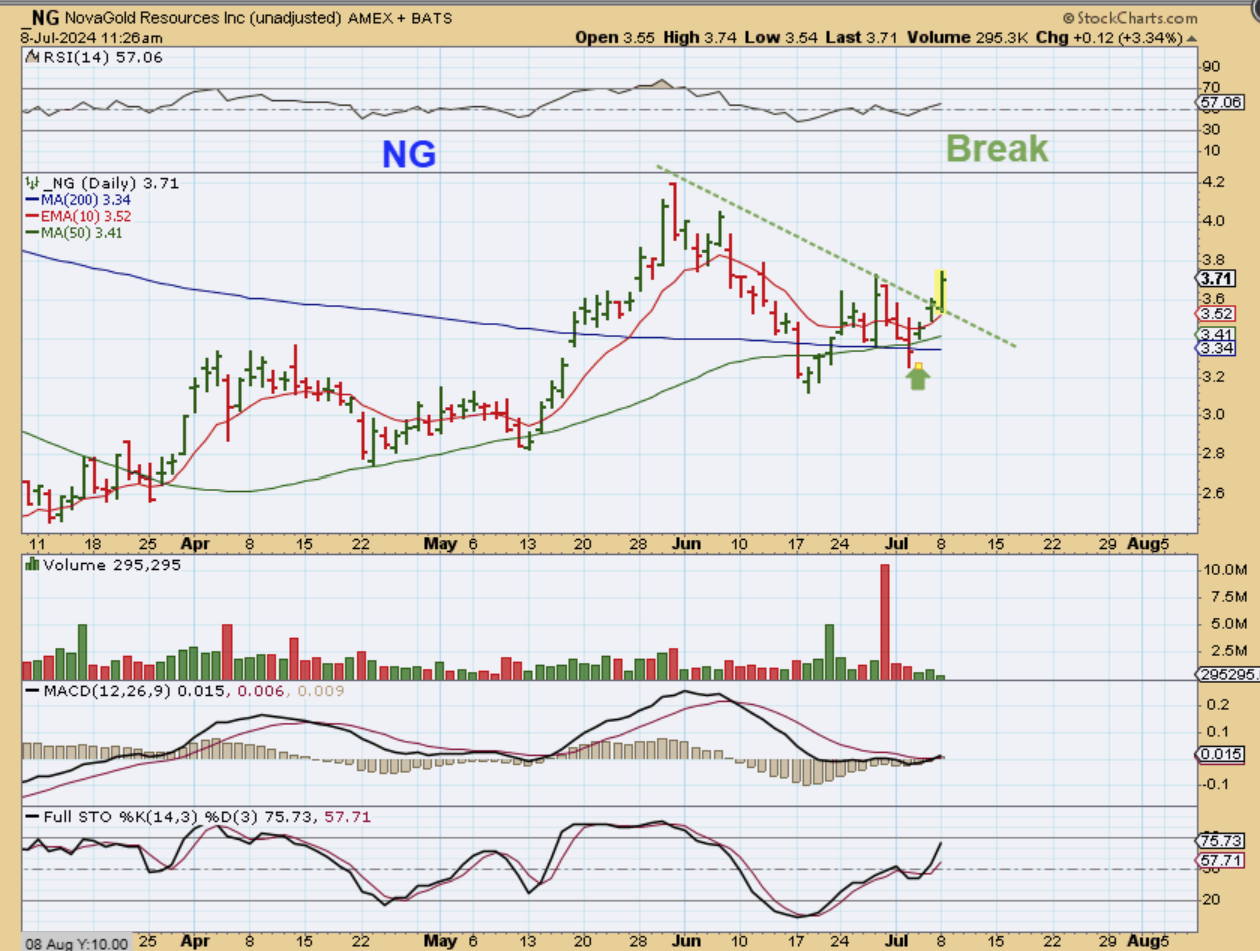
NG broke out and closed higher than this, with Gold selling off $35 at midday. This has to be viewed as bullish price action. Gold down $35, NG up 4% at the close.
.
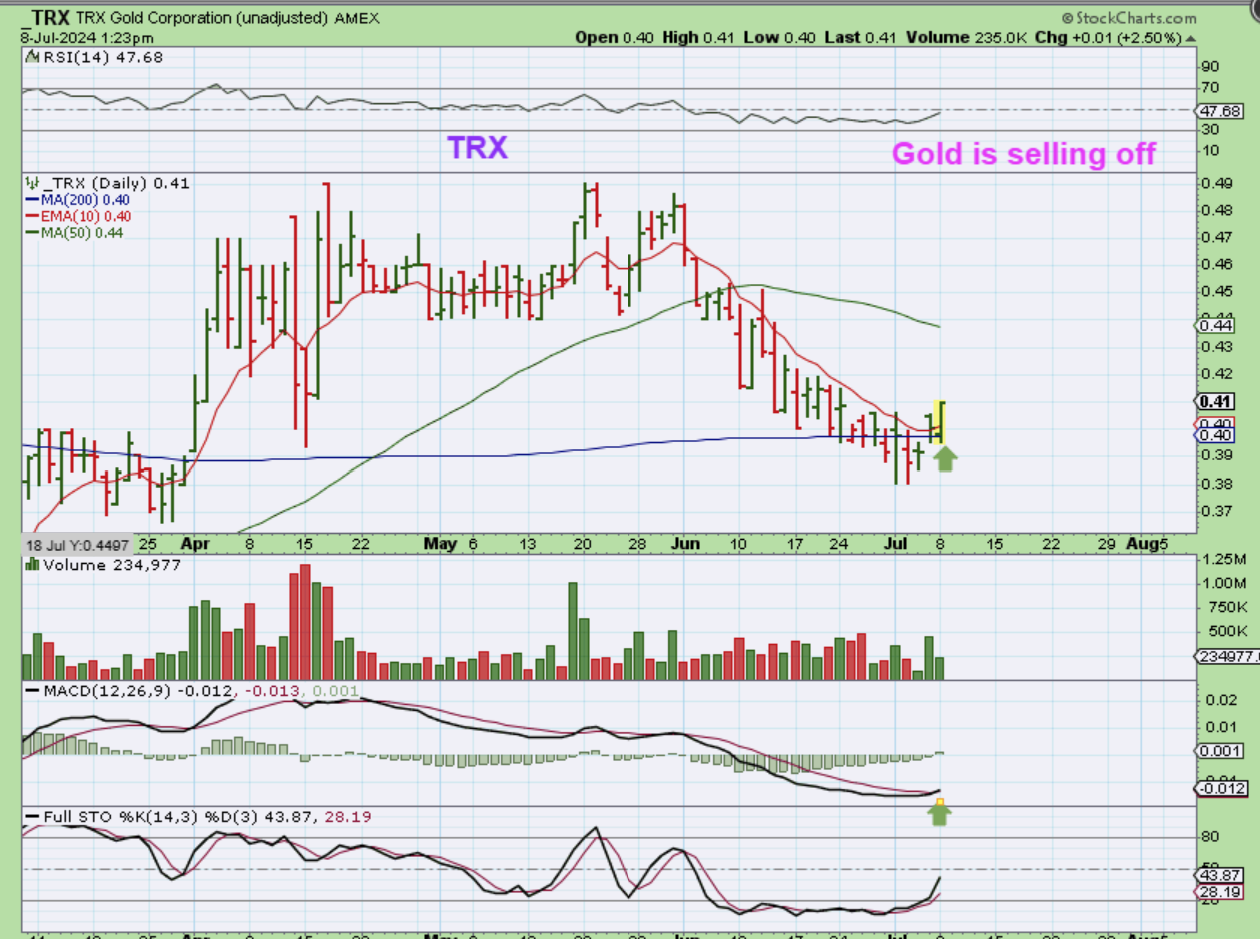
TRX was rising up at 1:23 p.m., as Gold crashed down. This looks like a ‘shakeout’ at the 200 sma, and a buy as it recovers.
.
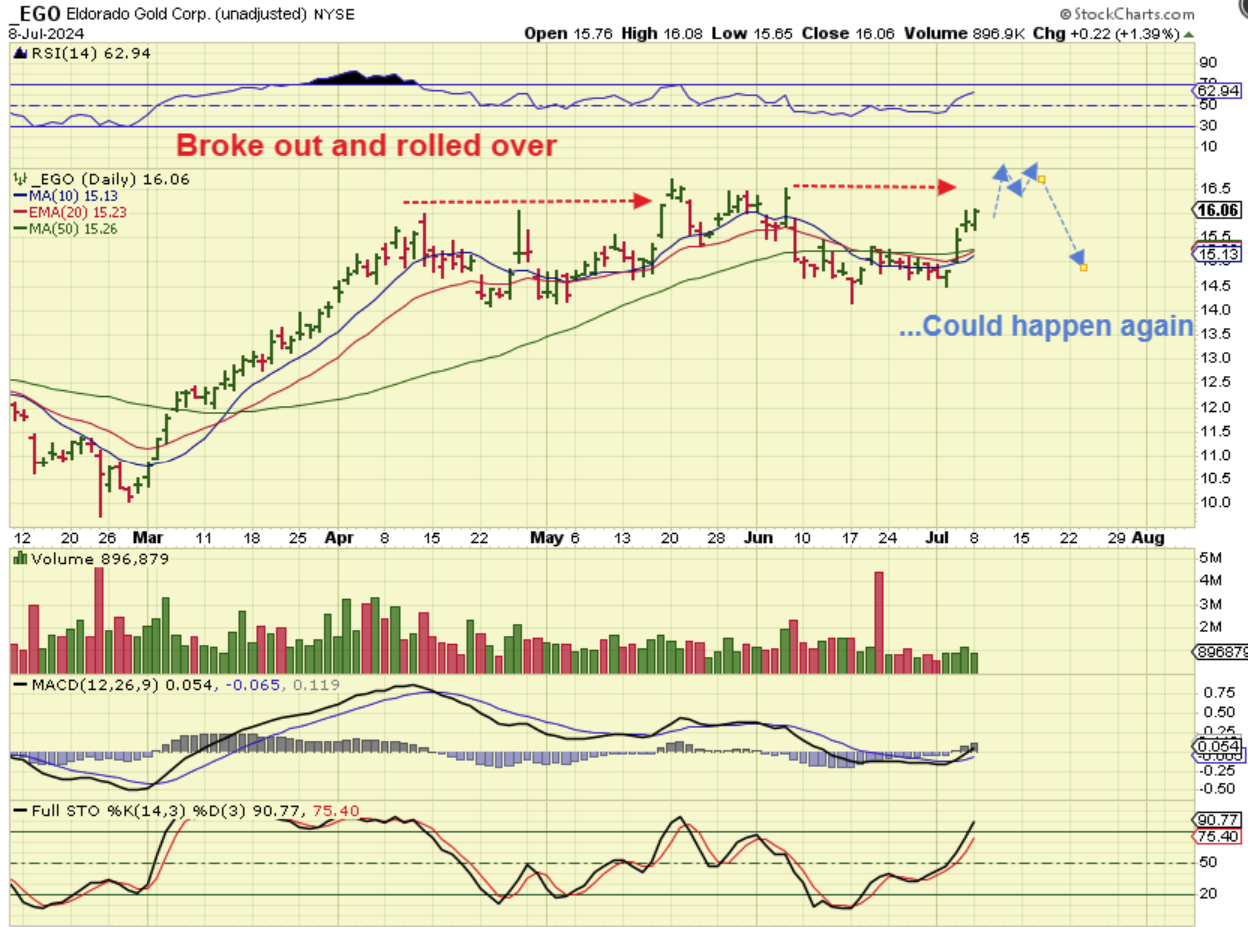
EGO was breaking out in May and then it rolled over as a false breakout when the time came for a dip into a dcl. It is possible that these Miners break and drop again, but you just can’t tell until things play out, so for those holding a basket of miners through all of the good and the bad? Enjoy the ride. Anyone adding miners, you may want to raise stops above the 10sma as they go.
.
Gold crashed down $35 midday yesterday, and yet Miners were rallying? What a situation we have with the current bull markets. Surprises to the upside are to be expected, but in a 4th daily cycle it is extremely rare that you would see a drop into an ICL diverted, downtrends broken, a macd cross up, and new peaks being made this deep in an intermediate cycle. You really just have to accept what is presented, just in case we see short covering on the inflation numbers later this week. I have heard people say, “I don’t know what to do, I’m afraid that I’ll buy and price will drop back on me.” If that is the case for me, I just keep positions small and if they start to ramp up as though a stealth ICL was put in place, or we are simply going to get 7 daily cycles and the 4th and 5th may be strong, I can add on the dips later. Next time someone tells you to ‘sell in May and go away’, try to just remember this summer. You never know what the markets will bring you. 🙂
.
Below I will discuss Bitcoin, a few Crypto stocks, and a few tech stocks. Enjoy your Tuesday trading.
.
~ALEX
.
THIS CHART WAS IN THE WEEKEND REPORT:
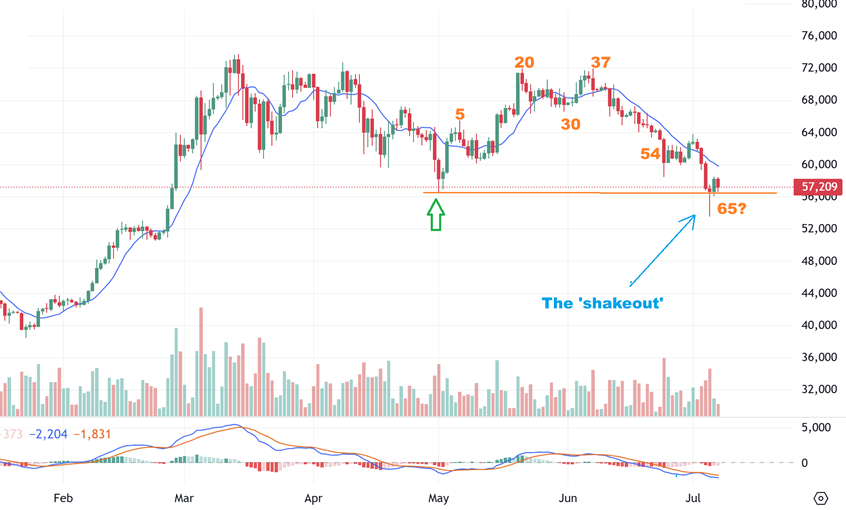
BITCOIN DAILY – So we saw a crash down on Friday day 65 while I was away, and then it started to bounce back. Many Crypto-Miners were green when Bitcoin crashed, so this is likely marking a major low. We may have a shake out on day 65.
.
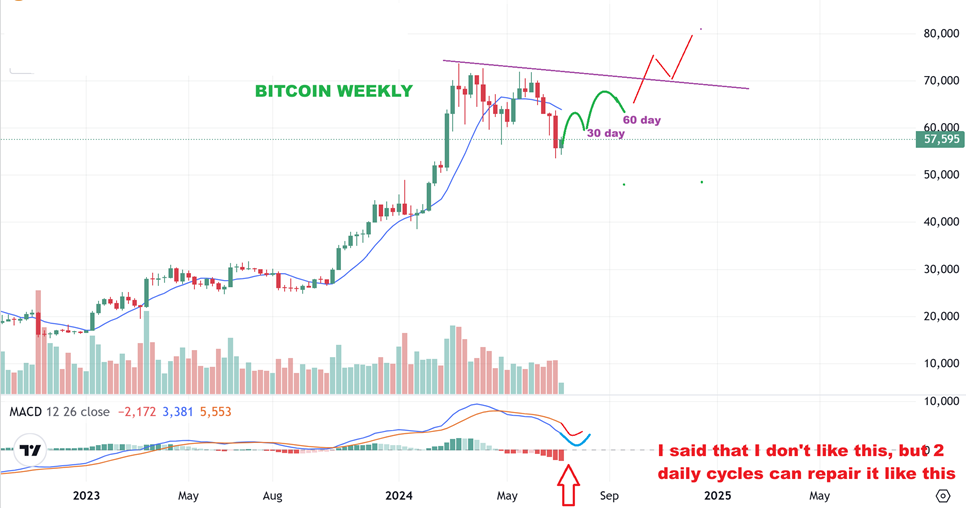
Yesterday I said that I didn’t like the MACD on THE BITCOIN WEEKLY CHART–
Well, I certainly didn’t mean to scare anyone away from the trade, because over time (and we know that 60 day cycles are 2 months long), that MACD can gradually correct itself and curl upward, as long as price rises upward. So let me put this picture in your mind. The crypto stocks have been very bullish and for those that can handle the chop, they have been rewarding too.
.
The crypto stocks have been very bullish and for those that can handle the chop, they have been rewarding too.
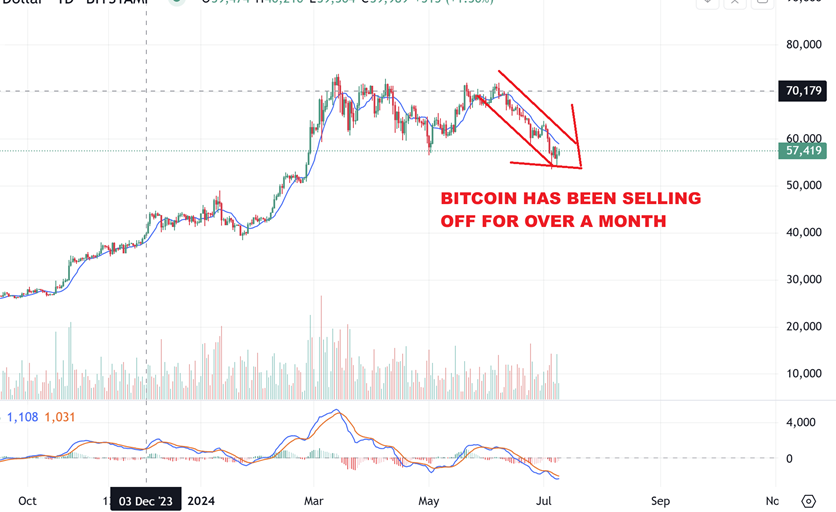
Take a look at Bitcoins path here. NOTE: BITCOIN HAS BEEN SELLING OFF FOR OVER A MONTH.
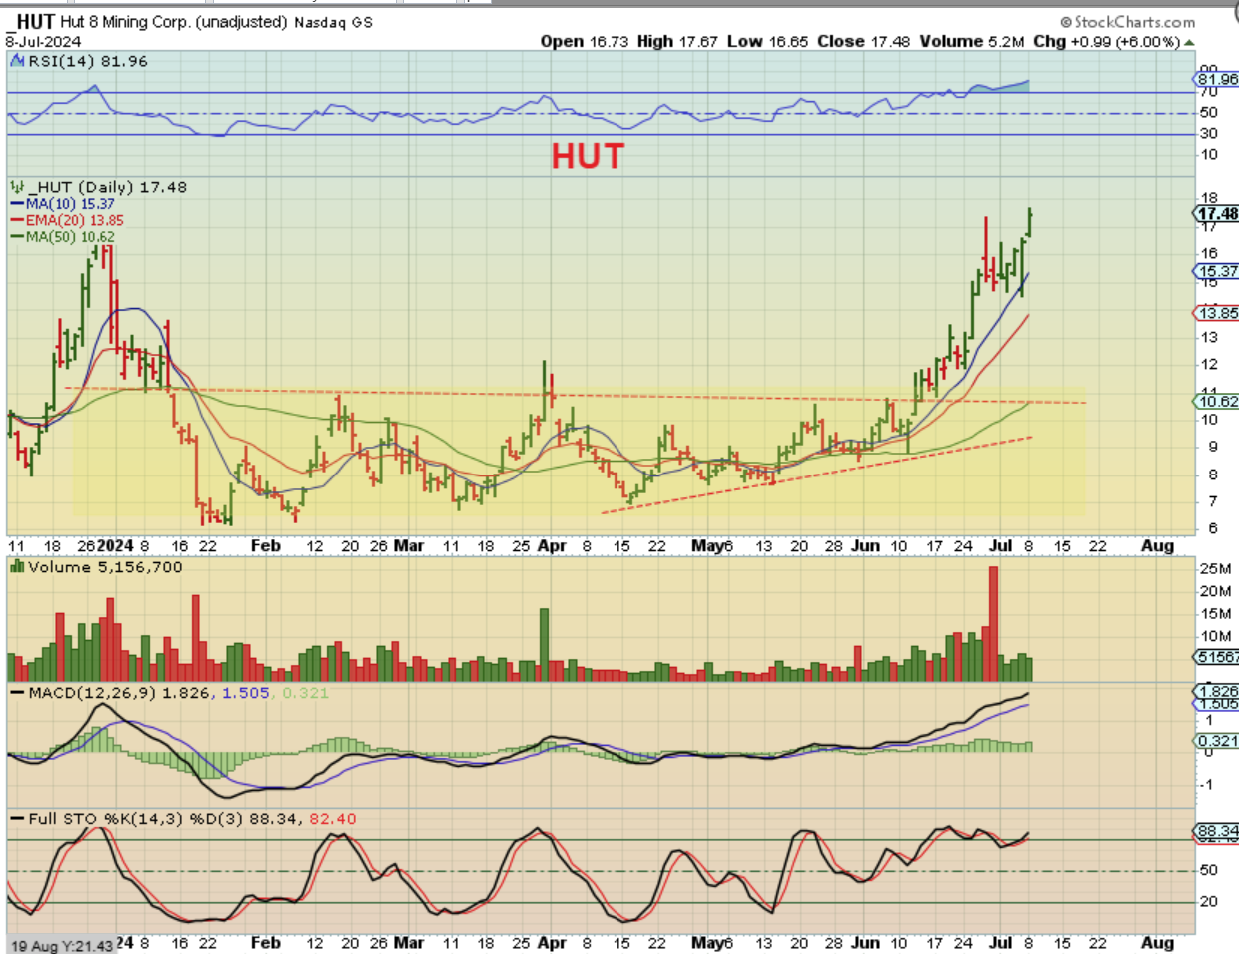
HUT has been rallying for over 1 month AS BITCOIN CRASHED LOWER. Over 100% gains as Bitcoin crashed.
.
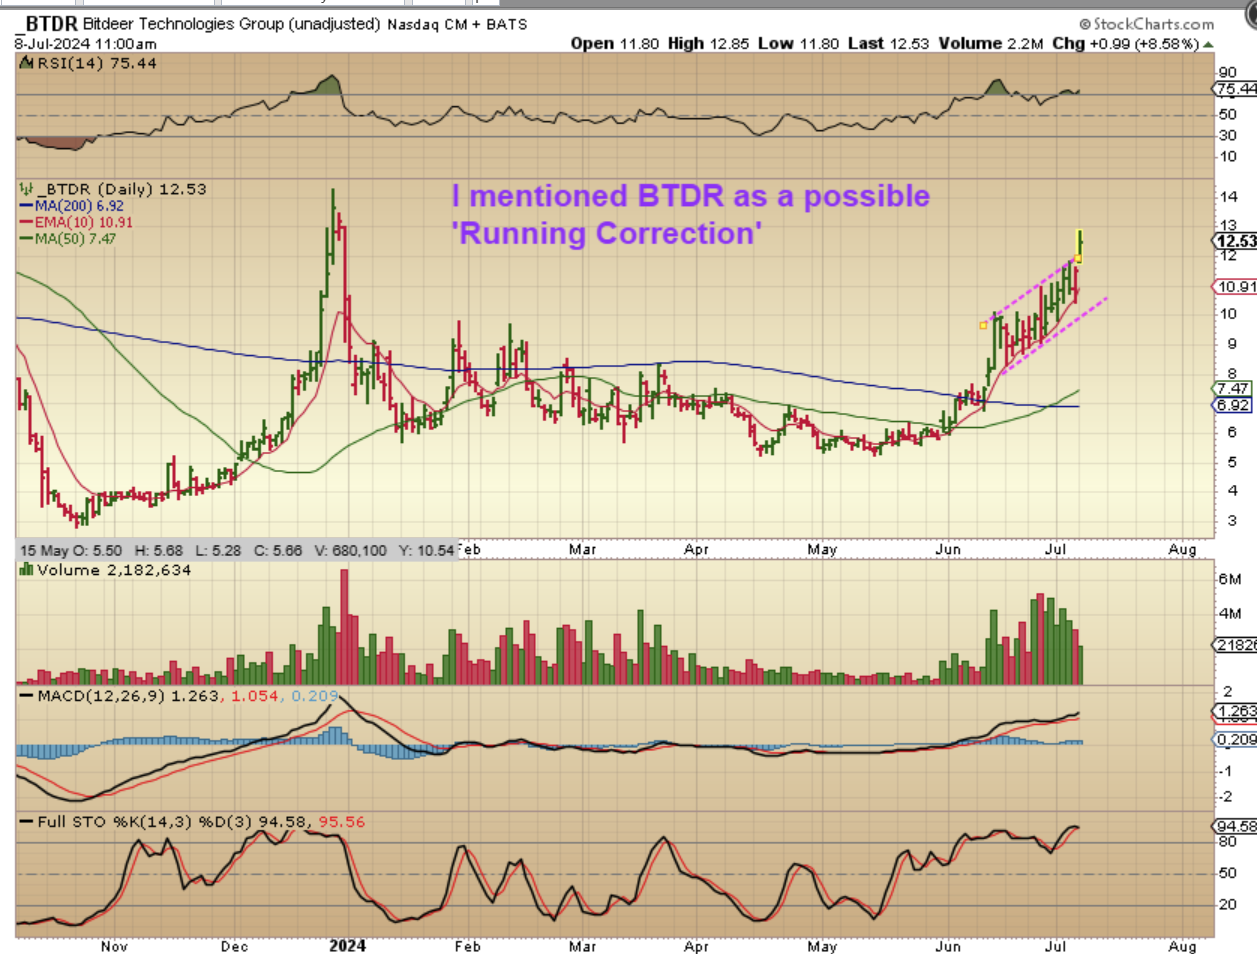
BTDR has been rallying for over a month as Bitcoin crashed lower. This was $6 to $12 (100% plus) with a Bitcoin sell off.
.
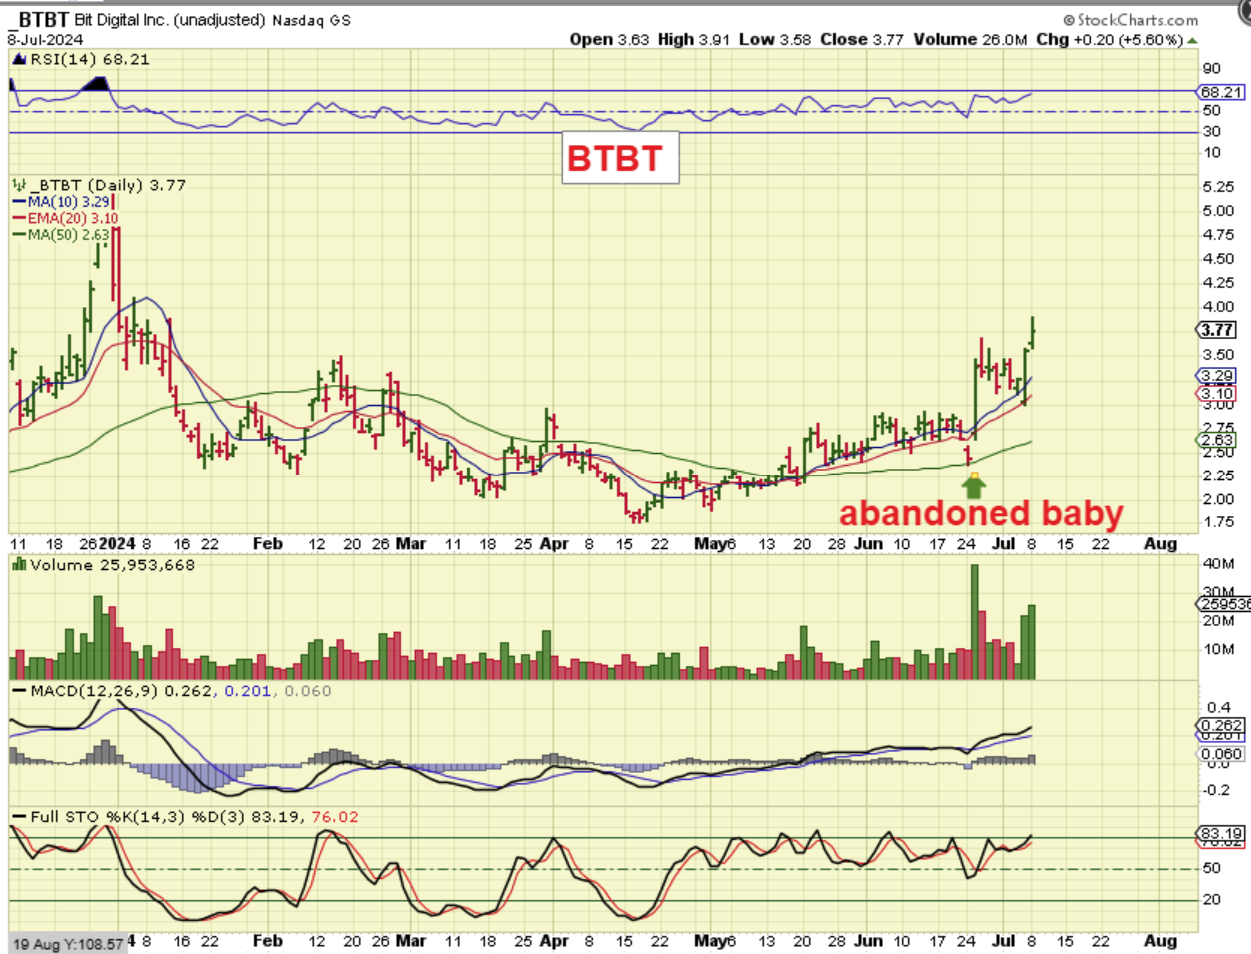
BTBT ( & BTCM) is starting to ‘Pop’ off of the 50sma.
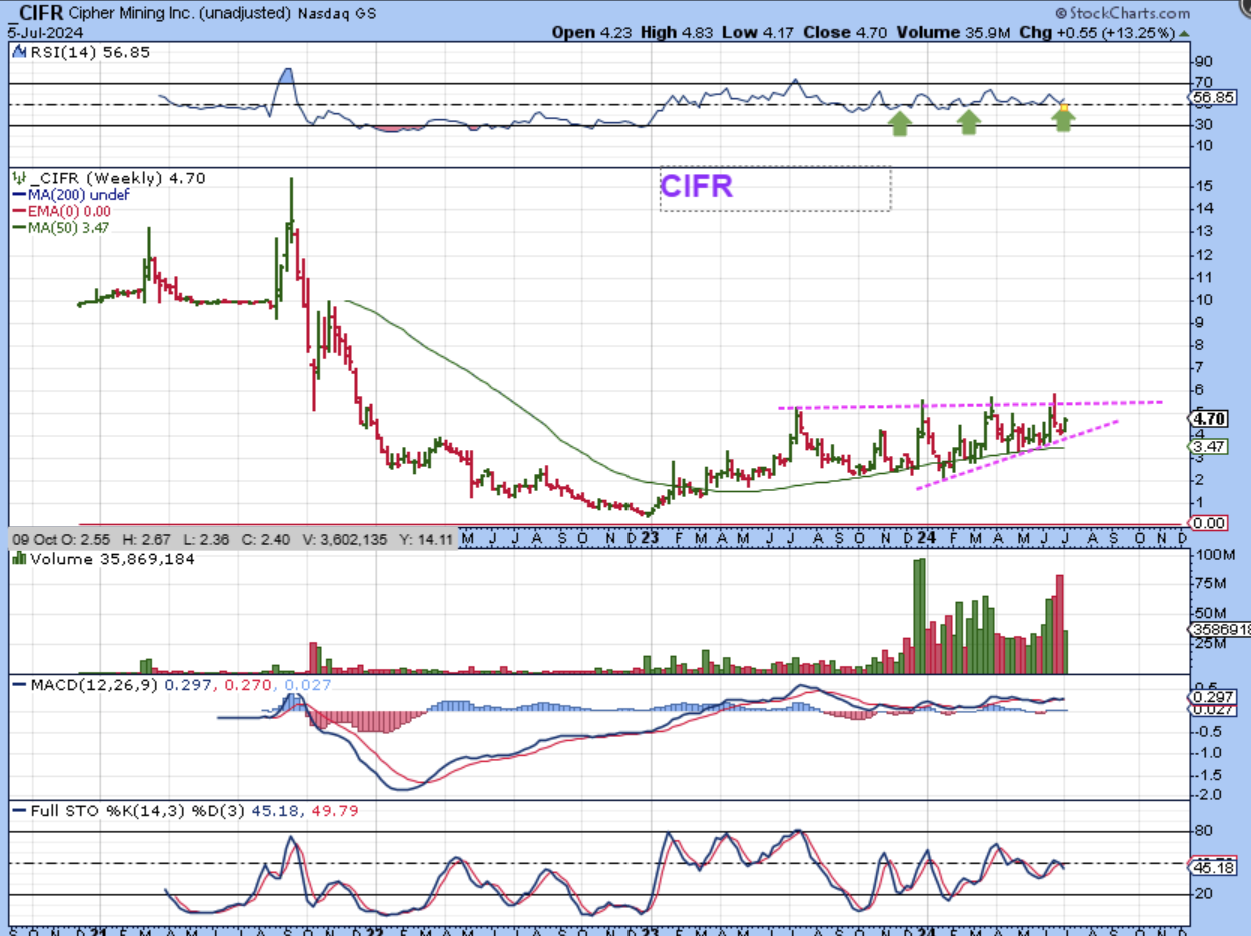
.CIFR has chopped sideways, but this is a bullish base formation and it did not crash below that 50sma as bitcoin sold off. This may be ready to move higher next.
.
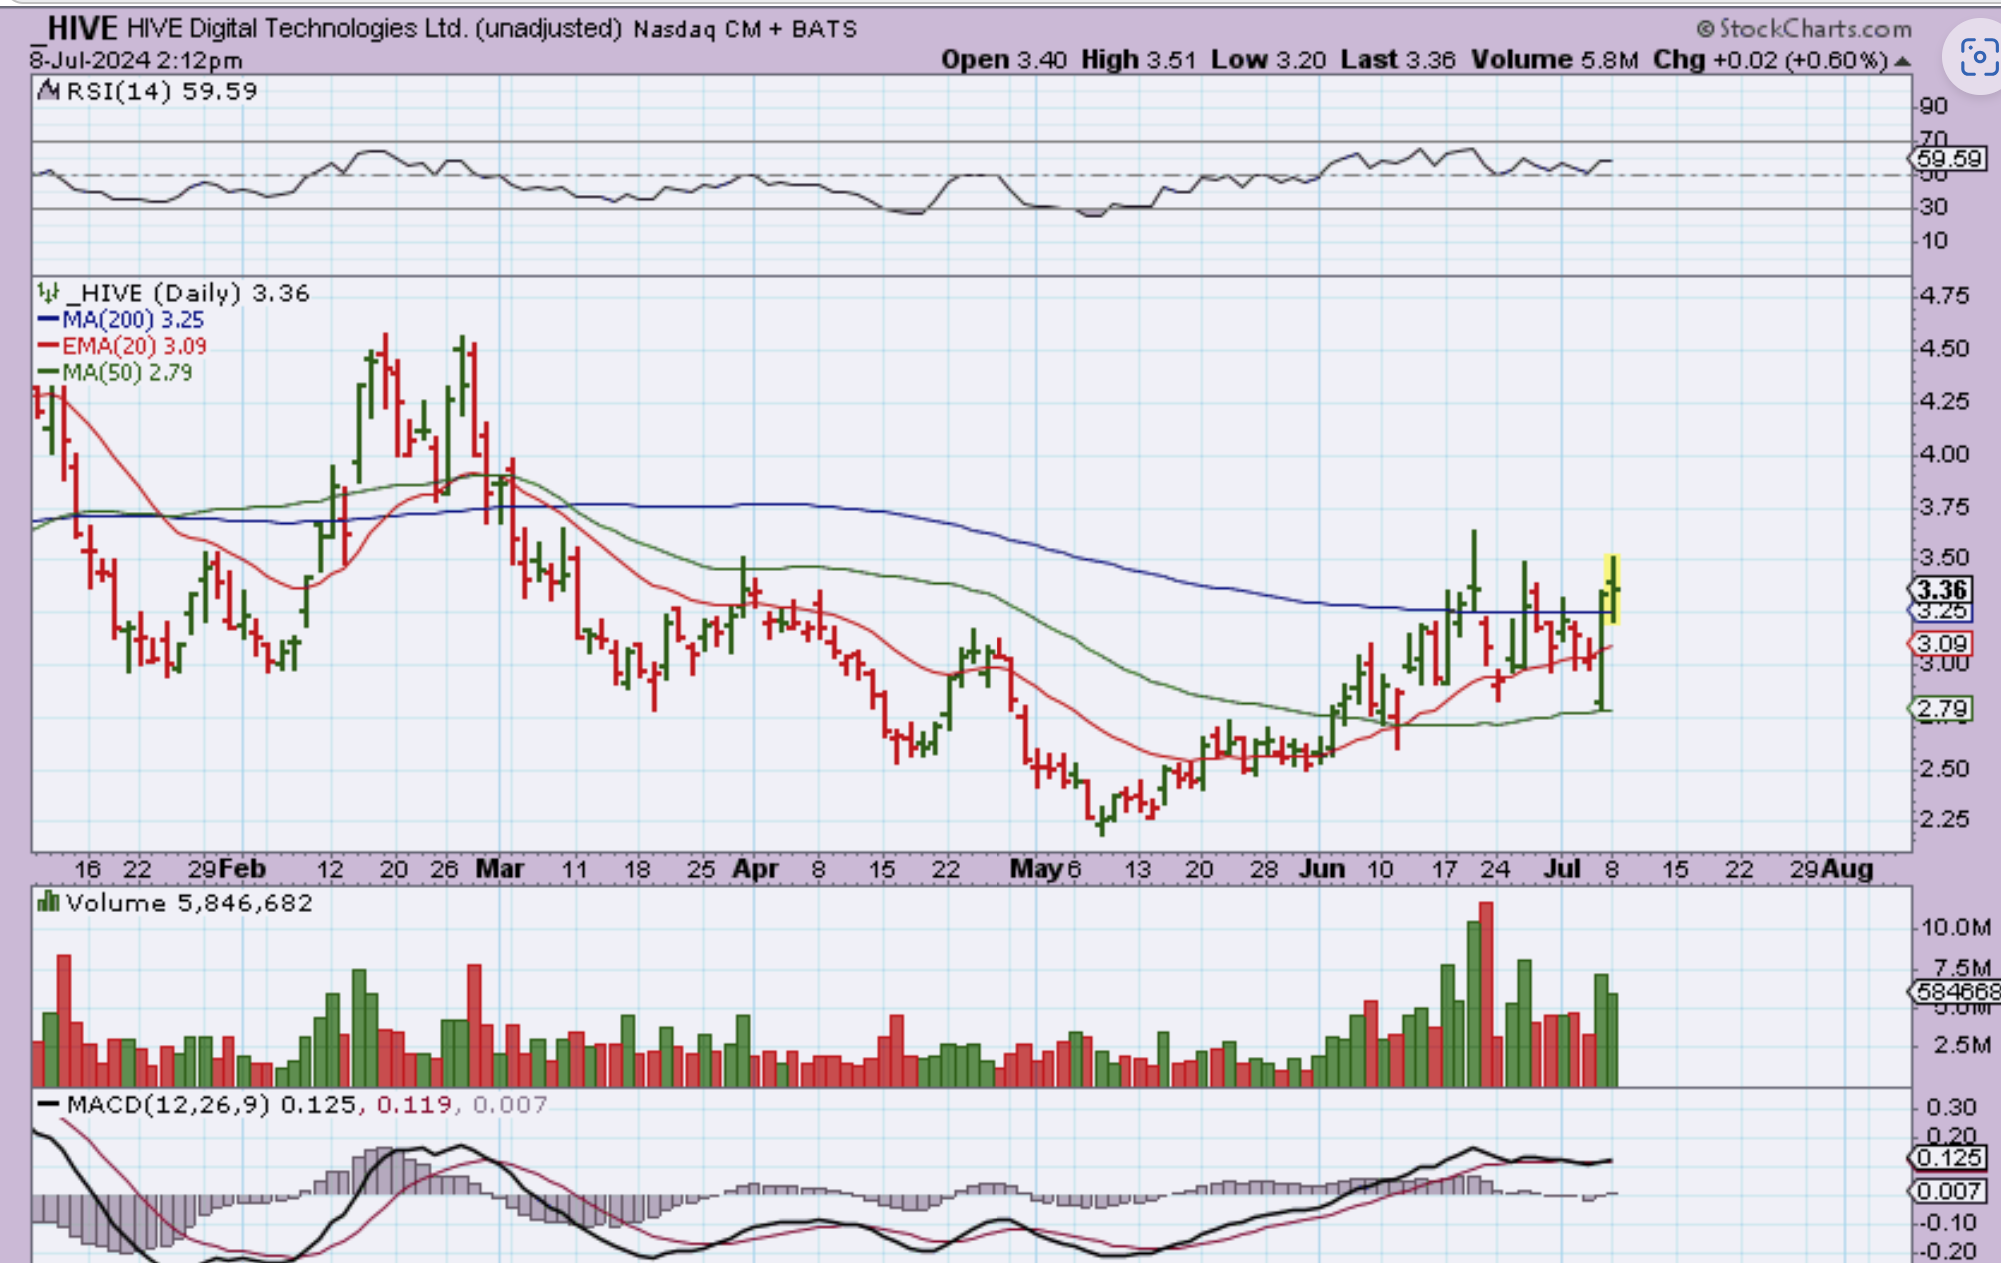
HIVE chopped sideways too, but volume is starting to come in and I think that it has a good chance of starting to run higher soon too. Especially if Bitcoin rises, because this sideways chop and rise up out of the May lows was done while Bitcoin dropped.
.
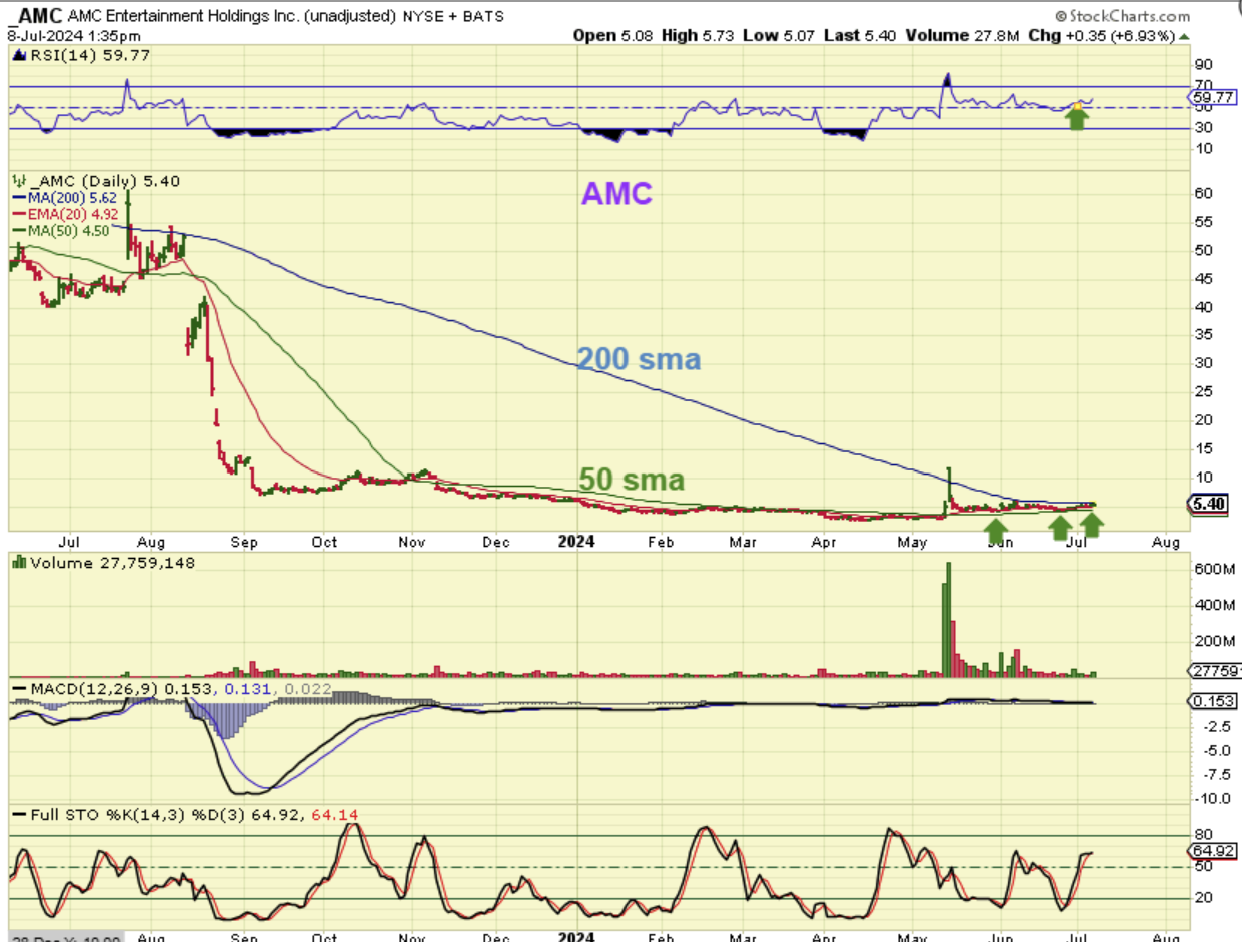
I wanted to point out Tech Stock AMC, because it has been moving sideways after a large 2 day surge. Now it is above the 50sma, but pinched in between the 50 & 200sma, and….
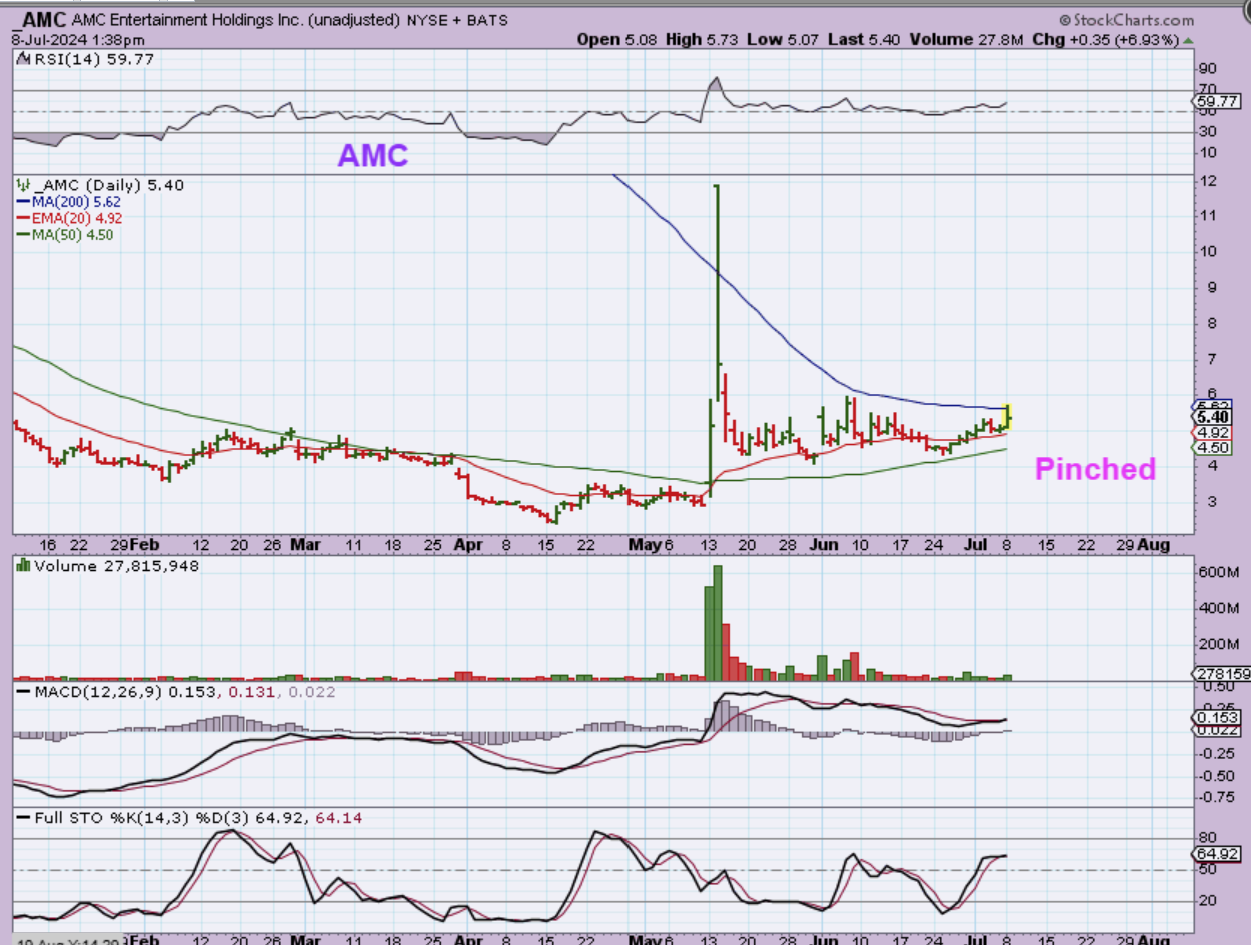
I took a look at the AMC bigger picture and the potential is very big, with recent moves up being accompanied by good volume. I like this set up, even for a small position.
..
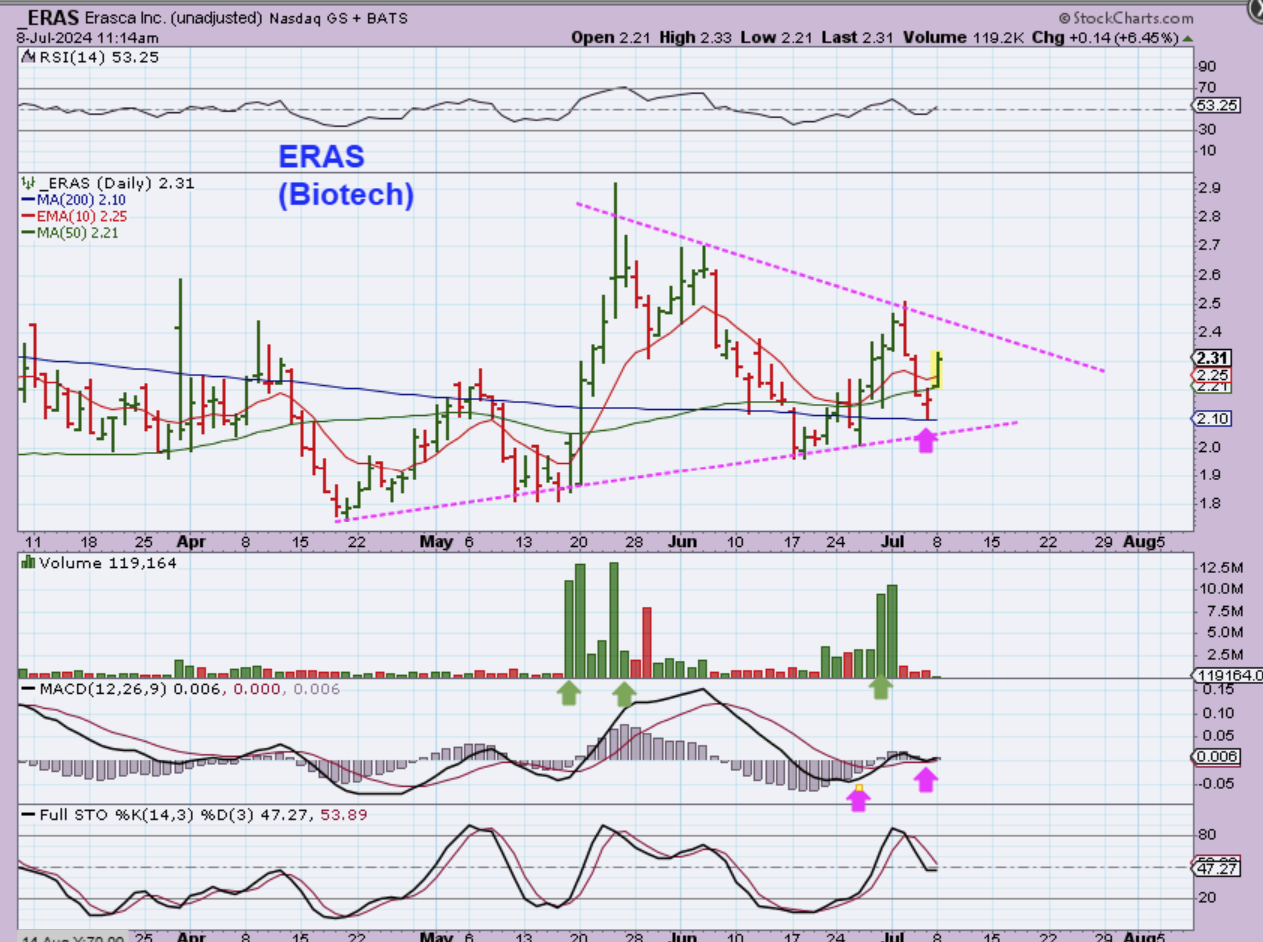
ERAS – I pointed out the volume and price pops in this biotech stock yesterday. It looks to be trending higher and it bounced off of the 200sma (blue line) Friday.
.
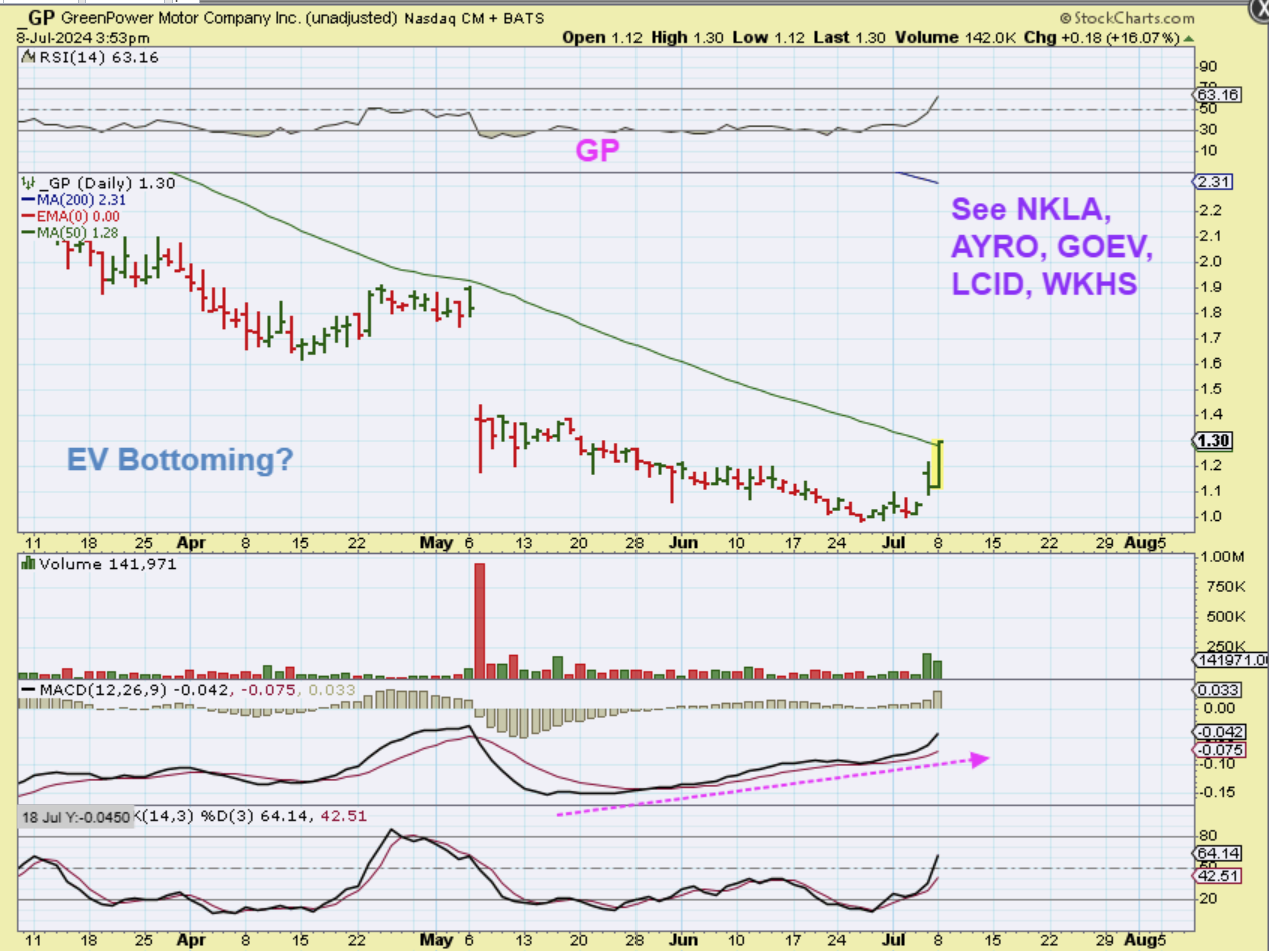
I then noticed several EV related stocks rising up out of bases and consolidations. This was GP and that pop was up 16%. Check out a few of the other ones listed here on the chart too. This sector may be waking up.
.
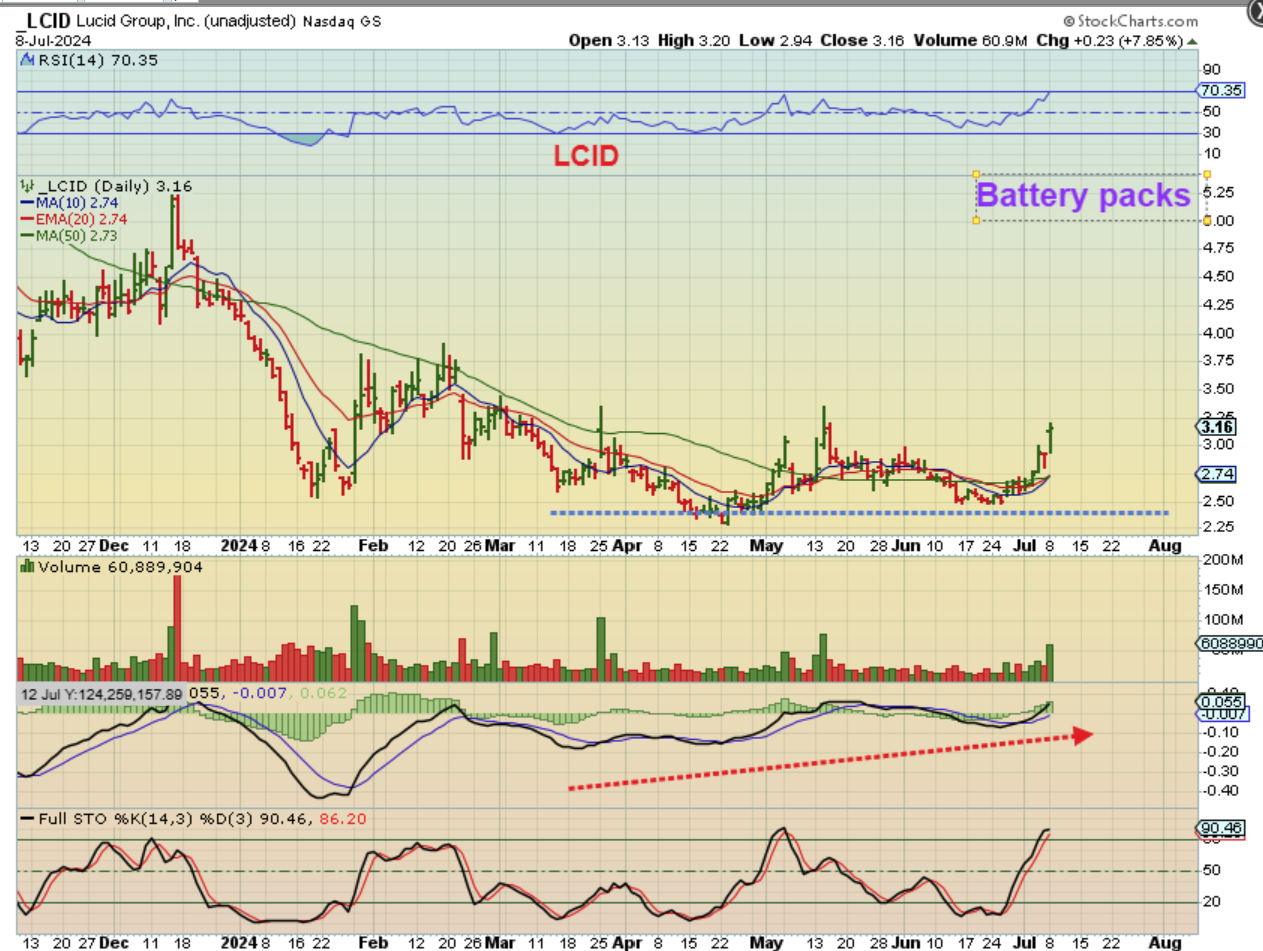
LCID provides battery packs and does deal with EV Cars. This is a nice base and volume seems to be behind the recent pops higher. The past 3 days have been good, so buy a dip or start a small position and then add as it works higher. It CAN continue to base out sideways, but it has the look that buyers are finding it and entering (Volume up).
.
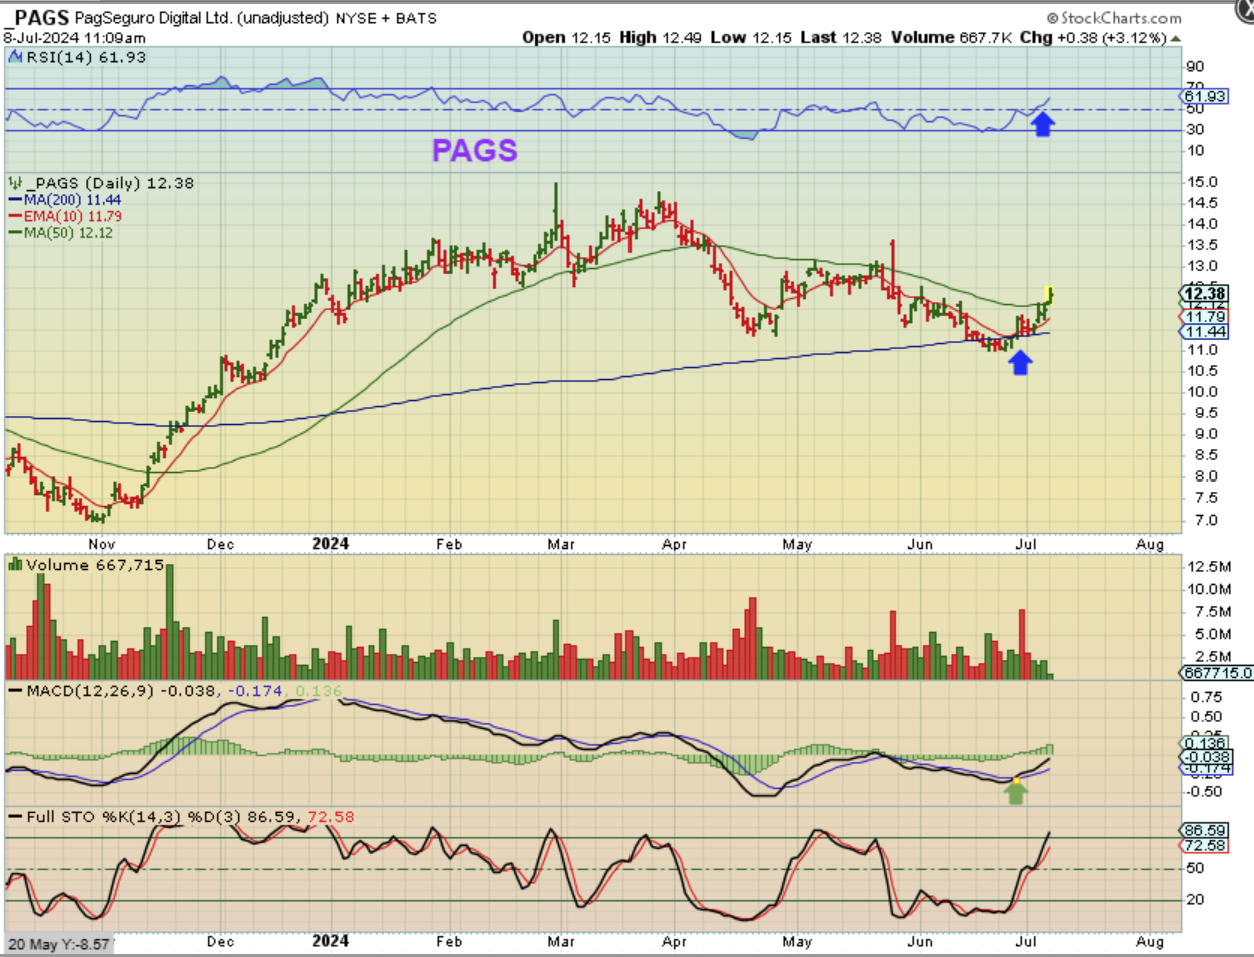
PAGS is a company that rallied very nicely November to March/April ($7 to $15) and then it started to consolidate and pulled back to the 200sma in an a-b-c type of a dip. It is now trying to regain the 50sma after that 200sma bounce and that is bullish price action. I look at that as a buy and hold candidate too, even though it has been choppy.