
Tuesday July 16th – What More Could We Ask For?
In the weekend report I mentioned that Fed Chair Powell was actually speaking on Monday. With all of the recent Data coming out showing that ‘inflation was cooling’, that raised a question:
Would Chairman Powell be honest & discuss a possible rate cut (?), or would he disappoint?
.
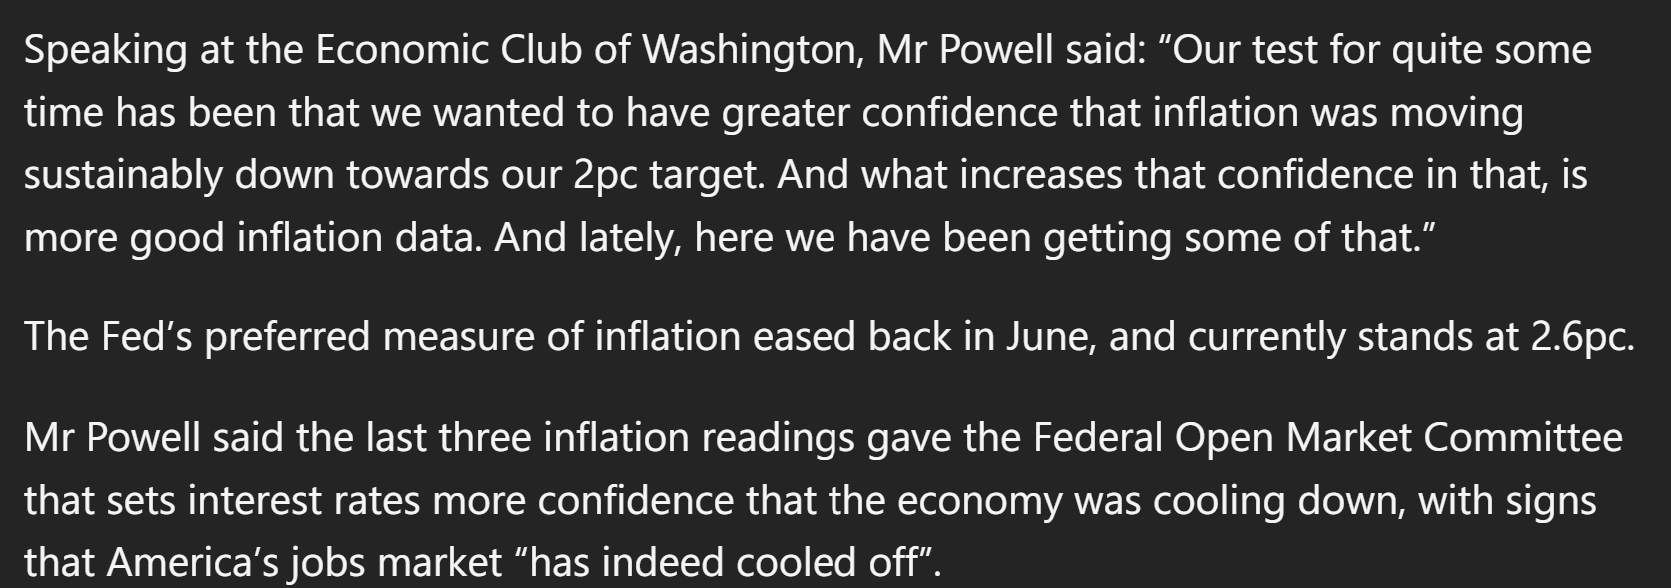
Did he disappoint? Actually, no I don’t think so. This was about as open as I have seen him be when it came to discussing a future Rate Cut.
.
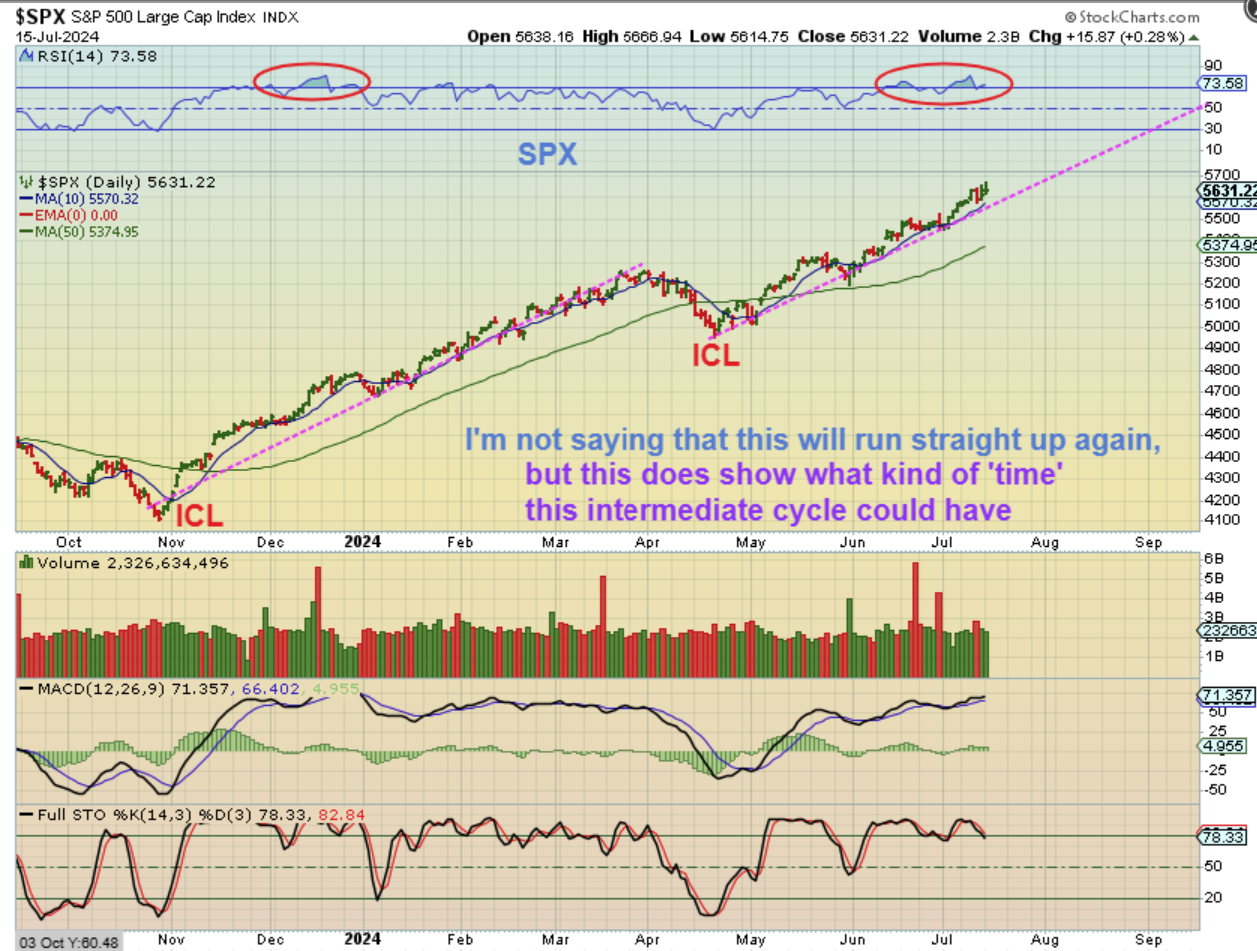
SPX – The markets have been strong and they are overbought, but they do still seem to want to continue to chug along higher. That is especially true with talks of a rate cut in September. Please read the chart.
.
Now take a look at what JPMorgans Feroli had to say.

.
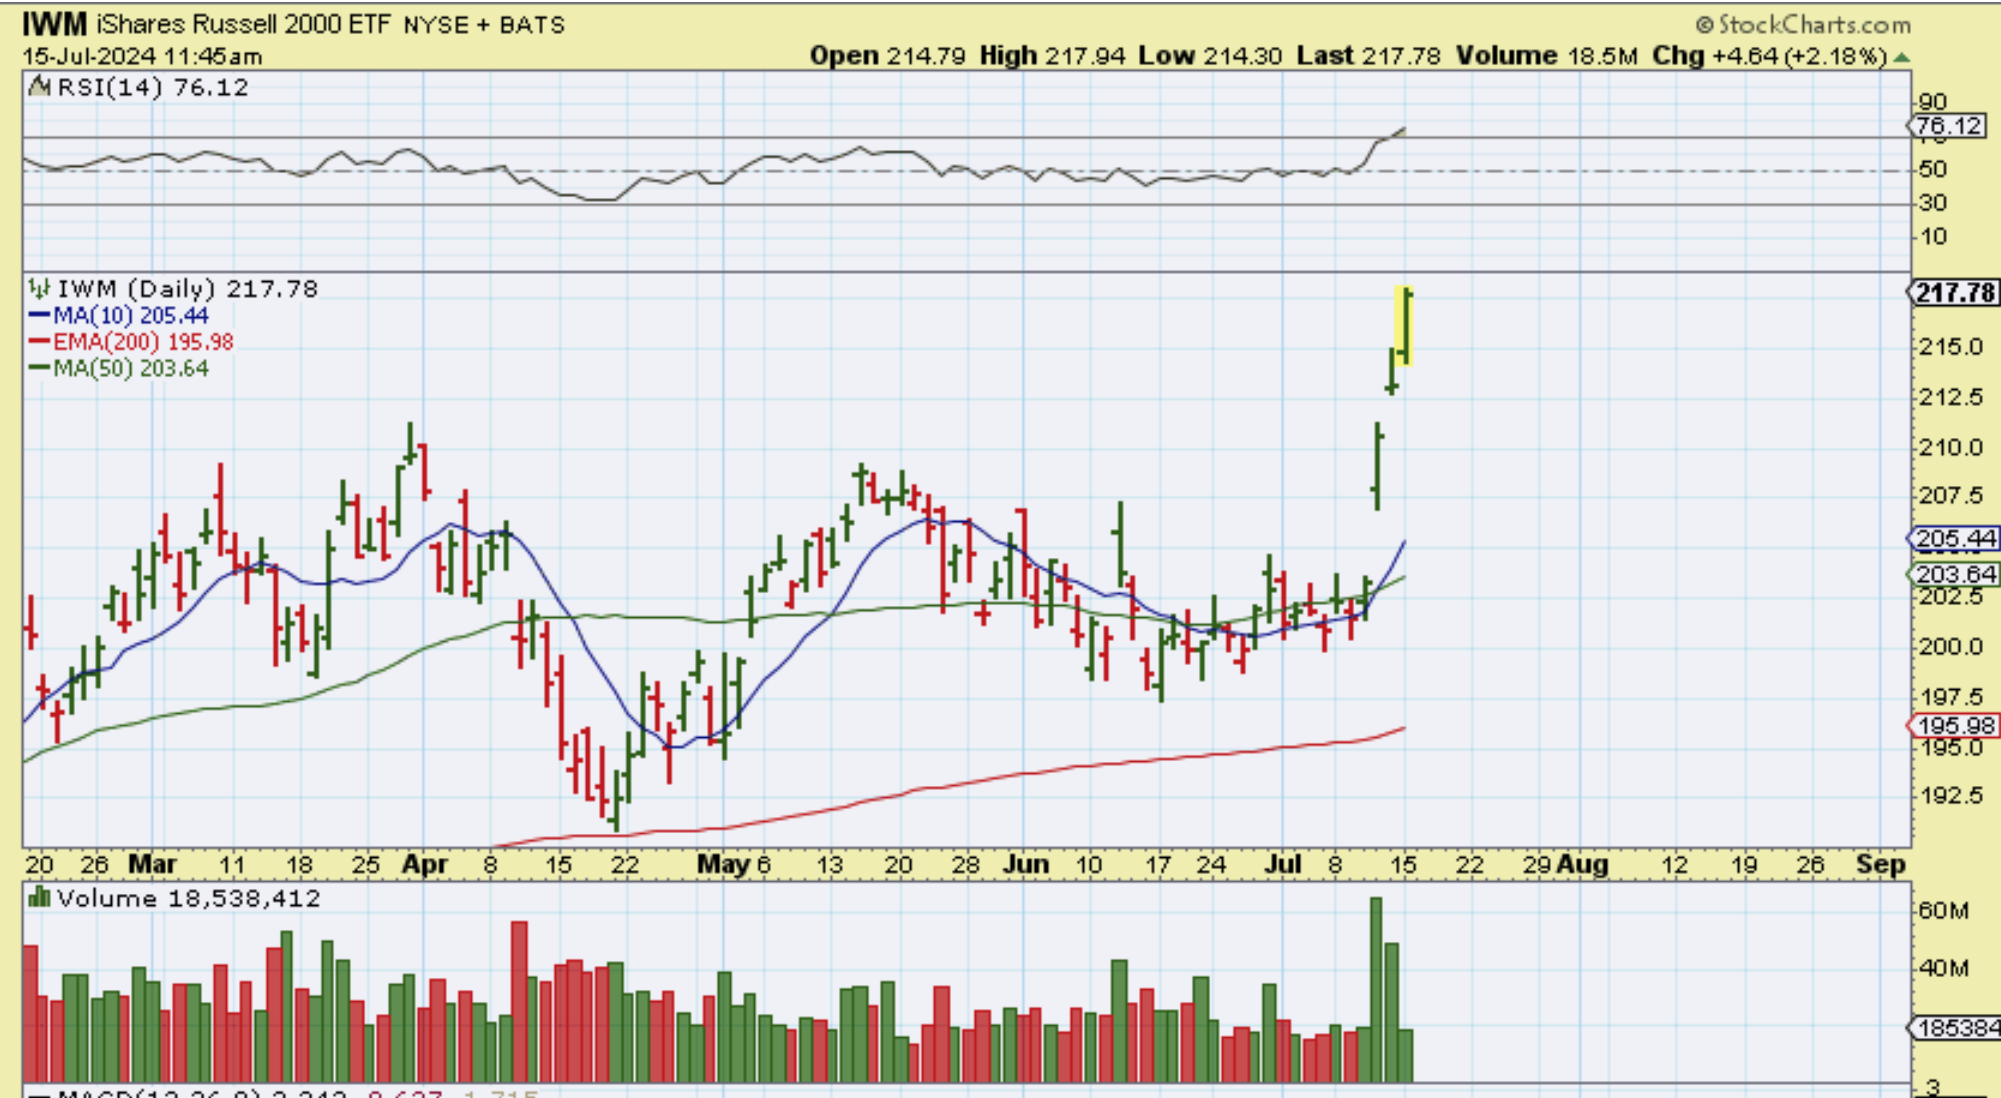
IWM – Wait! Wasn’t that a reversal candle Friday? Maybe not when Rate Cuts are on the table. Small Caps are now getting all of the love. This volume was as of 2 hrs of trading. I will discuss TRADES & TRADE SET UPS again, at the very end of the report.
.
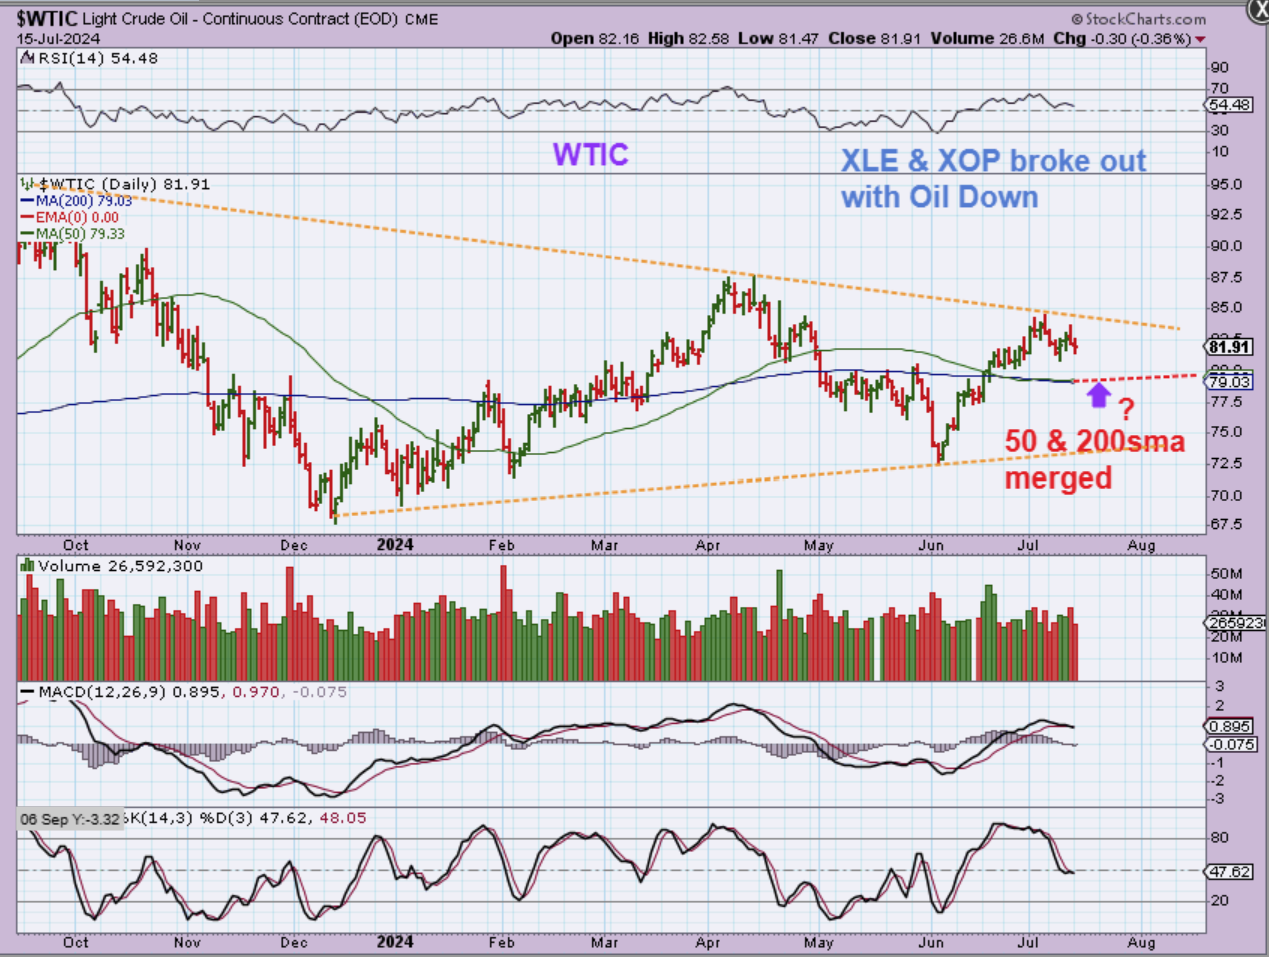
WTIC – Oil was doing well, but it got a bit choppy when it hit that overhead downtrend line. So Oil has been down for 2 days, but please read the chart.
.
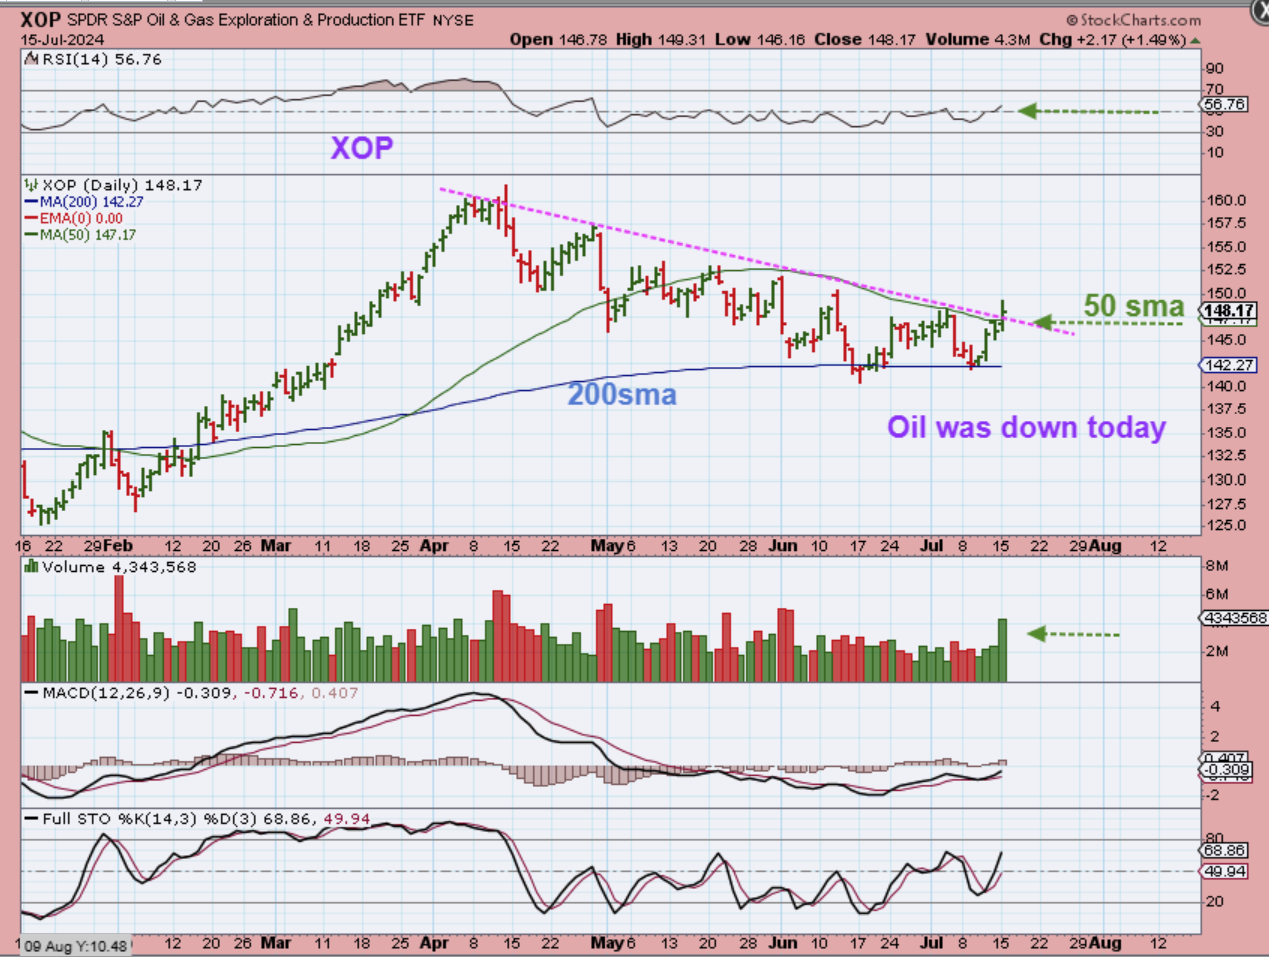
XOP – The Oil stocks are breaking out despite the fact that Oil was down on Friday and Monday.
.
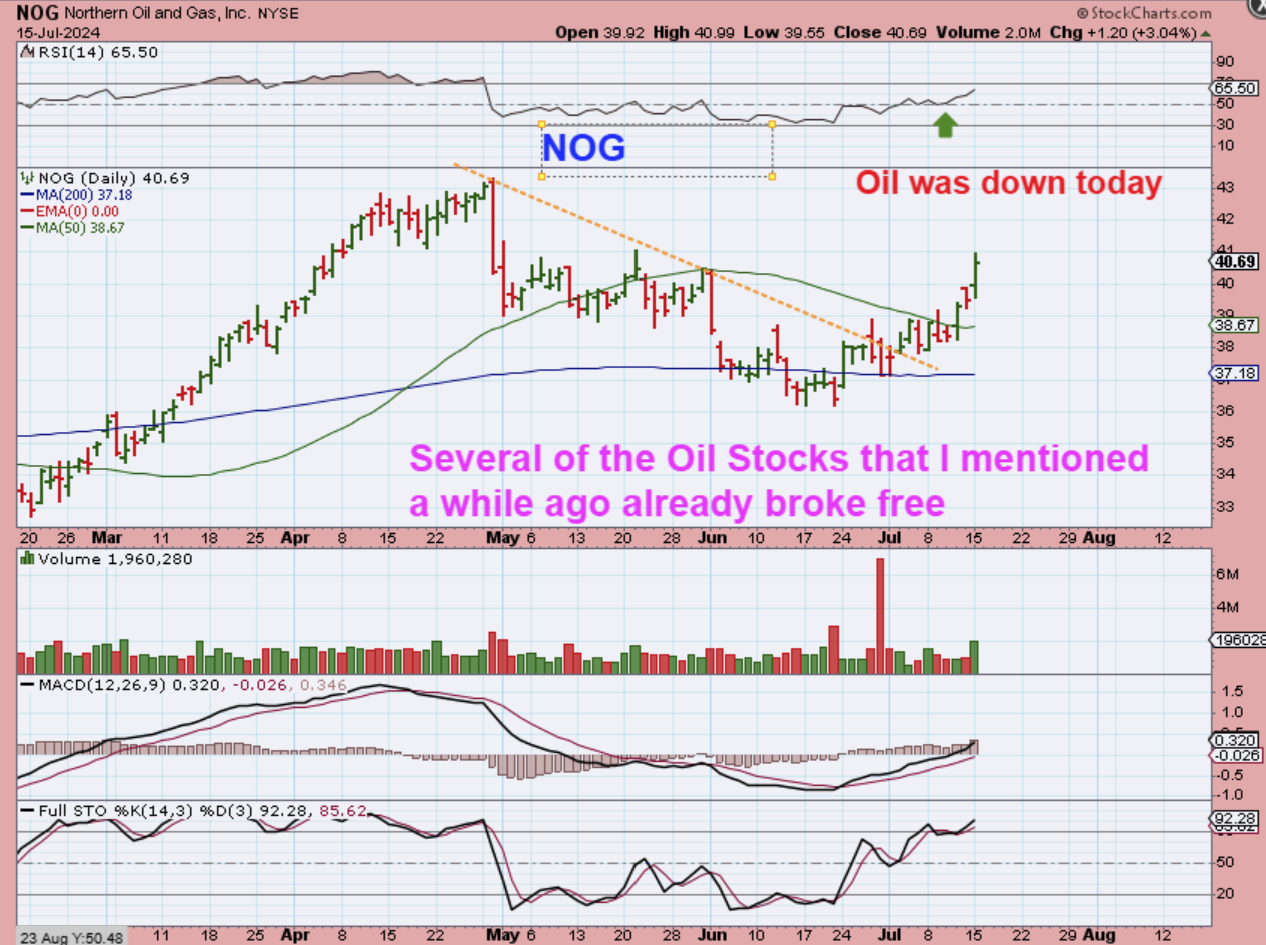
NOG – Some of the Oil Stocks that I mentioned are already moving higher. NOG, APA, OKE, WTI, etc are looking good, but also could still be bought on their way out of their bases. A couple of the other stocks like MRO, VET, VLO, etc are just moving higher now.
.
IN THE WEEKEND REPORT:
Do we currently have a bull triangle ICL? Maybe we do. This is NOT OVERBOUGHT. Let’s look at the bullish signs in what was supposed to be a 4th daily cycle. We might have a stealth ICL instead- a continuation of the Bull Run.
.
Notice that The Weekly RSI did turn up and volume spiked at a time when we expected weakness (4th daily cycle). We might wrongly conclude that the MACD is slightly divergent. I wouldn’t worry about that, since a back test usually corrects that later. I have pointed out in the past that triangles do form dcls in the apex at times when the strength does not allow for a weaker sell off to new lows. Does that work for ICLs too? This set up looks so bullish that I would not count it out. That volume last week was to be later in the 4th daily cycle, and that is showing strength. It seems that the weaker inflation / rate cut theme is winning.
.
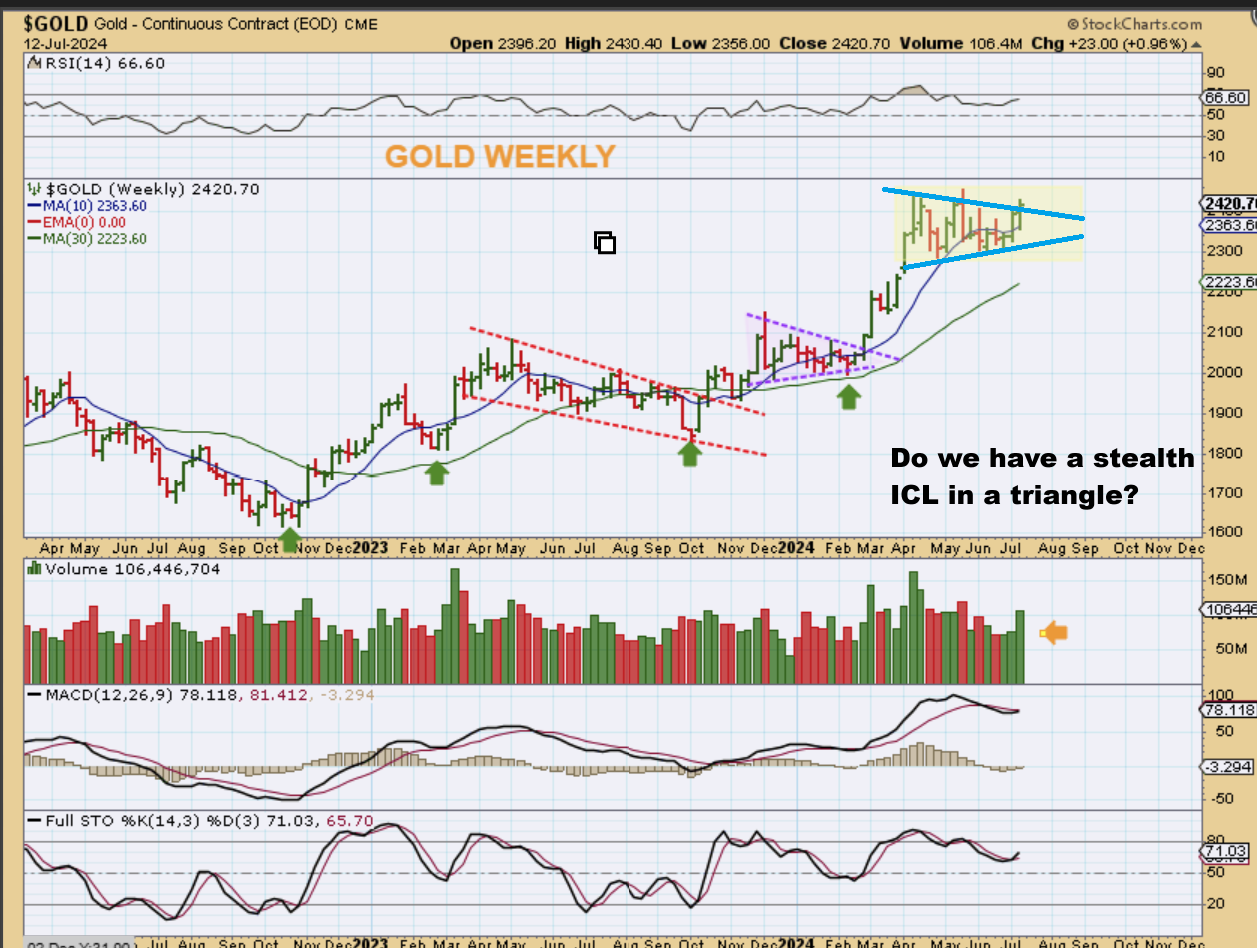
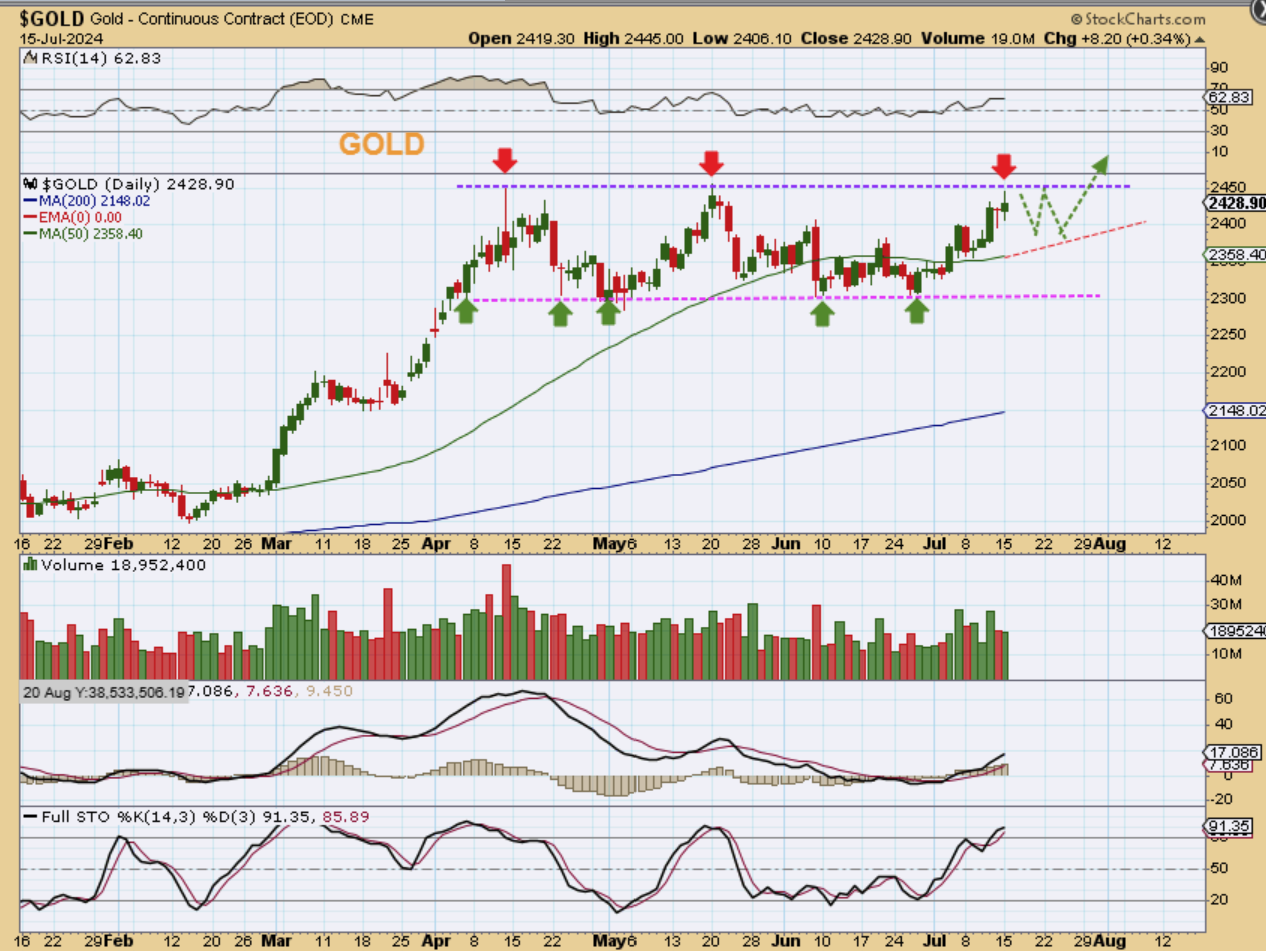
GOLD – On Monday we saw Gold continue higher to that upper line representing the ‘all-time’ highs. Gold then started to sell down, so it could pullback and then breakout or it may just go for it and breakout from here. This looks like day 23 out of that low, and we should not be seeing this kind of strength in a 4th daily cycle. The Feds talk of a rate cut 2 weeks ago boosted Gold as it was selling off to a new low.
.
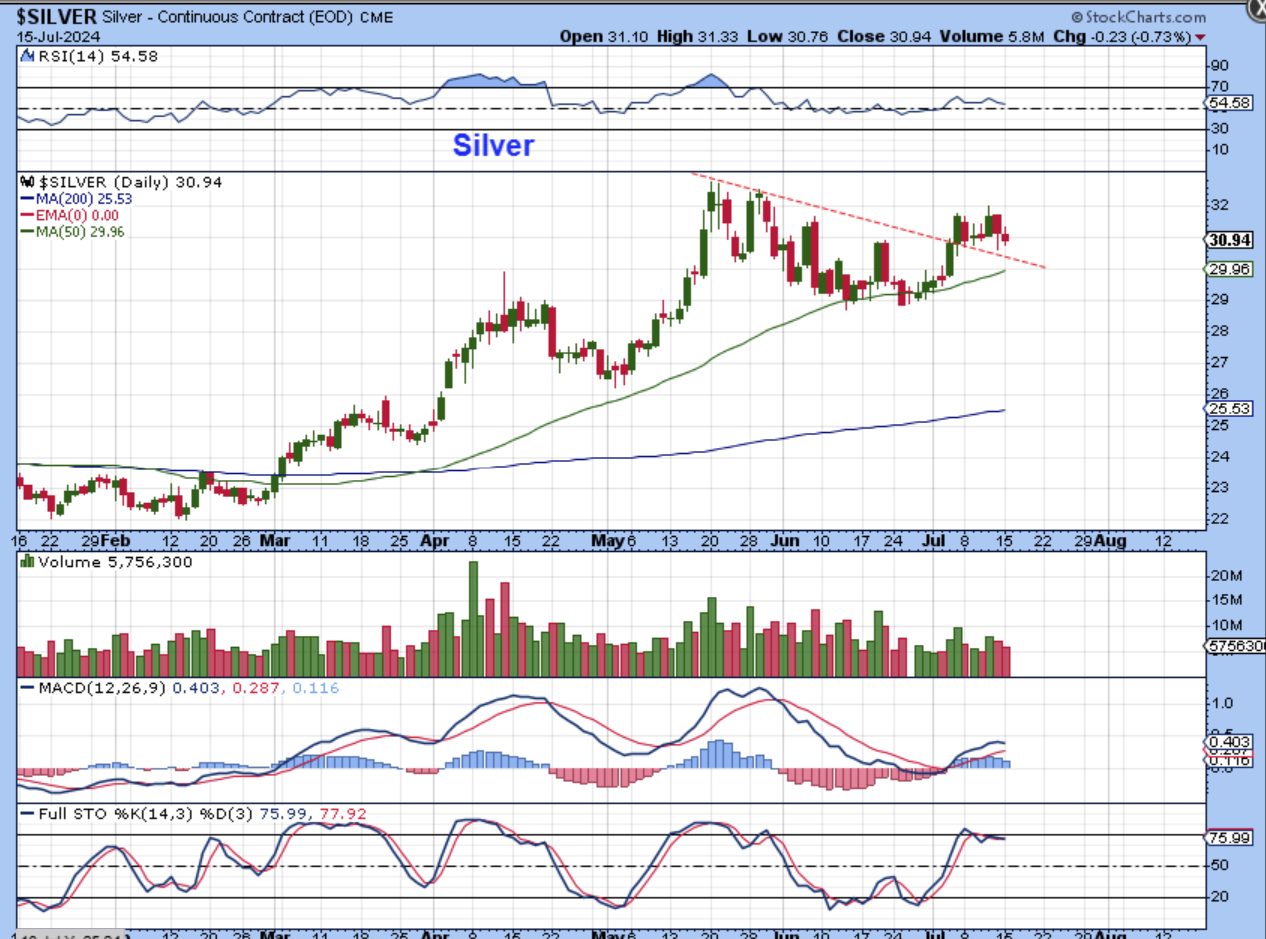
SILVER actually dropped yesterday, but this is a bullish set up too. We all know how Silver can move when it gets going, so a little sideways chop here is normal and it actually looks like a back test.
.
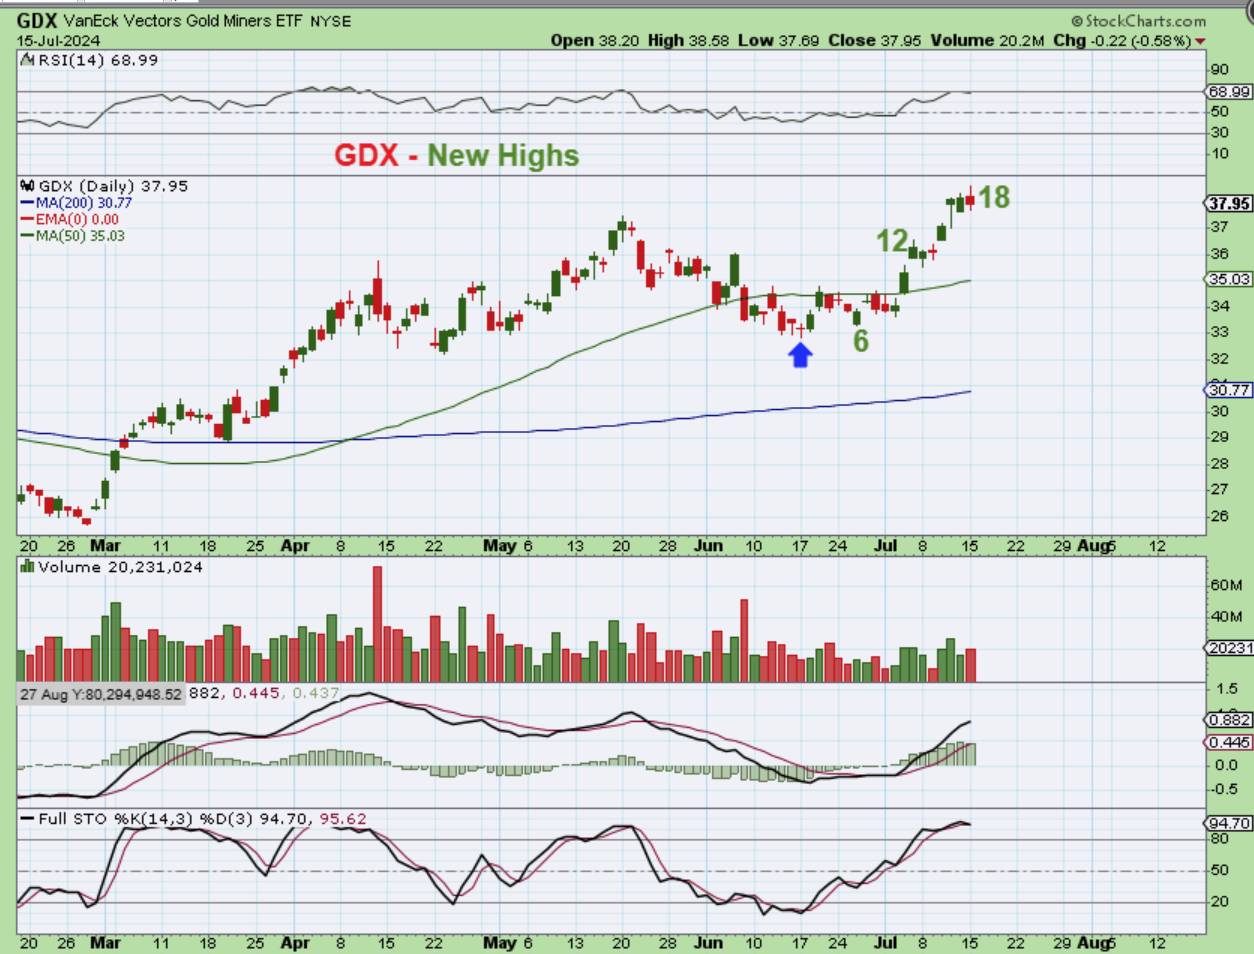
GDX made new highs and that says a lot. The Miners actually looked to have more of a sell off to new lows, because they were leading the way lower. Now they are quickly leading the way higher.
.
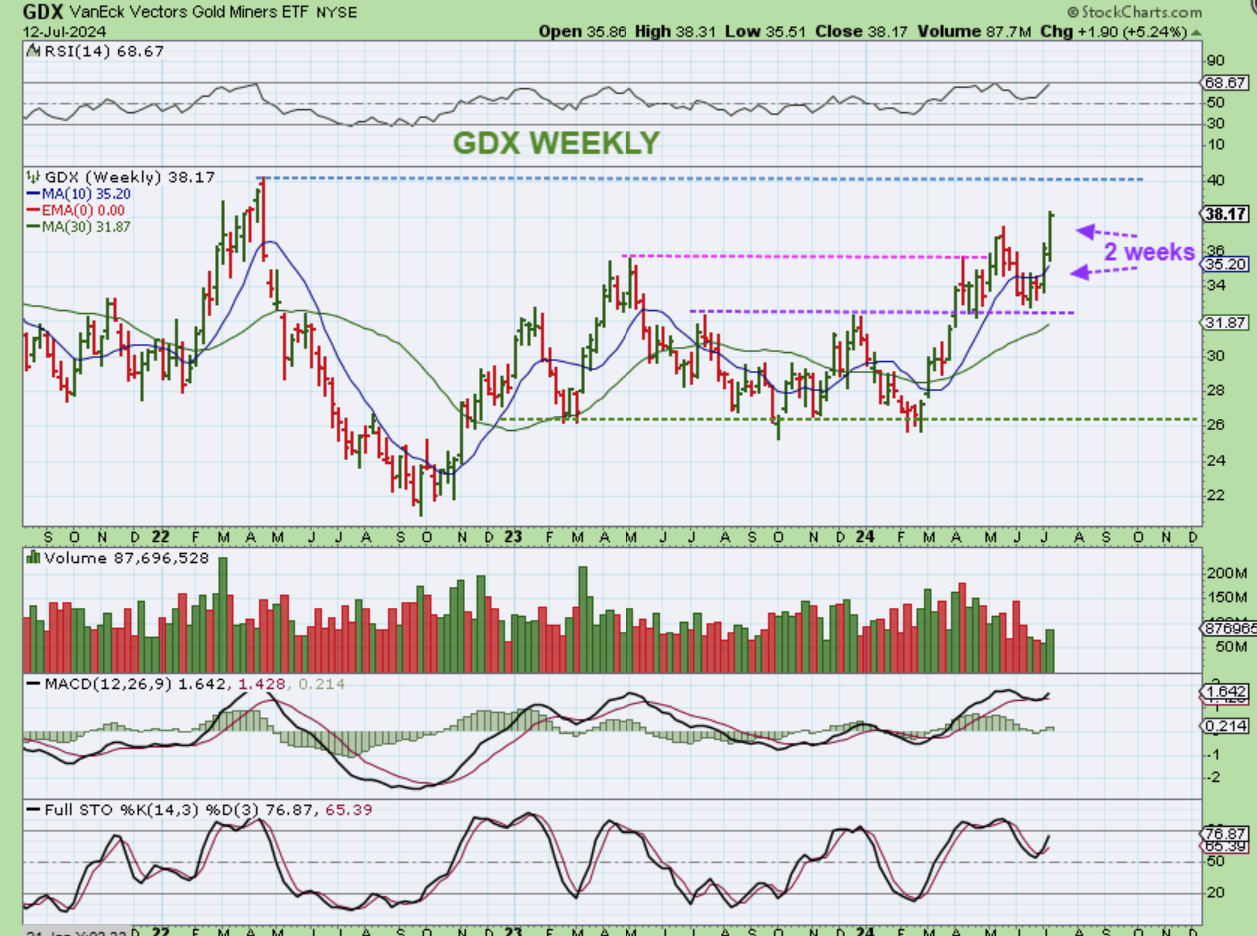
THE WEEKLY GDX CHART FROM THE WEEKEND REPORT SAYS IT ALL:
.
GDX was obviously not feeling the ‘ I’m in a weak 4th daily cycle’. It sold off for 5 weeks and now you can see that ever since the Fed & data supported a September rate cut 2 weeks ago, Miners took off higher and last week they broke to new highs. I had mentioned several of the downtrend breakouts at that time and said that sometimes you just can’t argue with the charts. You need to buy (maybe start small) and use stops just in case it runs away. Many miners have done well over the past 2 weeks, some are still lagging.
.
We do still have a slightly mixed look to the individual miners though, so you can add on a dip with some of the laggers (or just buy into strength). Let me show you 2 examples:…
.
NG -Some Miners are breaking to new highs, and this is Nova Gold doing that on Monday, but…
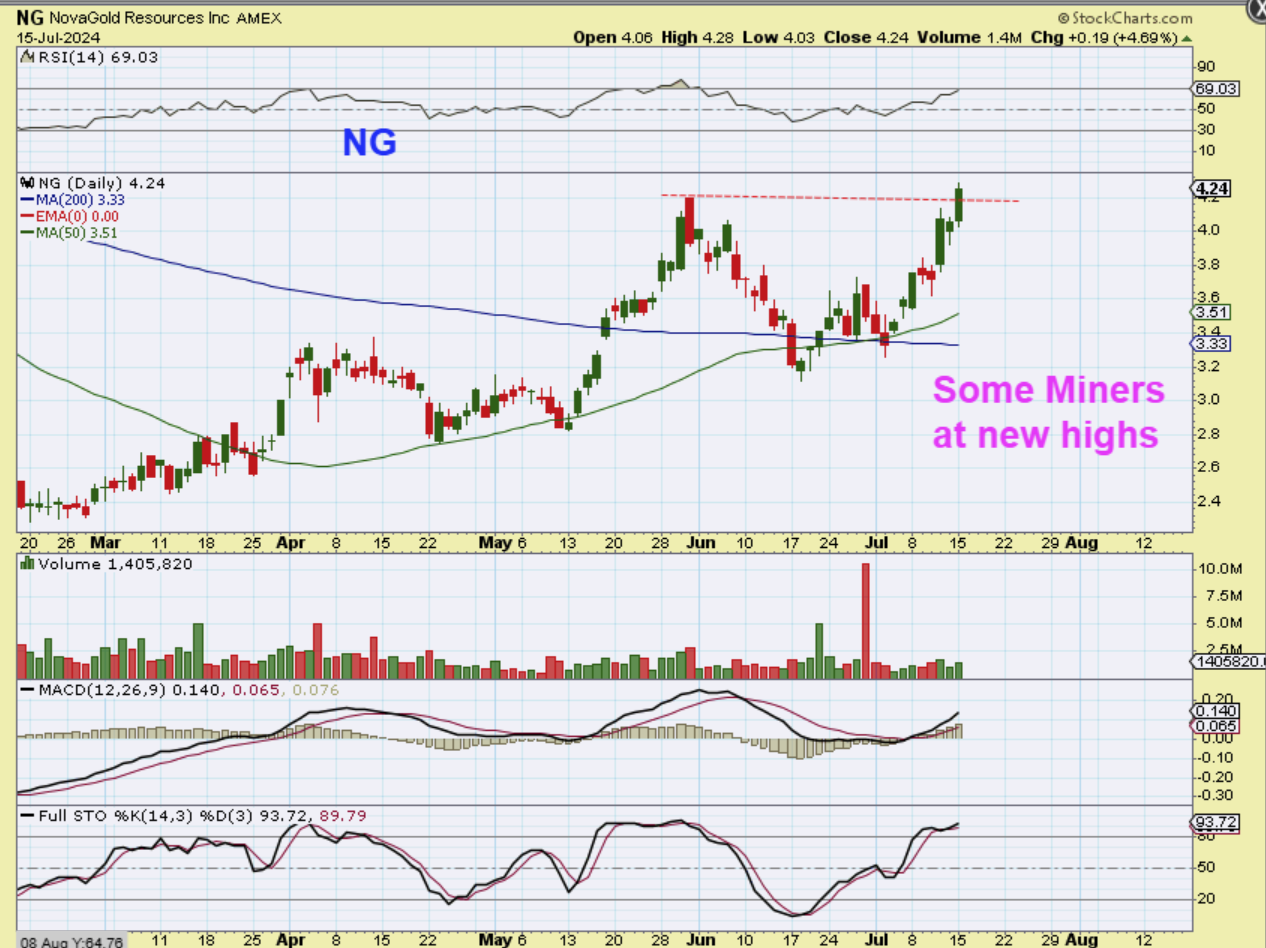
.
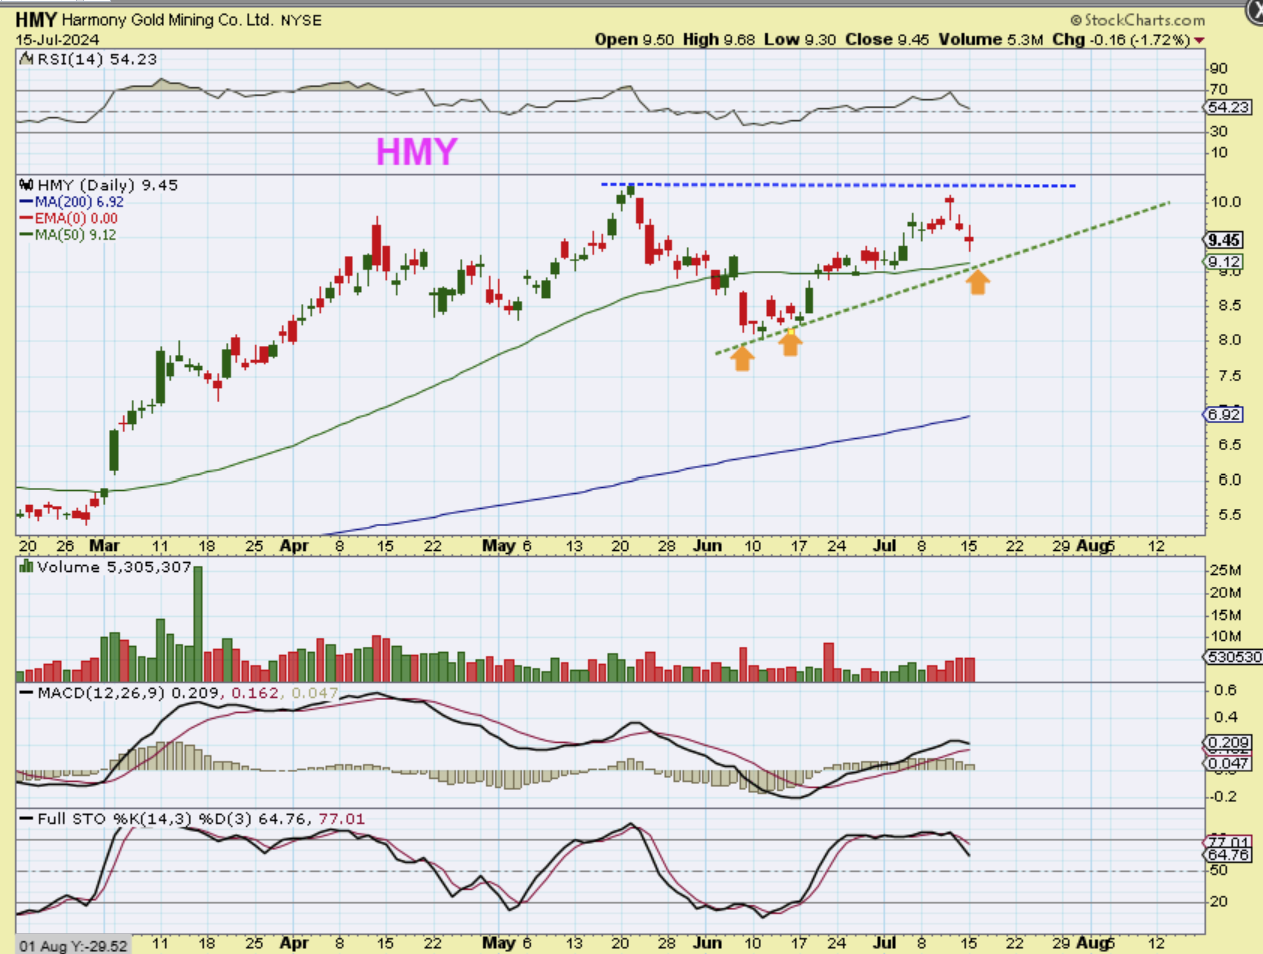
HMY: Surprisingly, some of the former ‘Leaders’ are pulling back a bit, instead of making new highs. This dip isn’t a big concern, but it shows that we basically have a mixed market in the very short term. Overall, these are all bullish set ups in the long term. Buy The Dips at support?
.
Well, as was mentioned at the opening of this report, Chairman Powell spoke yesterday and he finally openly discussed that inflation is cooling off to the point where a rate cut would be needed to slow things down. The Fed have been discussing a target number of 2% and they’ve mentioned that a cut would be needed BEFORE it gets there, or they’d overshoot that target. The markets have loved the idea of a rate cut and it looks like one is coming in September. Above and below, we have another Bullish report, so let’s see what Tuesday brings our way. Bitcoin & the Crypto-related stocks also surged higher on Monday, so I’ll discuss that below along with a few other bullish ideas (EV, MJ).
.
Enjoy your Tuesday trading!
.
~ALEX
.
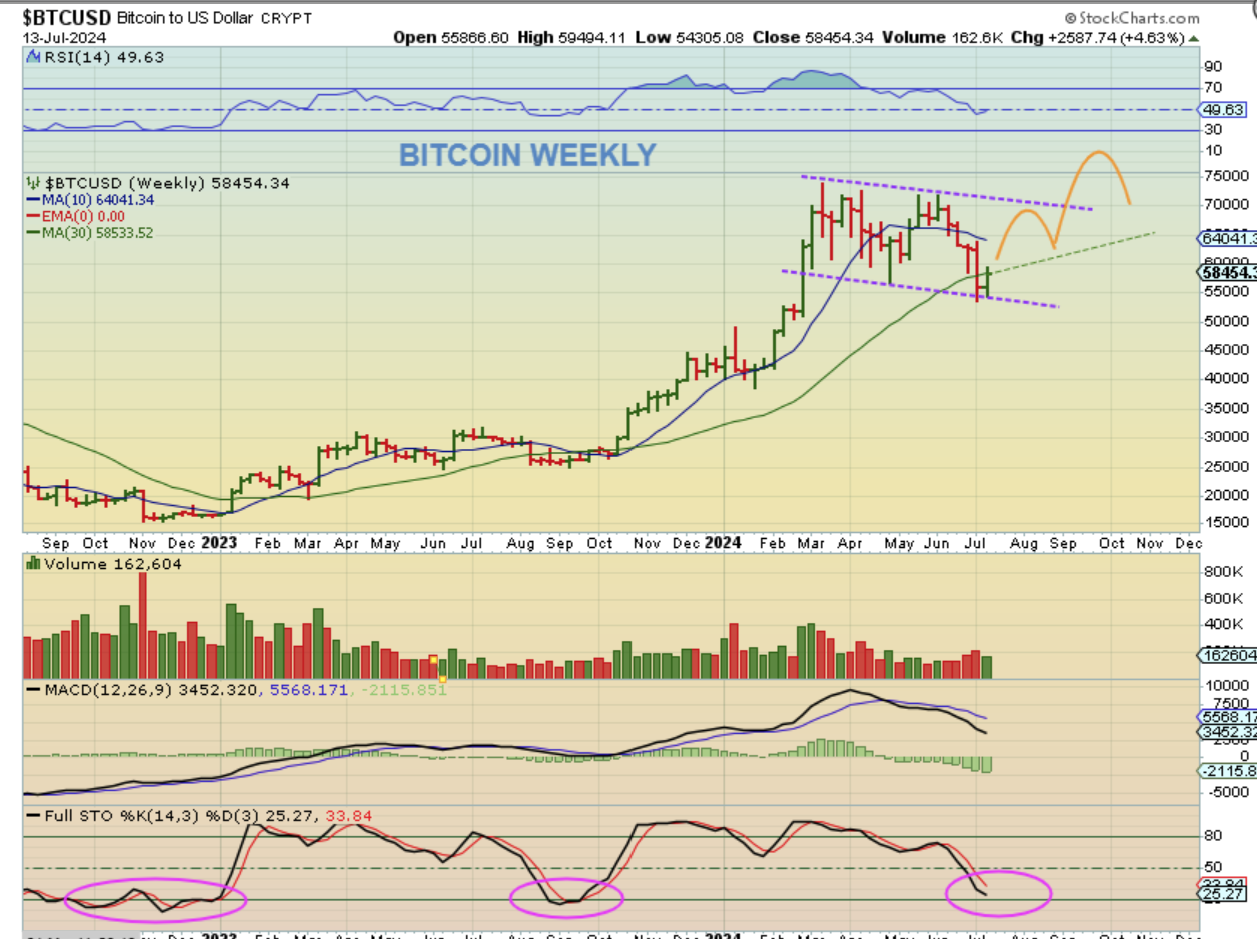
This weekends report mentioned this:
BITCOIN WEEKLY – Bitcoin was due for a low and I had marked one on day 65 last week. We now have a weekly reversal at the lows and this SHOULD push higher for a while. I have drawn a bullish outcome possibility. The good news is that the Crypto Miners FINALLY started to rally on Friday and they did NOT give it back this time, so MAYBE we have the lows in place for the stocks too, and those crypto related stocks will be a little more consistent.
.
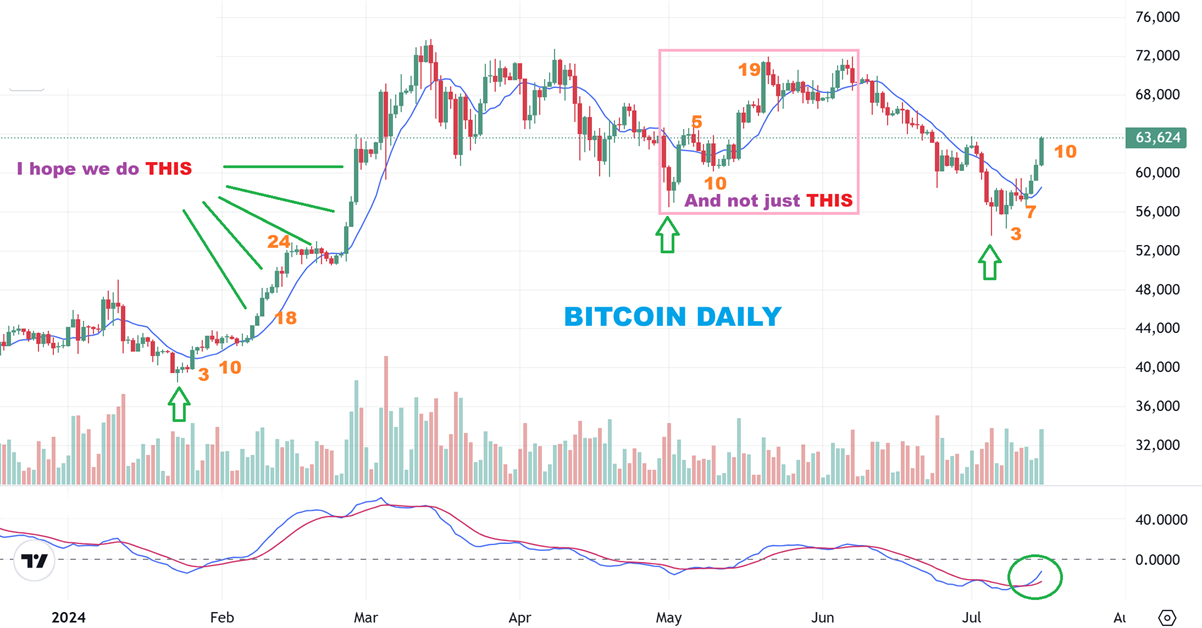
BITCOIN started to surge on Monday and we are only on day 10.
I wanted to put down the count out of the last 2 ICLs, to show you how much more time is left after day 10. This is early, even if we start to dip lower. The only question here is will this now just rocket higher like that move out of the January ICL after day 10? Or will we be a bit more choppy and restricted, like the move out of the May ICL. Time will tell, but either way, this still looks like a good place to buy, if you didn’t buy a basket last week or the week before. These crypto stocks can double in weeks if they do start trending.
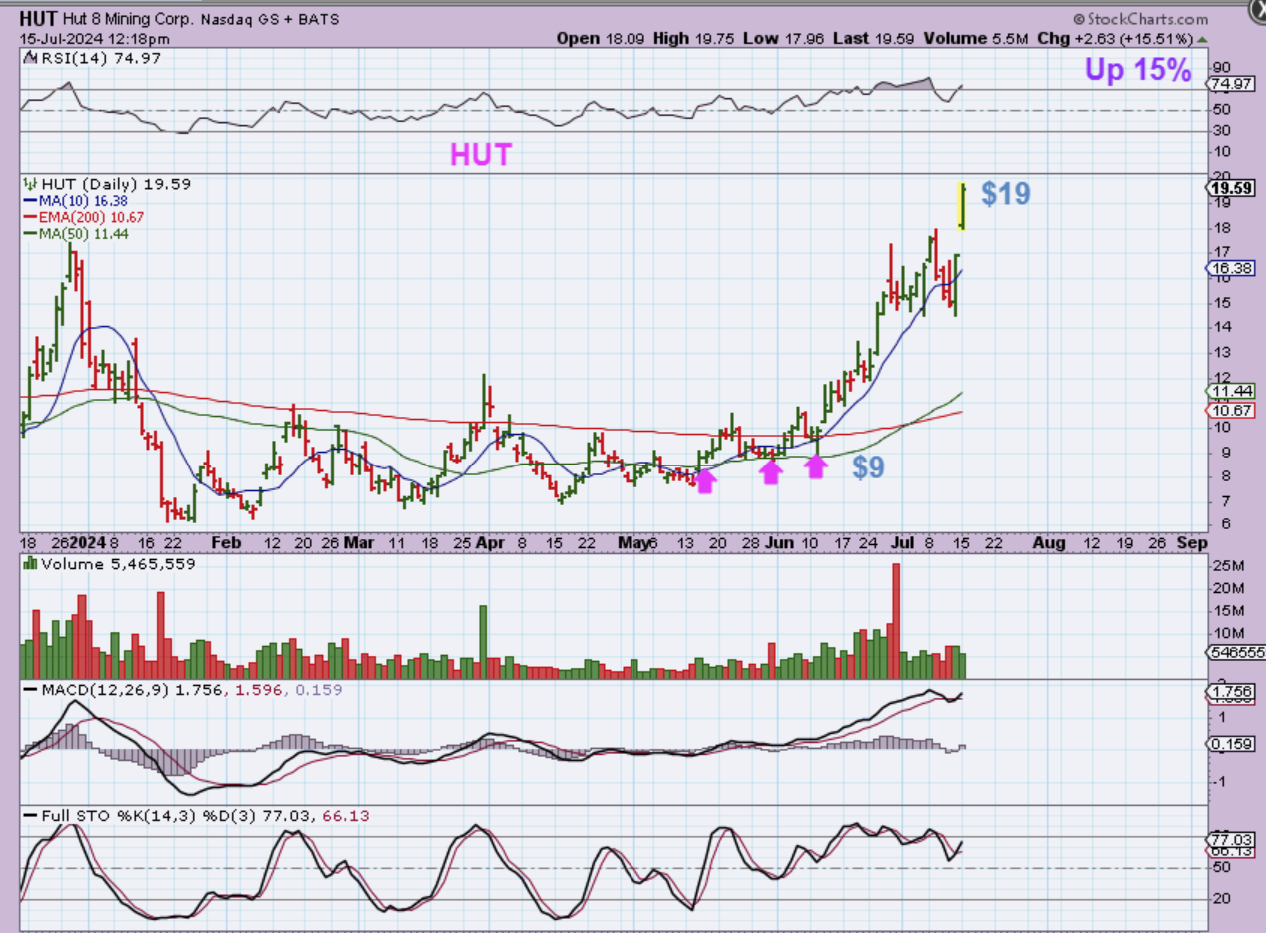
HUT is a good example of that.
HUT ran recently and after leaving that base behind, it trended higher to over 100% gains. We rode HUT, IREN, WULF and a couple of others for either part of these gains or all of the gains. I’m showing you this because…
.
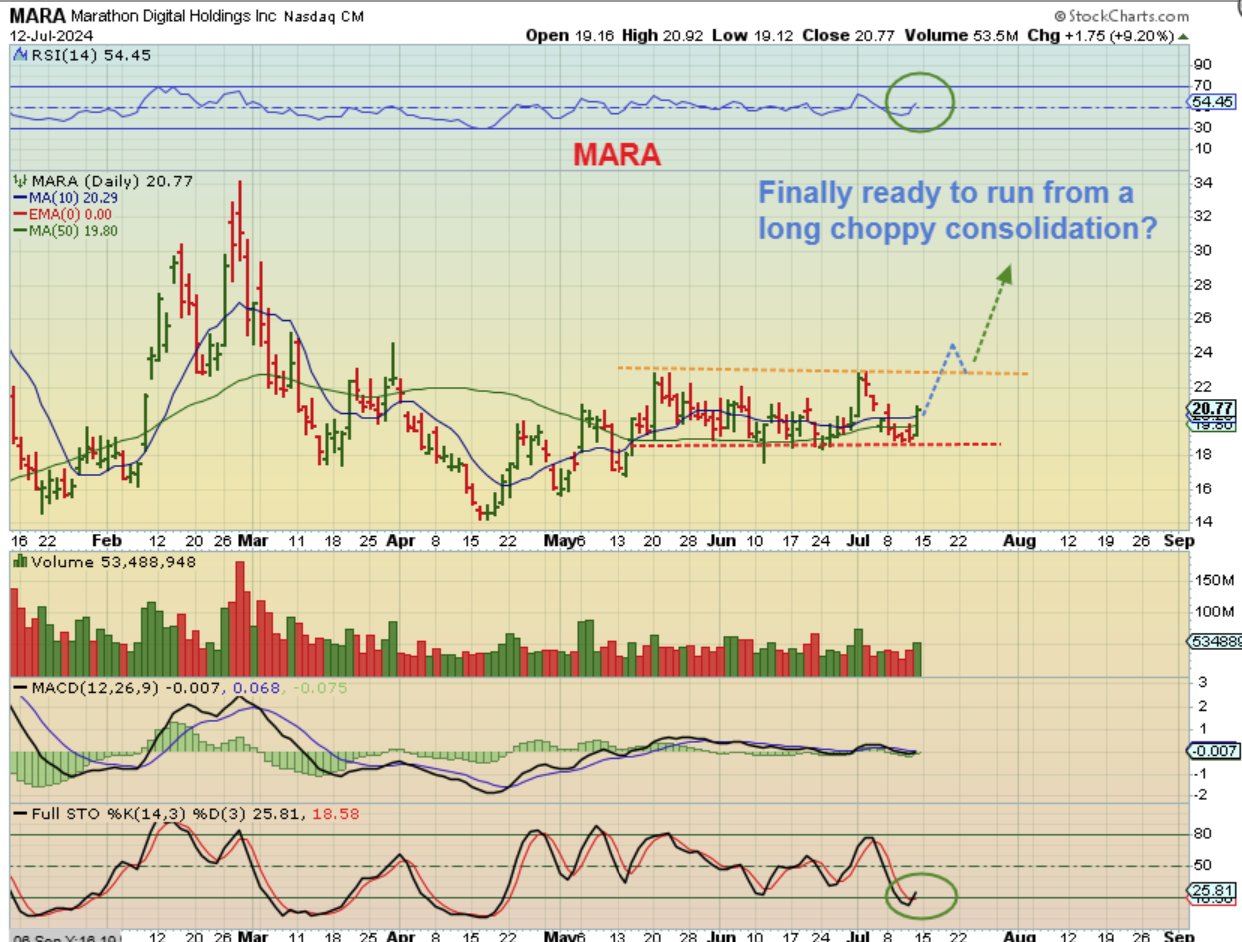
I’m showing you HUT because MARA has a base much like Hut did. I had this in the weekend report…
.
MARA – Up 9%. Crypto Miners FINALLY started to rally on Friday and they did NOT give it back this time, so maybe well see follow through and make some good gains in this sector again.
.
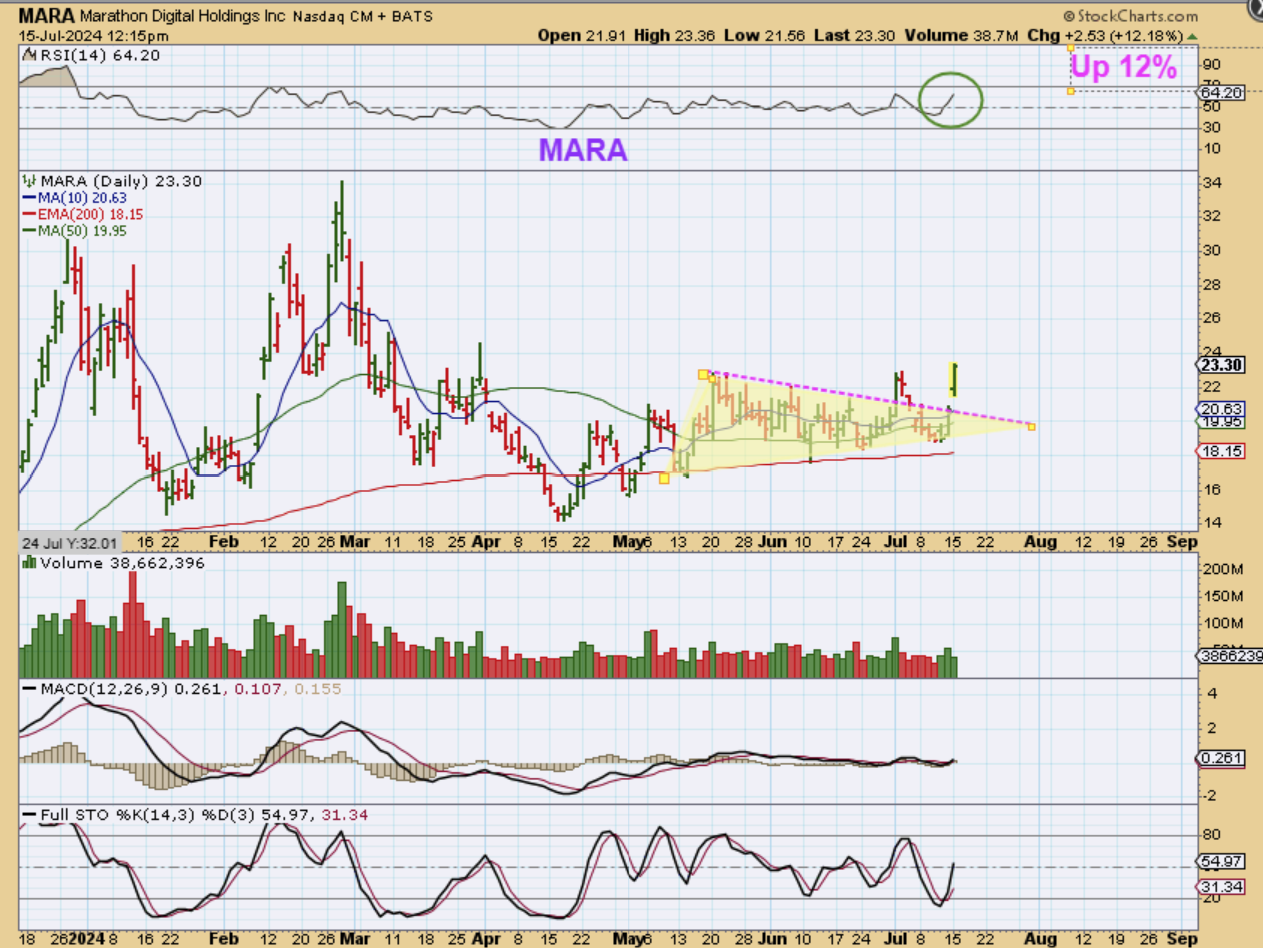
MARA MONDAY July 15th
MARA is trying to break from that base. Some of the ones that are still chopping at the lows are now looking ready to break out. They also could start a run or a trending move higher from here. This chart was captured midday, but MARA went on to close up almost 20% at $24.58. It is starting to look like HUT when it broke out.
.
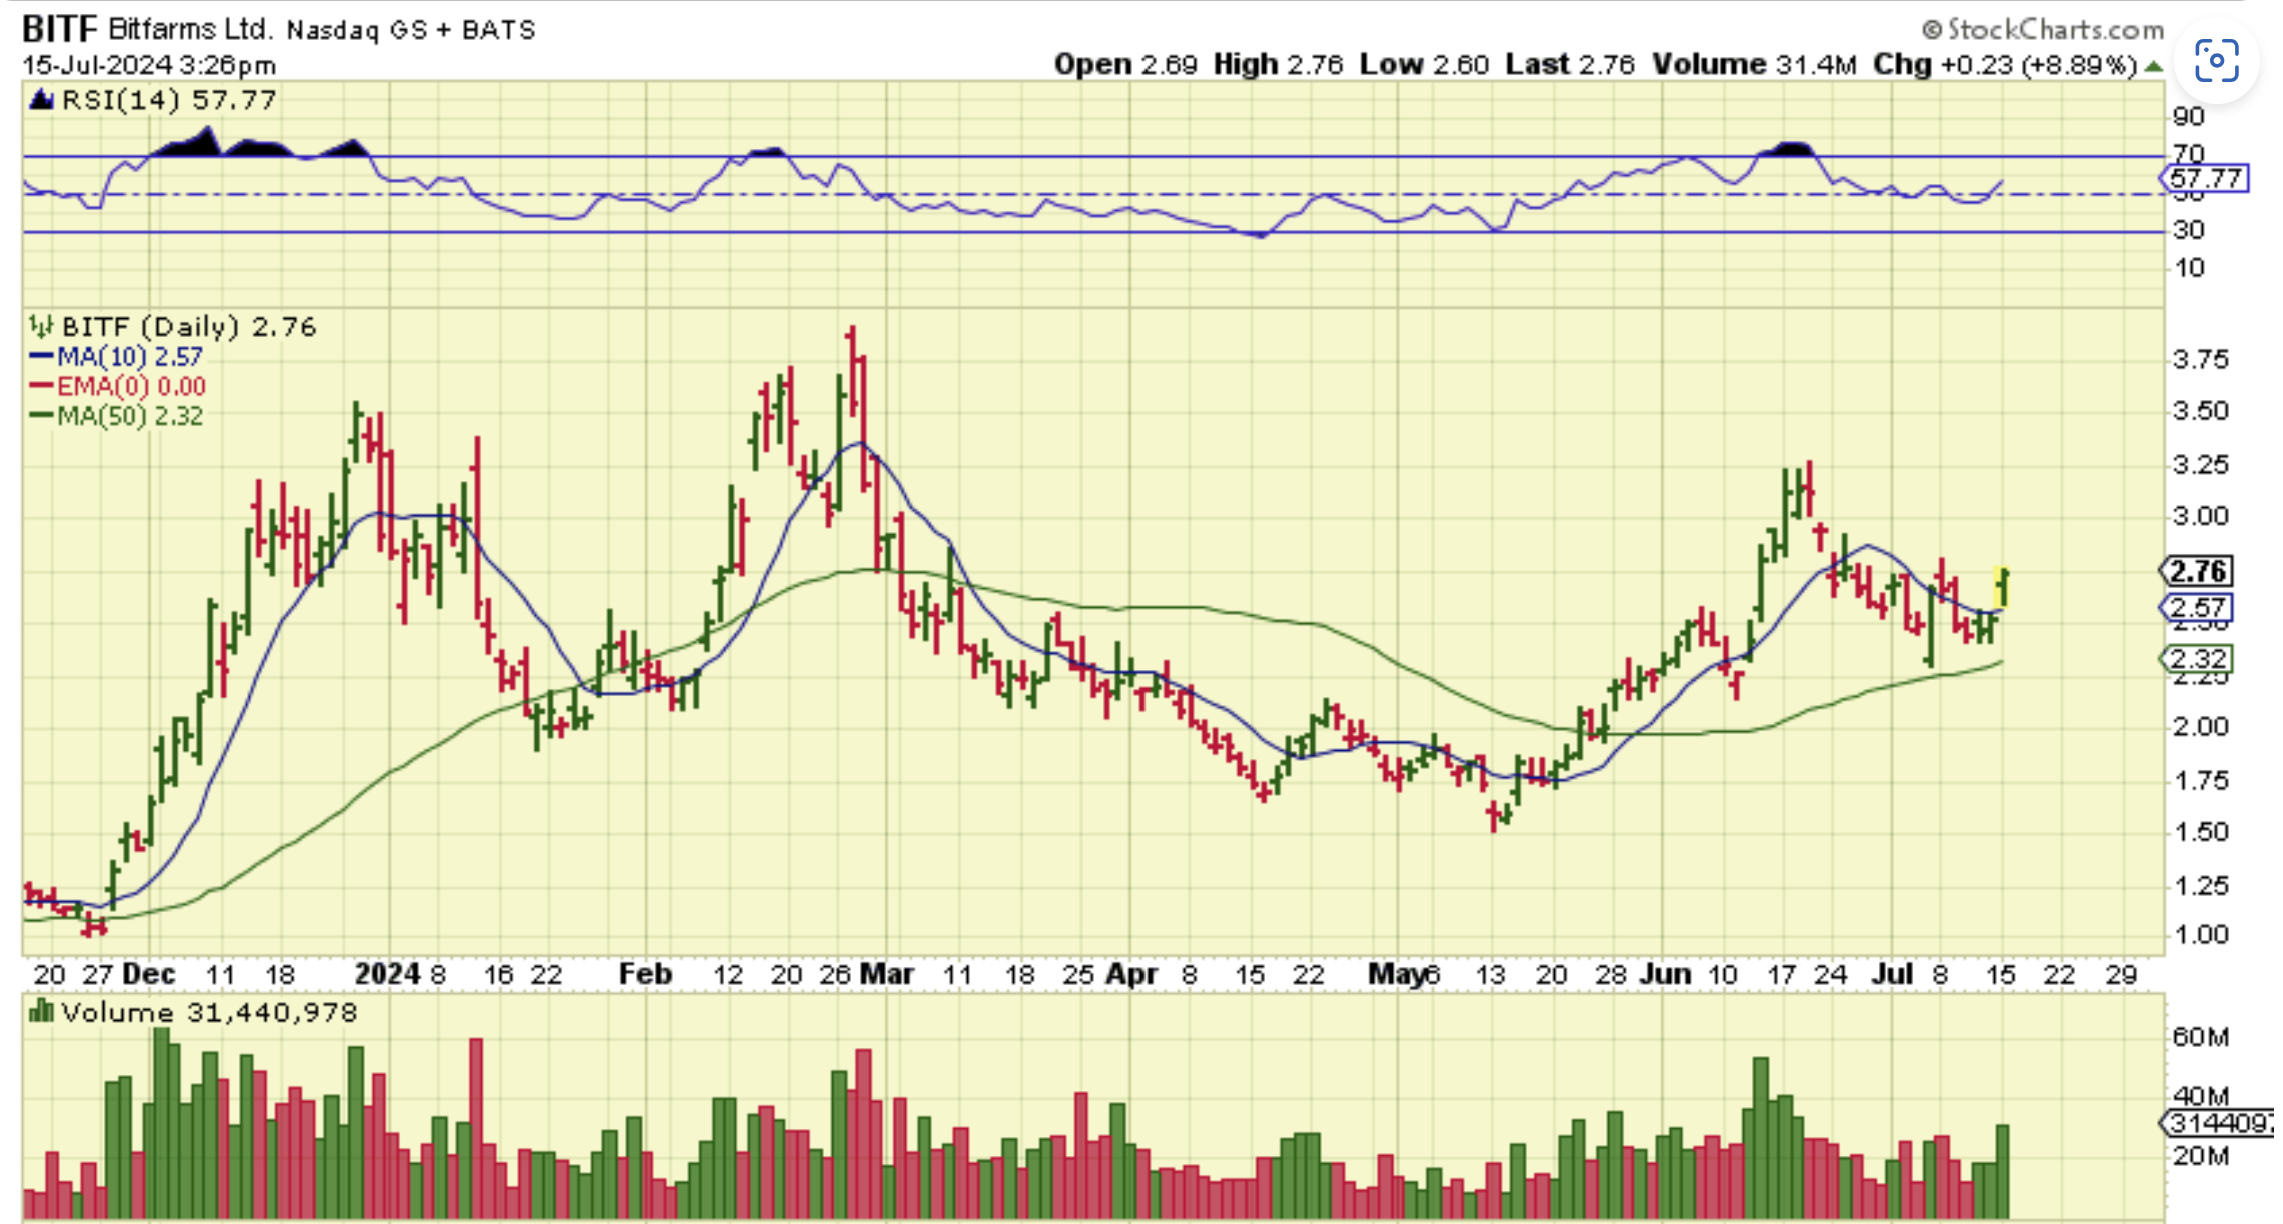
BITF is just now starting to break a downtrend line too.
.
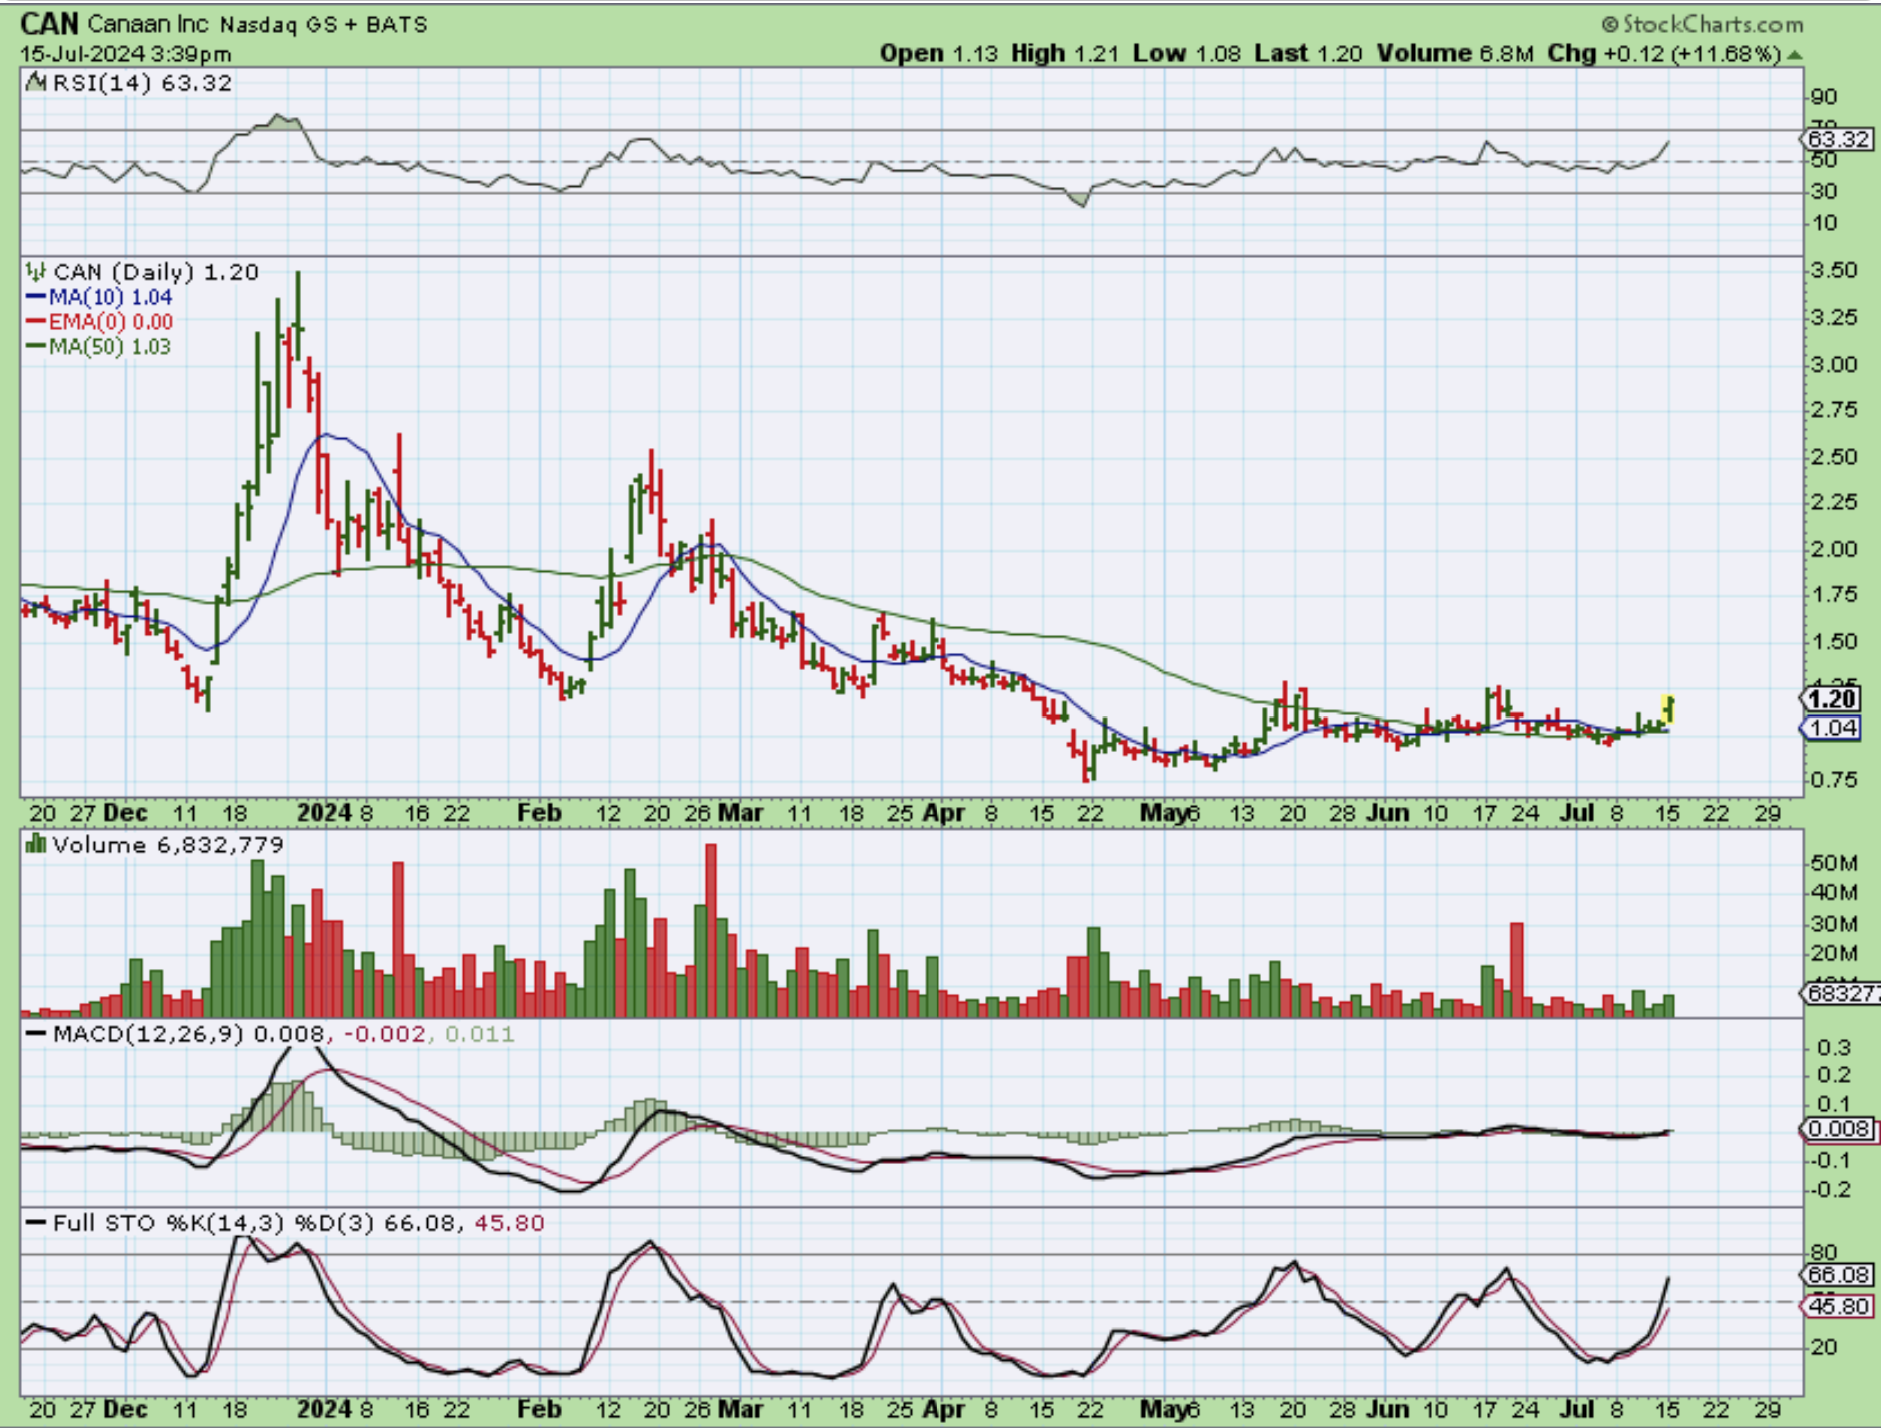
CAN is a long base, but look what it did in December! Can is a lagger that might be ready to run.
.
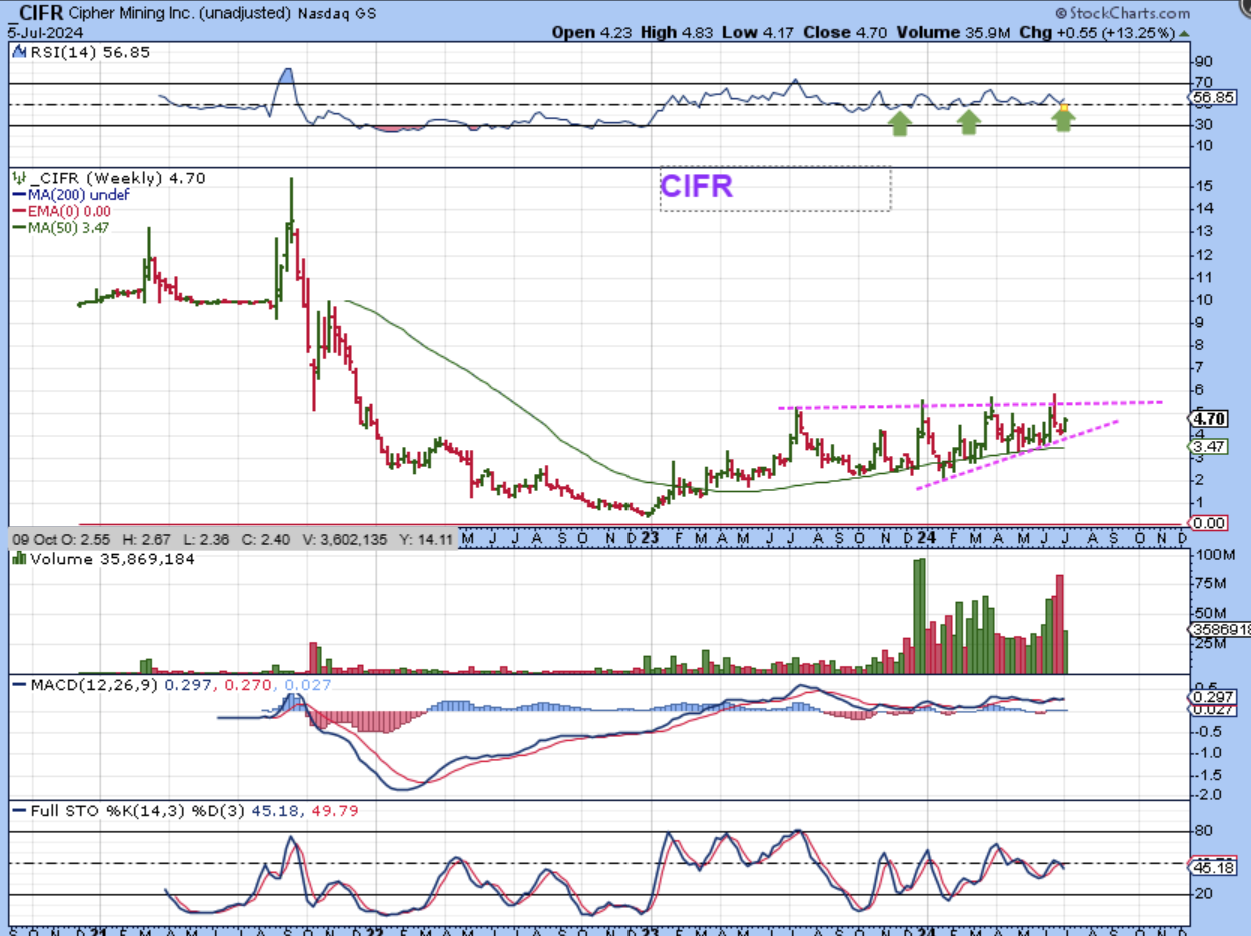
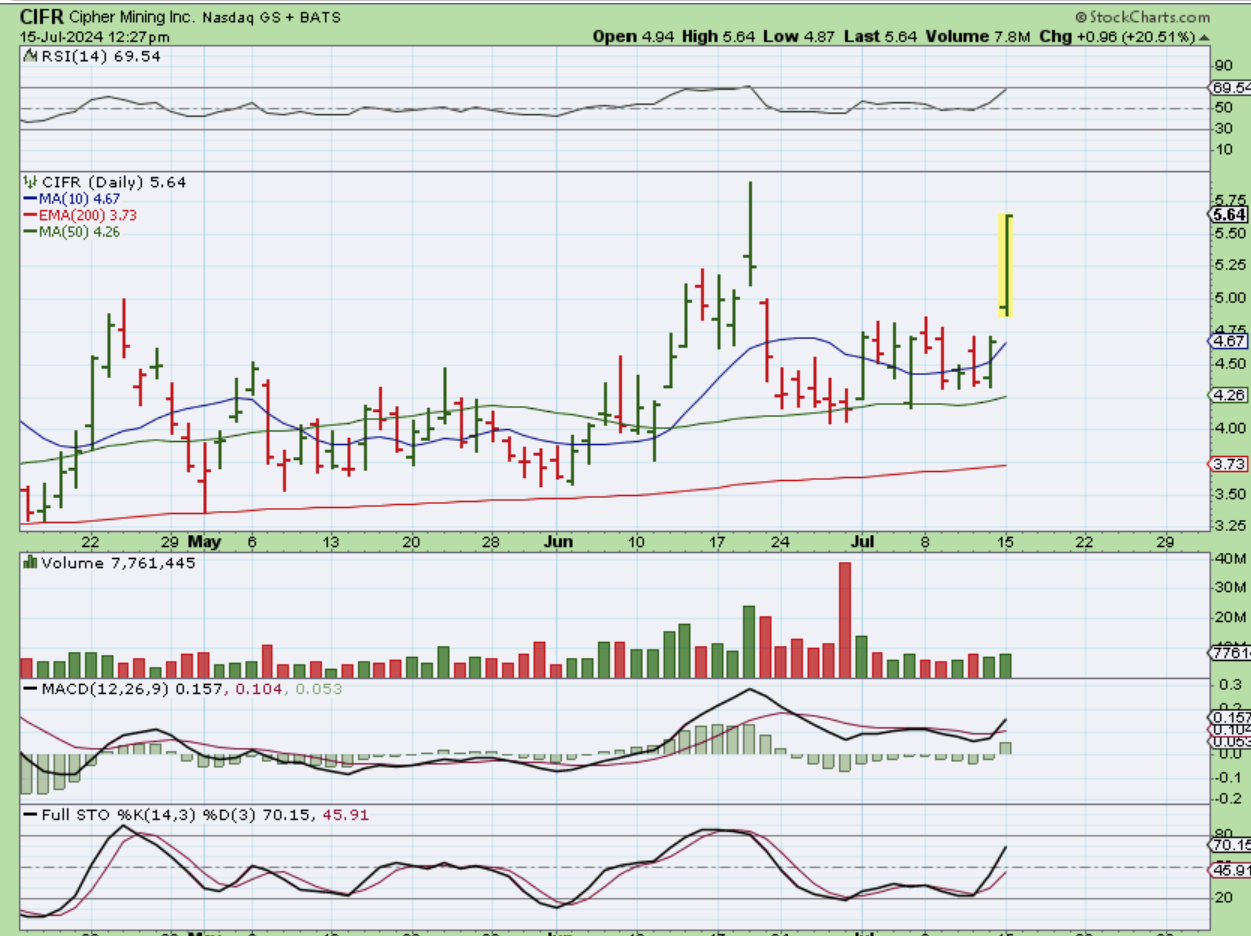
CIFR – On July 9th I posted this bullish chart, mentioning that this is a nice base and could break out and run with Bitcoin trying to put in a low. GUESS WHAT?…
.
CIFR popped and was quickly up 20% by midday, so I captured that here. It then went on to close up 28% Monday and is breaking that upper line in the chart above. CONGRATS if you added CIFR to your basket. If not? BUY-THE-DIPS!
.
Recently I discussed all of the small caps setting up and breaking out, so we discussed EV, CLEAN ENERGY, MJ, etc.
.
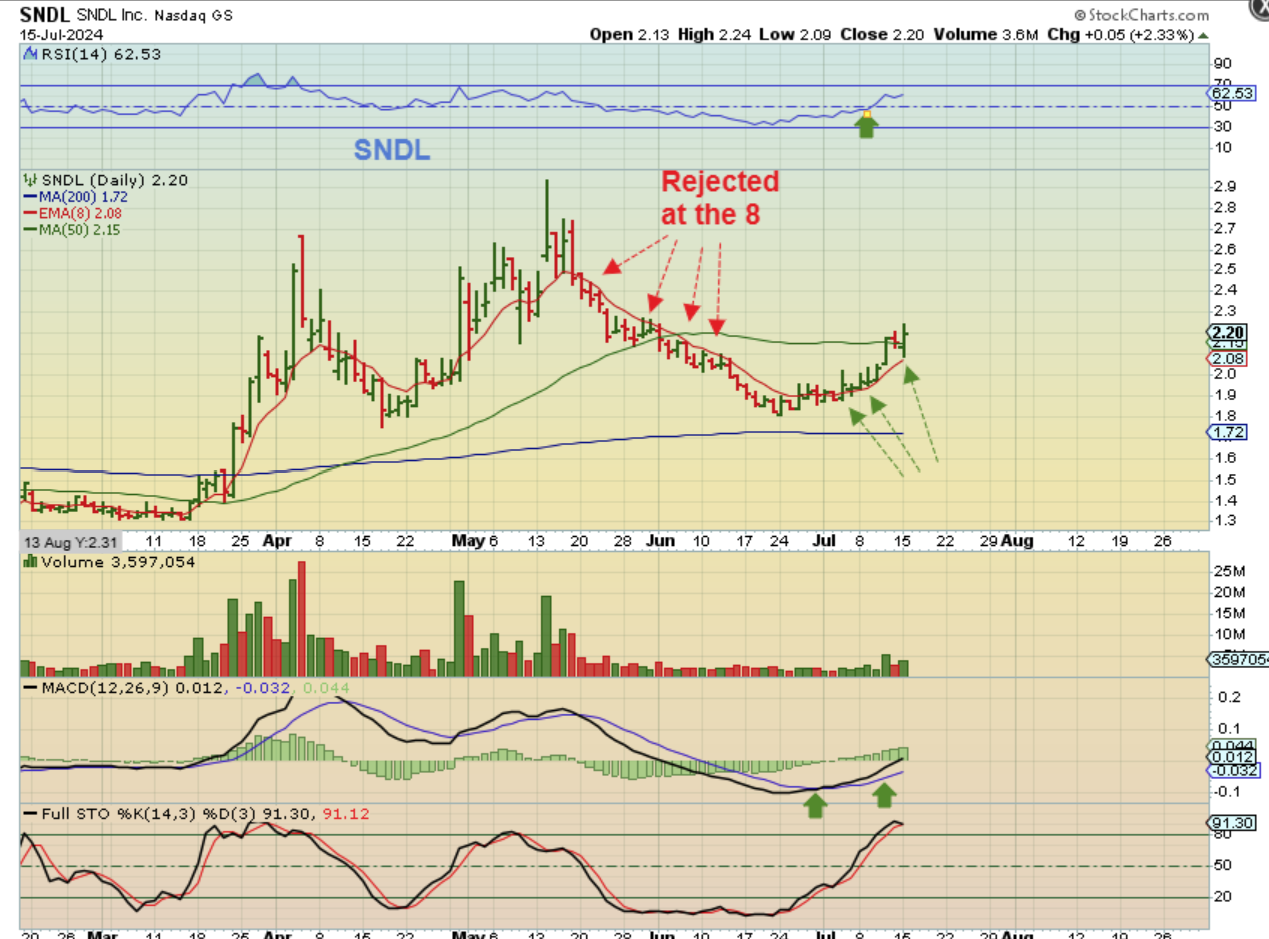
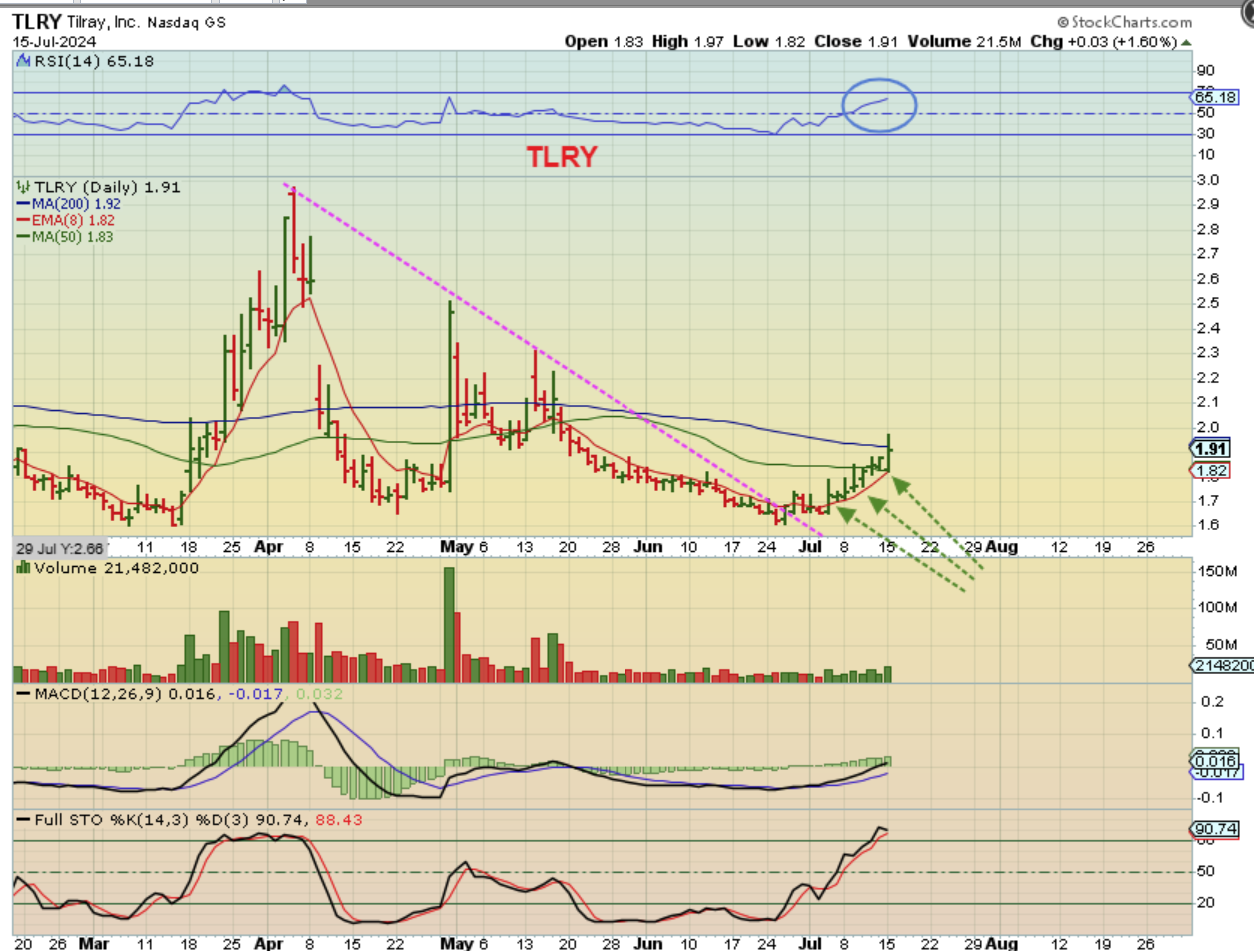
SNDL, TLRY, ACB, OGI and others are still making nice steady moves higher, out of the lows.
.
And TLRY is trying to break above the 50sma now too. It has actually been green for 8 days in a row.
.
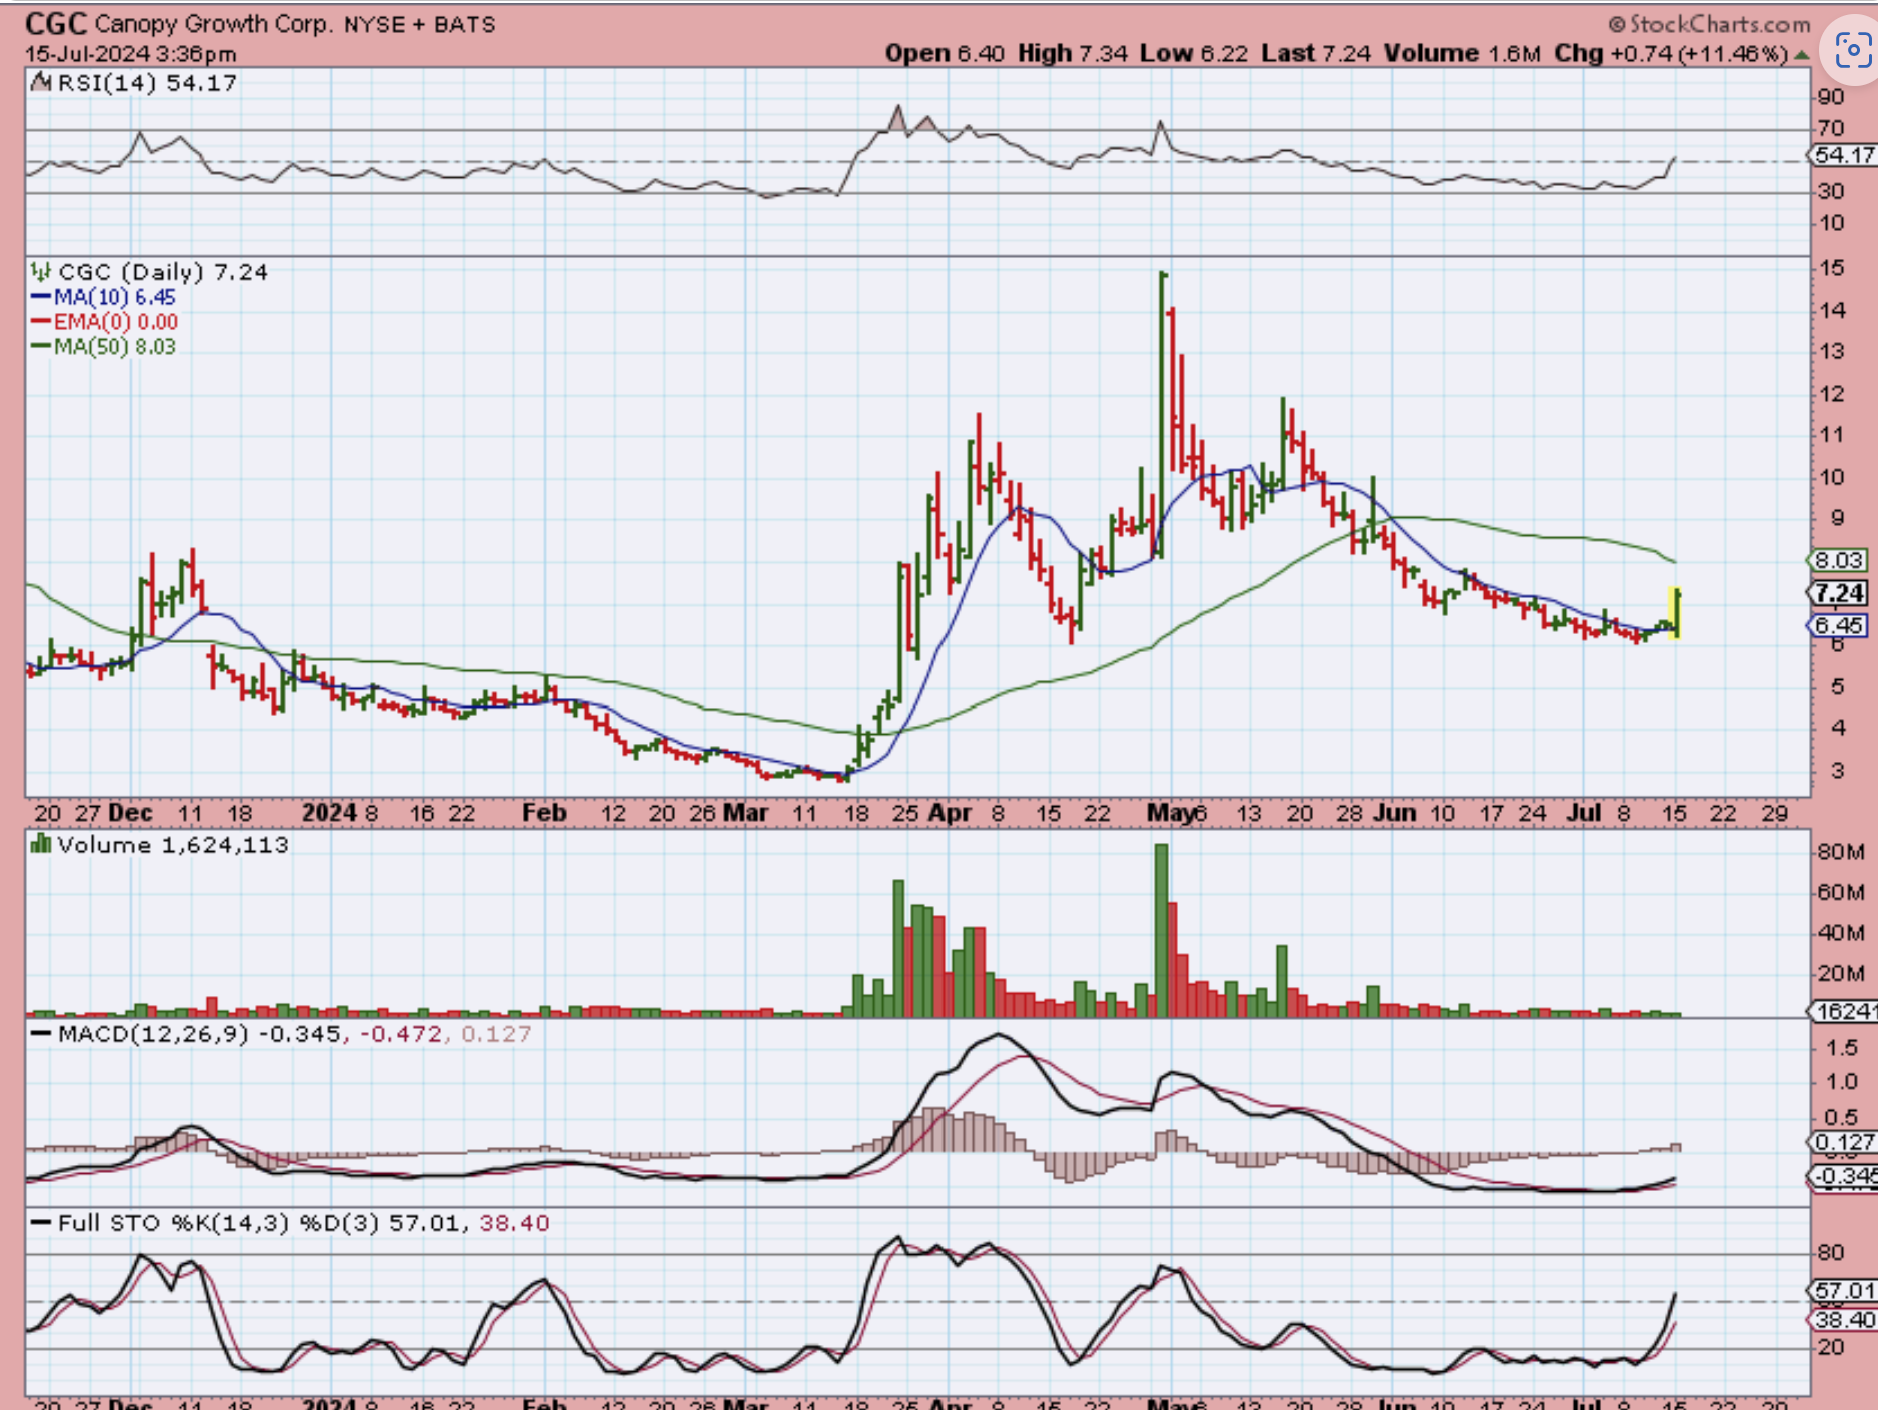
And CGC finally started to pop today too. This was a nice 11% pop, so it could be bought or buy the dips if and when they come along.
.
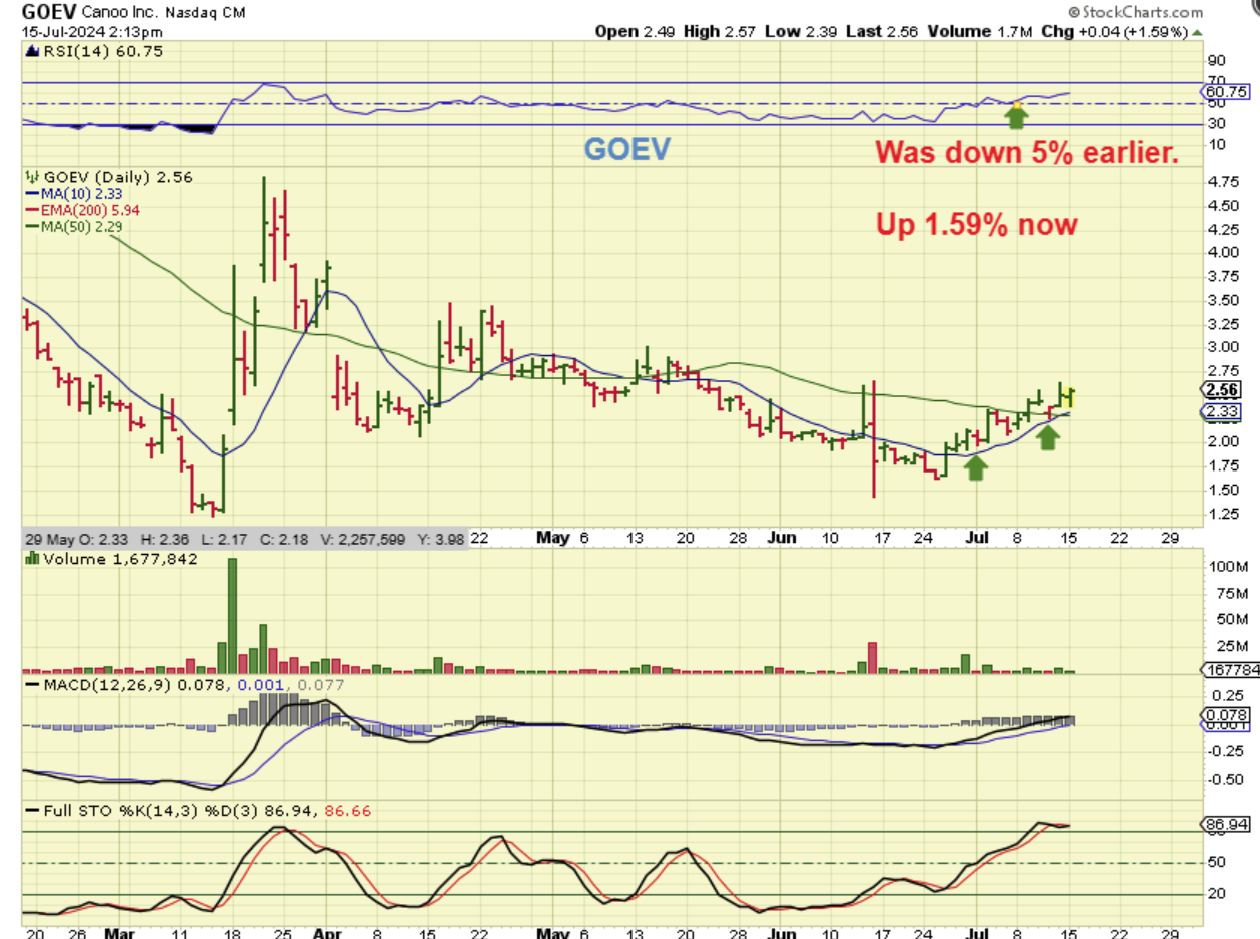
Last week I discussed the EV & Clean Energy sectors coming to like, and EVGO, GOEV, JOBY, QS, XPEV, WKHS, SPCE, and others were mentioned to keep an eye on or buy & hold f they’ve already started their run.
.
GOEV has been slowly running out of the lows along the 10sma. Yesterday it dropped 5% and then started to recover, so I grabbed this chart. It closed up 6% actually, and I have discussed that many of these EV / Clean Energy Stocks may be ready to run higher.
.
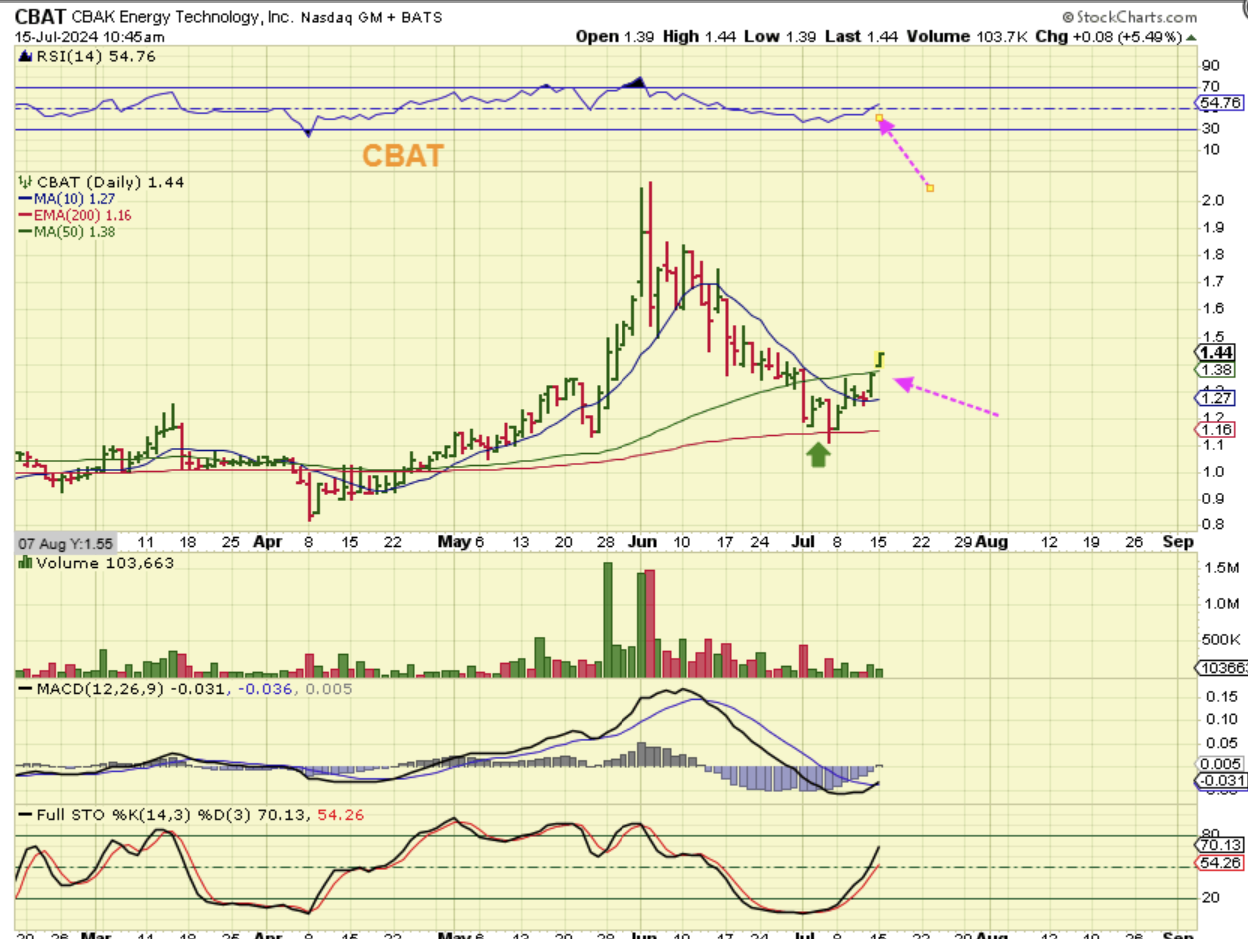
CBAT broke out above the 50sma, but it did do a bit of a Pop & Drop on Monday. IDEX was up 13%, LAC, PLUG, PPSI, IPWR, WWR, and others are trending higher now. JOBY and QS Popped in a BIG way last week and added to the gains today. This sector is looking good again and the gains can be very rewarding.
.
HELLO HOUSING: Interest rate cuts benefactor
.
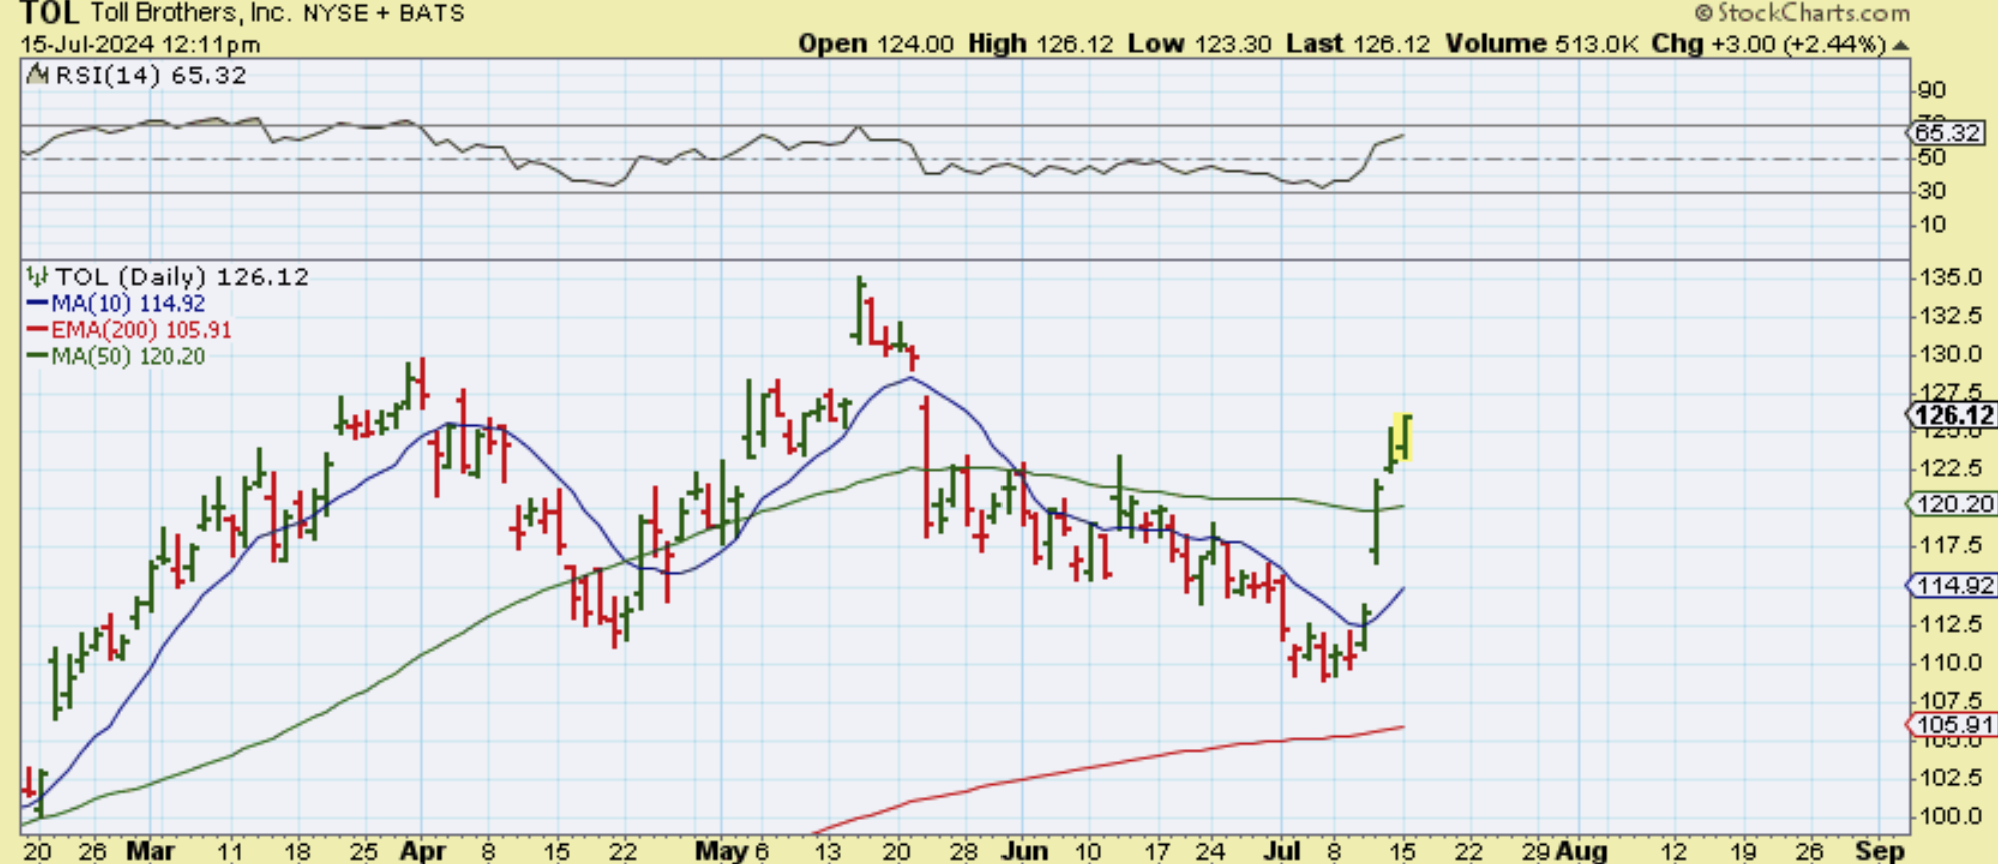
TOL (MTH, HOV, PHM, LEN, NAIL, RDFN, KBH) – These are some of the names in housing and all of the charts seem to look fairly similar.
.
Obviously Housing stocks did excellent heading into 2023 with low mortgage rates, but they peaked in 2023 with all of those rate hikes. Some housing stocks had a pretty big sell off. Now they may be bottoming and starting to make a comeback.
.
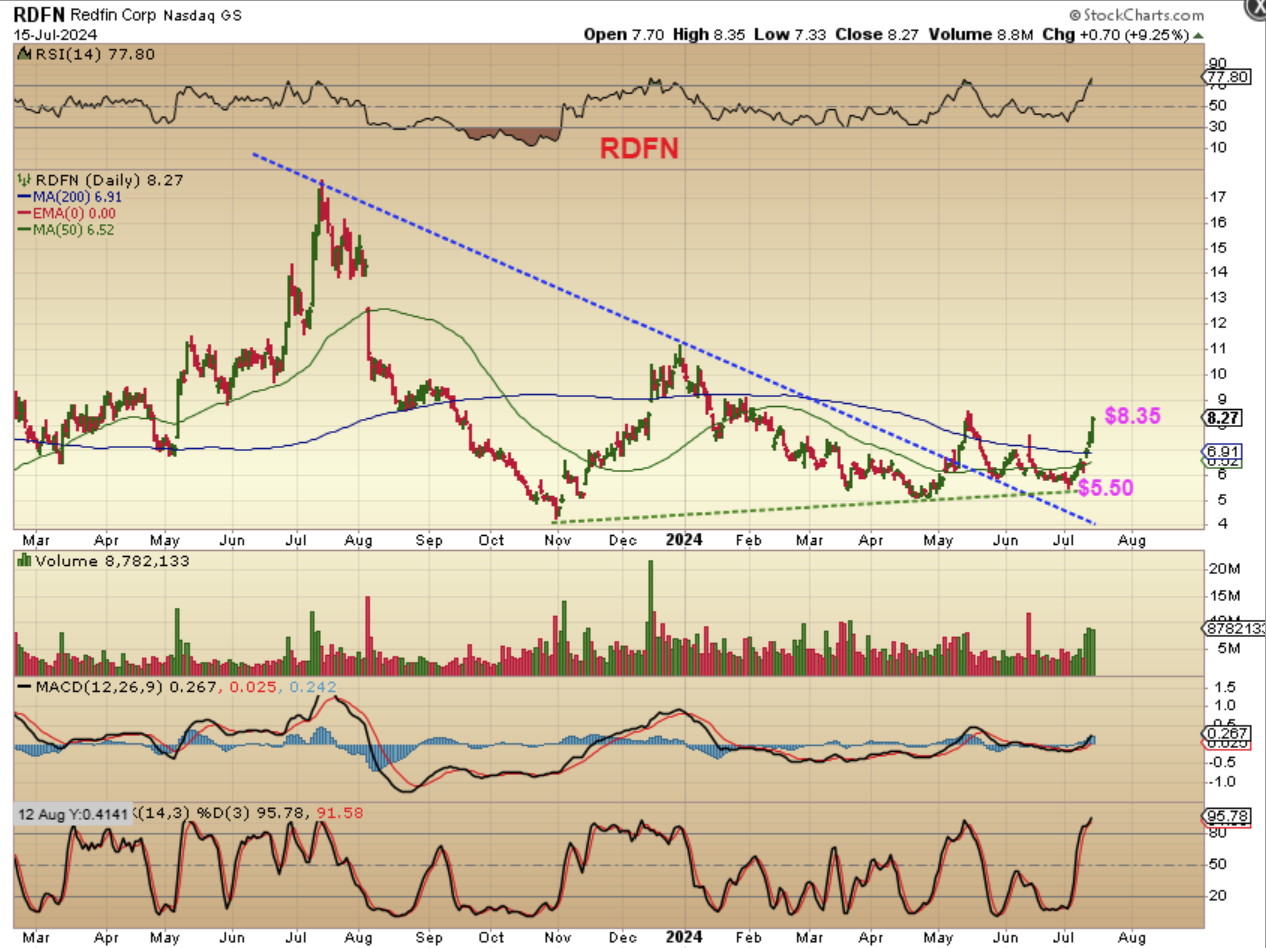
RDFN- $5.50 to $8.35 in July already is a nice move, but this looks like it could have a lot more gas in the tank if the housing market benefits from rate cuts.
.

