July 13th – Happy Weekend!
We had a lot of different sectors offering ‘trade set ups’ and ‘buy & Hold’ opportunities over the past 2 weeks and I think that this will continue, with occasional pull backs here and there. You know what they say in Bull markets- Buy the dips! 🙂
.
.
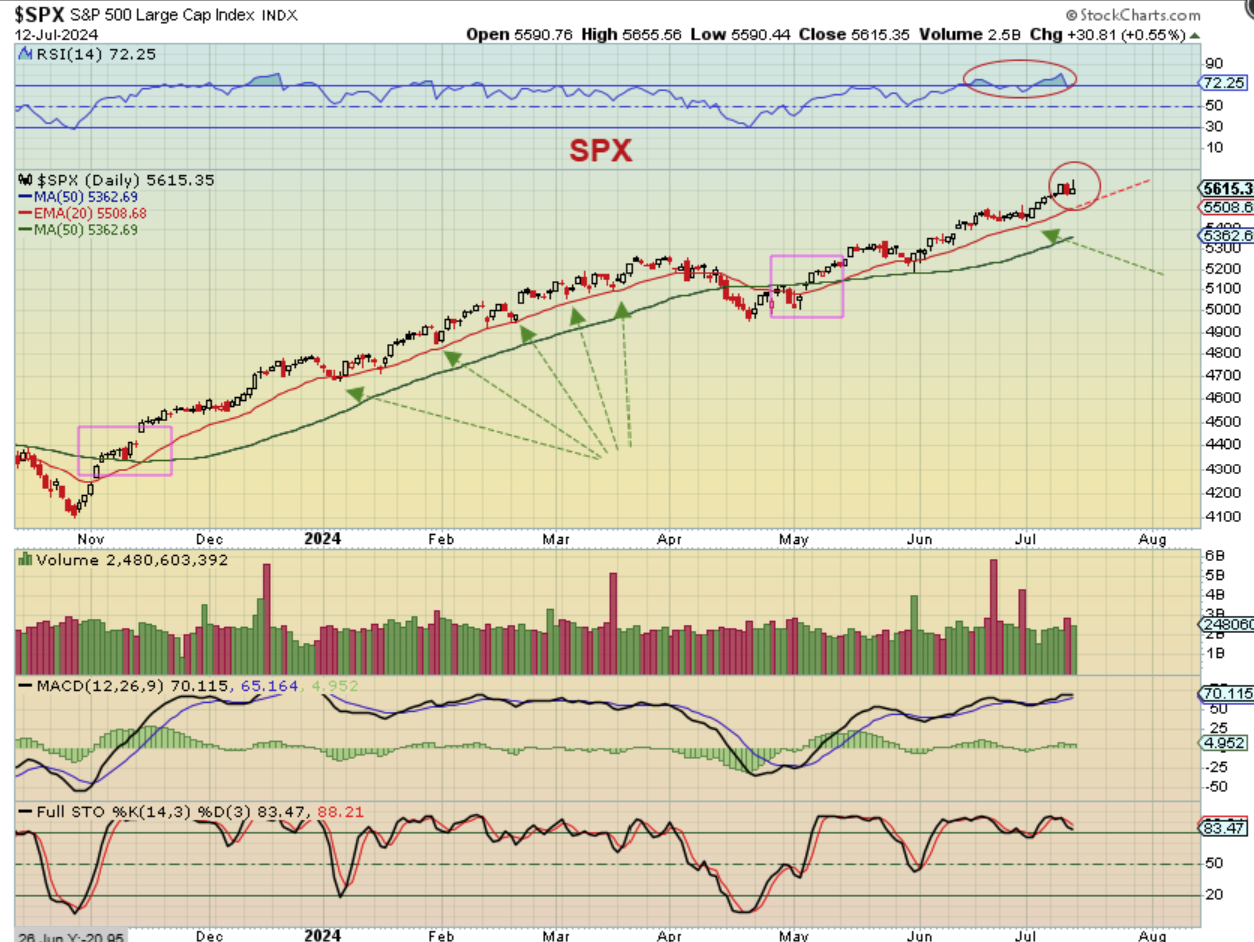
SPX DAILY – On the last bull run, we’ve had the occasional dip to the 20 ema, which was a milder dip into the dcl. You can see that here.
1. Recently I have pointed out the more obvious looking dip in the SOXX, with the 10sma turning lower almost 2 weeks ago, looking like a dcl.
2. While that happened, the SPX & NASDAQ mildly dipped or chopped sideways, but didn’t even bend the 10sma lower to signal a dcl. My green arrow points that dip out.
3. The markets then took off higher with the fed Chairman giving a speech about inflation cooling, and then the Data the following Wed confirmed it- causes chances of a rate cut in September to strengthen again.
4. The markets took off for 2 weeks, but Friday was a ‘possible’ reversal candle.
.
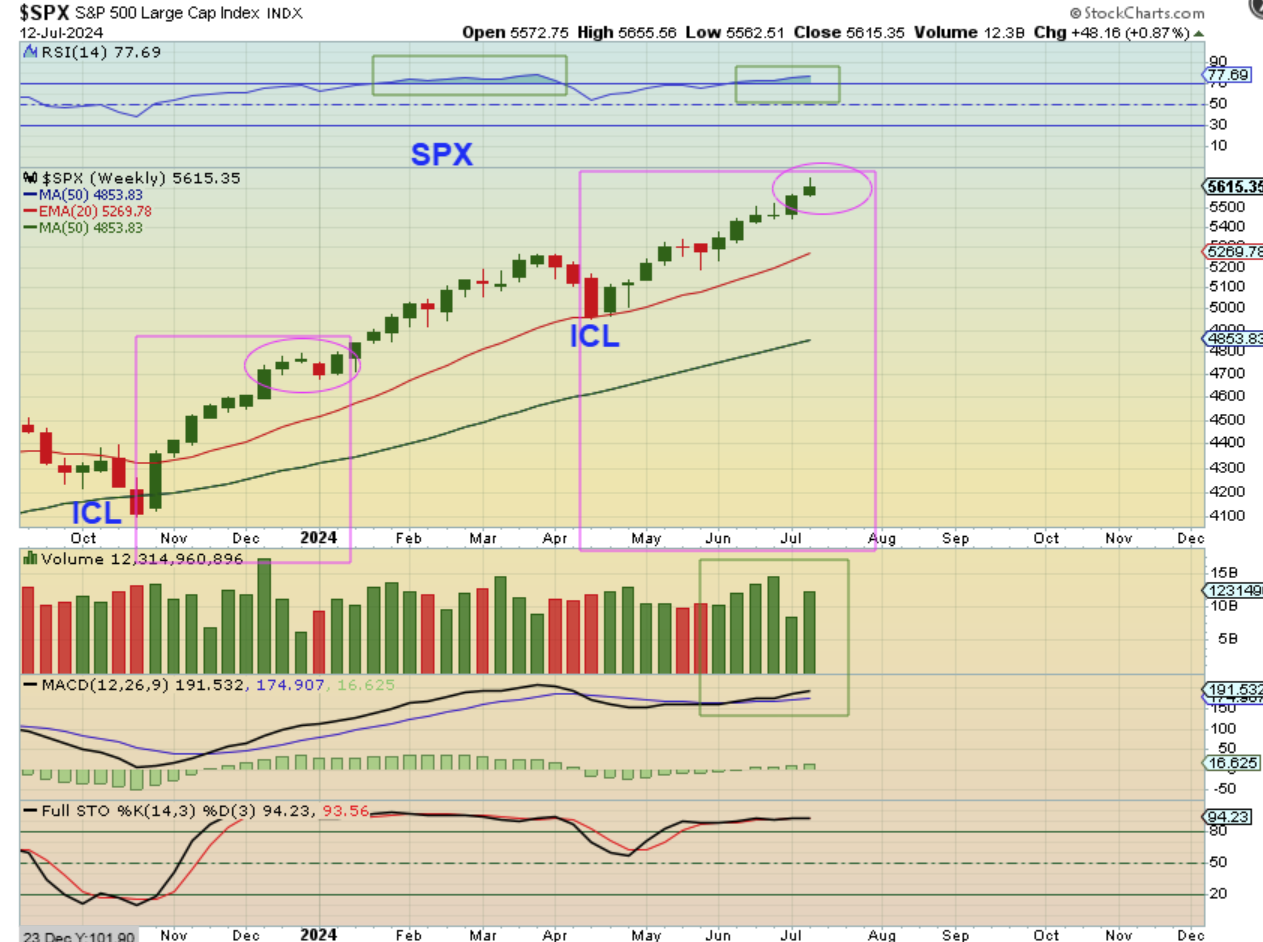
THE SPX WEEKLY has a small reversal type candle too.
These have been ignored in the past, and notice that we had one just 4 weeks ago too. The current inflation data could cause this to just give us a brief pause and then off we go higher again, but I just want to note that this is a small weekly reversal candle.
.
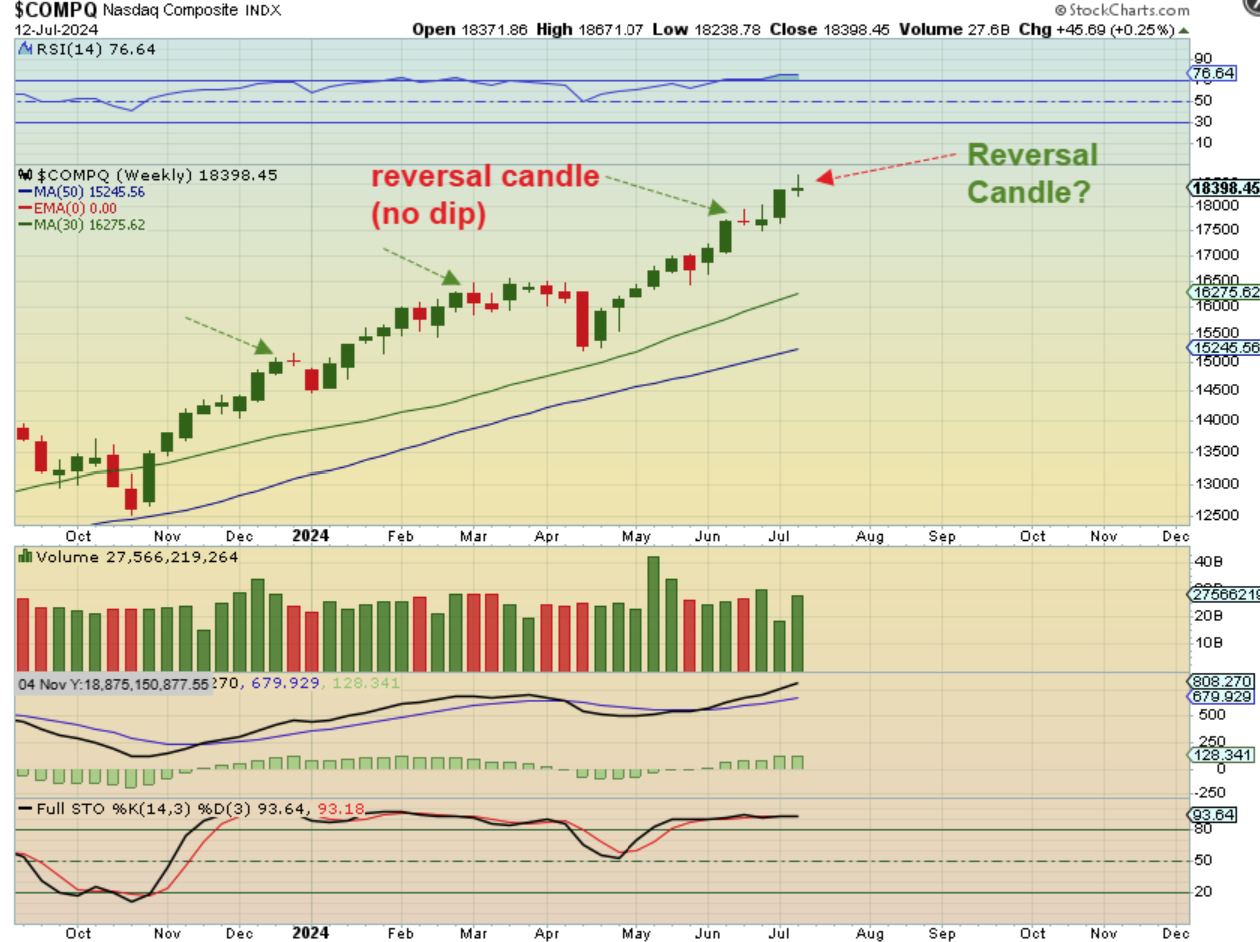
THE NASDAQ also has a more obvious looking reversal candle, but I will repeat that 4 weeks ago we saw one here too. The recent data has suddenly caused the chances of a September rate cut to jump to a 90% chance this week!
.
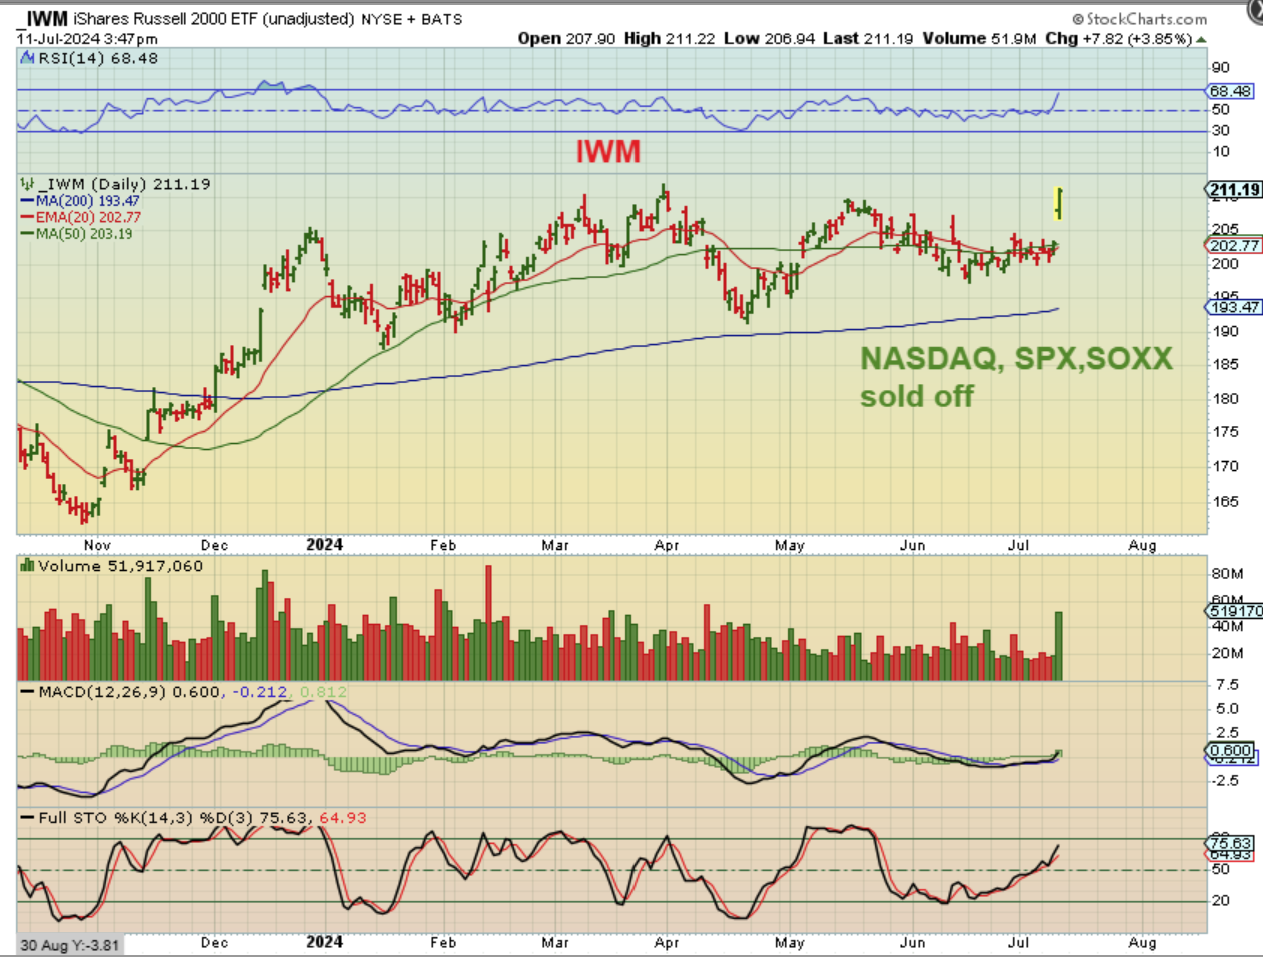
Friday I mentioned that on Thursday The SPX, NASDAQ, and SOXX crashed down, while The IWM Popped higher in a big way. I had been noticing (and trading) some Clean Energy, EV, EV related stocks, (and MJ stocks are bullish looking set ups). BLDP, WKHS, EVGO, PLUG, FCEL, and more- were popping and running. So I said in my Thursday night report…
.
The IWM gapped up and continued higher, as the General Markets sold off? VERY INTERESTING.
.
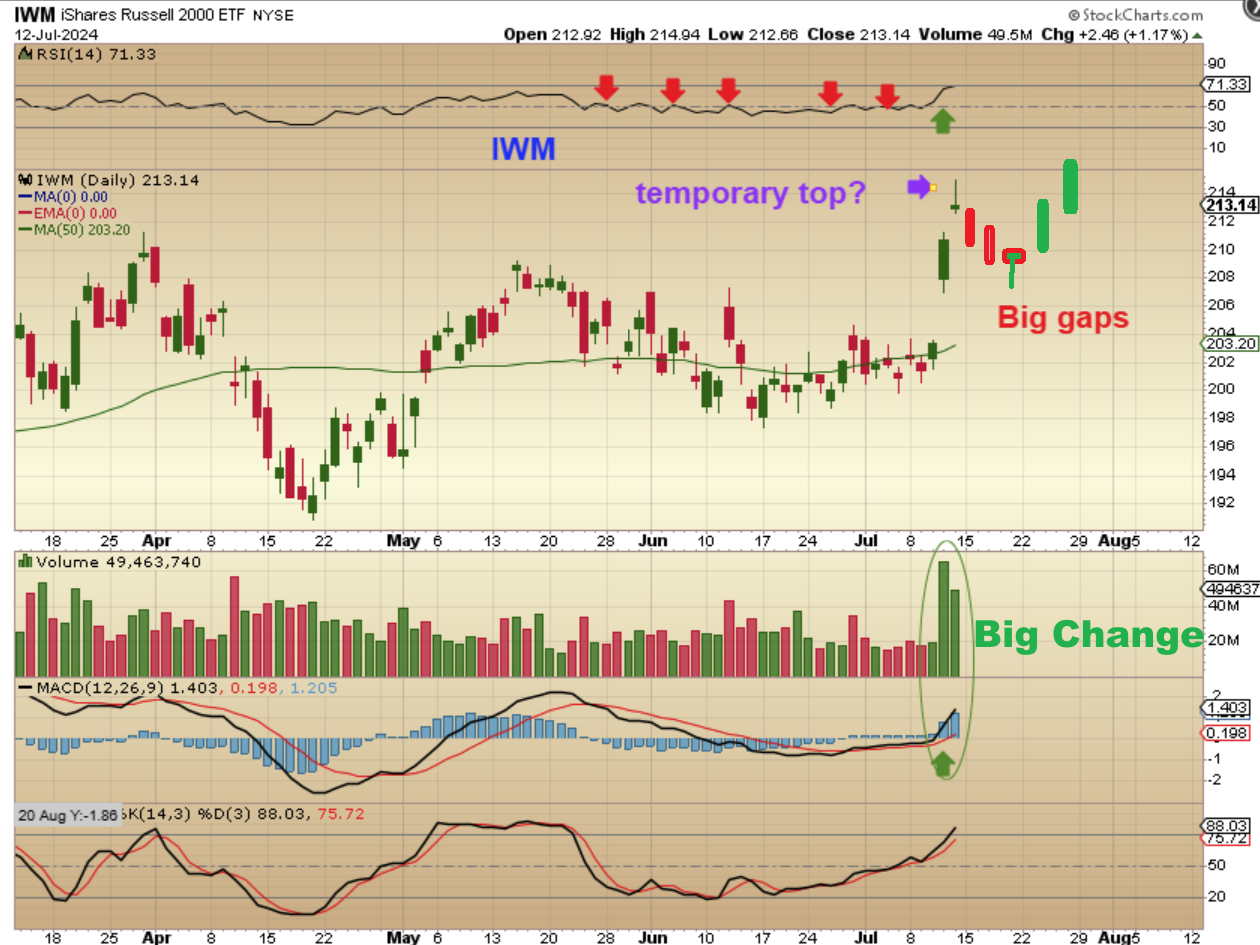
Well now look at what happened on Friday:
.
We saw another big gap up higher, but this one started to sell down into the end of the day. THIS really looks like a topping candle, but it still may only lead to a 1 – 3 day drop / gap fill kind of a dip, and then next weeks Data may cause a reversal higher later. Let me draw one possibility for you…

.
This would be an ideal ‘Buy the dip’ for many of the stocks mentioned in recent reports (I will watch them and cover them next week too). We could just see a 1 to 3 day dip lower to fill the last gap, but the first power gap does not have to fill. These markets could then continue higher. What about the weekly chart?
.
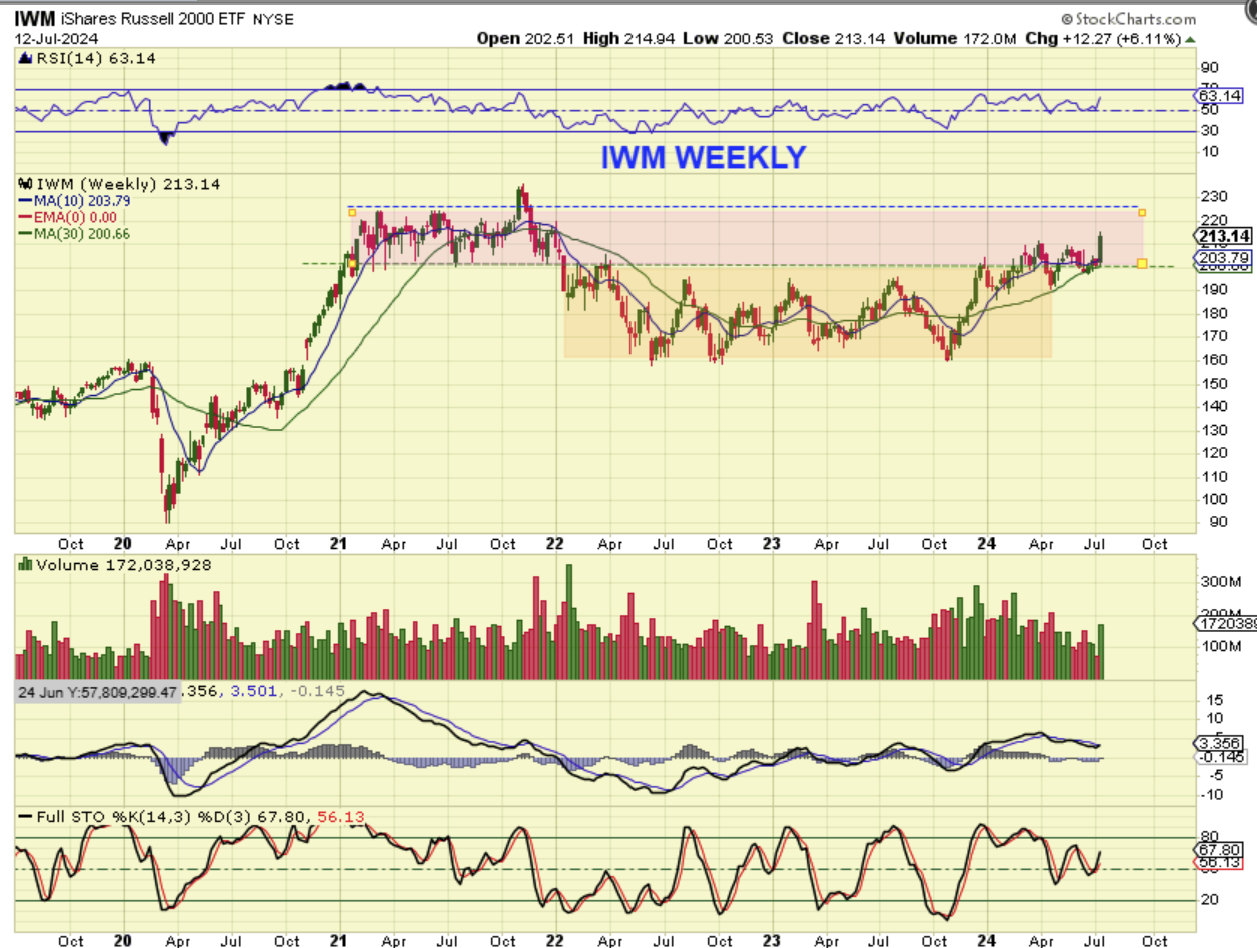
IWM WEEKLY– The weekly chart just simply captures that 6% surge out of a multi-month base. In fact, for all of 2024, this has been chopping sideways to the 30 week ma support, but it is possible that this will now start to trend higher too. Next let me show you one more chart for the IWM…
.
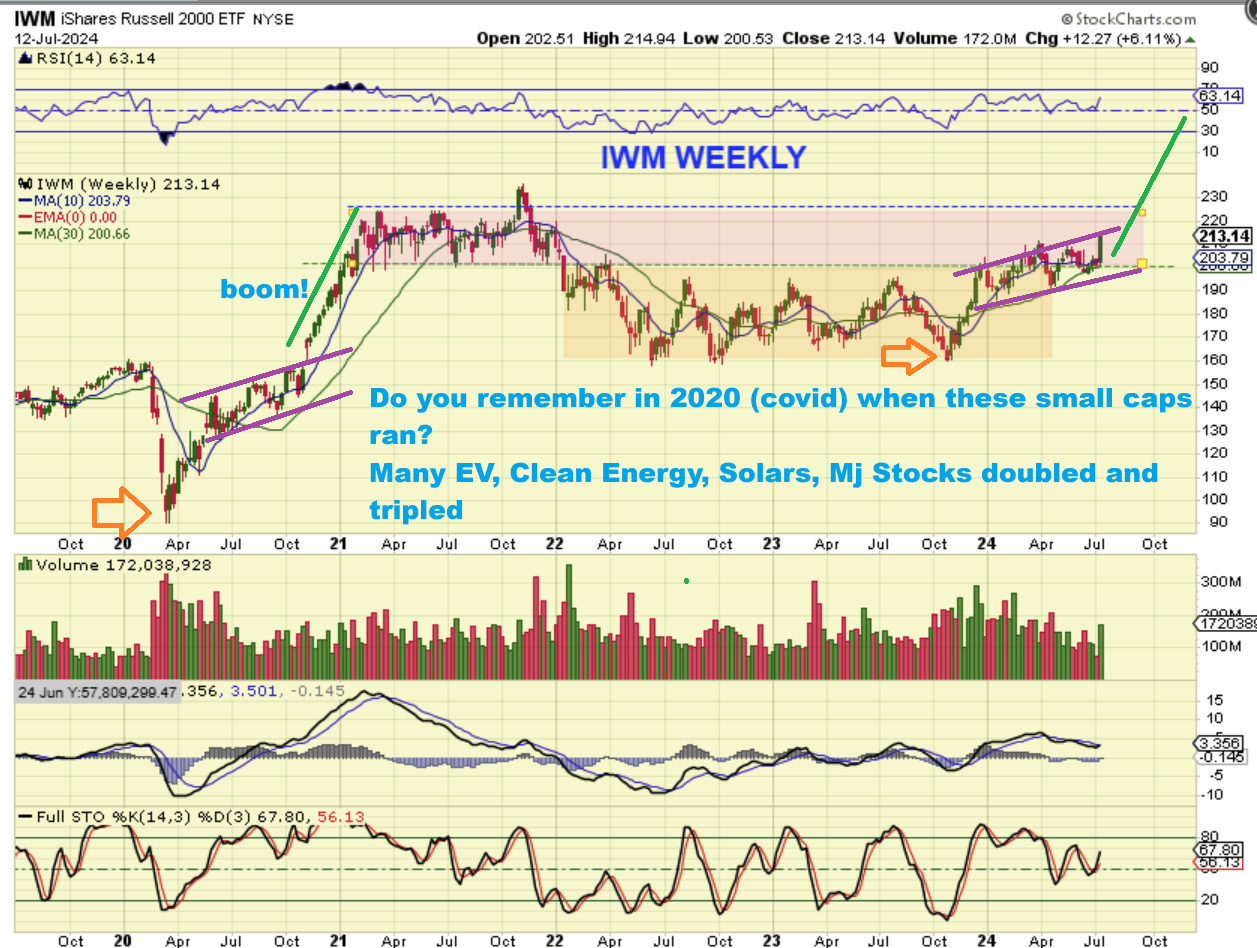
let me show you one more chart for the IWM WEEKLY:
.
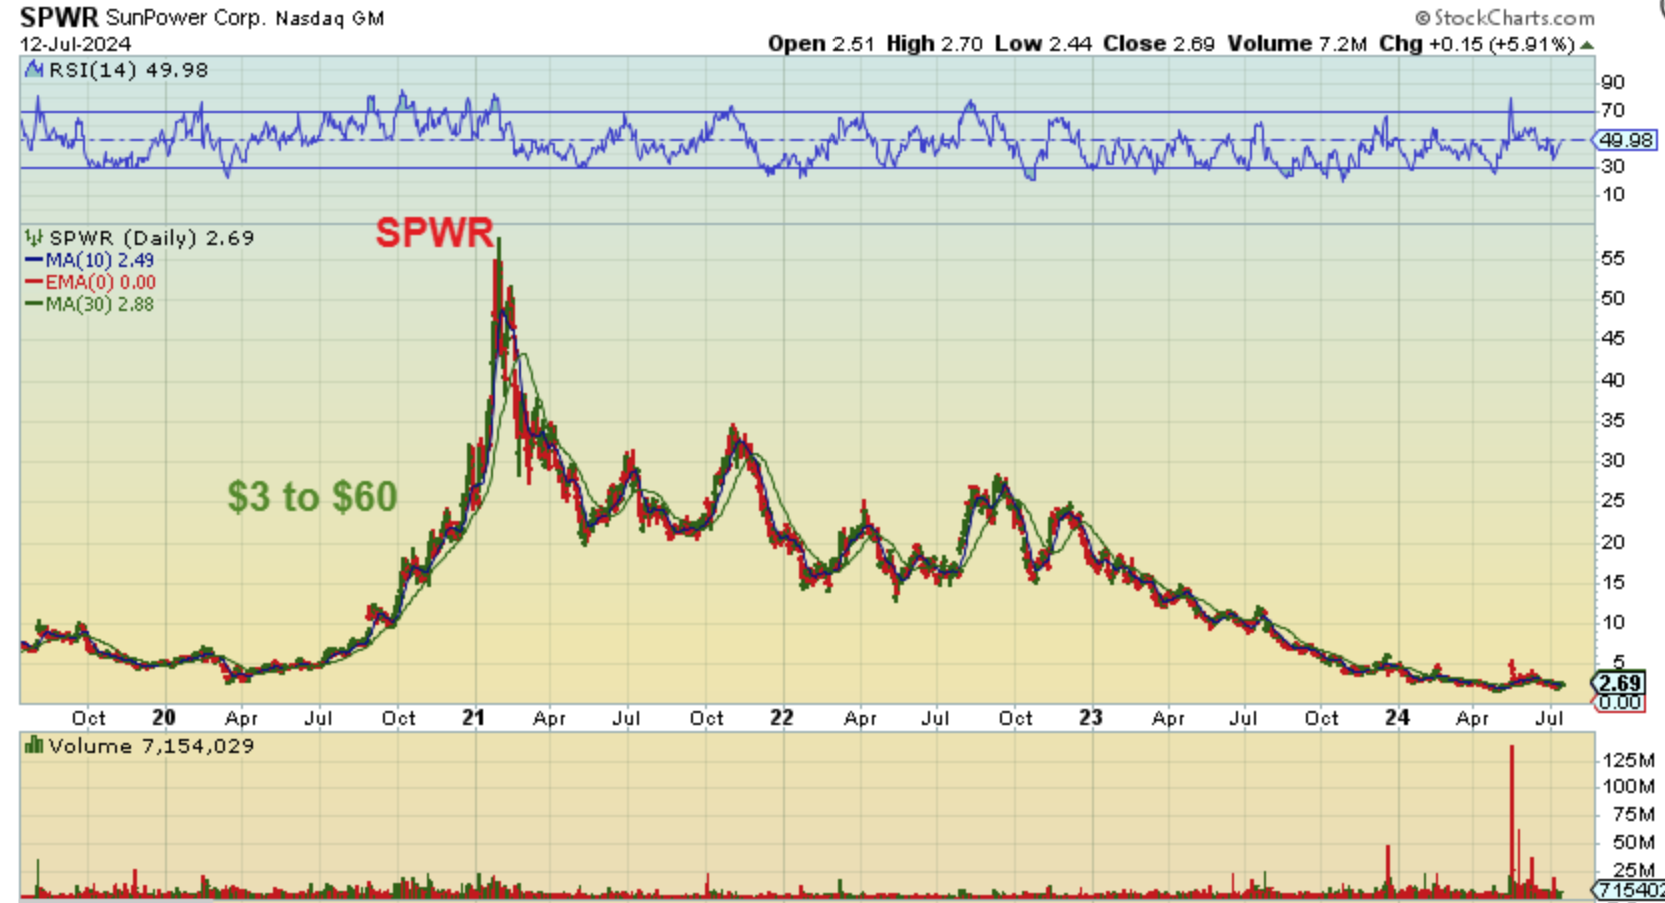
Take a look at the striking similarities of the IWM now vs IWM in the 2020 covid recovery. When that rally took place, many of the Clean Energy, Mj Stocks, Solars, etc ran up hundereds of %. It may not repeat exactly as it did then, but some stocks ran from $3 to $30 or even $5 to $50. I’ll be watching this sector going forward too.
.
To name a few, SPWR, CSIQ, TLRY, FCEL, BLDP, etc were all able to make gains of 500% or more, even 1000% plus gains in that year. That was amazing.
.
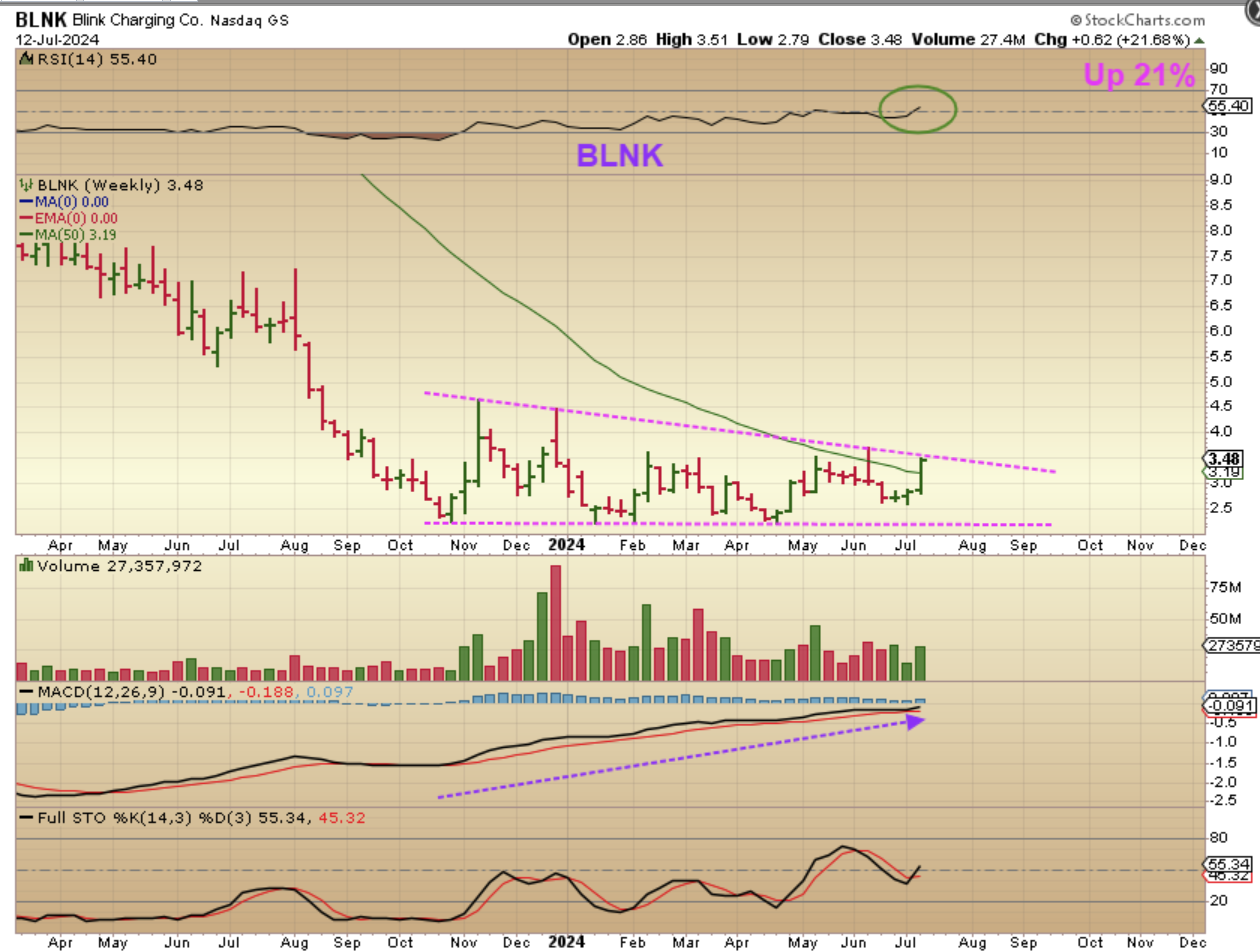
BLNK was one that I traded this week and you can see that it was up 21% for the week. I mentioned WKHS, that was up 28% last week. QS was up 63%! XPEV only 11%, and on and on , as this sector starts to perk up. Let’s keep an eye on it.
.
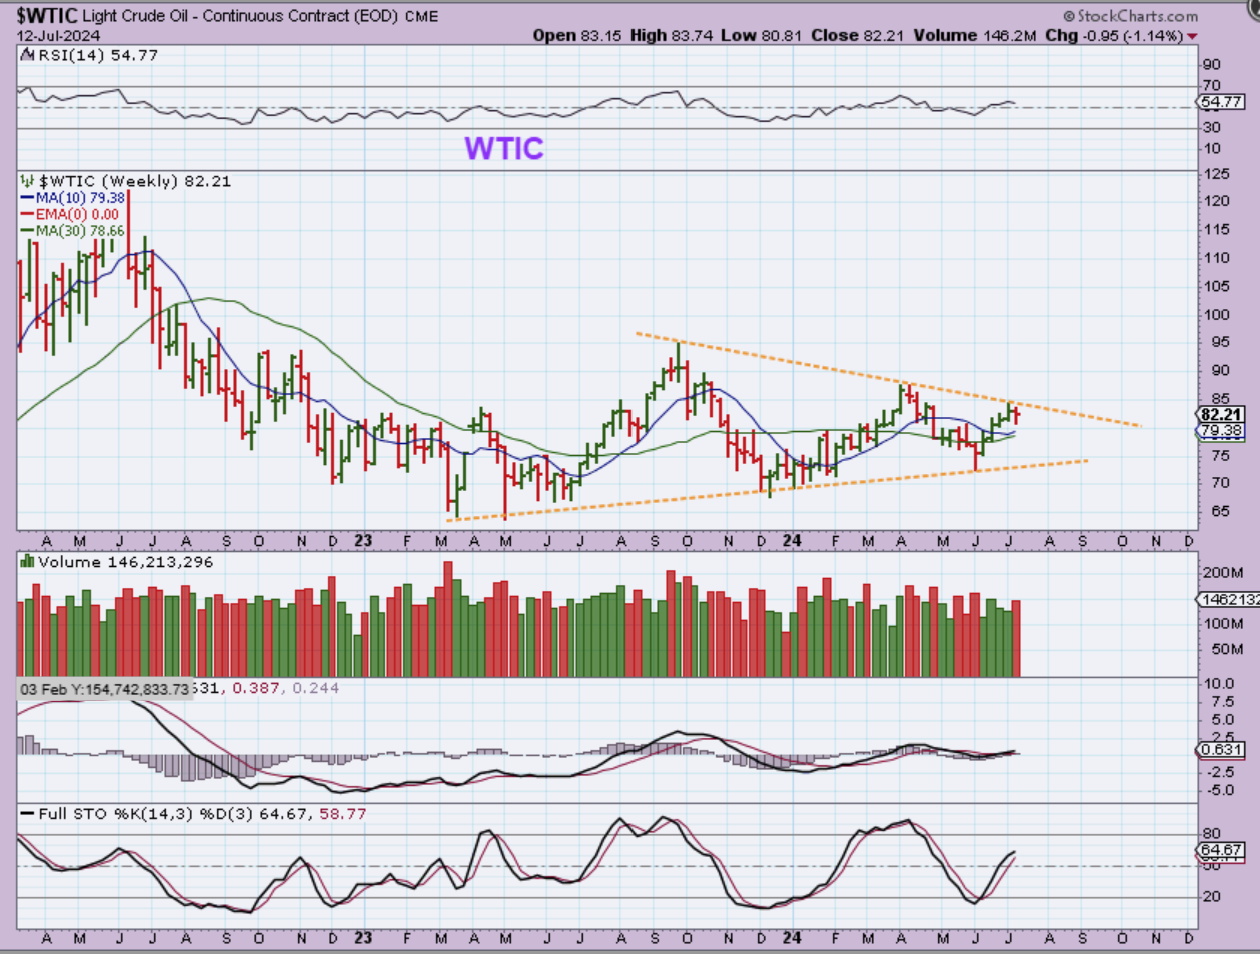
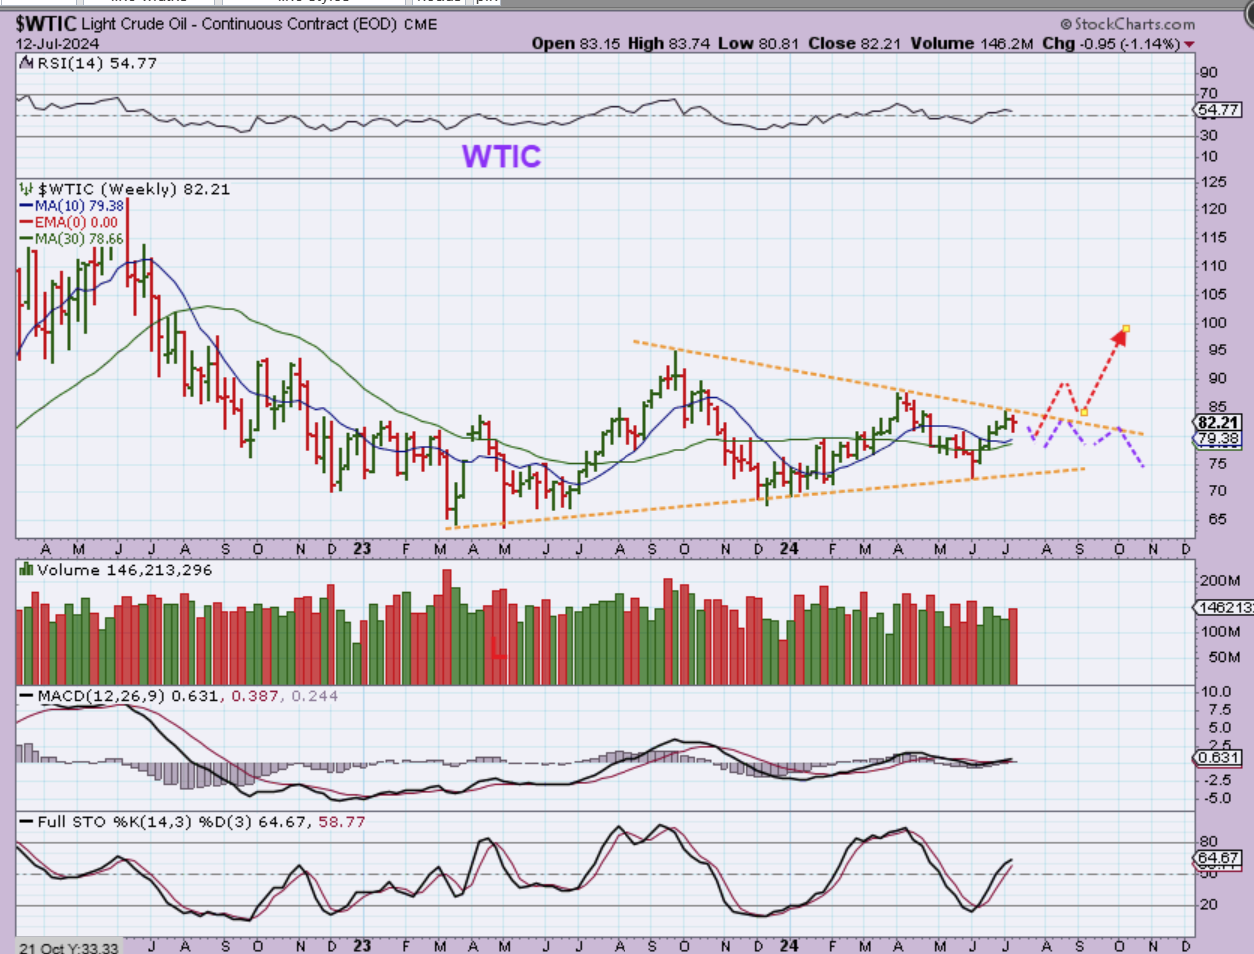
WTIC – Oil looks to have reached an overhead resistance area, so it dropped this week. It recently put in an ICL though, and that could allow it to still have the power of the first couple of daily cycles to push higher and break out. So…
.
WTIC –
1. Oil can crawl sideways, dip into a dcl (purple line), and THEN breakout, or
2. It may just breakout sooner than later (red line) if there is a catalyst to do so.
.
Do we get a clue with the Oil / Energy Stocks? I think we might.
.
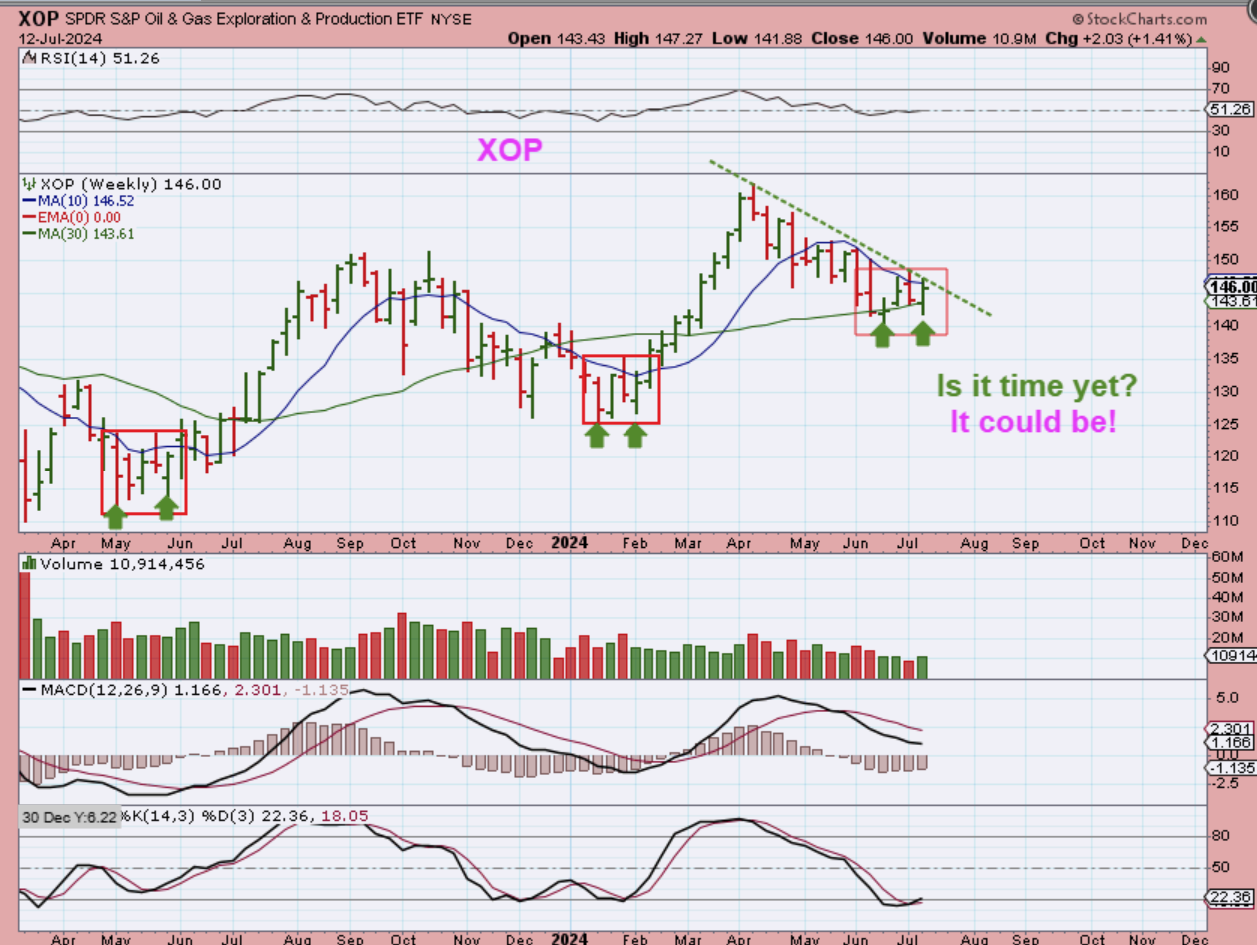
ON JUNE 28th I said that in the past the XOP chopped along the bottom and THEN broke out higher. I was going to keep an eye on this Weekly chart for the next few weeks, during the boring chop, to see if this happened again. In Jan 2024, we had 4 weeks of chop at the lows. What about now…?
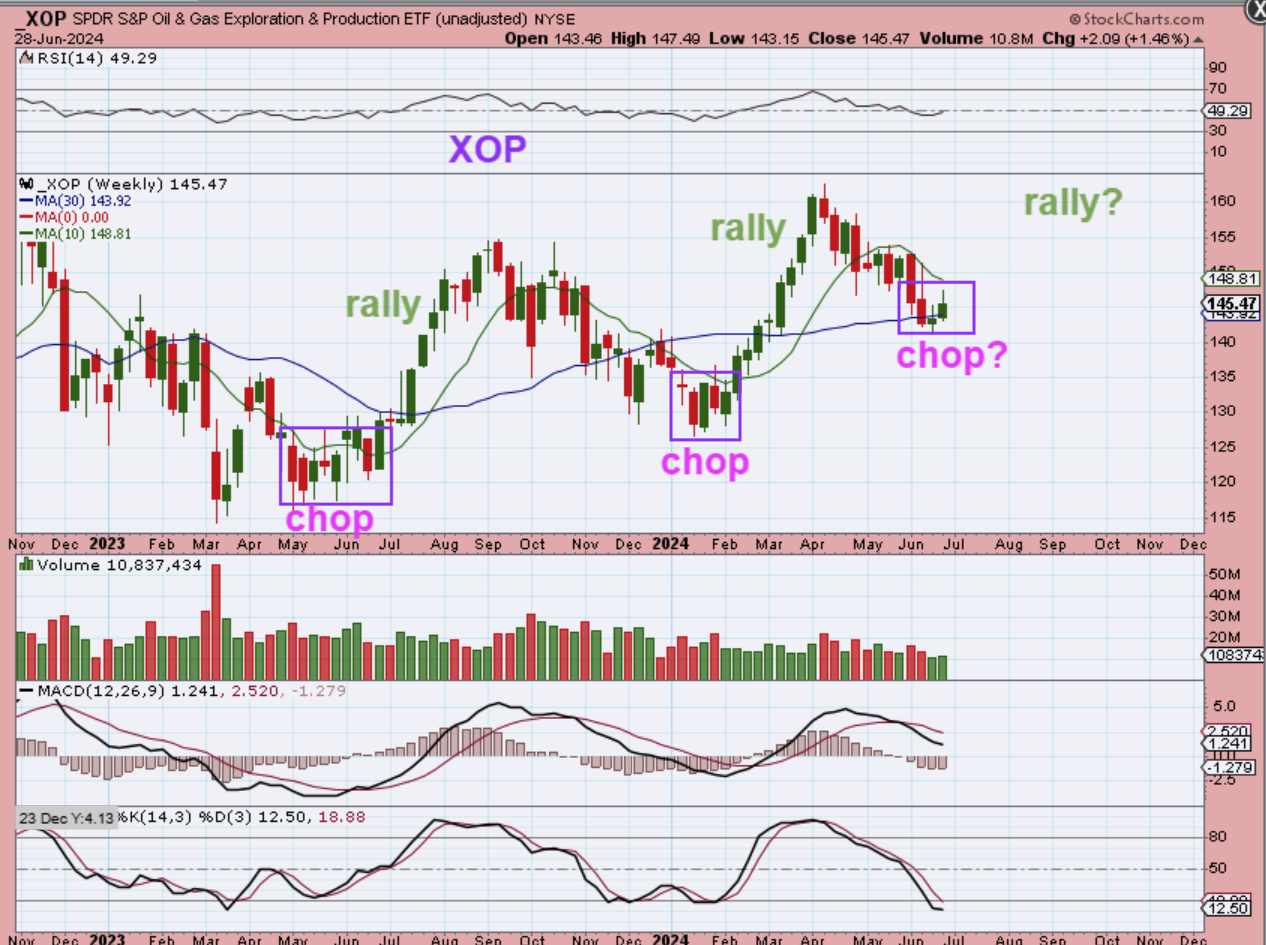
The XOP has 4 weeks of chop at the lows now and yet it kind of looks ready to breakout higher above that downtrend. This is now oversold and starting to curl up. NOW might be the time that I would look into Oil stocks as a buy and hold, and THIS might also indicate that OIL is going to break out sooner rather than later.
.
That’s right Ombibulous–Oil might breakout, tell your friends 🙂

.
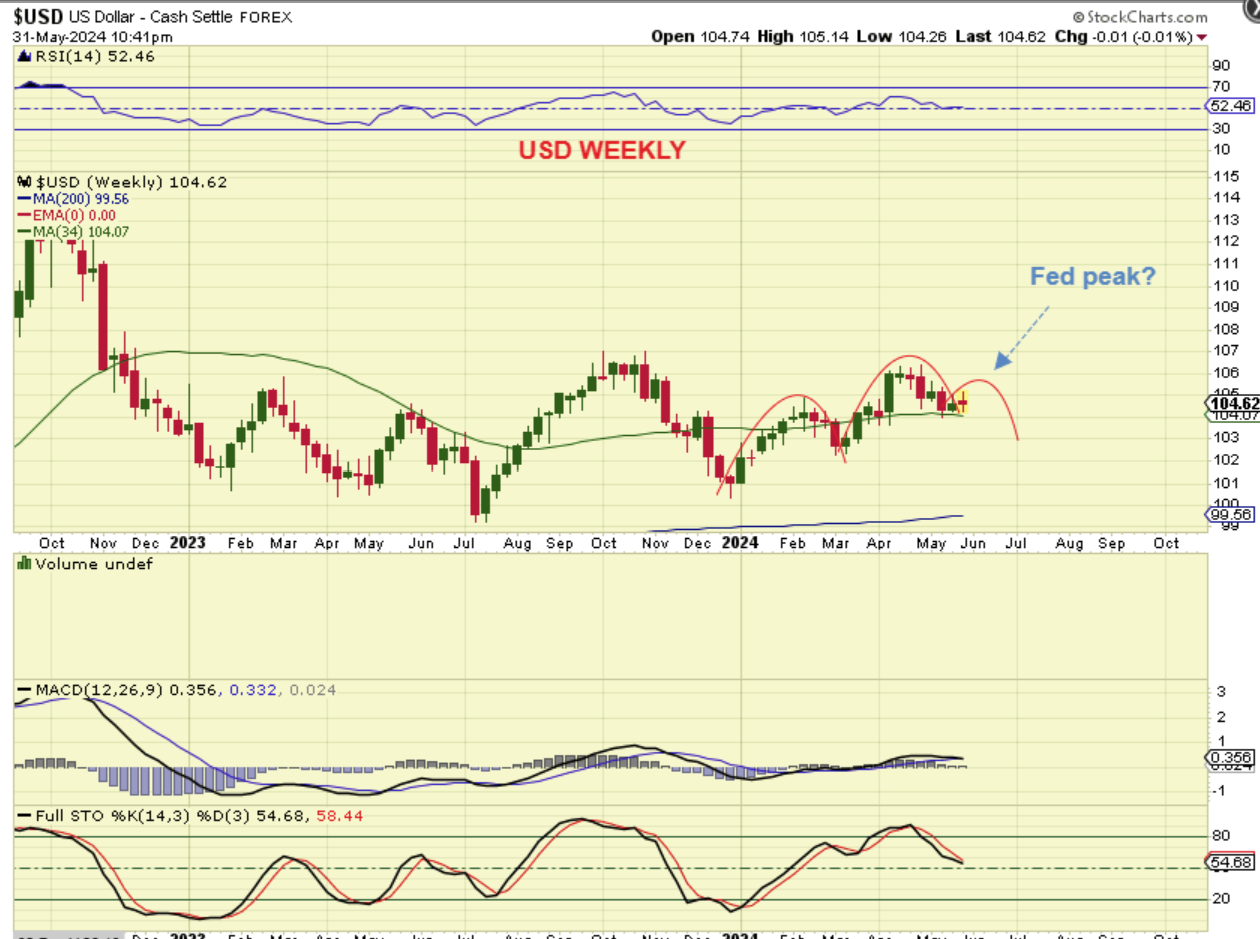
THE USD rallied out of an ICL recently, but even as far back as May 31st, I saw that the USD should rally and then roll over as drawn here on May 31. Maybe it would peak with the Fed? I thought that Gold would drop into a dcl or ICL as the USD rose up, and then the Fed would kill the USD. I drew that here. Well…
.
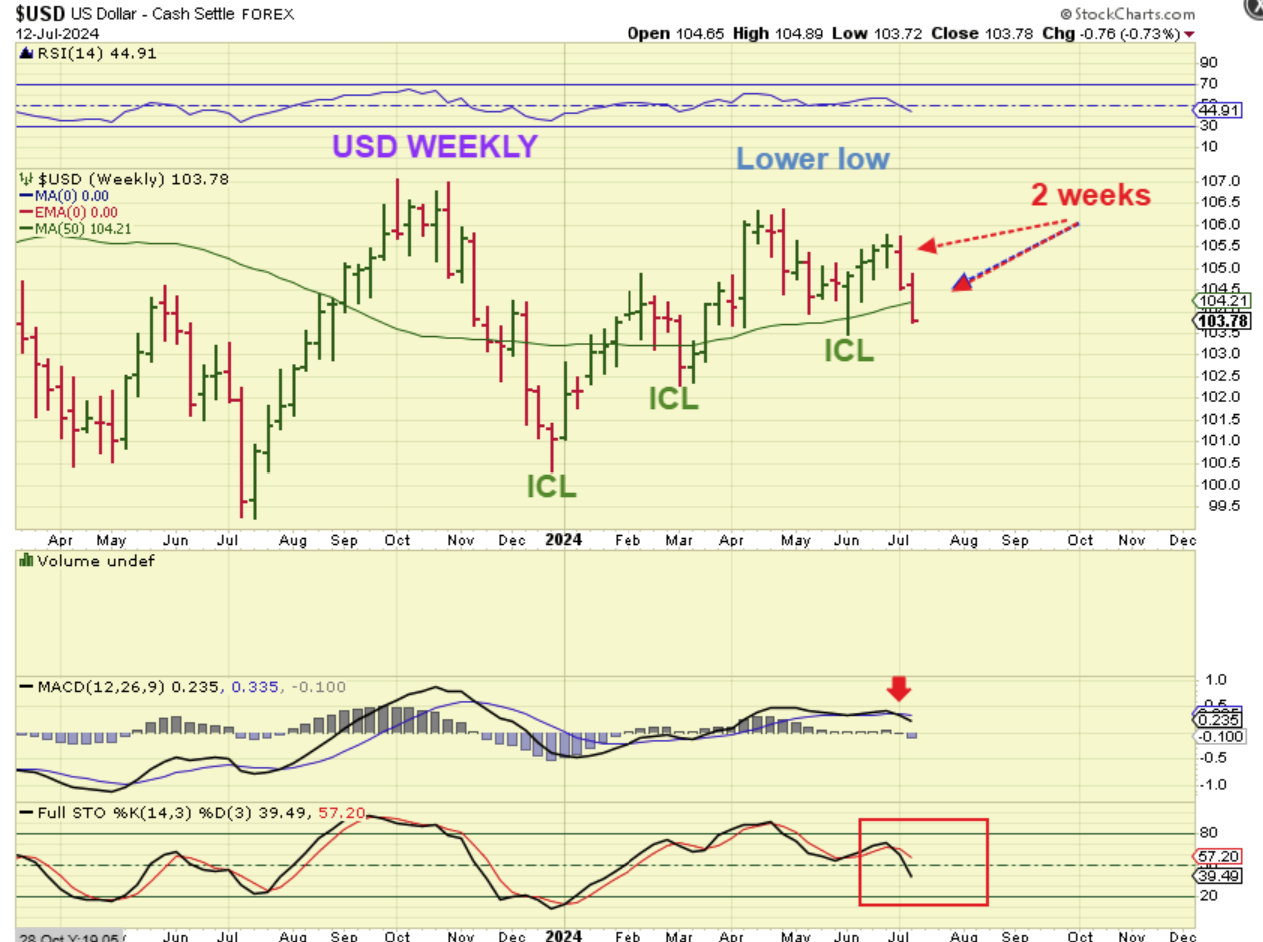
The USD dipped to a lower low and did put in an ICL with a strong weekly reversal and now over the last 2 weeks (The Fed speech mentioned that inflation was cooling down toward 2%, rate cut likely) The USD did roll over. This 2 week drop somewhat changed the timing on Gold. Inflation reports did not allow Gold to drop into a deeper ICL.
.
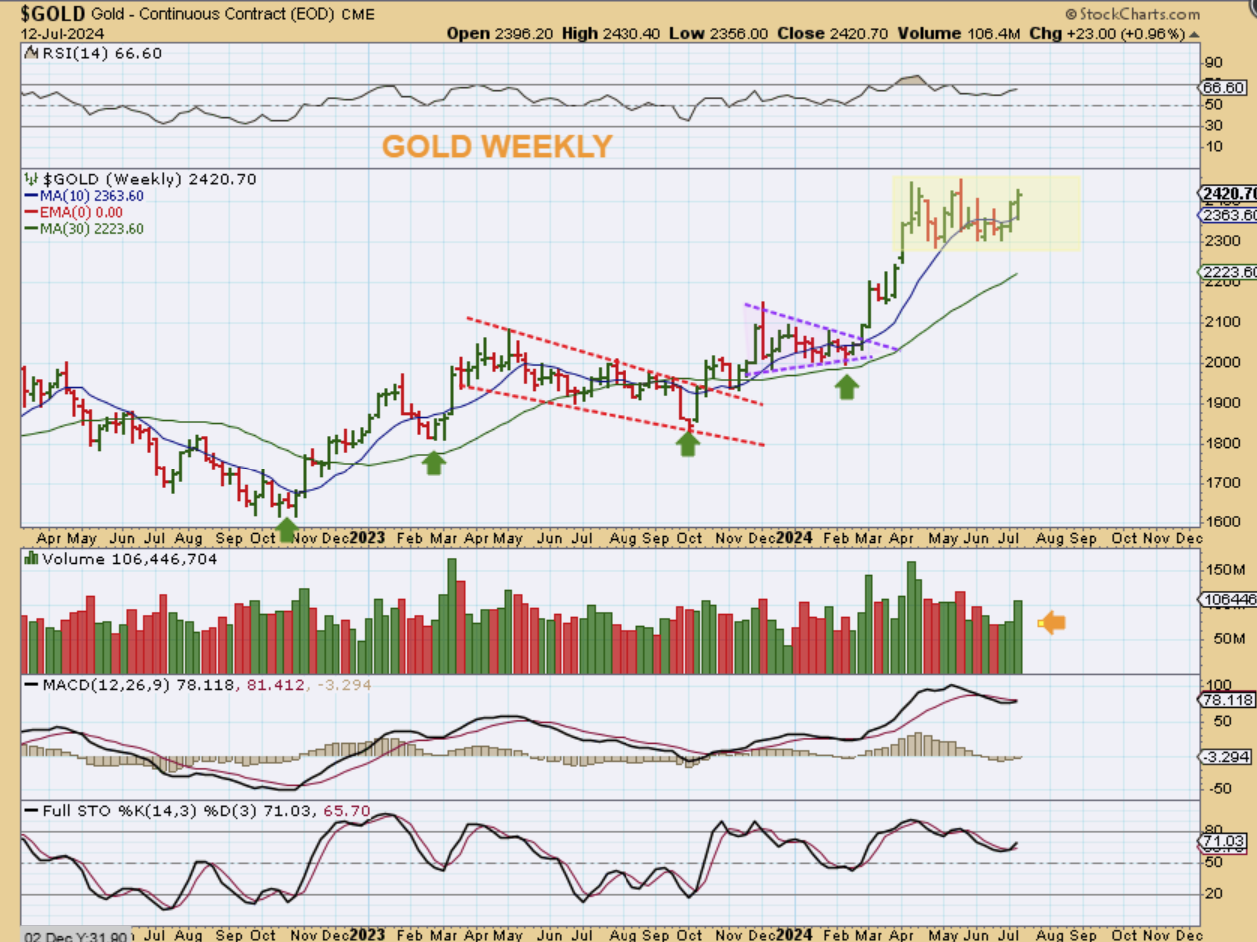
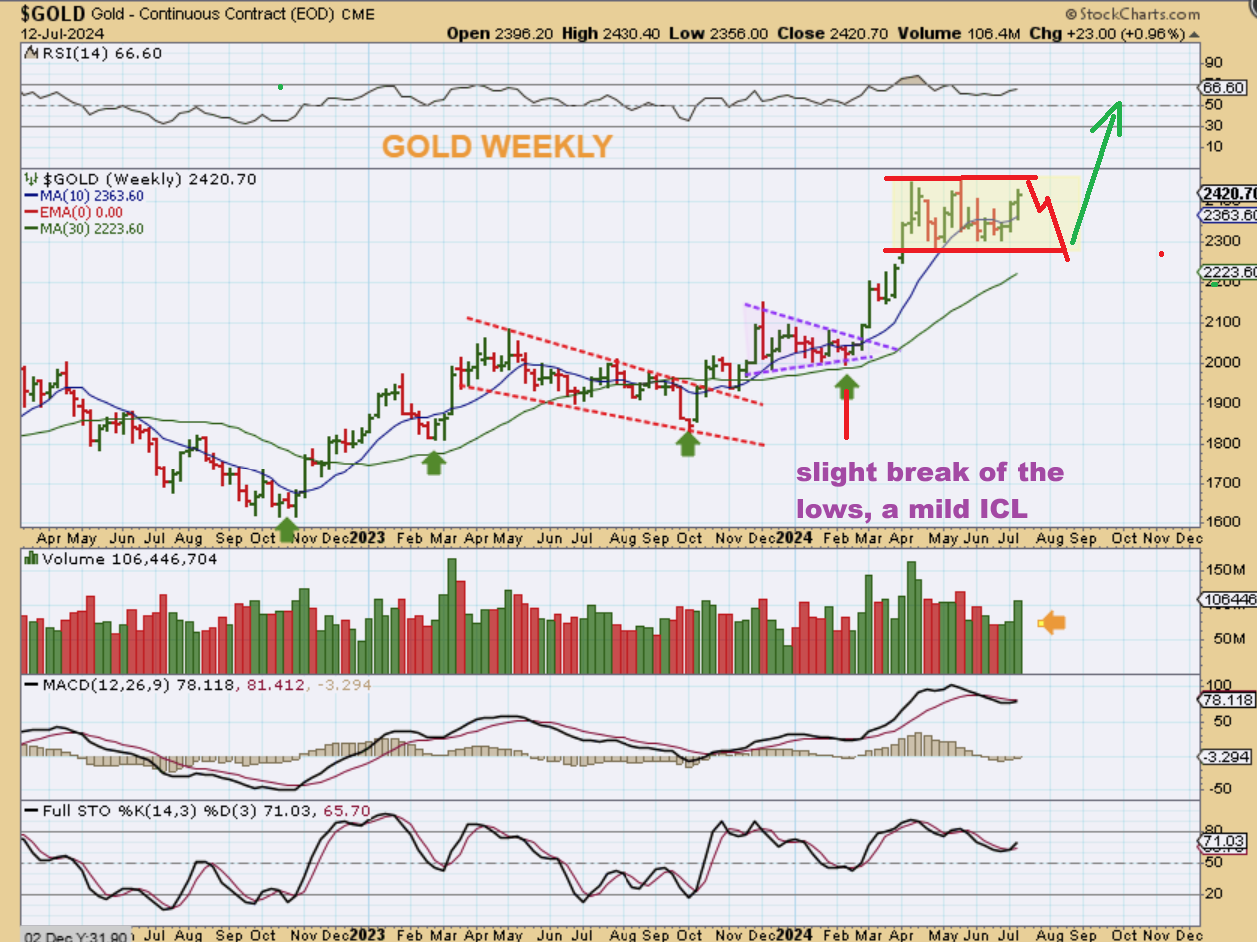
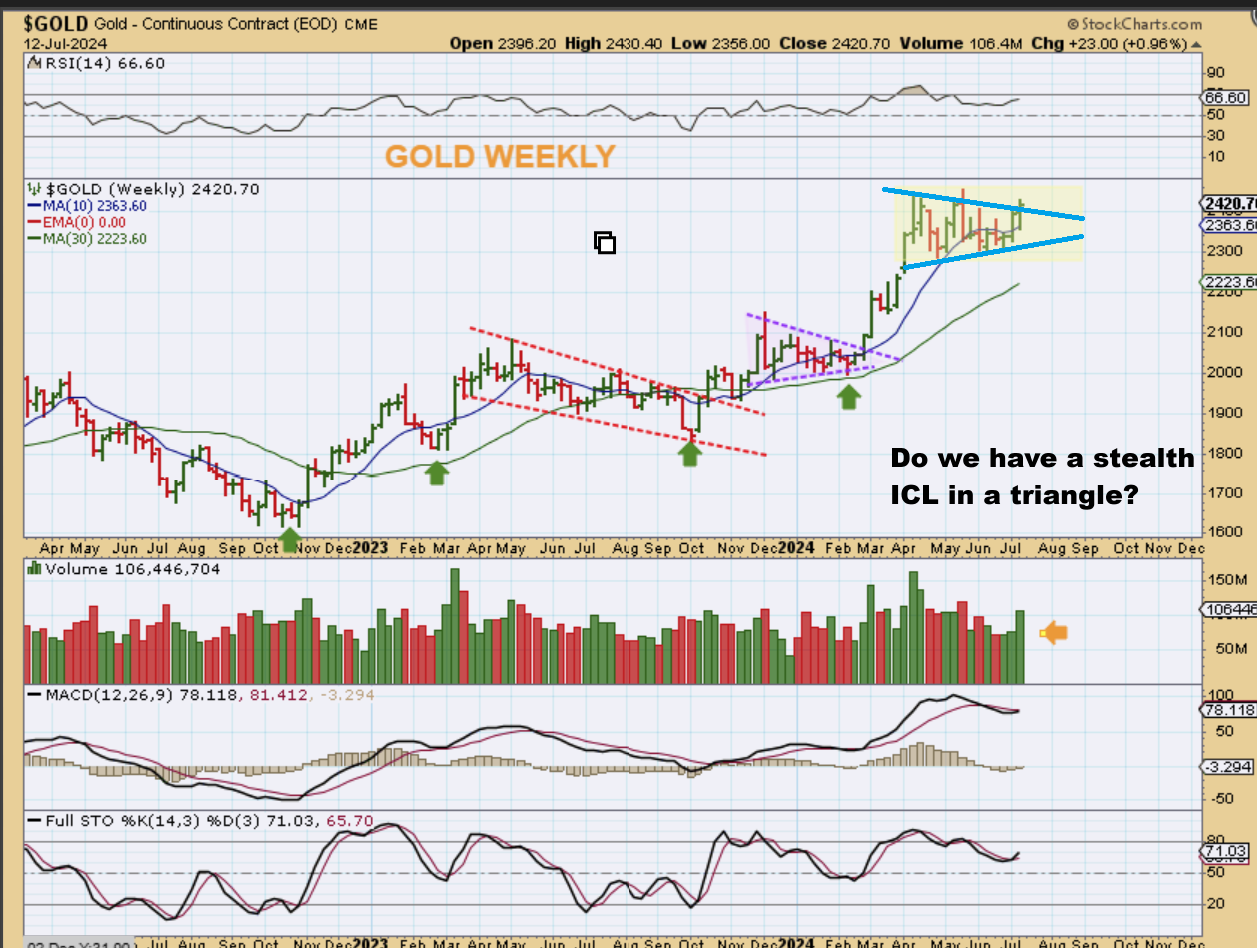
SO now we have The GOLD WEEKLY CHART showing us a box consolidation and Gold ran back up toward the highs in what should have been a 4th daily cycle. This makes things very tough to predict cycle-wise, but its obviously very bullish technical analysis wise. So here is what MIGHT be happening (2 ideas).
.
So here is what MIGHT be happening (2 ideas).
.
1. Gold could finish this 4th strong daily cycle in the box, and then drop in a weakening 5th daily cycle to a slight new low at the 30 week ma. That would be the real ICL on the 5th or 6th daily cycle, and the 30 week ma is a normal low for bull markets.
.
2. Do we currently have a bull triangle low? Maybe, this is NOT OVERBOUGHT. Let’s look at the bullish signs in what was supposed to be a 4th daily cycle. We might have a stealth ICL instead- a continuation of the Bull Run.
.
Notice that The Weekly RSI did turn up and volume spiked at a time when we expected weakness (4th daily cycle). We might wrongly conclude that the MACD is slightly divergent. I wouldn’t worry about that, since a back test usually corrects that later. I have pointed out in the past that triangles do form dcls in the apex at times when the strength does not allow for a weaker sell off to new lows. Does that work for ICLs too? This set up looks so bullish that I would not count it out. That volume last week was to be later in the 4th daily cycle, and that is showing strength. It seems that the weaker inflation / rate cut theme is winning.
.
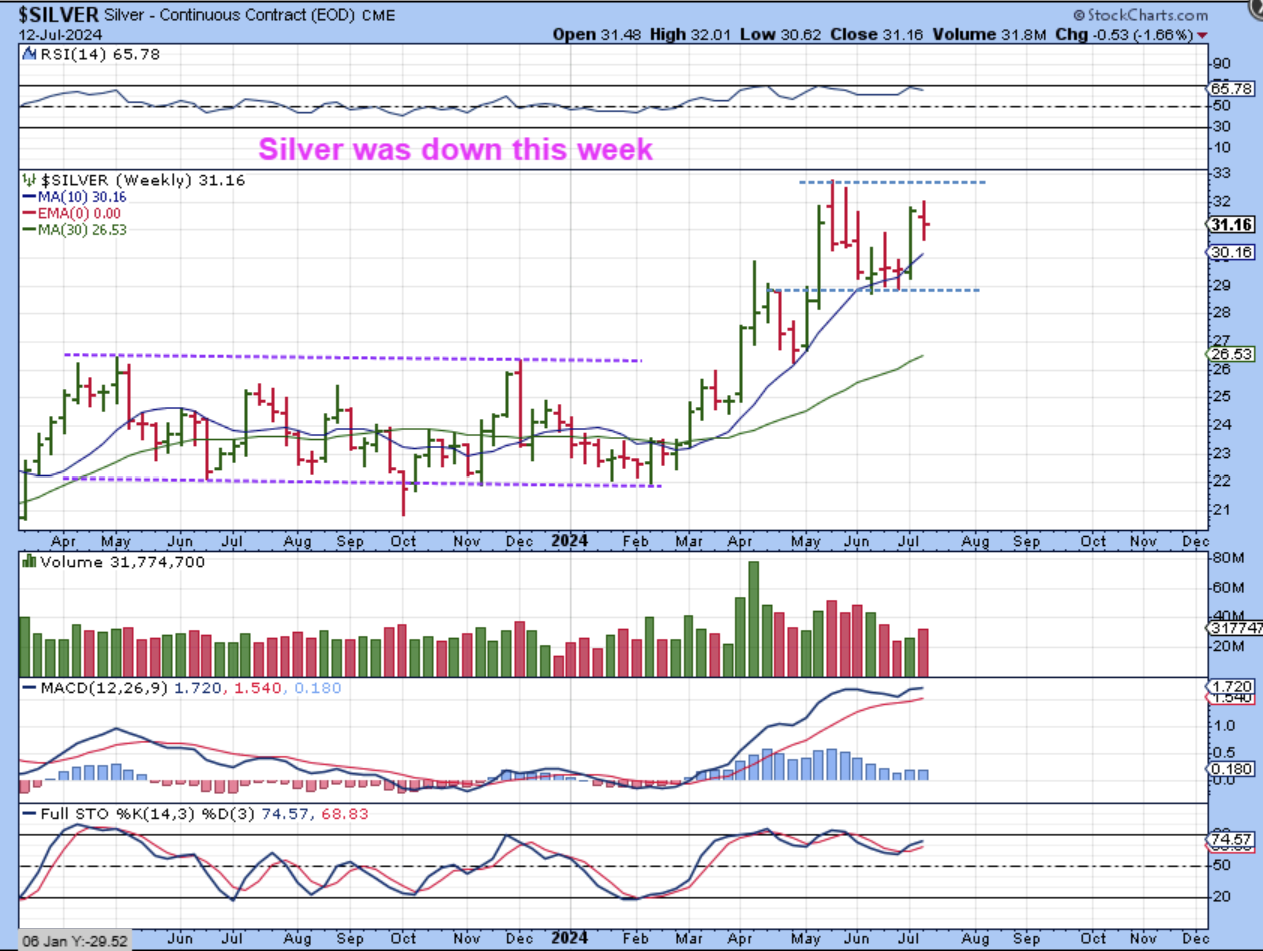
SILVER WEEKLY Silver actually dropped for the week
.
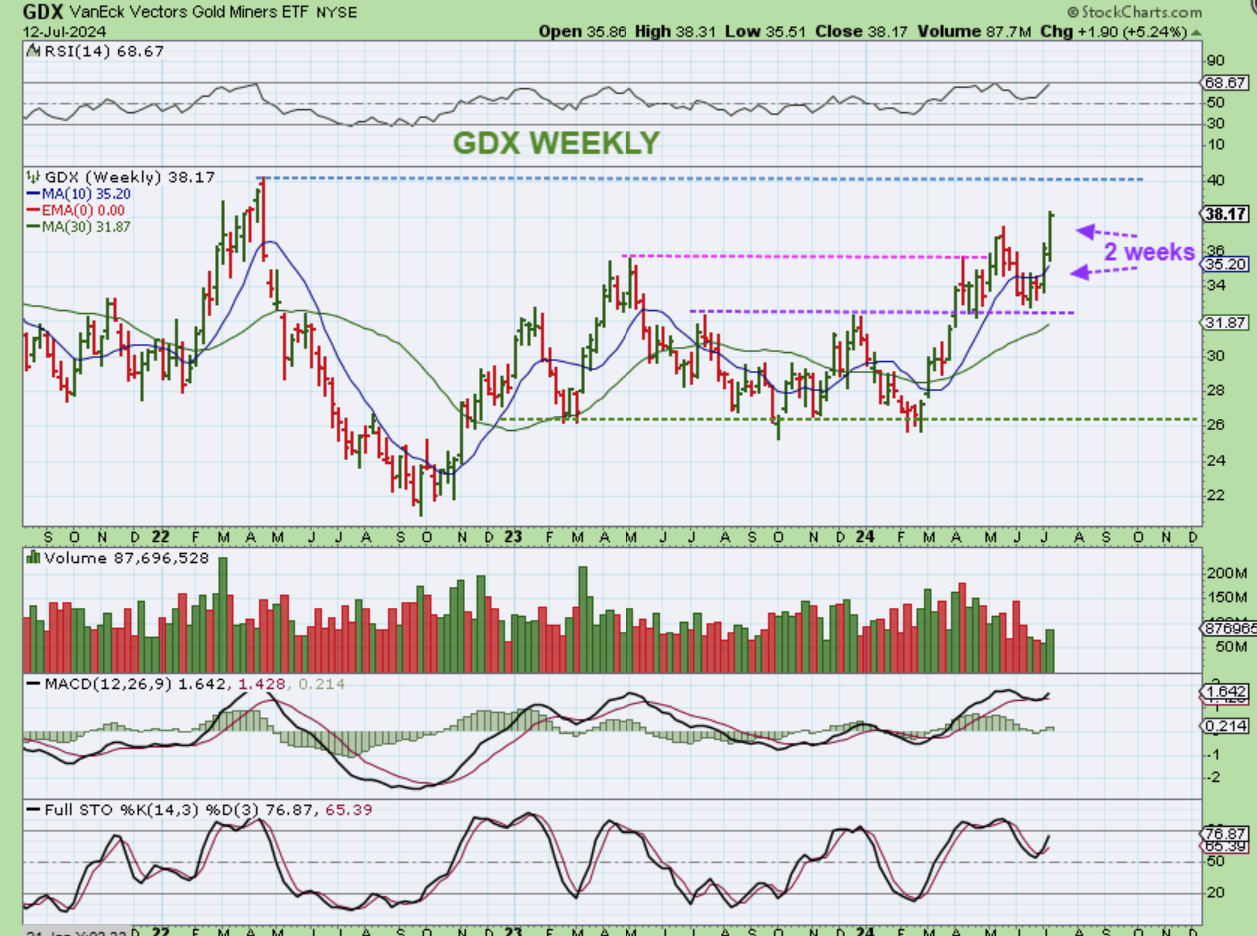
GDX was obviously not feeling the ‘ I’m in a weak 4th daily cycle’. It sold off for 5 weeks and now you can see that ever since the Fed & data supported a September rate cut 2 weeks ago, Miners took off higher and last week they broke to new highs. I had mentioned several of the downtrend breakouts at that time and said that sometimes you just can’t argue with the charts. You need to buy (maybe start small) and use stops just in case it runs away. Many miners have done well over the past 2 weeks , some are still lagging.
.
NOW FOR THE KICKER TO THIS WHOLE REPORT: I saw that the fed was scheduled to speak on Monday. I tried to find out ‘where and when’ and really had a hard time finding anything, but I did find one note…
.
.
I did find one note and it doesn’t appear to be a big deal, but it seems like lately everyone really clings to everything that he says. Will he mention the unexpected drop in CPI on Thursday, that seemed to raise the chances of a rate cut in September up to 90%? We’ll see, but at this point my report shows that…

;
We’ll see, but at this point my report shows that the general markets should dip (small topping candles), Oil could breakout with Oil stocks, the USD dropped sharply for 2 weeks and may or may not be ready to put in a dcl. Gold, Silver, and the Miners are slightly mixed, but bullish in their set ups. Gold rallied, Silver actually dipped a little, and the Miners took the lead in breaking out to new highs. Miners leading the way is always a more bullish set up, so stay tuned and we’ll see how all of this plays out on Next week.
.
Enjoy your weekend, and thanks for being here!
.
~ALEX
.
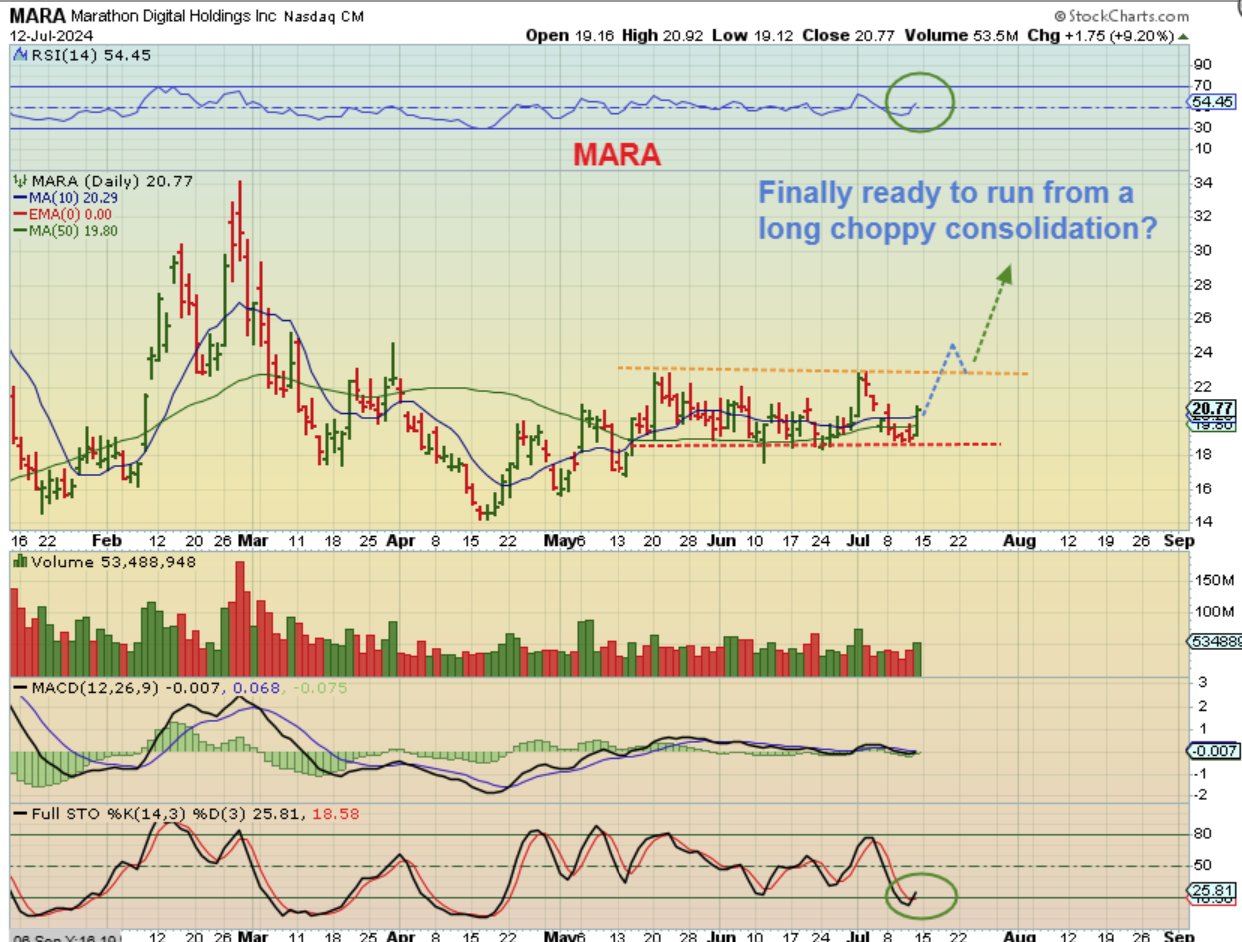
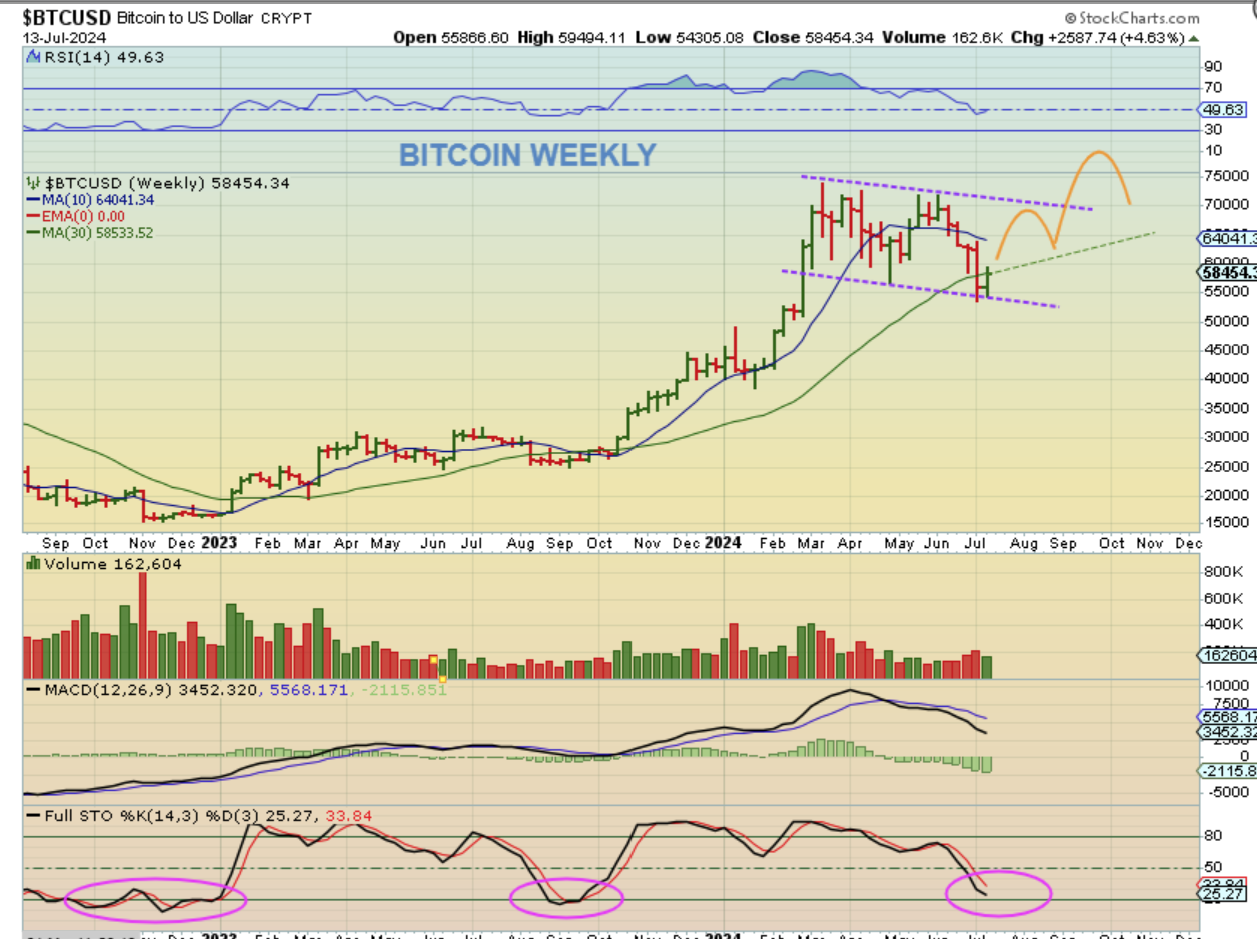
BITCOIN WEEKLY – Bitcoin was due for a low and I had marked one on day 65 last week. We now have a weekly reversal at the lows and this SHOULD push higher for a while. I have drawn a bullish outcome possibility. The good news is that the Crypto Miners FINALLY started to rally on Friday and they did NOT give it back this time, so MAYBE we have the lows in place for the stocks too, and those crypto related stocks will be a little more consistent.
.
MARA – Up 9%. Crypto Miners FINALLY started to rally on Friday and they did NOT give it back this time, so maybe well see follow through and make some good gains in this sector again.