
Friday July 19th
There is no major economic data scheduled for Friday. That might be the good news, because yesterday’s jobless Claims report came in higher than expected ( 243,000 vs est. 229,000) and we did see a sell off as a result. Let’s take a look at the charts…
.
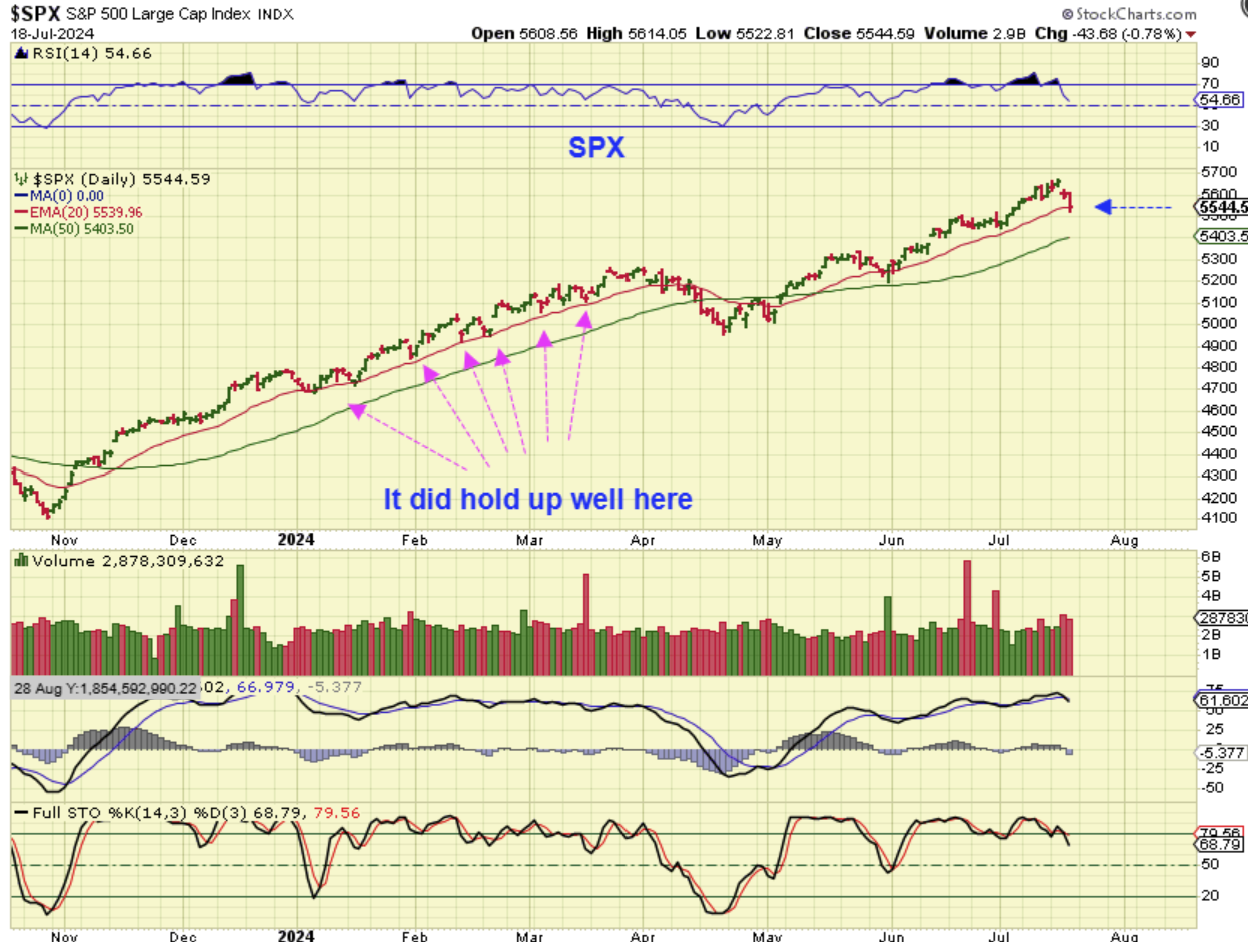
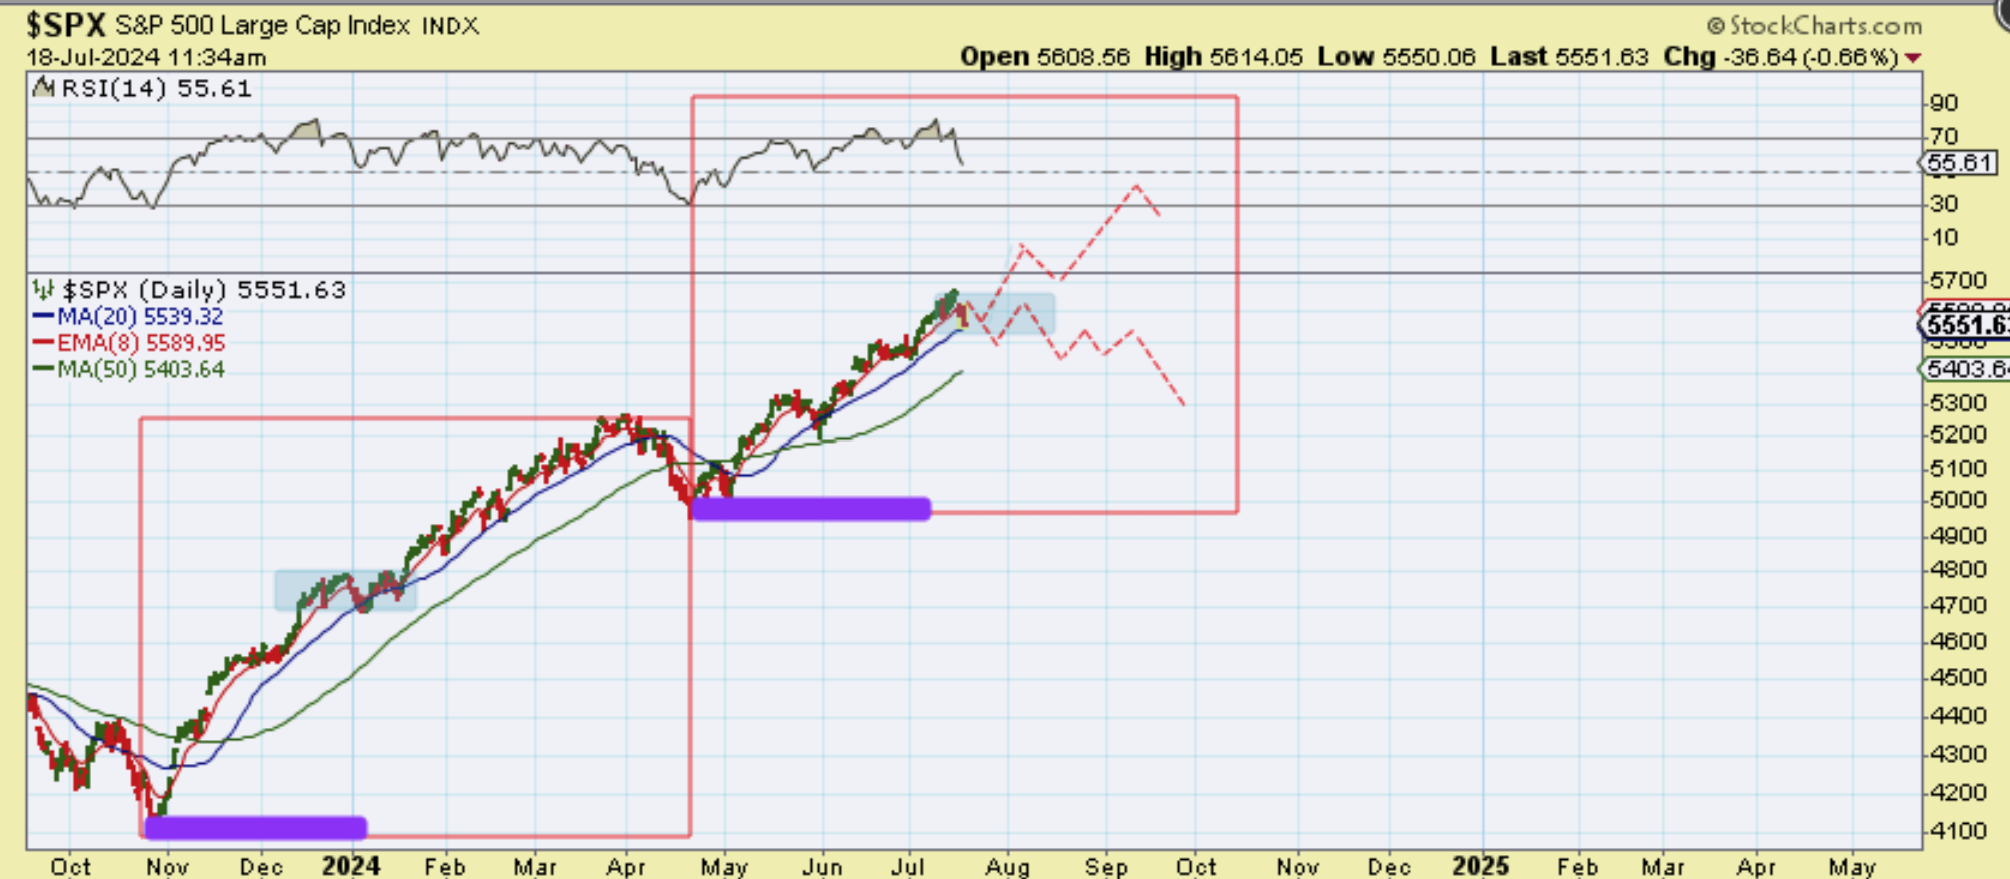
So we see that the SPX dropped to the 20 ema, and I expected that we could see that, since I saw that happen in past bull runs. Today, however, we’ll see if the selling drops deeper than that or not. In the last bull market run from Octobers ICL to April, price travelled along that 20 ema (Majenta arrows).
.
If The SPX breaks down, that might mean that we are starting to see a weakening of this daily & intermediate cycle. If so, the path going forward could be choppier than the last run in November to April was.
.
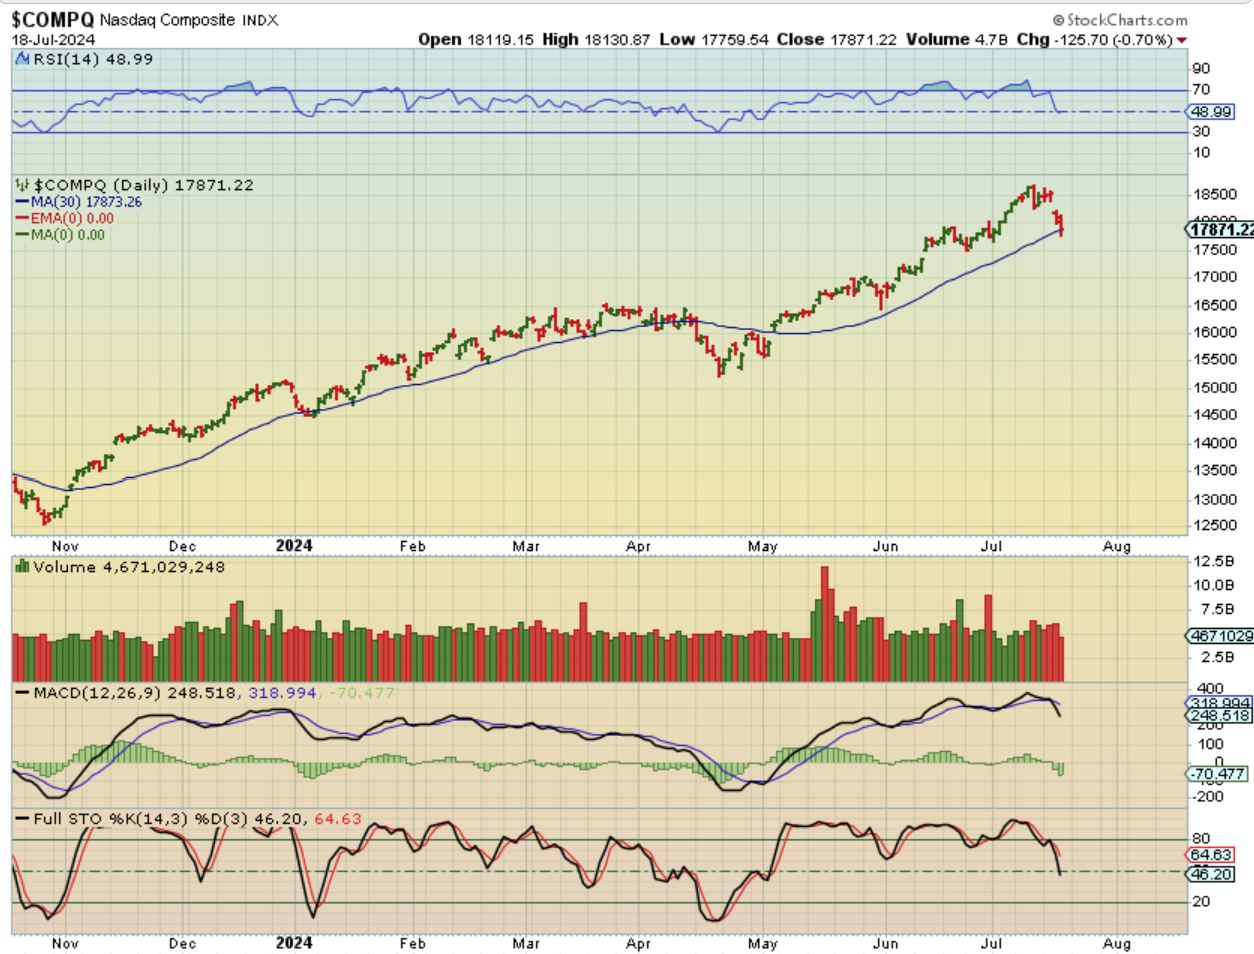
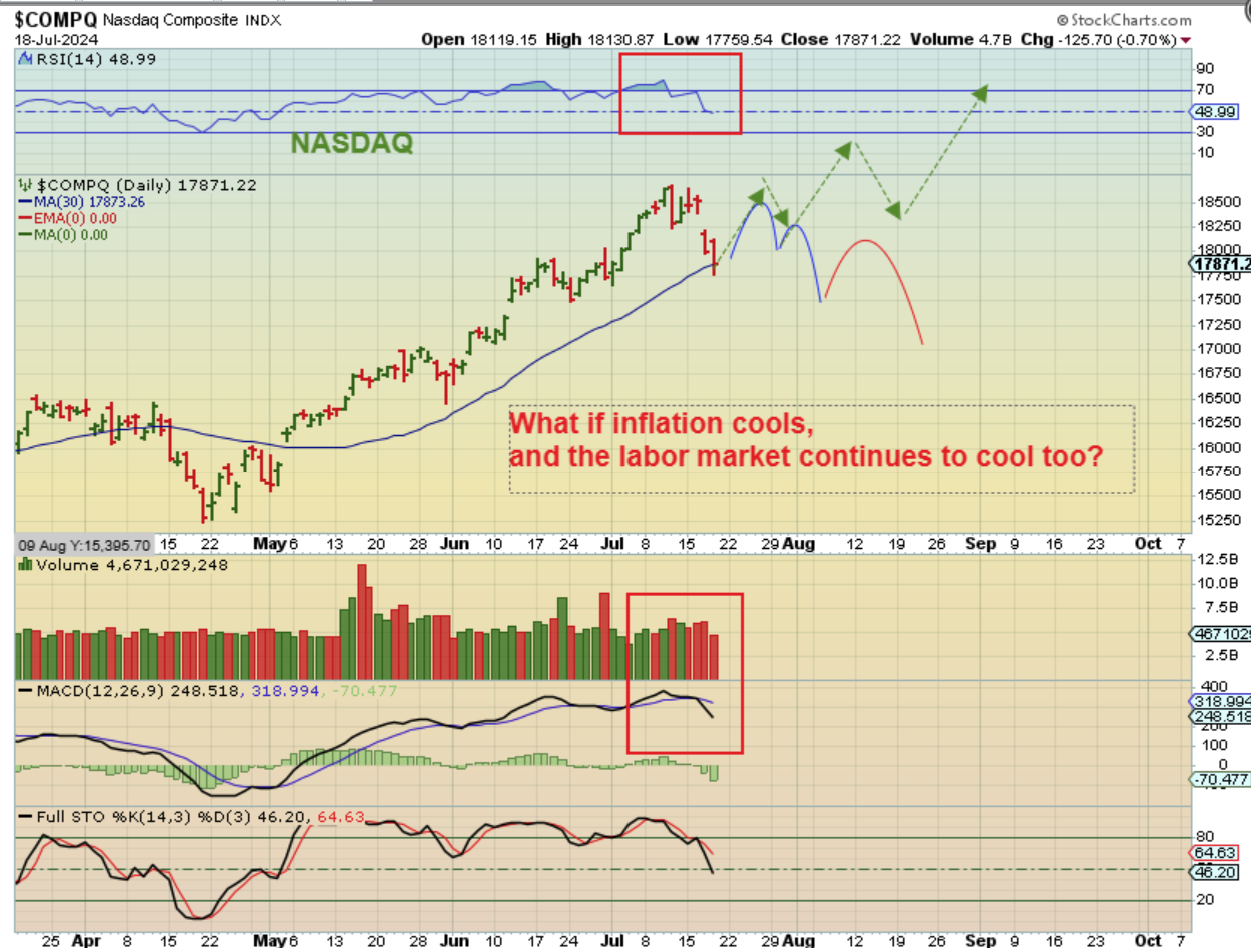
THE NASDAQ drops deeper than the SPX. so I used the 30 sma ( I often use the 34 sma). This is as low as past dips used to travel, so today might give us an idea if we are still repeating that strong run from October to May, or are we possibly going to be seeing some weakening?
.
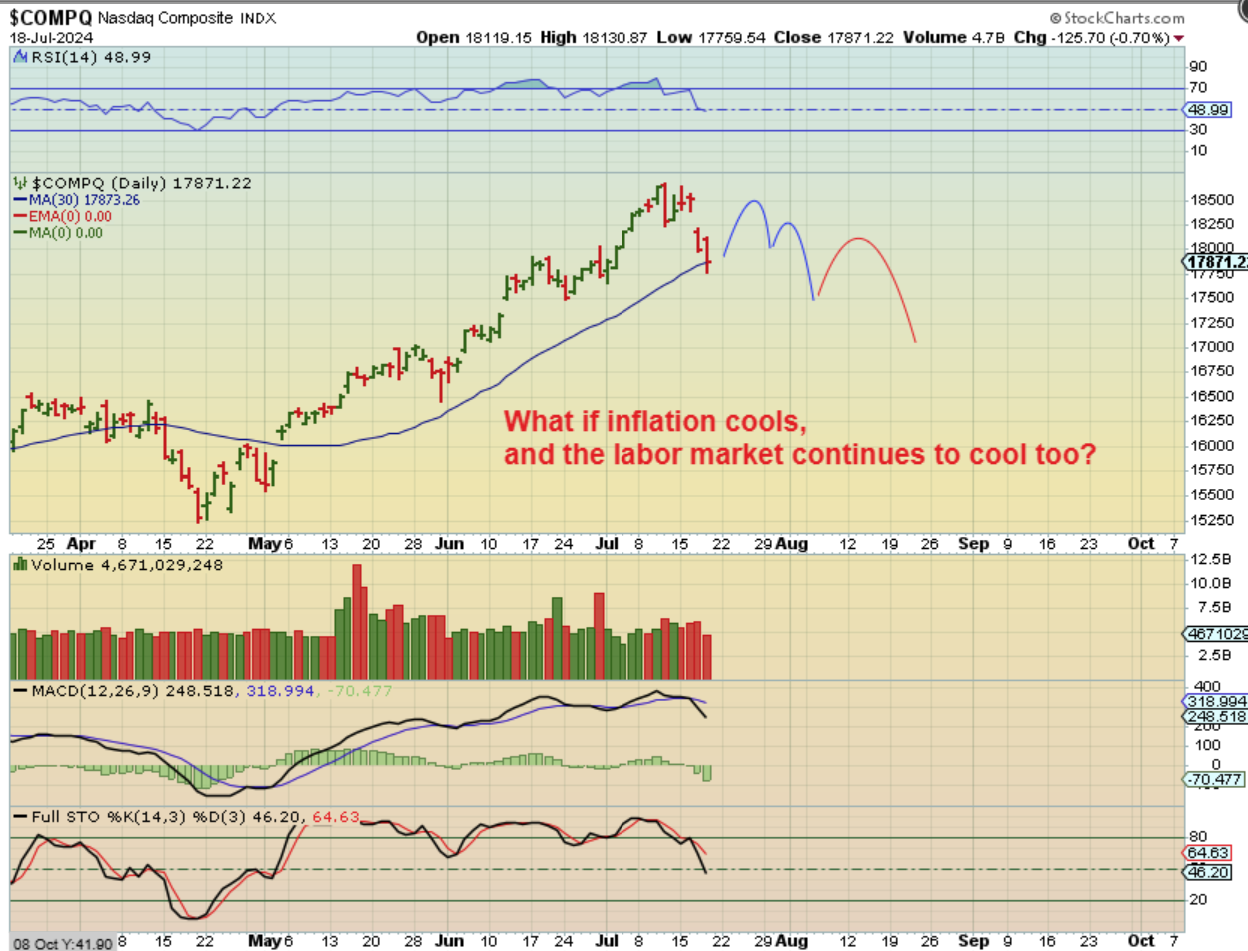
NASDAQ – The Jobless Claims Report showed a higher number of employment claims than expected. This also increases the chances of a rate cut, but it might signal that the economy is weaker than it was last year at this time and it could continue to weaken going forward. This could weaken the bull run, and the path could get choppier, as shown here. We’ll see.
.
NASDAQ – We We’ll see today if we get a reversal from the selling or will the Nasdaq close below the 30 or 34 sma.
.
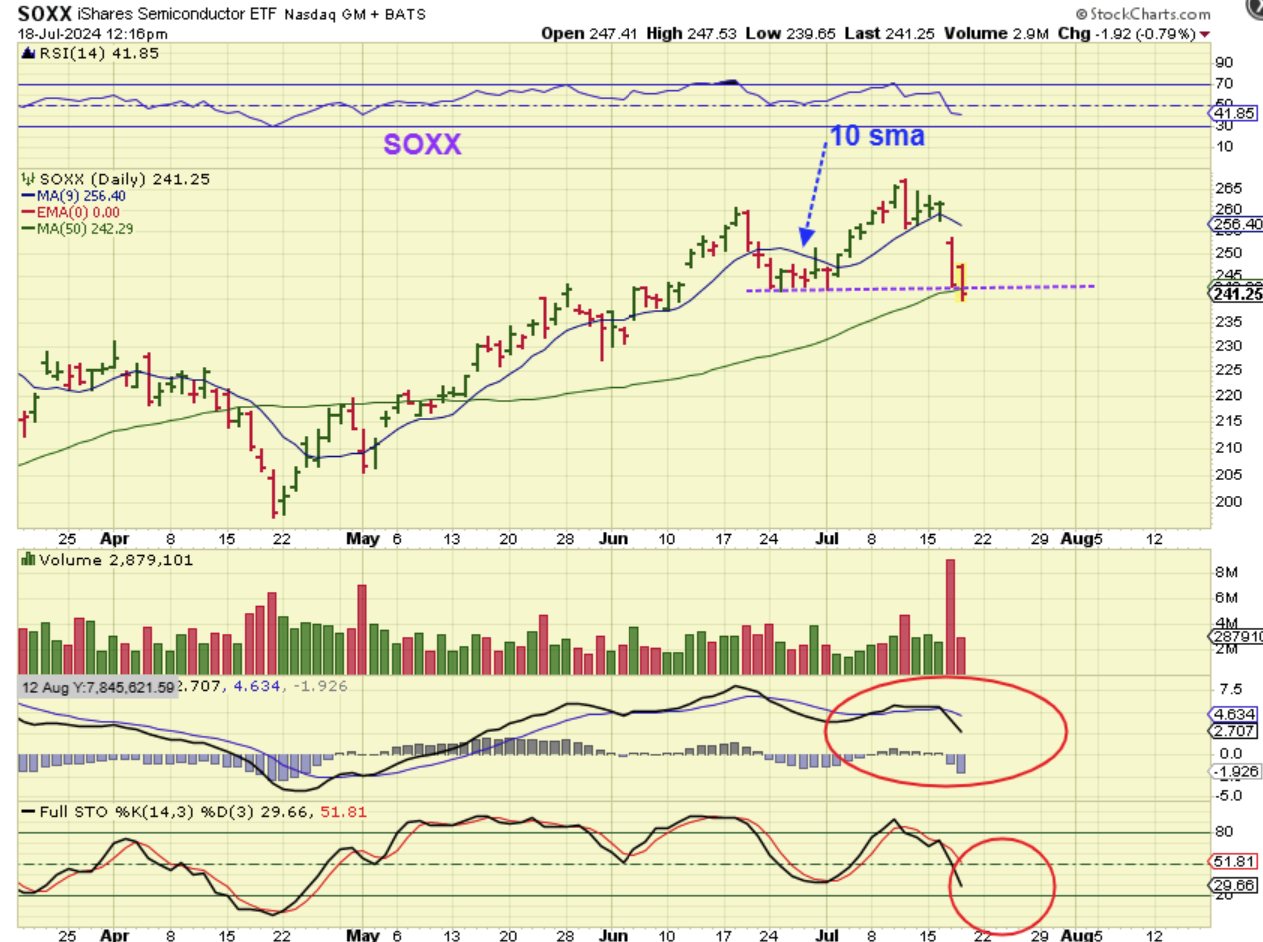
I saw The SOXX break the 50sma and it also seems to have broken the last dcl. That would be a failed daily cycle, calling for a sell down to lower lows over time. This is somewhat important to me, because the semis often lead the markets. I will say that the SOXX reversed and closed back above the 50sma (shake out?), so today is important for the SOXX.
.
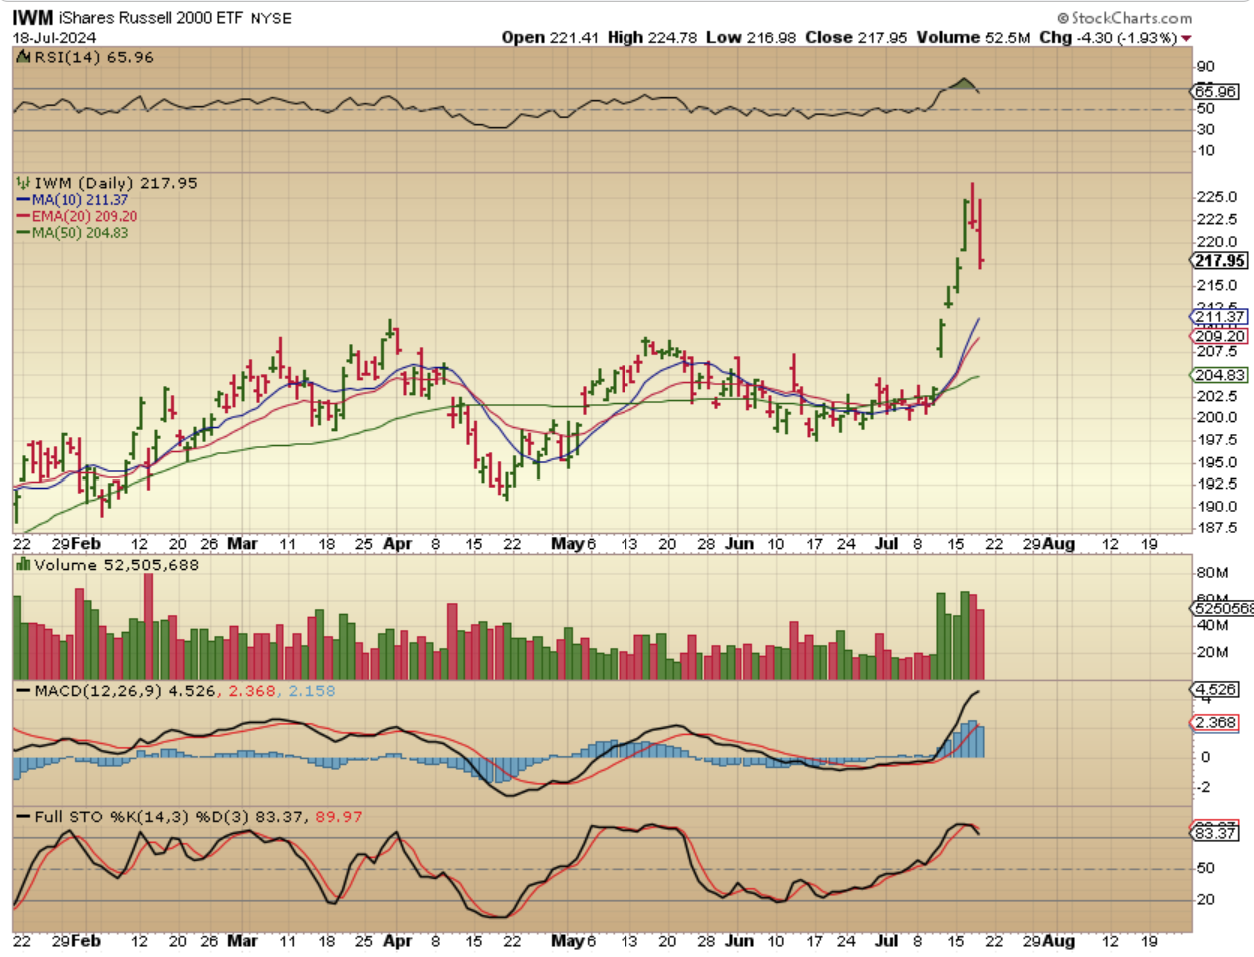
Obviously, we watched the IWM take off like a rocket and it got overheated quickly this week, so a little selling here would have been expected. That said, I want to see how the rest of the General Markets do today, especially by the close.
.
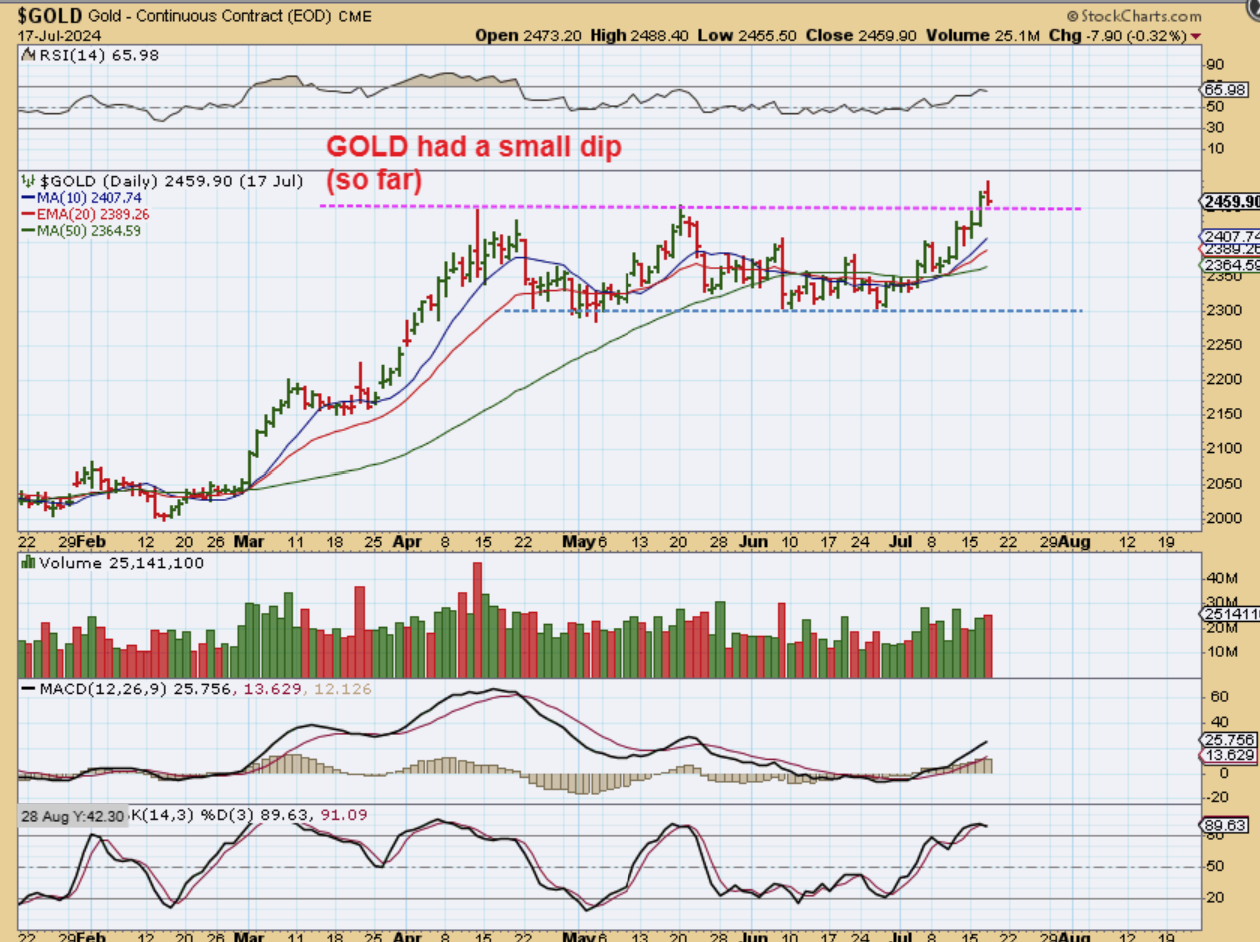
GOLD reversed and is back testing the breakout to new all-time highs. This is not a big deal, but Silver sold off a bit more than Gold did, and the Miners also dipped more than Gold, so let’s take a look there.
.
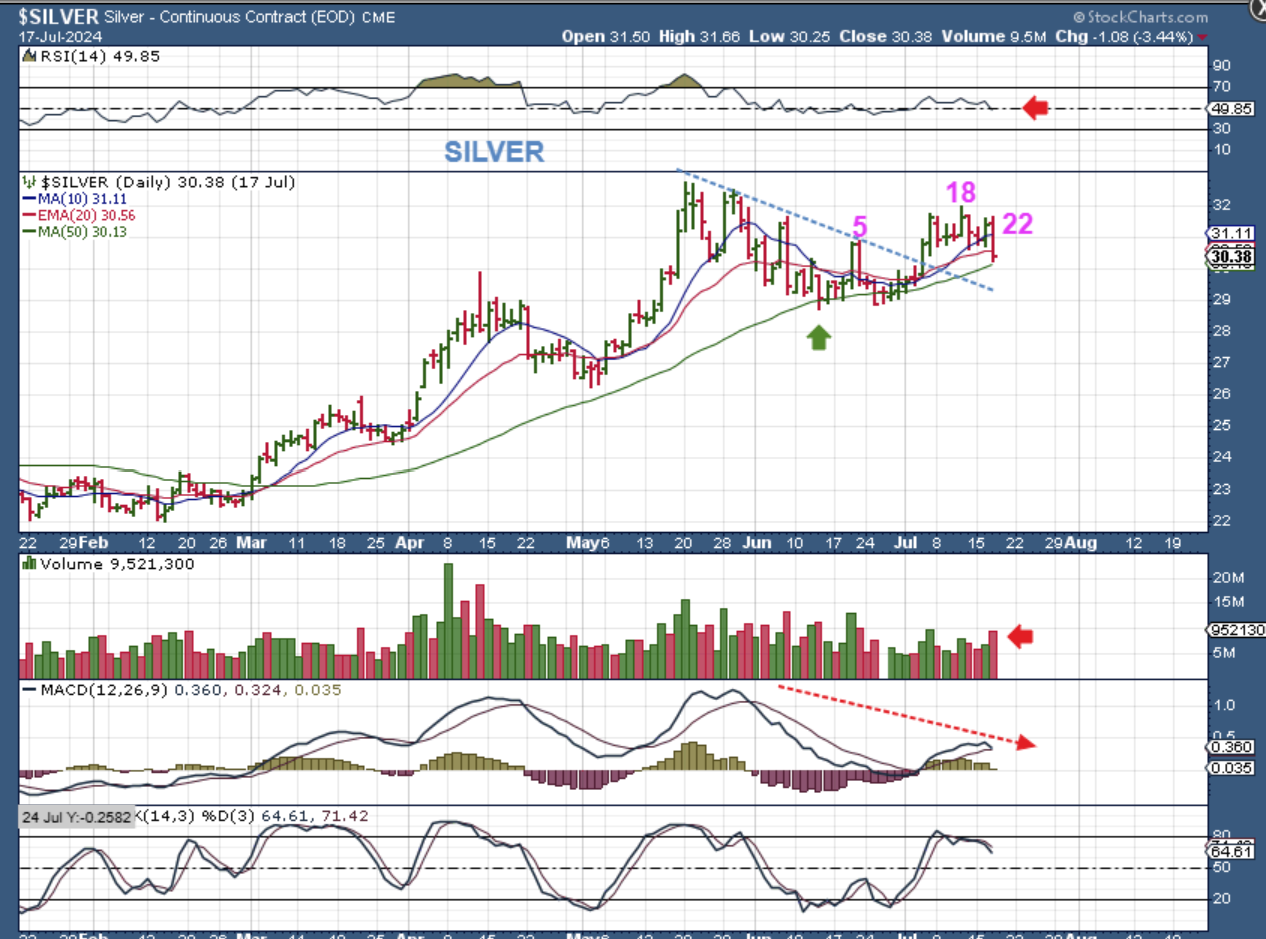
SILVER dropped 3.44% on day 22, to the 50sma. Normally I would say that a back test to the 50sma is fine, but this doesn’t look right on day 22. That MACD tells me that this is a double top and yesterdays volume agrees. Silver looks to me that it will break the 50sma and next would be a tag of that trendline, but this late in a daily cycle means a possible sell off down to the next dcl. NOTICE THAT SILVER WAS NEVER AS STRONG AS GOLD OR THE MINERS.
.
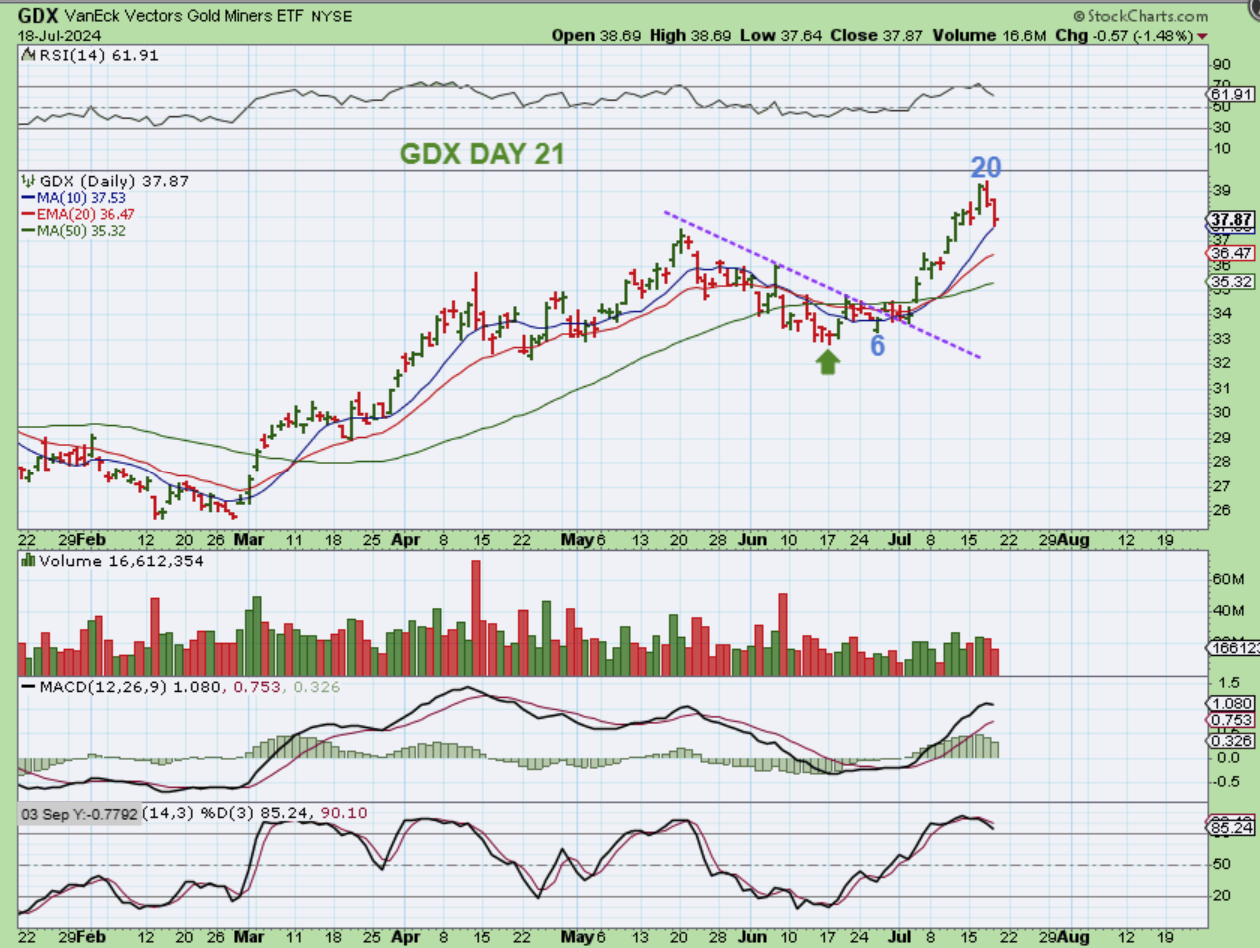
THE GDX ETF or The Miners were strong and we saw a nice rally that has, so far, peaked on day 20. This is now experiencing a drop to the 10sma, but Silvers chart makes it look like we will see more of a pullback. I will say this….
.
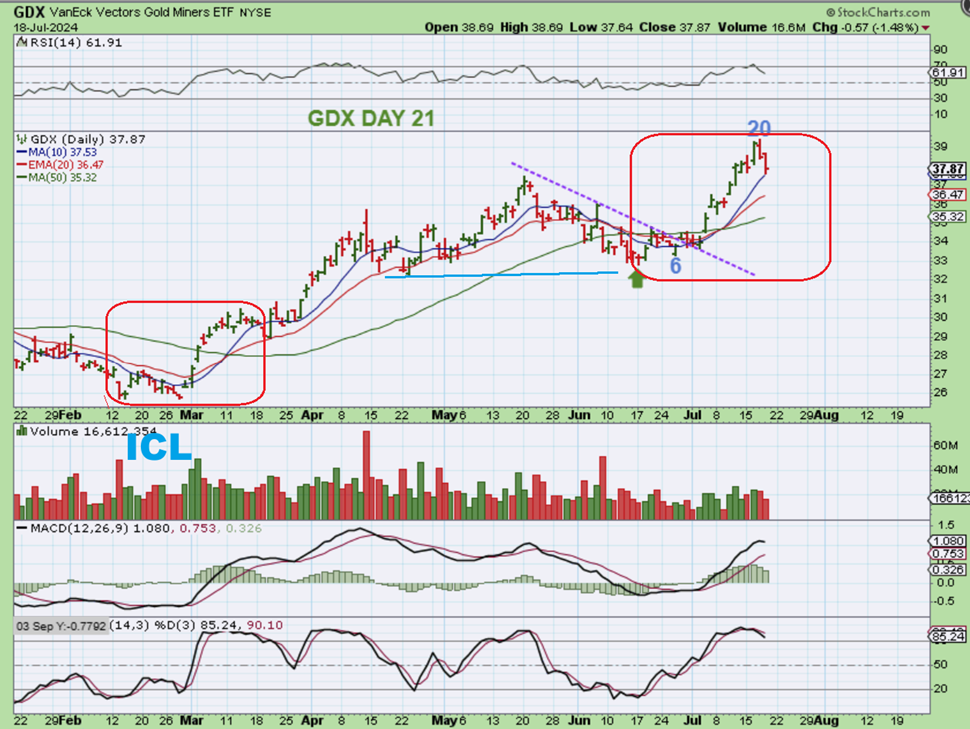
THE GDX ETF: I will say this…
This did look very much like a move out of an ICL, because it broke that downtrend and even made it to new 2024 highs. This move now looks very similar to that ICL move in February to March, doesn’t it? A dip to a dcl from here could be choppy and land on the 20 ema or 50sma.
.
So today seems important when it comes to the markets ‘price action’ after that unemployment report. The General Markets landed at an area where they reversed in the last Oct to April bull run. Oil has not changed, it still looks bullish along with Oil stocks, and the Precious Metals sector looks like it might be ready to chop lower into its next dcl. Gold didn’t drop much, but that may become a false break to new all-time highs if what I am seeing in Silver plays out. Silver looks ready to drop and the GDX looks like a possible daily cycle top. Bitcoin is pausing a little, so I’ll discuss that below too. Enjoy your Friday trading and it might be worth thinking about how heavily or how light you want to be going into the weekend, depending on what we see in the markets today. I also have a small section that I will lable ‘LESSONS” at the end of this report. Enjoy!
.
~ALEX
.
YESTERDAY I MENTIONED THIS ABOUT BITCOIN:
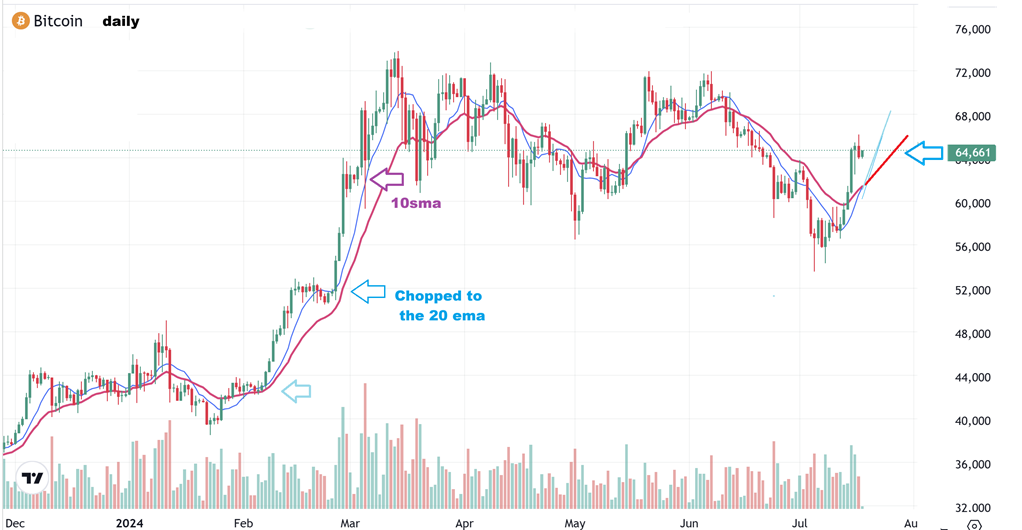
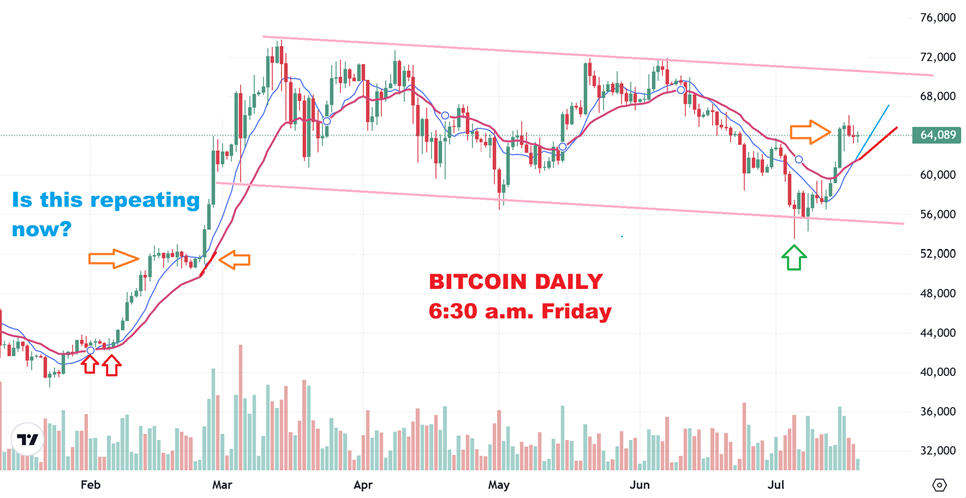
There are times when Bitcoin chops sideways and moves over to the 10sma, and there have been times that it ‘pauses’ and works its way all the way over to the 20 ema too. That can take from a few days to even 2 weeks. I pointed that out on this chart, please take a look at the arrows.
.
Bitcoin – So there is absolutely nothing wrong with the price action for Bitcoin, but you can see from past sideways pauses to the 10sma or 20 ema that this chop can last for days. The problem is…the Miners often exaggerate the move.
.
The problem is that the Miners can often exaggerate the move.
.
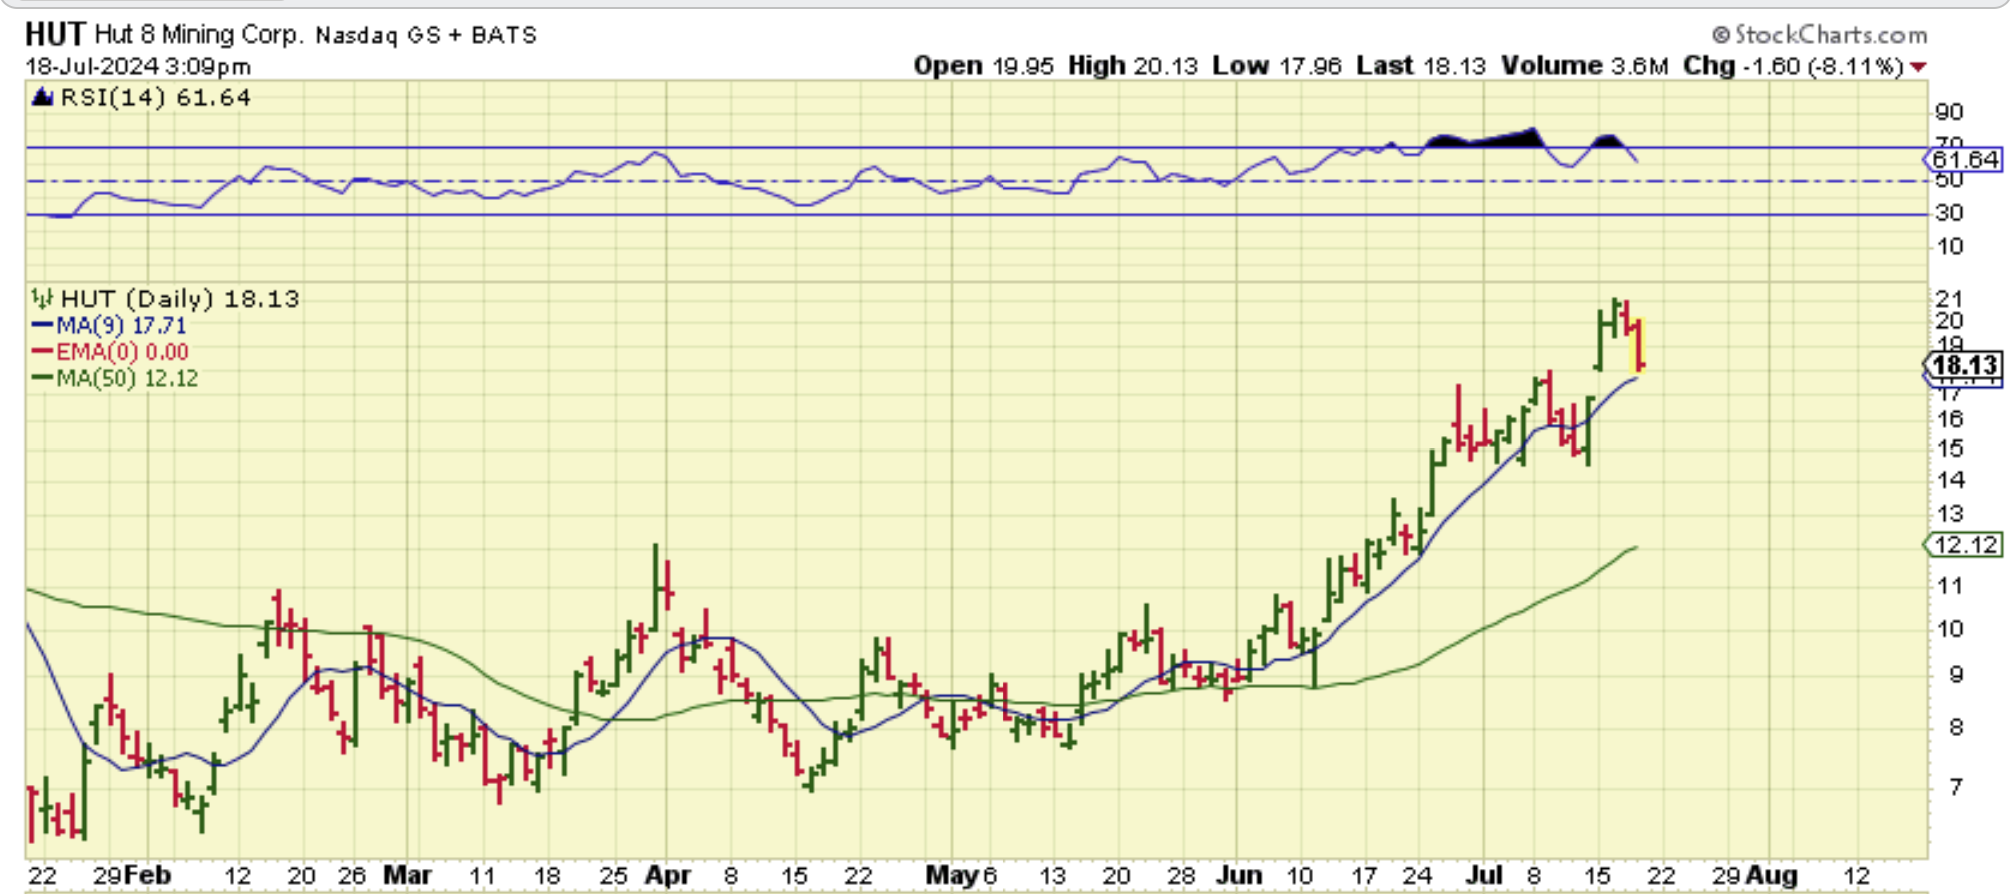
HUT – After a strong run like the one we saw in Hut, a small pause in Bitcoin can cause a drop of 8-10% in 1 day. If that pause continues in Bitcoin, HUT may get choppy or it could drop further too.
.
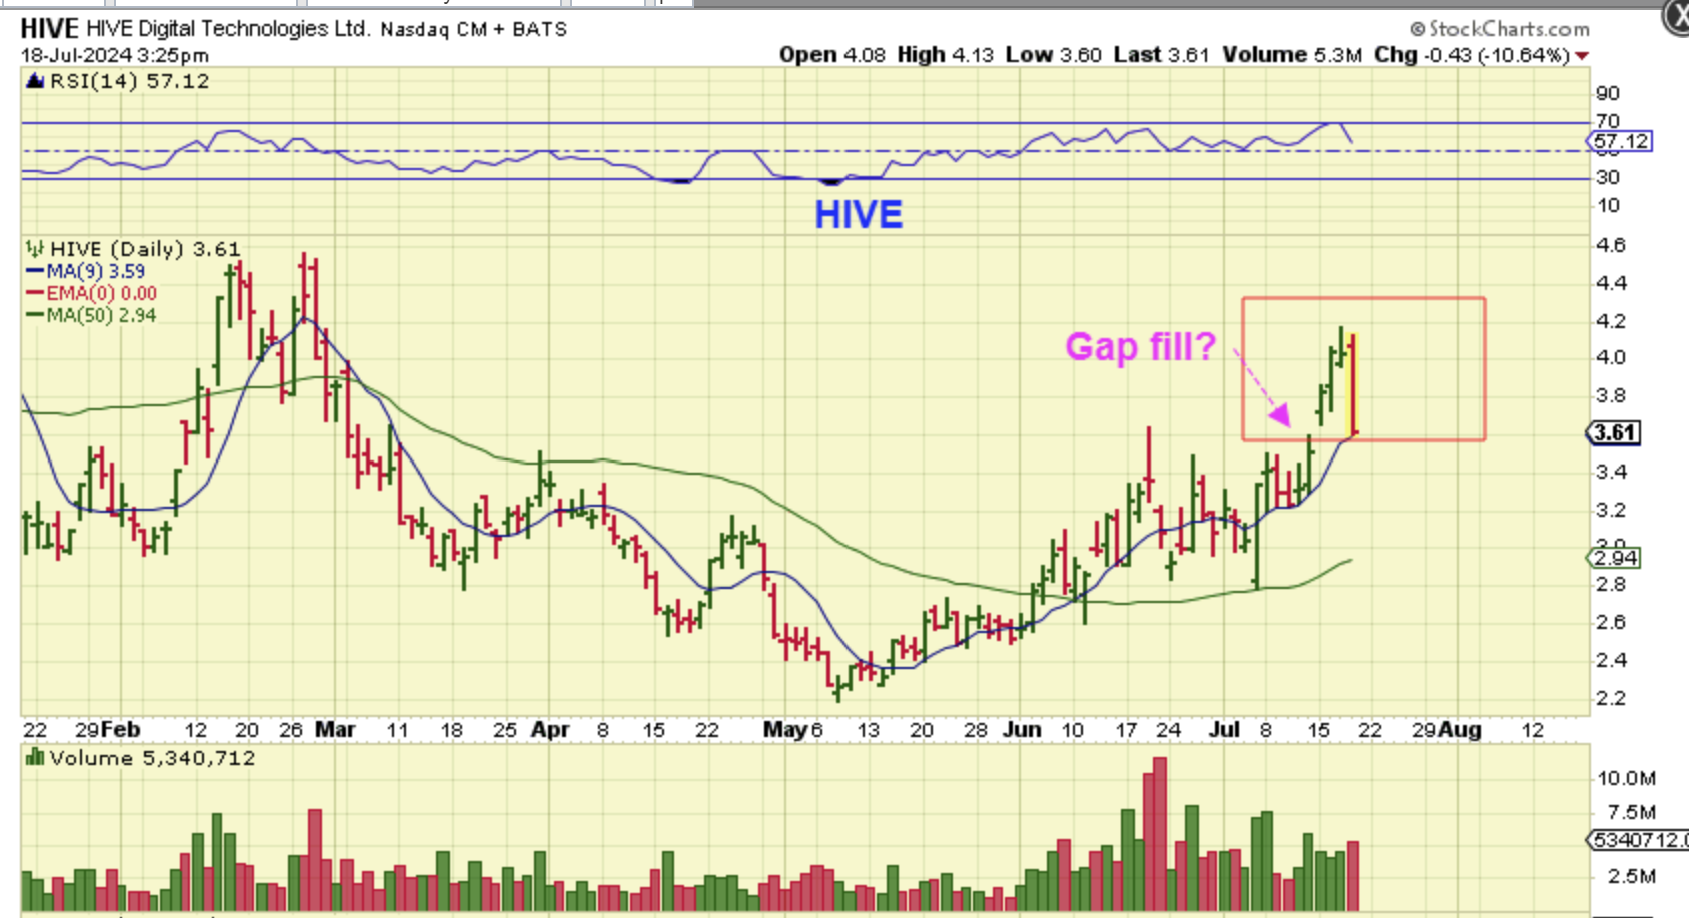
I have owned HIVE for a while now, so I had decent gains here. One thing that is bothersome about some of these is that in 1 day like yesterday, we saw HIVE give back 3 days of gains in a 10% drop. I still have gains here, but if this were to continue with Bitcoin going sideways to the 20 ema, this could drop to that 50sma again, and start all over. GREAT NEWS for anyone wanting to buy, bad news for anyone in that ‘Buy & Hold’ mode.
.
LESSONS! A LESSON IN PRICE ACTION:
On the last run, my biggest holdings were WULF, IREN, HUT, along with a basket of others. After they ran strong and Bitcoin sold off into a bottom, I wanted to cut those positions in half to lock in strong gains and yet still let them run. I THEN added that money to some good companies that lagged, like RIOT, MARA, CLSK, CIFR. So let me discuss MARA, which was now going to be my biggest holding…
.
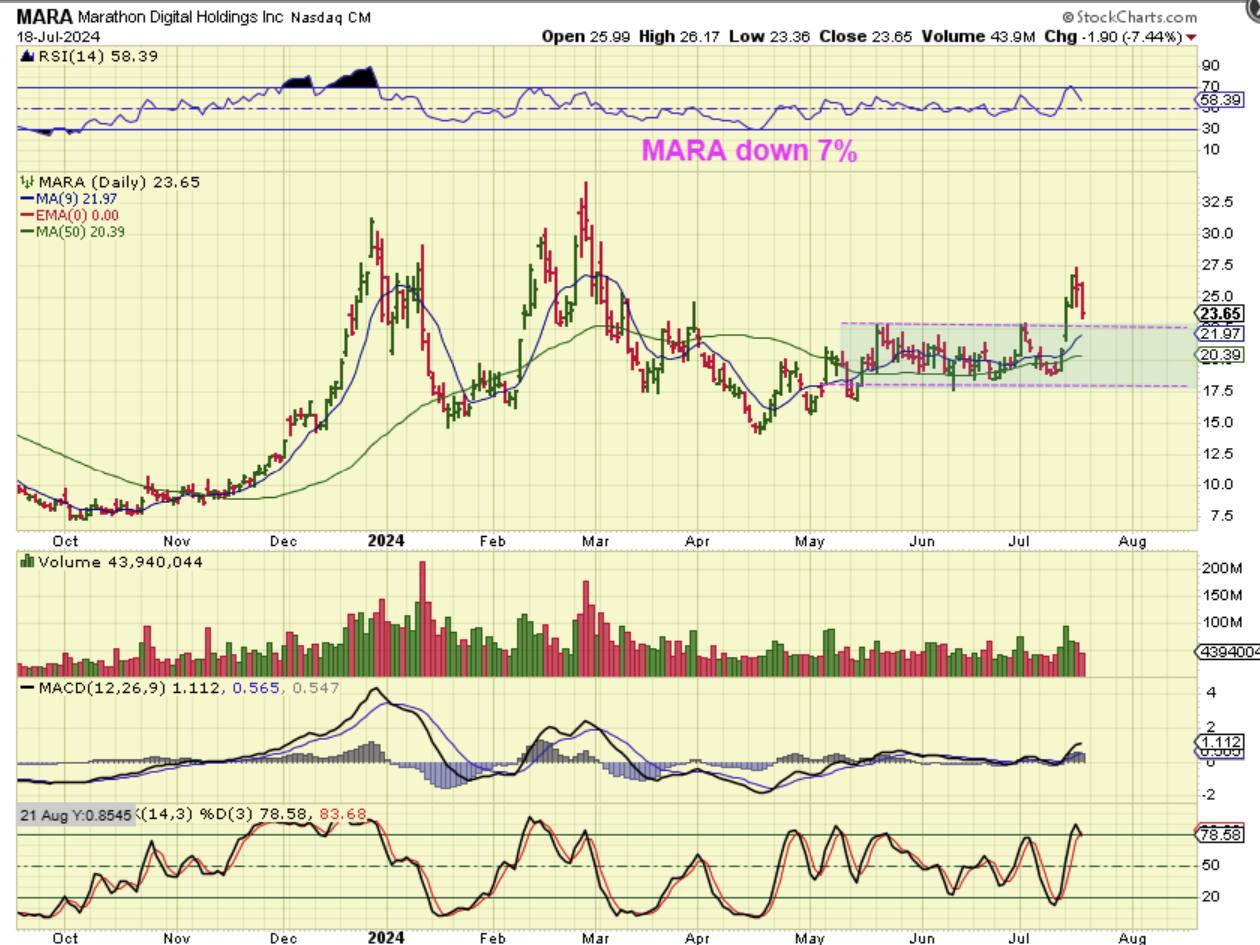
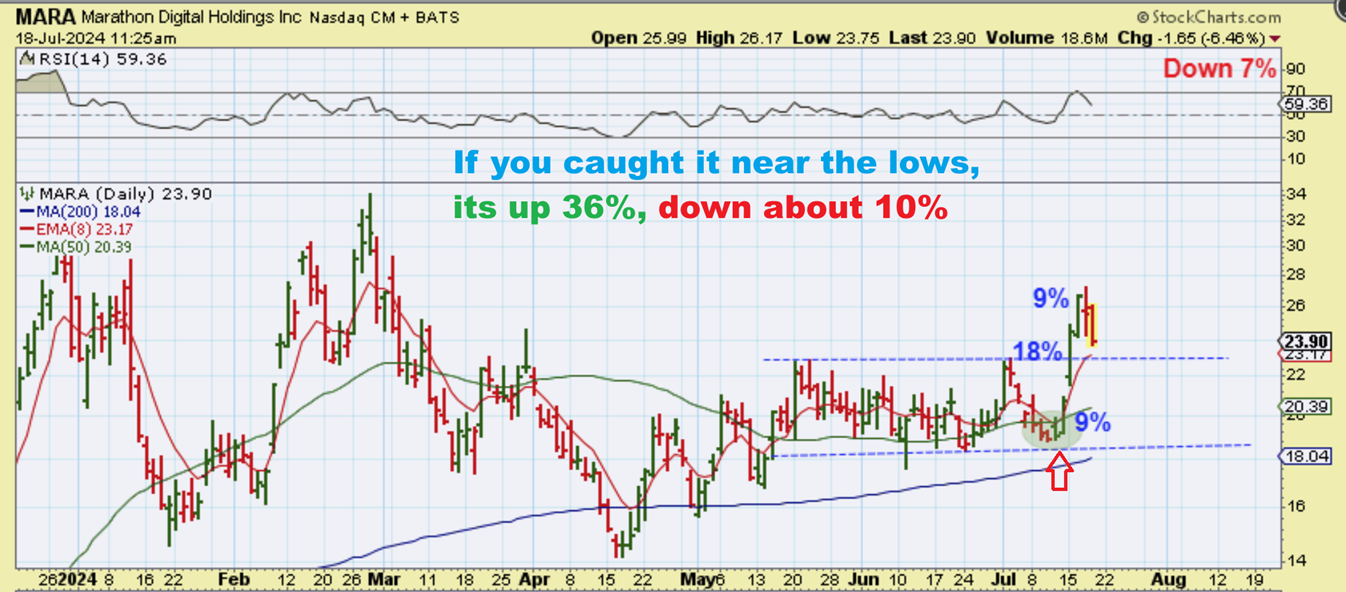
MARA #1: MARA dropped 7% yesterday and it isn’t making this a bad chart at all, right? Price broke out, we might get a back test, the 9sma is still under price, the 50sma is below too. It is NORMAL for these to see price return to them. That said, lets discuss it further…
.
MARA#2 : I got into MARA early as Bitcoin was around day 60ish, so the gains were 3 days of 36%, now I give back 10% from the peak. Again, that doesn’t seem bad either, right? However, if Bitcoin chops sideways to the 20 ema for 4 more days, will this slow up? Or will this drop another 10% and then another to reach that 50sma? It is hard to know. Let’s look at another view…
.
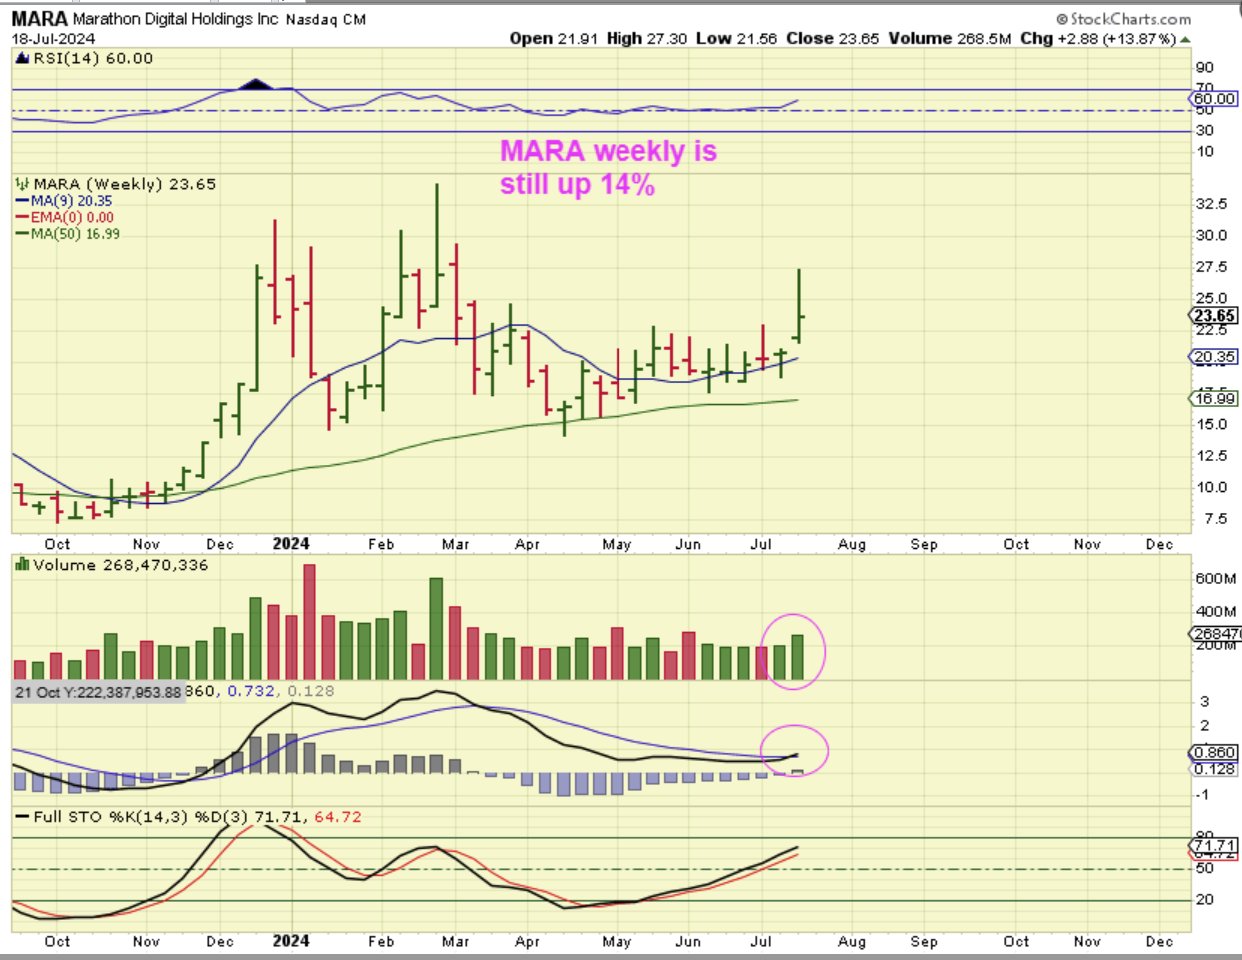
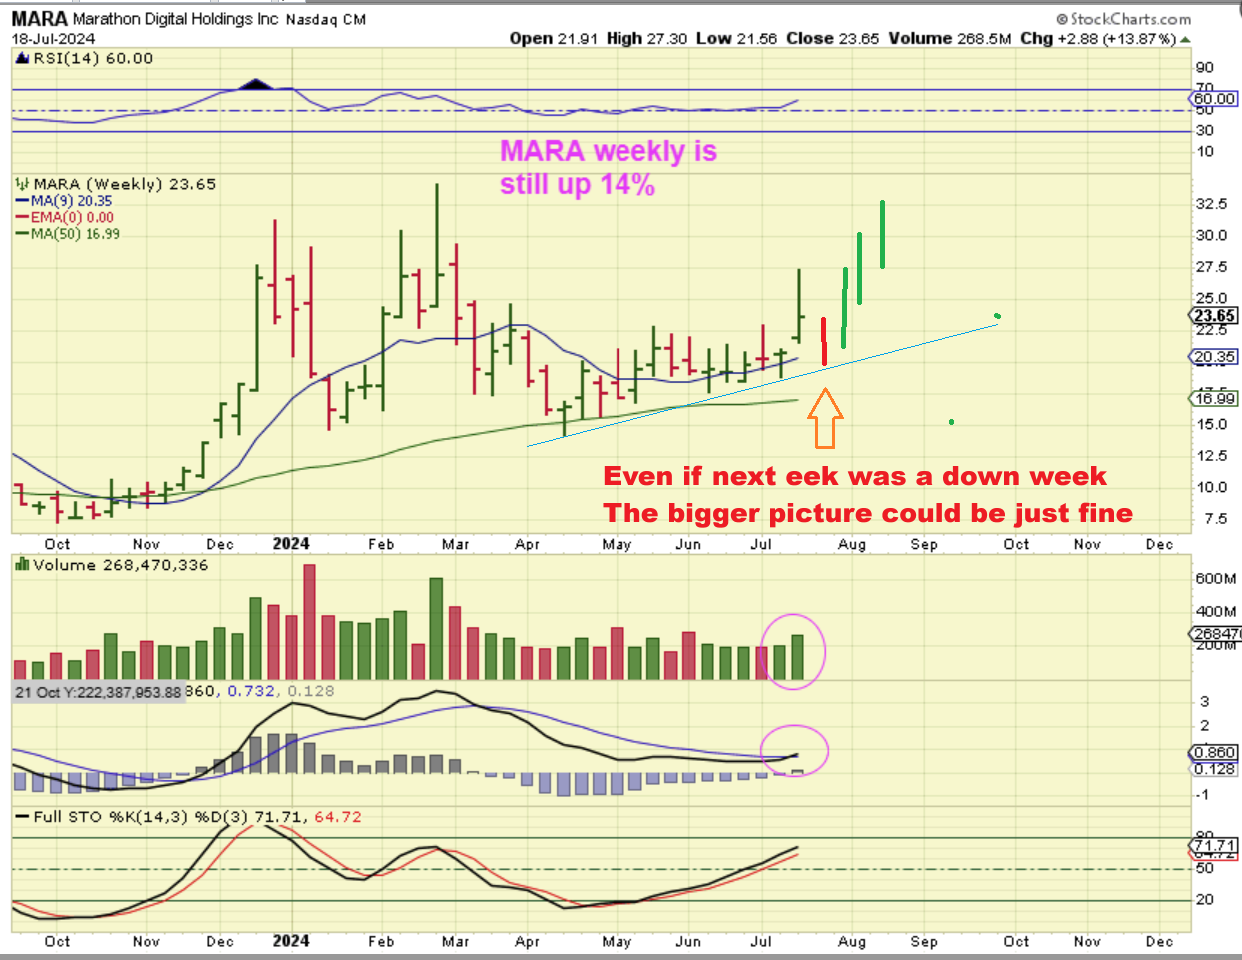
MARA #3: The Weekly Chart. Well, Mara is actually still up 14% for this week alone and the chart looks good at this point, so one could say that by the time Bitcoin gets to former highs in that $70,000 area, MARA could be back at $33 too. In other words…
.
In other words, even if price dropped to the 50sma and next week was a down week, the ‘buy & hold’ can still work out as expected, but the temporary pain during the ride is just too difficult for many to take. I find the crypto trade to be harder than Gold & Silver Miners for that reason–both are very volatile and at times the run higher is very choppy rather than straight up. This weekly chart is actually still fine though, even if it drops lower. So next…
.
.
Being able to ride the Cryptos may have to do with something that I have discussed in the past, and that is ‘position size”.
.
Now let’s return to this chart: A 7% drop is fine, right? But what if you owned 2000 shares? That 7% drop is $2/share. So if you owned 2000 shares and it dropped $2/share, you were down $4000 on MARA alone. If you had 3000 shares to capture some great gains on a run from $15 to $33, a $2 drop had you losing $6,000 yesterday alone. And if you owned a basket? A day like yesterday, which is honestly a normal 7% drop in crypto stocks, was ugly.
.

