Tuesday June 25th – Pullbacks
.
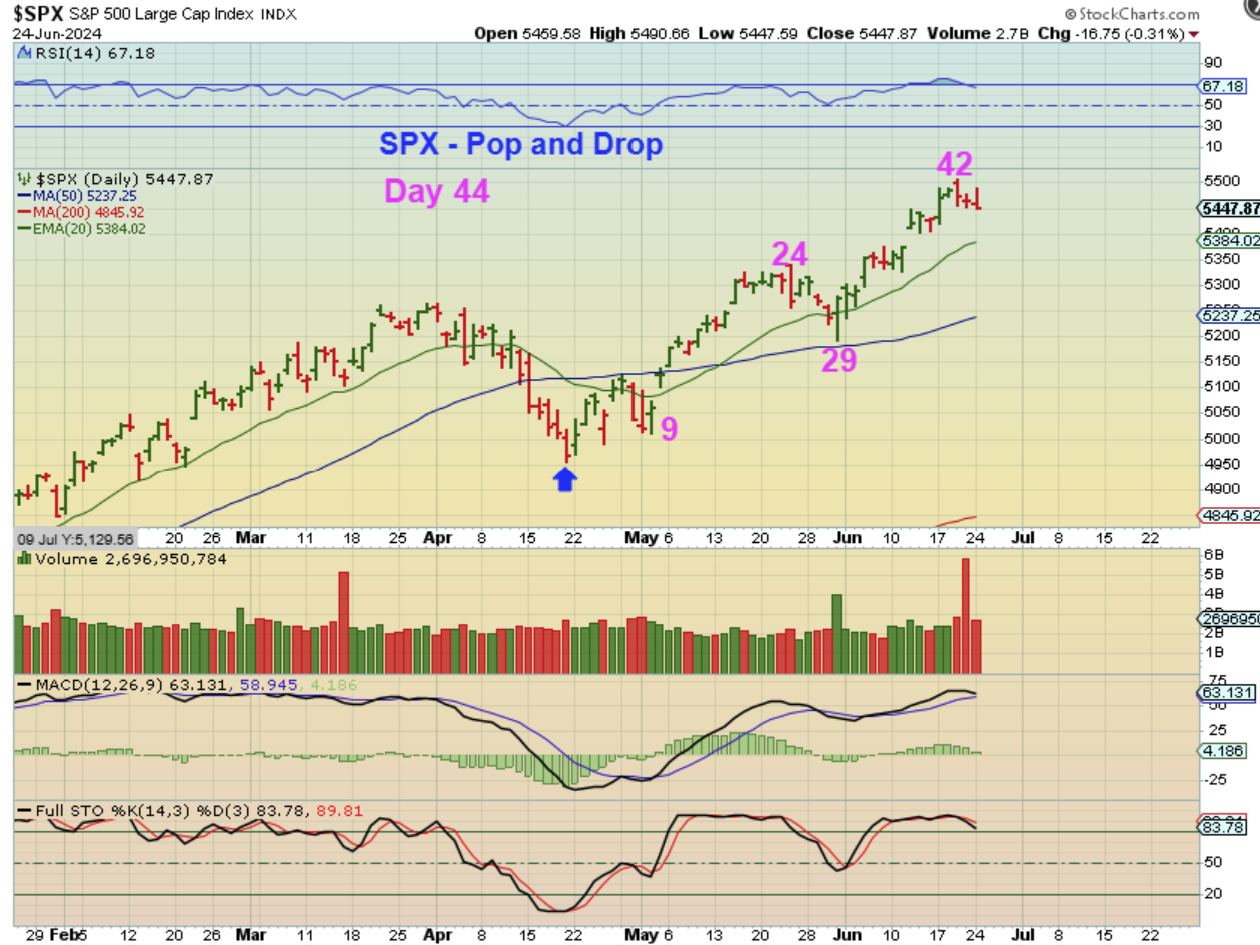
SPX – We are within the timing for a drop into a dcl, so this does look like that dip has started. We do keep seeing intraday rallies, but they are selling off to Red by the close. That is what happened on Monday.
.
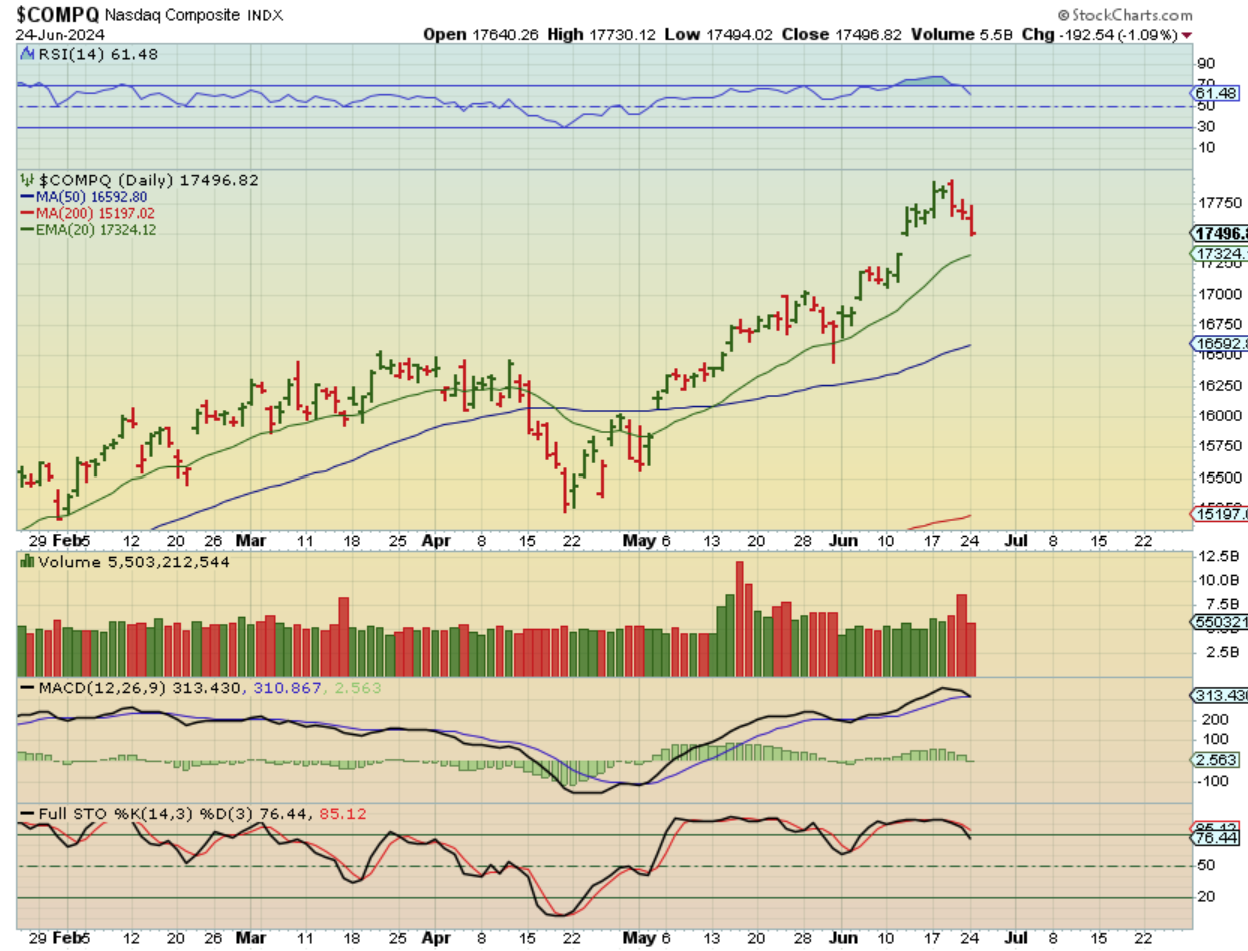
THE NASDAQ is deeper into the sell off than the SPX, so this helps us to see that, yes, that dip into a dcl has begun. Now I want to show you something pretty interesting…
.
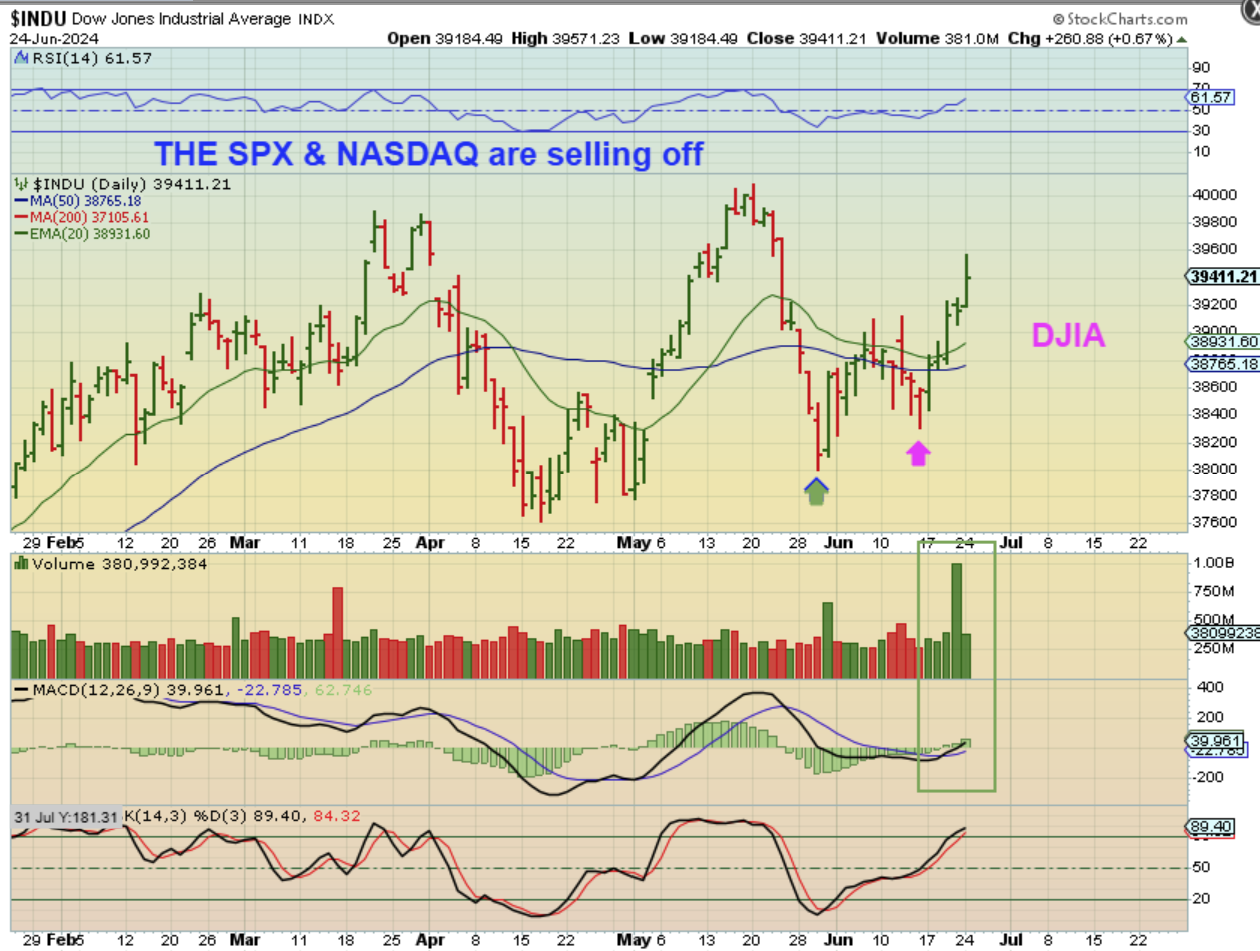
Now I want to show you something pretty interesting: We were watching the Dow Jones and Transports, because they weren’t making new highs together and that can predict the ‘Dow Theory” sell off. I mentioned that coming out of an ICL, you are bullish on the first 2 daily cycles and then we’d watch to see how things are unfolding. Well…
.
THE DJIA- We get to watch these 2 again, because they put in a low and with the SPX & QQQ selling down on the last 3 days, the Dow has started to rally.
 .
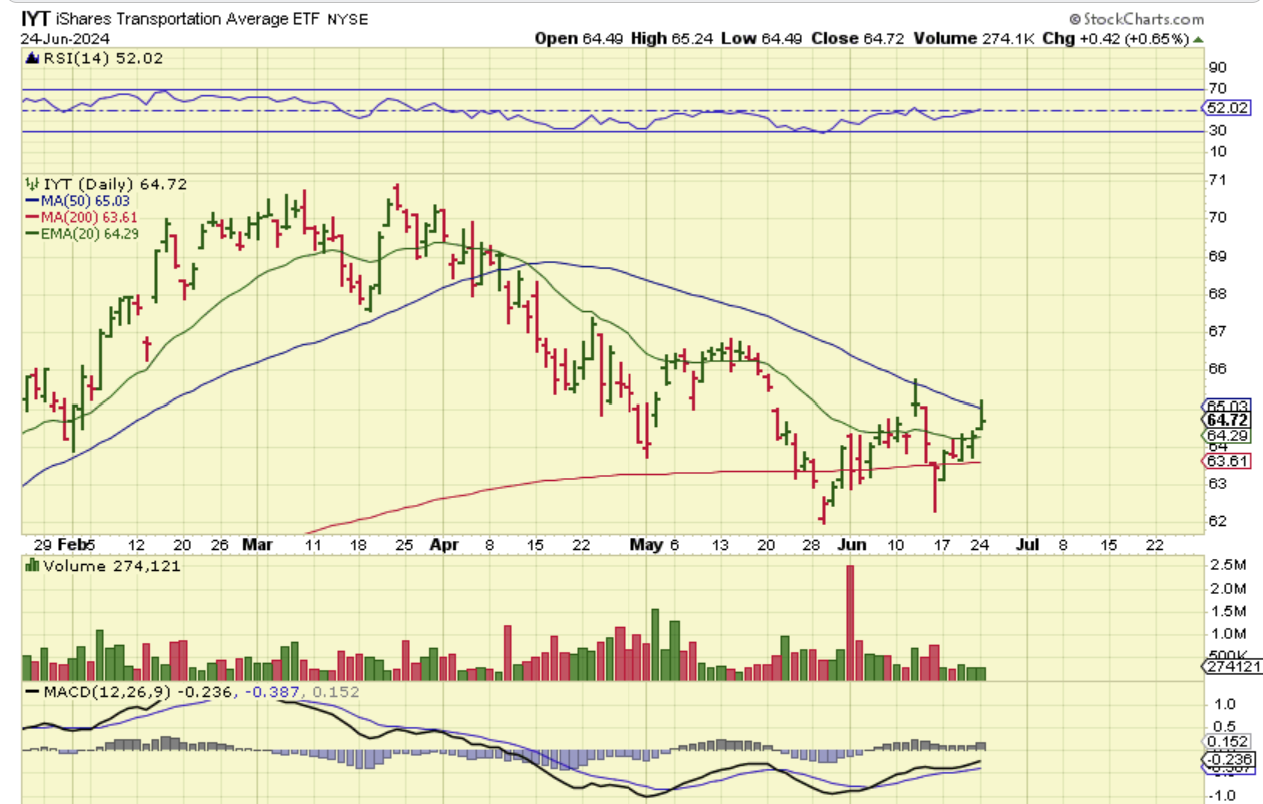
.THE TRNSPORTS- Watching to see if this can get above the 50sma and rally with the DOW this time (or not).
.
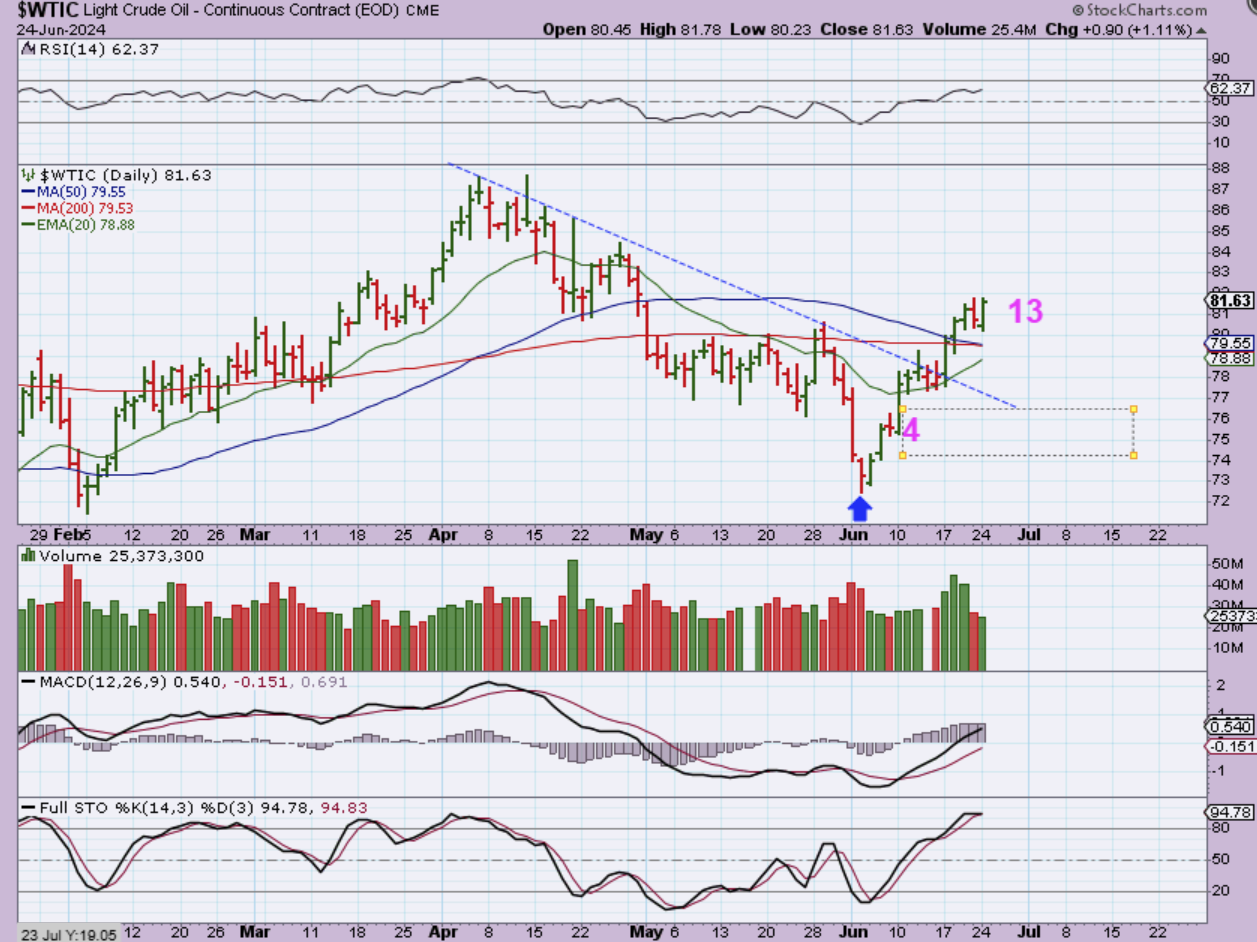
WTIC – Oil is now on day 13 and it has had a nice little rally out of the lows. I’ve been watching the Oil stocks and they have been clinging to the lows, but I mentioned recently that you could buy them at these lows and use a stop ( I did not buy any). I said this because when Oil broke the downtrend, that is showing signs of an ICL. What about the XOP Now? On Monday we saw a pop higher.
.
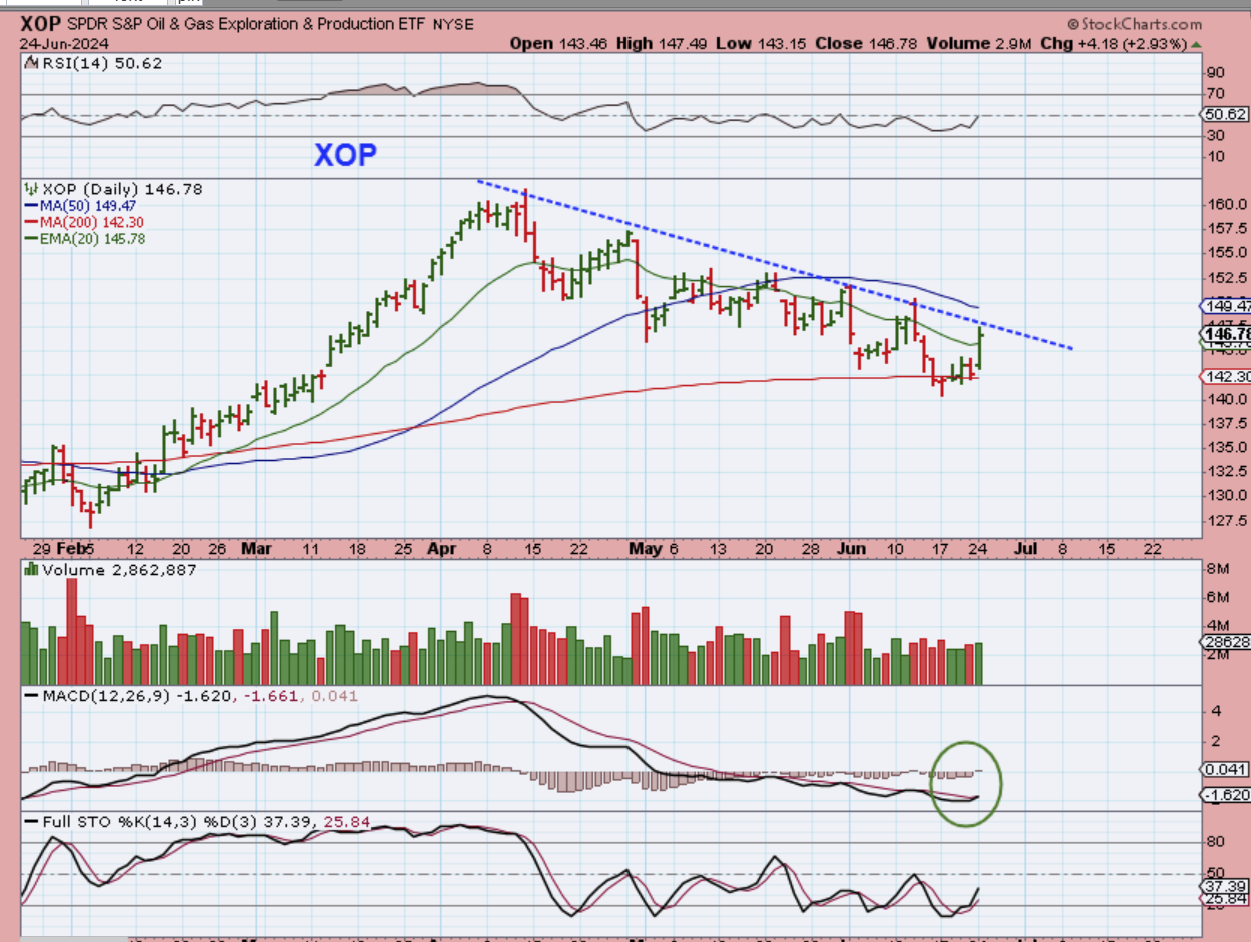
THE XOP was sitting on the 200sma and looked weak during Oils rally and especially over the last 6 or 7 days, but on Monday we finally got a strong push above the 20ema. The overhead challenge is the 50sma and the downtrend line. The XLE is ahead of the XOP, so let’s look at that and see if it broke through the resistance that we see here.
.
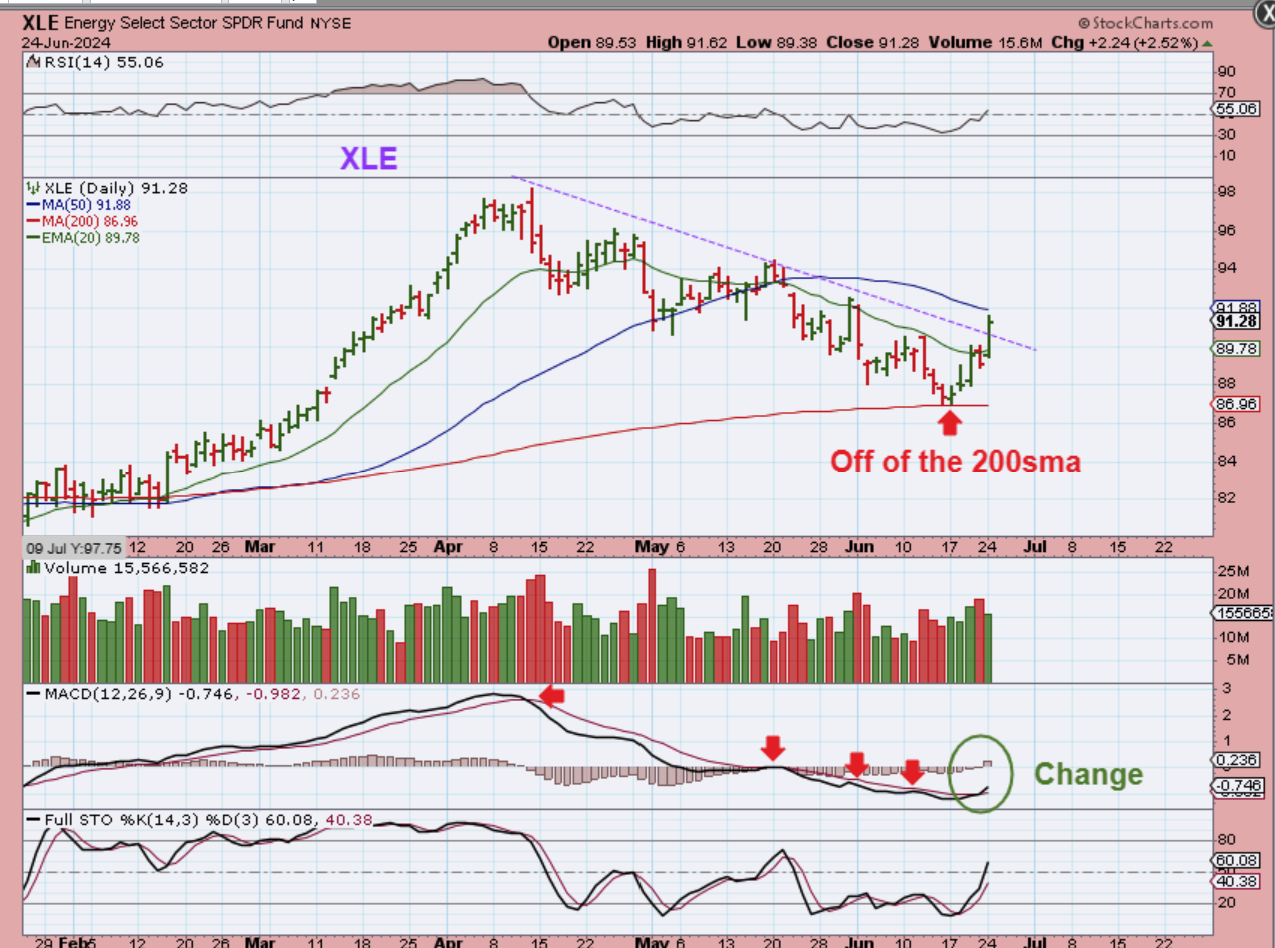
Again, Oil has been rallying for 13 days, but THE XLE dropped. It started to run 4 days ago and now it has already broken through the downtrend line, and faces the 50sma next. The XLE has climbed up off of the 200sma and the MACD is crossing upward. Another trade for this sector is GUSH (leveraged).
.
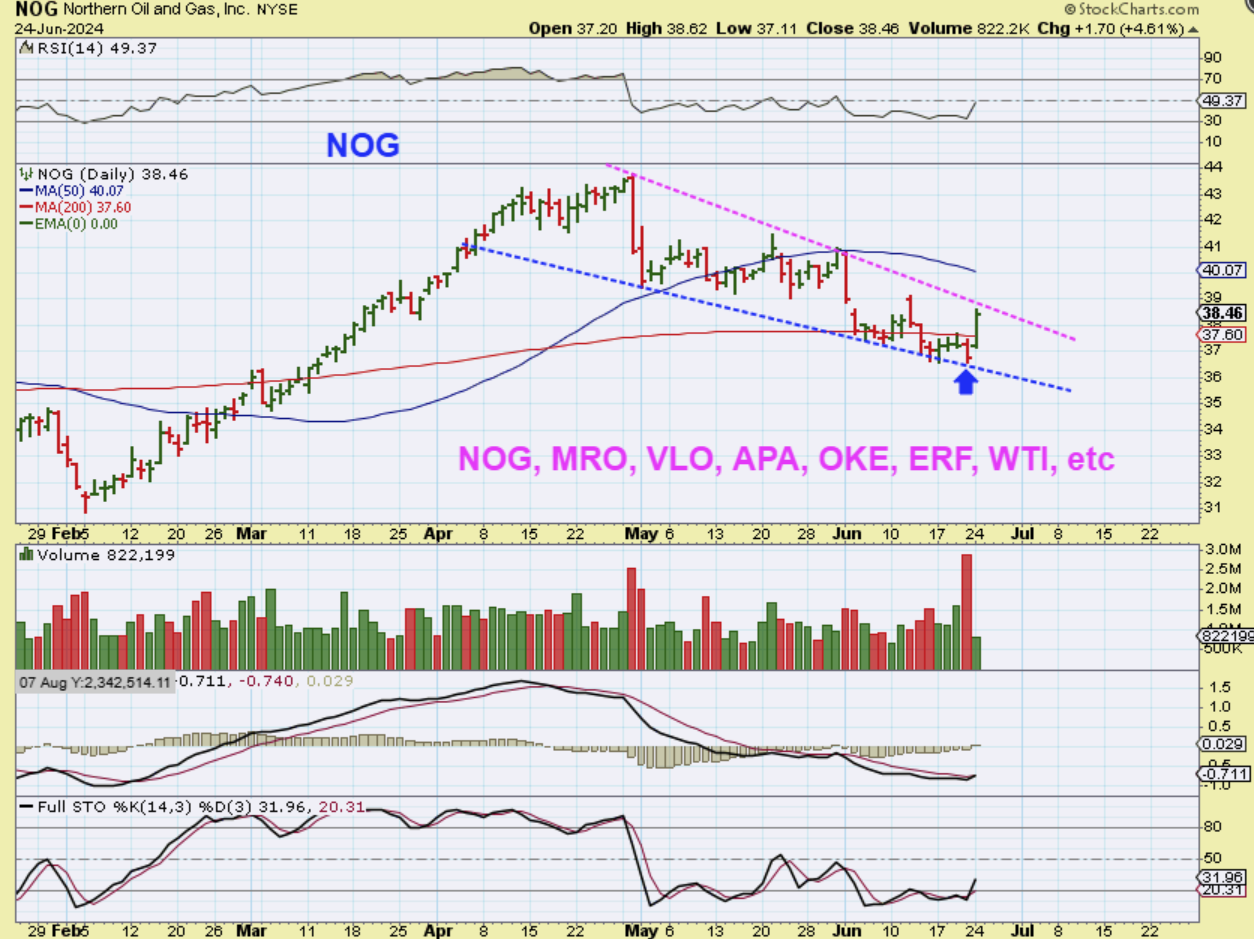
NOG: After crawling along underneath the 200smna for weeks, NOG has now broken over the 200sma. Check out some of the tickers on this chart. Some are following the XLE and others are following the XOP.
.
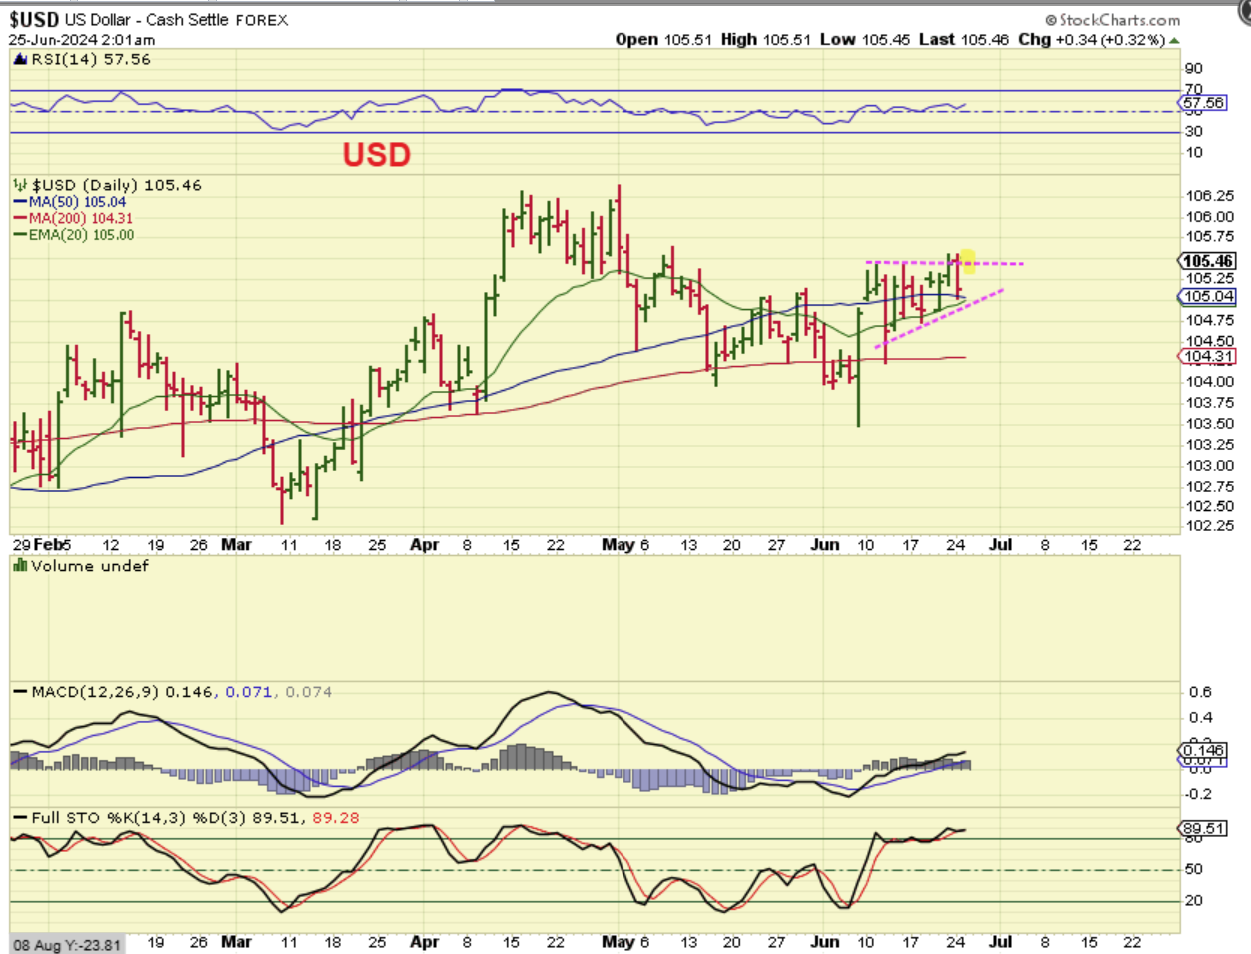
THE USD started to break out of this pattern, but it ended up dropping back down to the 50sma for now.
.
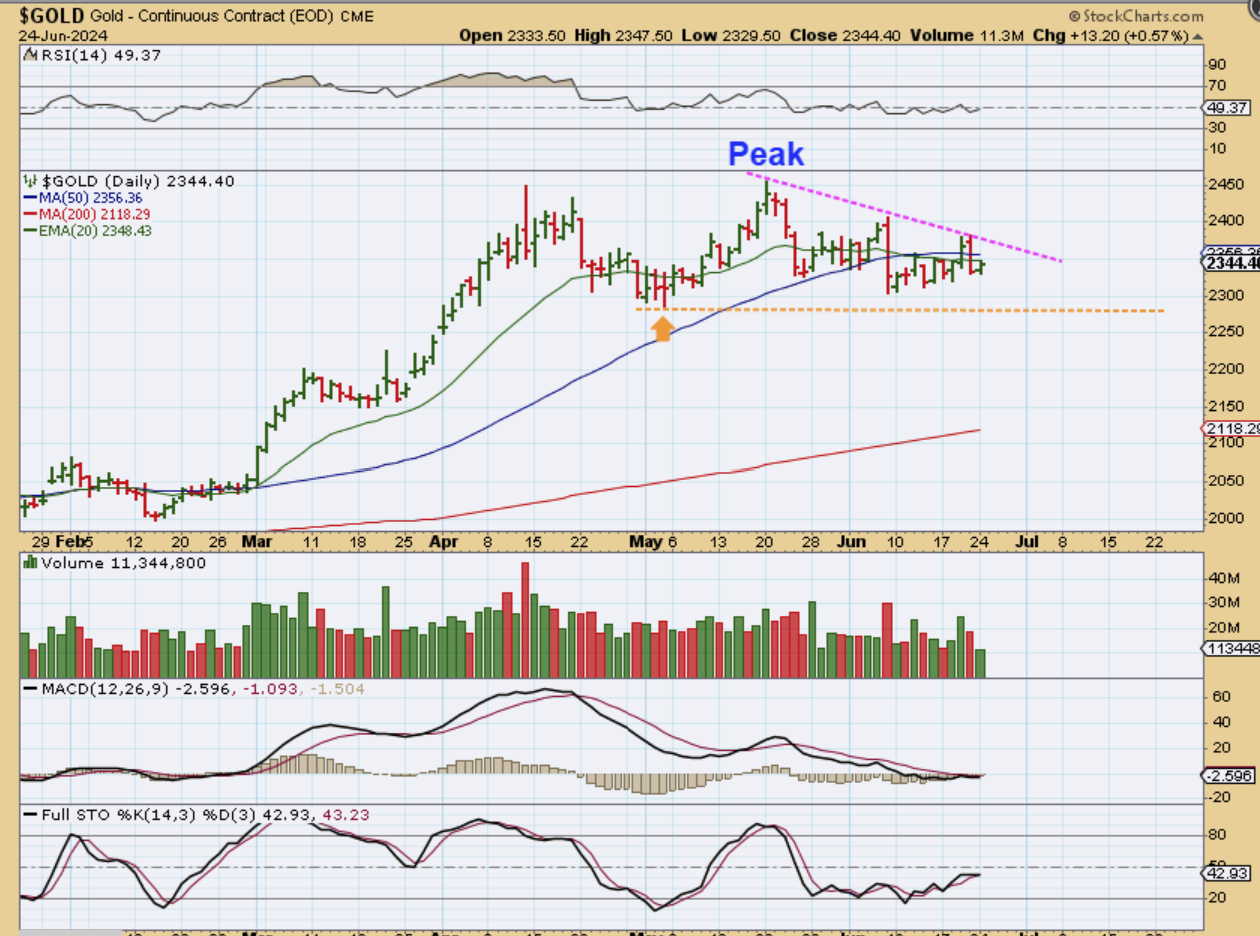
As the USD dropped, GOLD moved higher, but not as much as one would expect with the USD dropping as much as it did. Gold is getting heavy as it chops sideways and even though it broke out above the 50sma, it has lost that gain and closed back under the 50sma for now. This looks like day 10 of the 4th daily cycle.
.
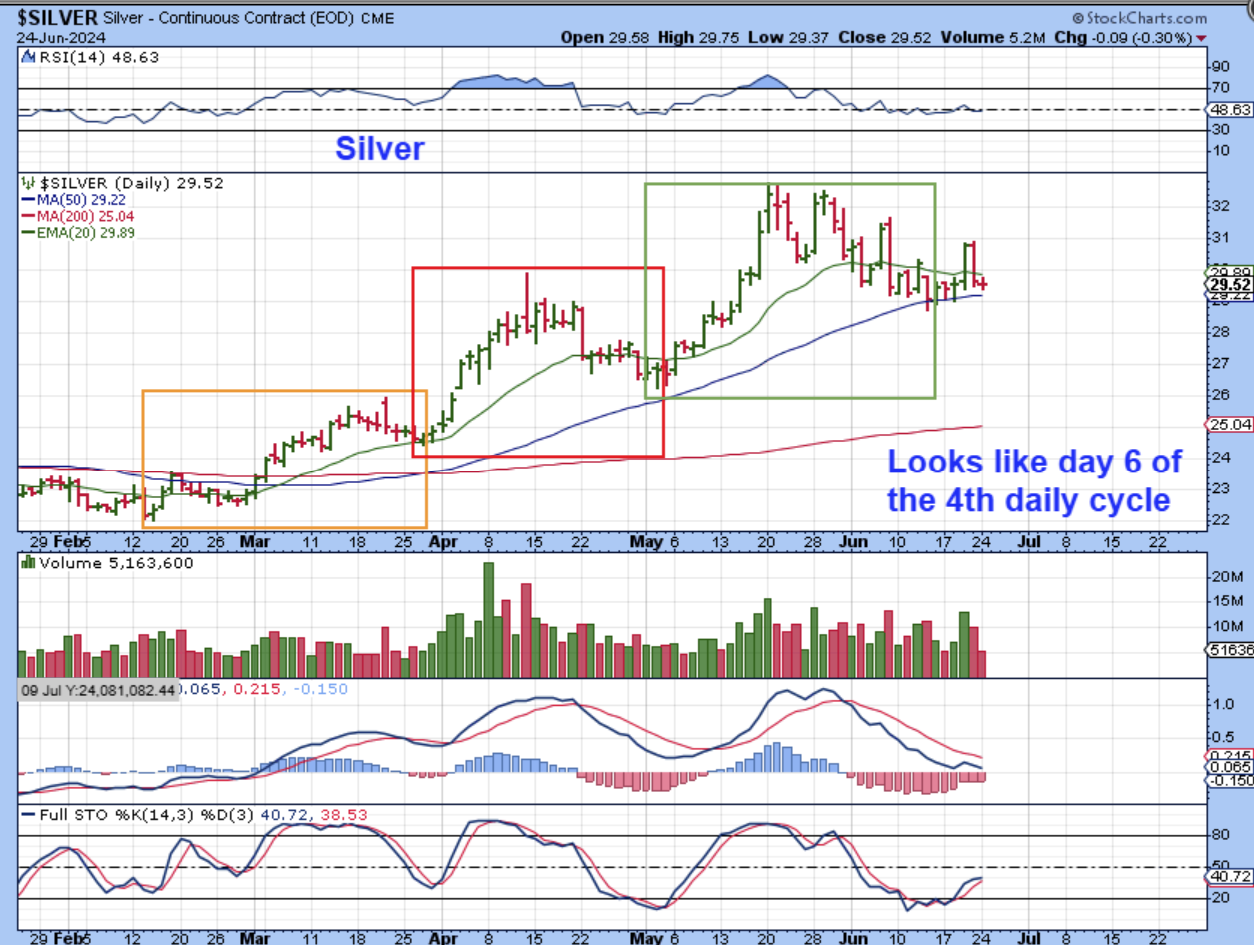
SILVER is crawling along the 50sma so far.
.
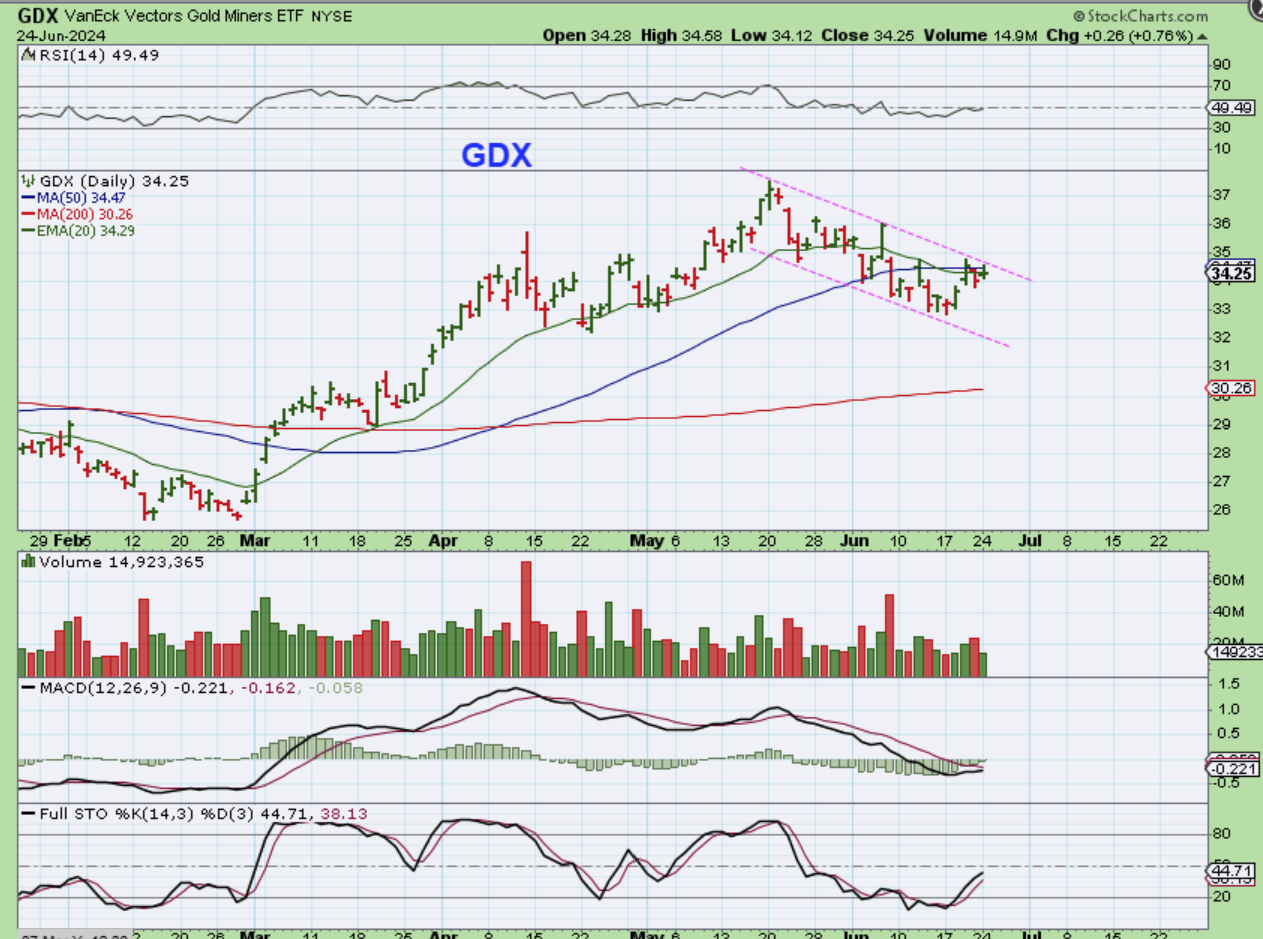
GDX lost the 50sma and is in a downward sloping channel now.
.
During a Bull Run the pullbacks can be a little steep and a bit more of a choppy, sideways drop lower. That is what we are seeing in the precious metals sector and the general Markets also look like they are struggling to sell off too. Bitcoin, on the other hand, is starting to pick up speed to the downside and it may even have the final low in place a few days early. I’ll discuss that below. There is no real market moving data that I can see today, but we have New Home Sales on Wednesday, Jobless Claims Thursday, etc. That data might cause the selling to increase, we’ll just have to wait and see. Enjoy your Tuesday Trading!
.
~ALEX
.
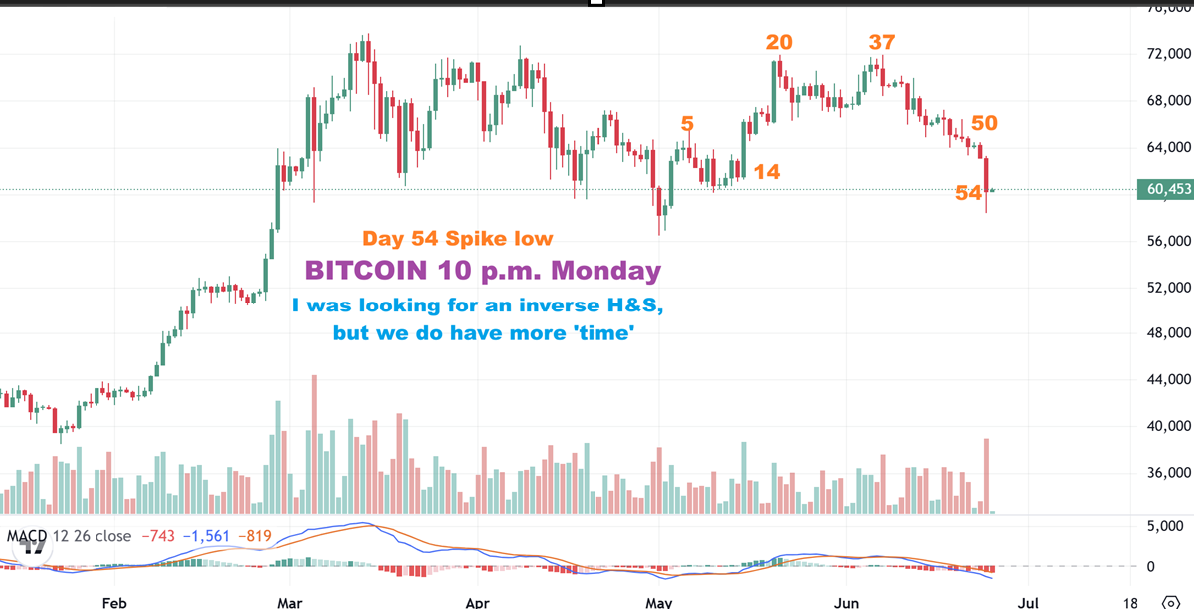
BITCOIN – I have been discussing that
1. A drop into the day 60 area is what I am looking for. Monday was day 54 and that can be close enough.
2. I also mentioned that I could see a possible inverse H&S Pattern develop, so I’ve been watching for that.
3. I now do see a possible inverse H&S (so far), if the selling stopped here.
4. Well now we have a nice spike down on Monday, and I say ‘Nice’ because it is clear visible selling for us to see. We can now get a low that is easier to identify or is more ‘obvious’, and it helps us when we need to find a dcl. It also turned into a reversal candle on day 54, so this M-I-G-H-T be the low. That said, it is not yet day 60, so proceed with caution…
.
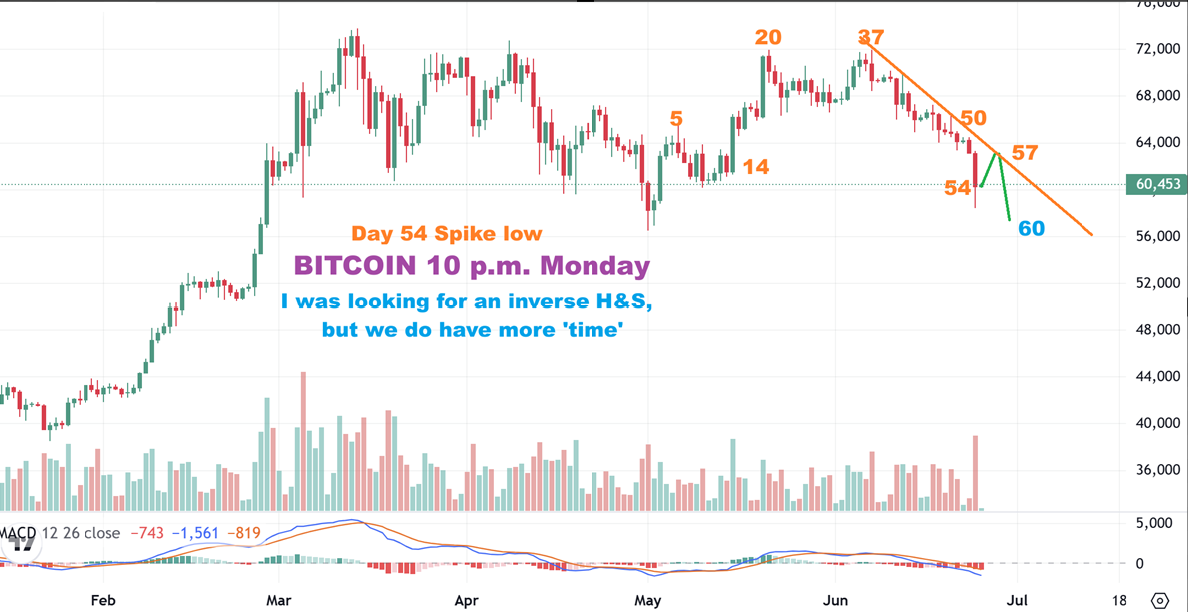
BITCOIN – If we are looking for a day 60 or maybe even let’s say a 63 day daily cycle, then we may have more time to sell off. I am drawing this as a bounce out of this reversal candle, then we may only tag the downtrend, followed by 1 more drop to day 60 or day 60 plus low.
.
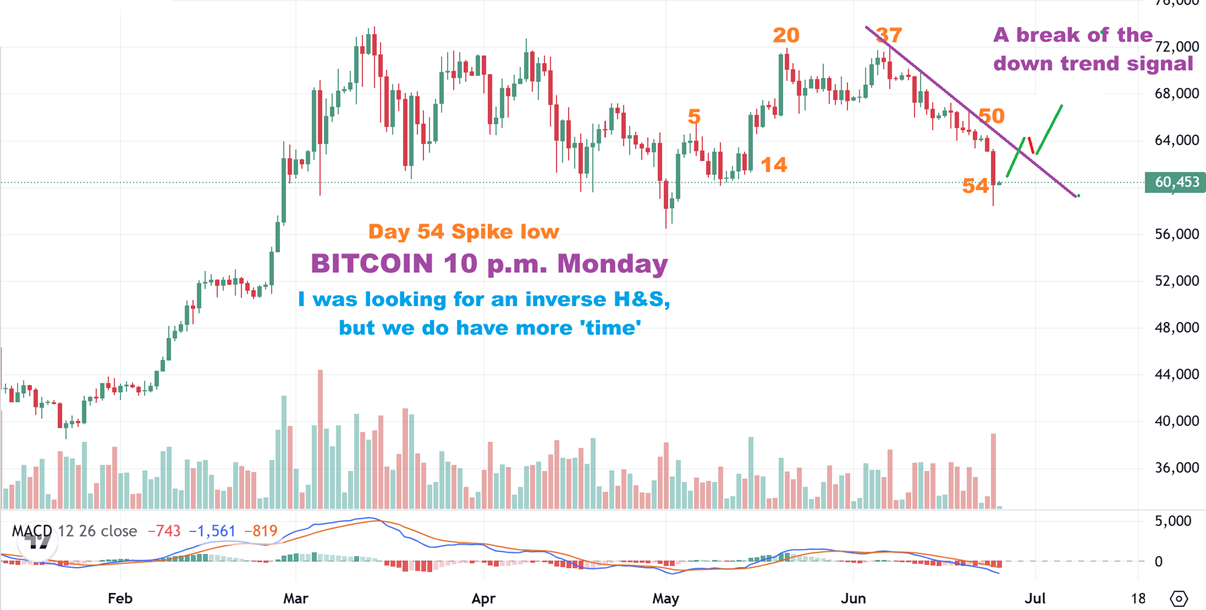
BITCOIN 2 Choices: If day 54 with that high volume spike low/reversal candle does satisfy the timing enough, then we’d have a dcl right now. What I would say is this…
1. You can always buy these strong reversal candles with a stop at the lows and see how it goes, but if we drop again it can be frustrating, or
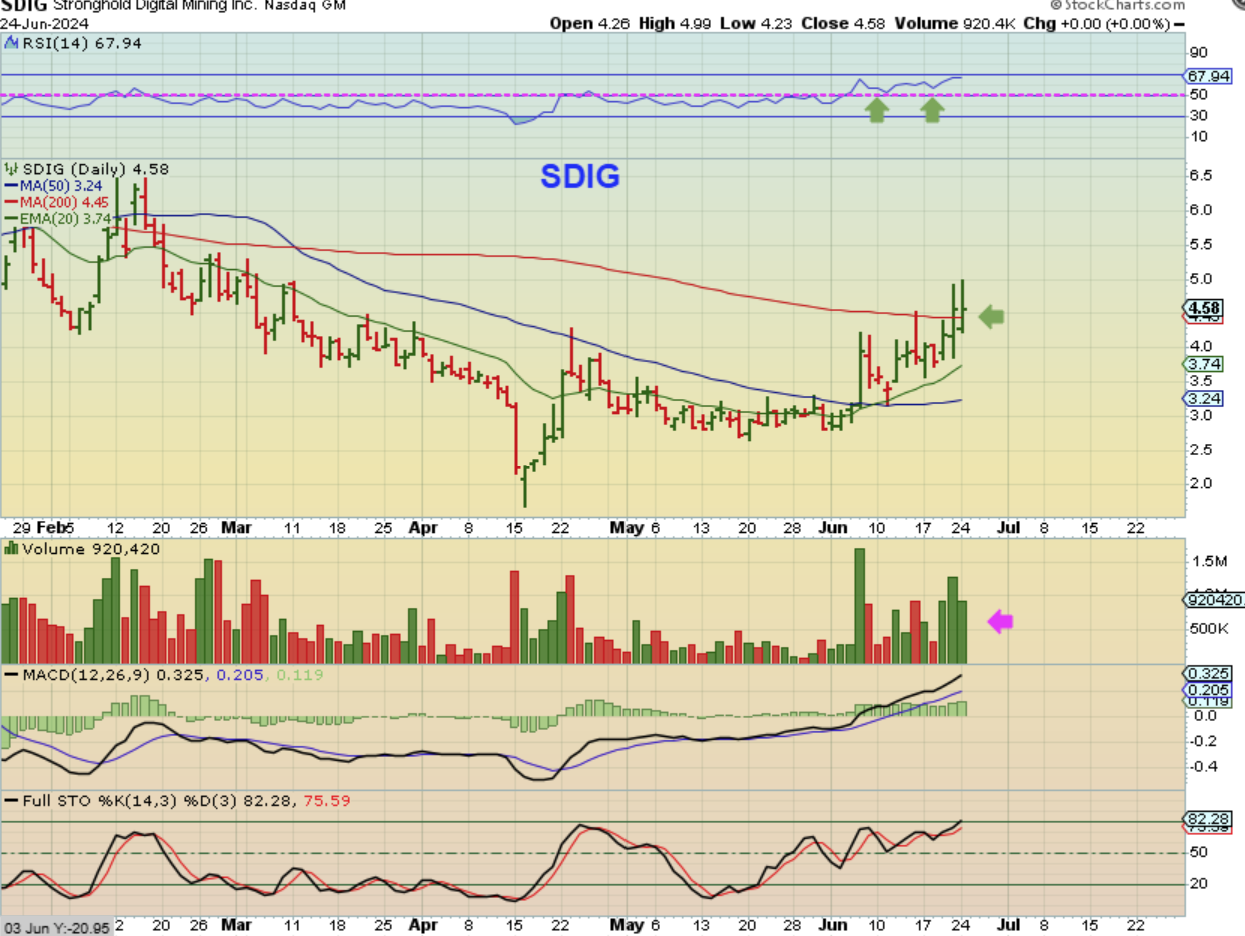
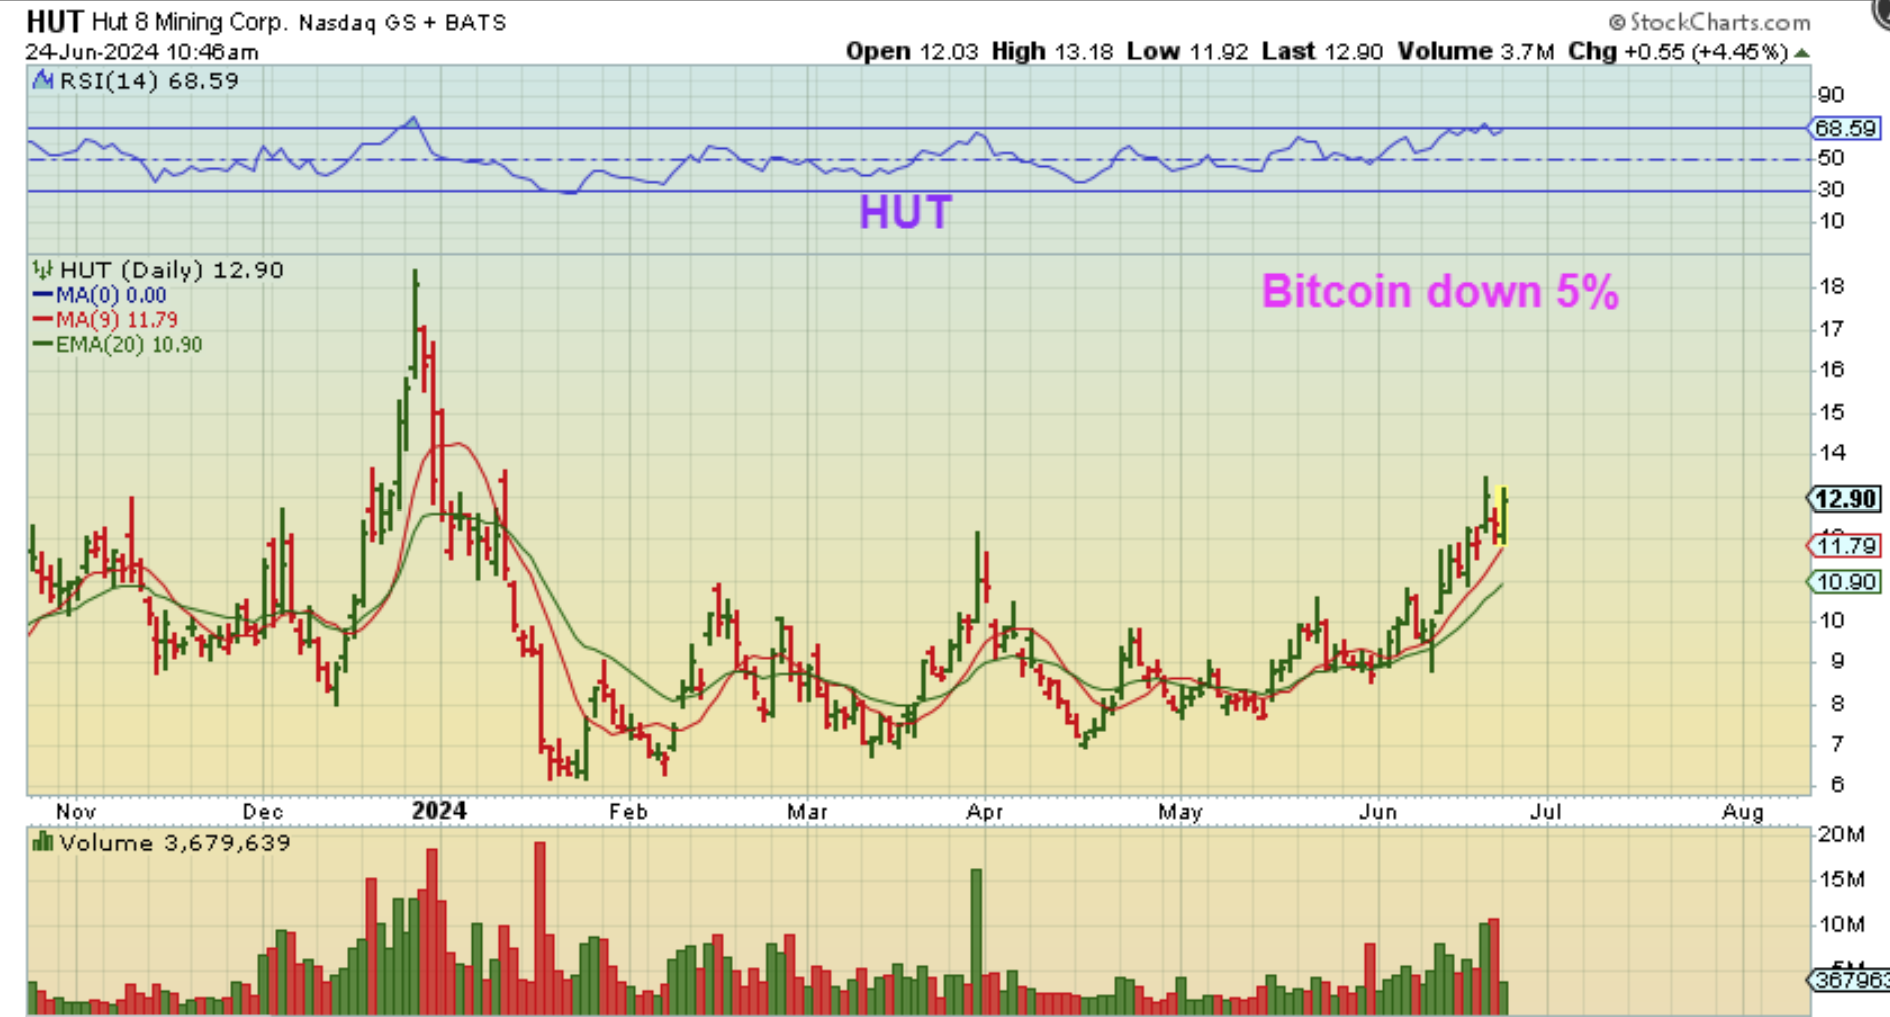
2. Wait for a sign of strength in Bitcoin, and a trendline break is a good signal that a dcl is likely in place and a rally can unfold from here. And as I have mentioned, some Crypto stocks (WULF, SDIG, HUT, for example) are resisting the selling a bit. In fact, can you believe that those were even green with Mondays 5% SLAM DOWN? THAT is hard to believe, right?
.
BITCOIN WAS CRASHING DOWN, AND I SAW THIS AFTER AN HOUR OF TRADING, AND THIS DID CLOSE GREEN WITH BITCOIN DOWN 5%
SDIG: With a Bitcoin slam down, SDIG still closed back above the 200sma and green. This resisting of the selling has made it feel like the lows for Bitcoin should be close.