
Thursday June 20 – What Is Breaking Out?
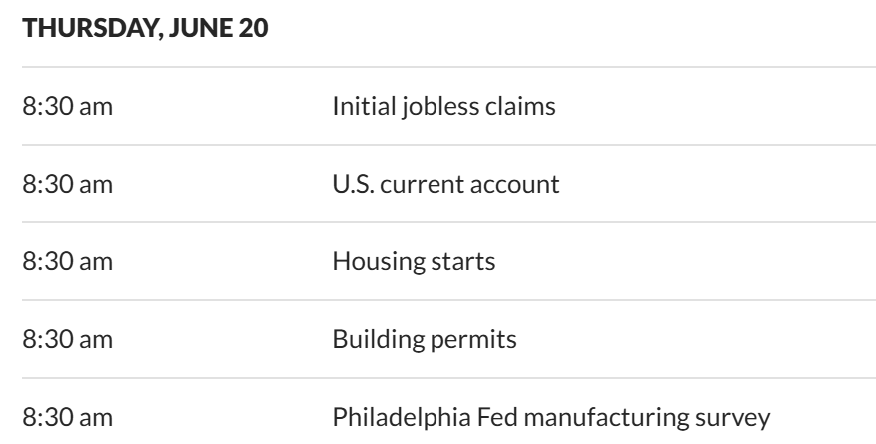
At 8:30 a.m. ET (Pre-Market) we do have plenty of DATA that is known to be market-moving data.
.
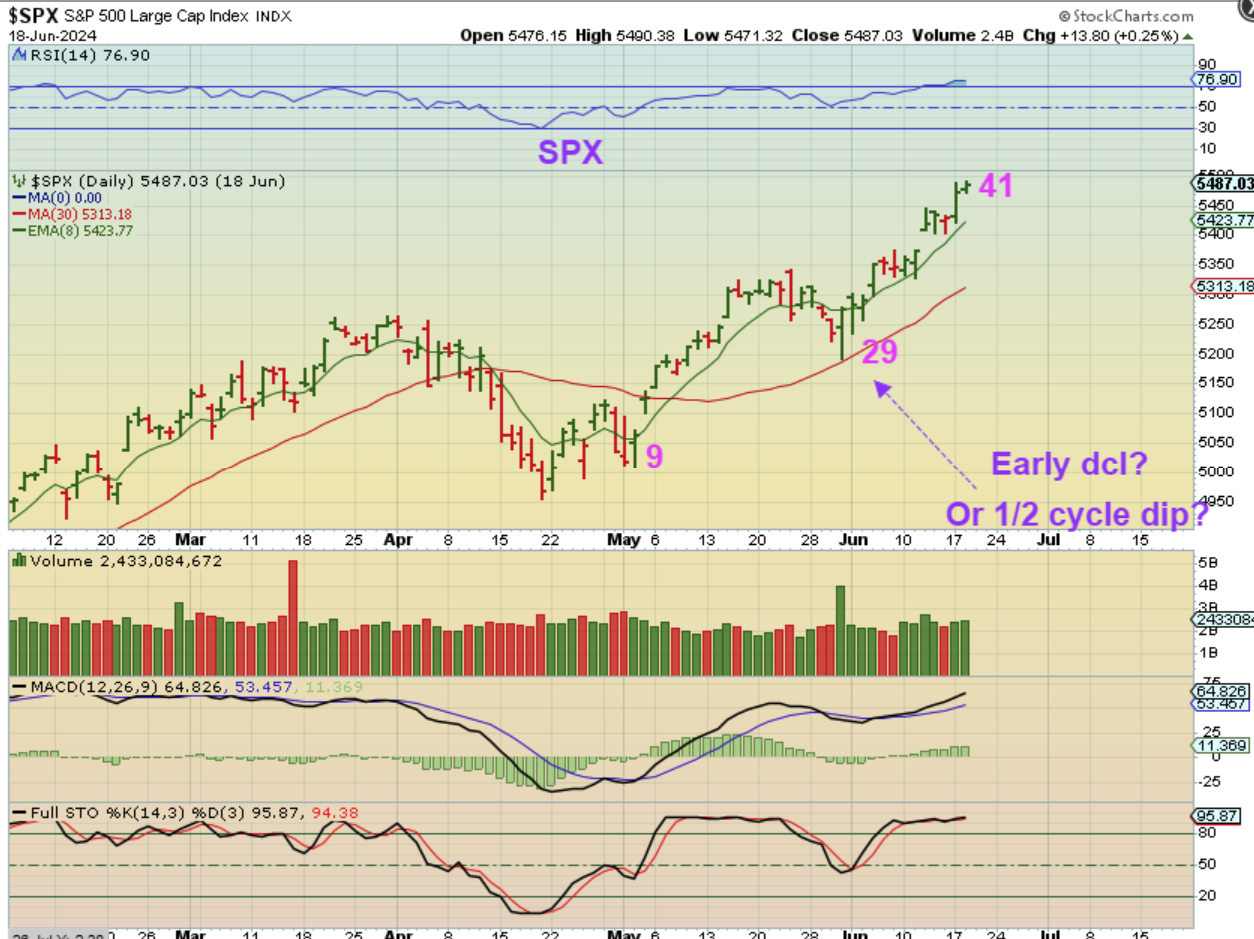
With The SPX we should be on day 41 of a strong move out of the ICL.
Some daily cycles have been 50 days long, others have been around 38 or so. With that I have asked, “COULD WE have had a dcl at day 29 and this is the 2nd daily cycle?” Maybe, but I think it is still the first daily cycle and if it is, we should be coming due for a dip into a dcl at any time, so we would raise stops to the 8 ema.
.
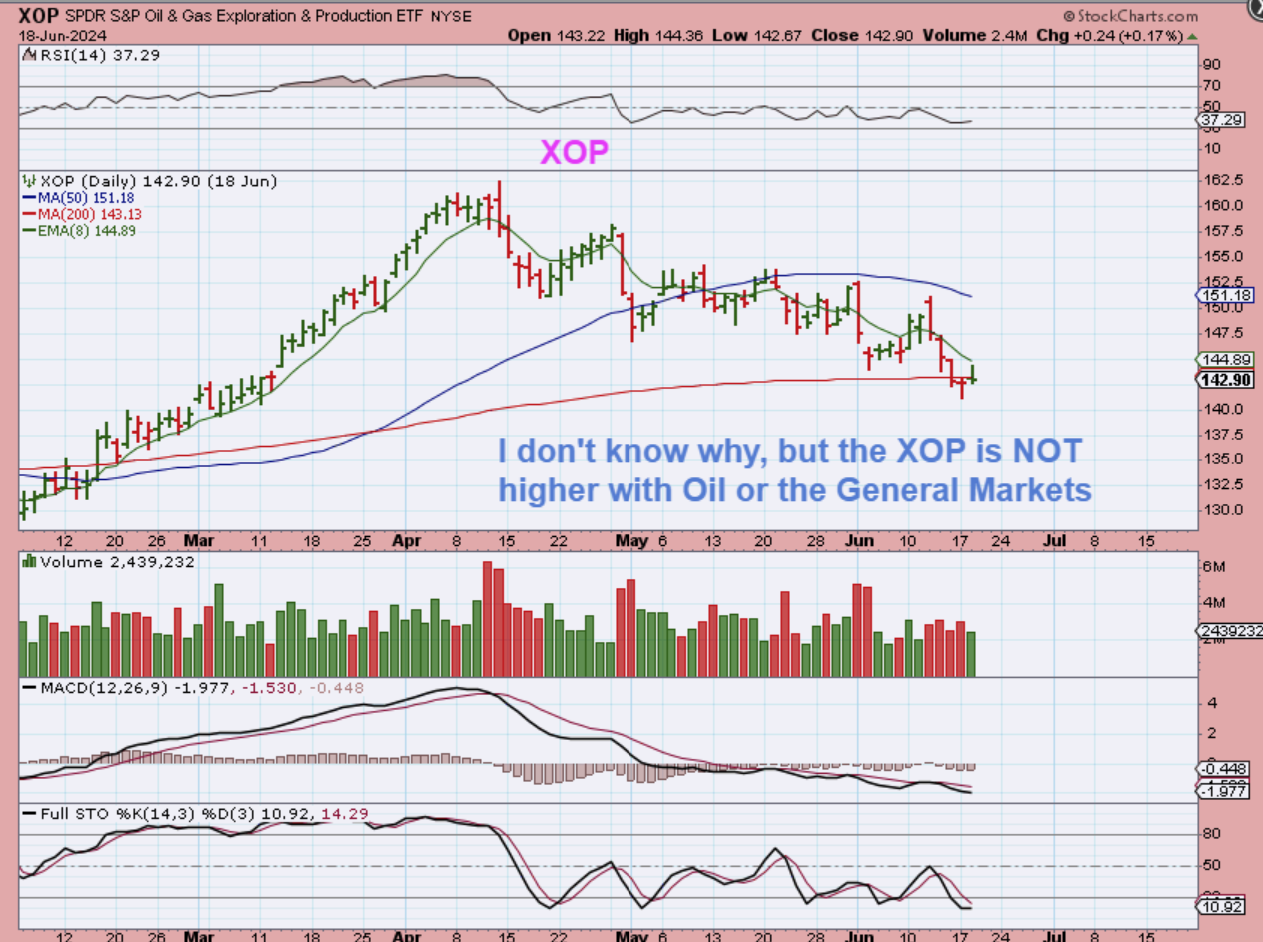
TUESDAYS REPORT SAID: WTIC – Oil actually surged on Monday and broke through the 200sma, but was stopped at the 50sma. Oil sold off sharply 3 weeks ago, but that was only a day 30 low (Oil often runs 45-50 days). Now we’re seeing a V-Bottom and some renewed strength though, so could this be a new sign of strength out of dcl or even an ICL? If it breaks out and closes above that 50sma, I’d start to think so. That downtrend break is bullish too.
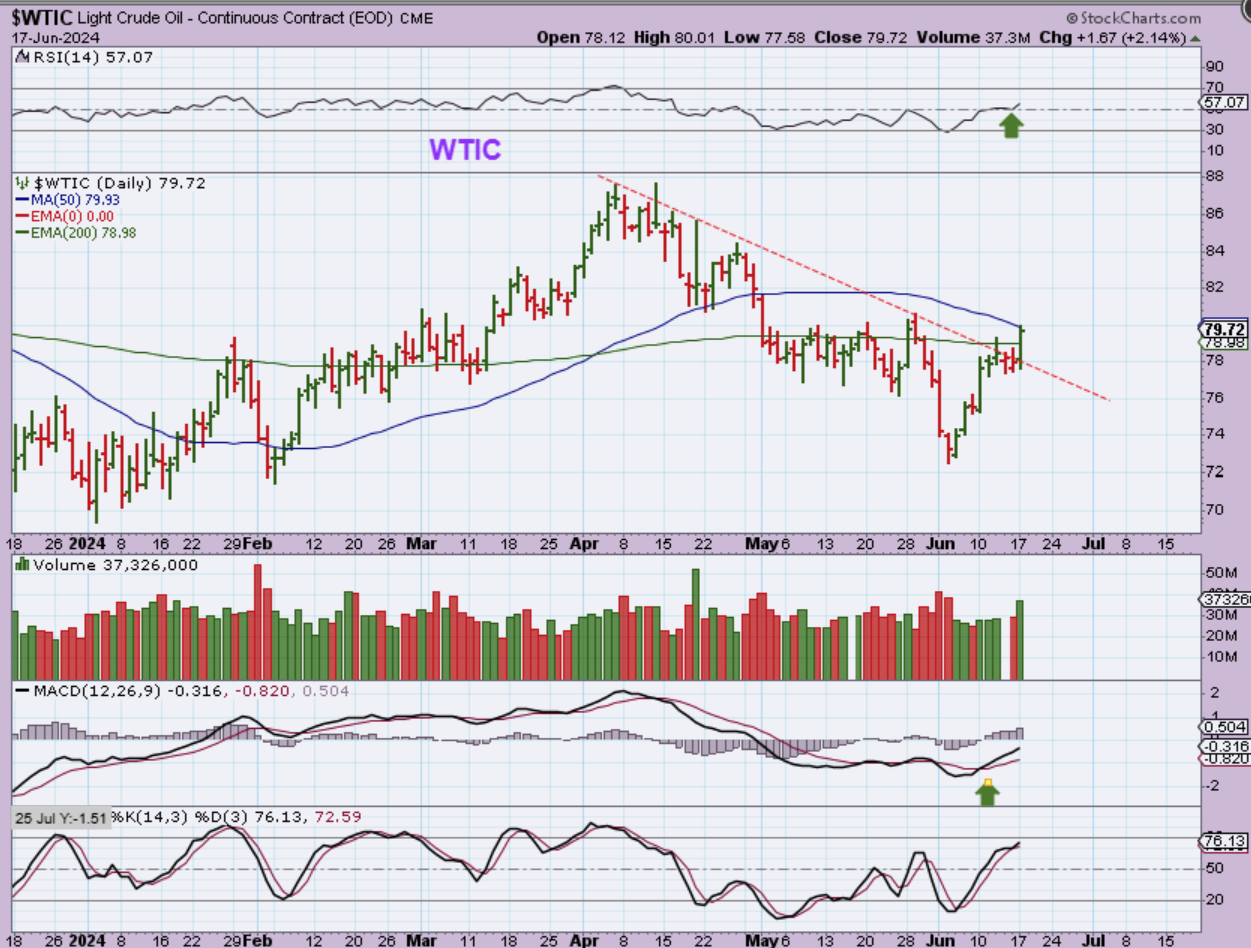
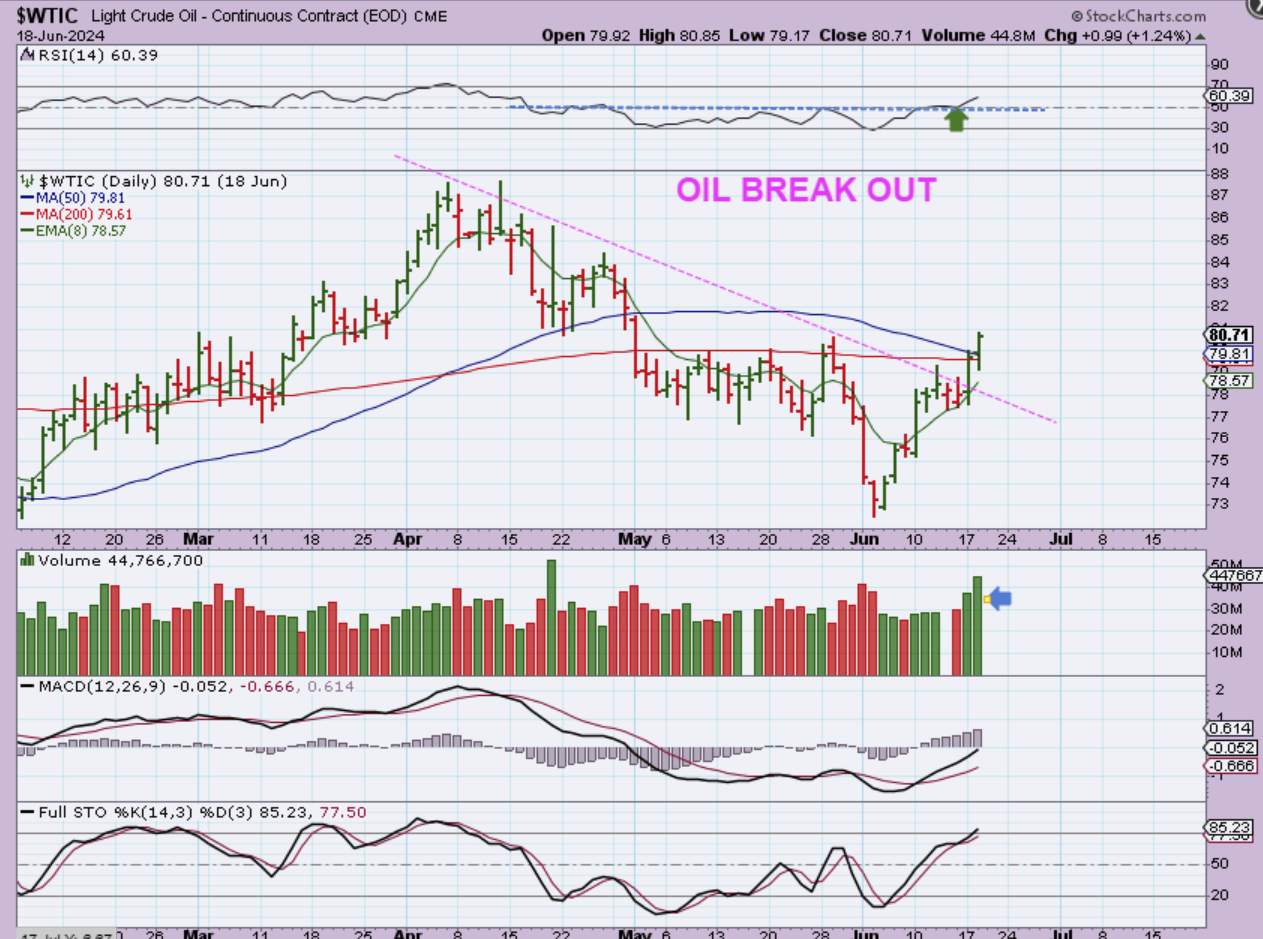
WTIC – Oil then broke above the 50sma, 200sma, and that downtrend. This really loos bullish for Oil, but I also mentioned something else that is interesting…
.
THE XOP is not higher with OILS surge or the General Markets surge, and that is a little puzzling.
.
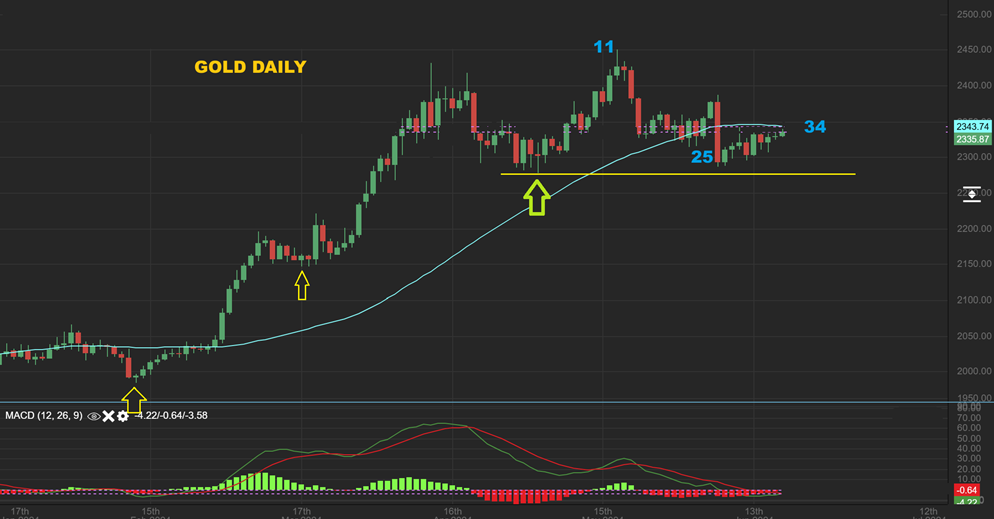
GOLD slammed down on day 25 and ever since then, it is slowly climbing higher. We are on day 34, or we saw a dcl on that slam down and this is a weaker 4th daily cycle. I noticed that some Miners look nice at this point in time, so I’ll cover a little of that too.
.
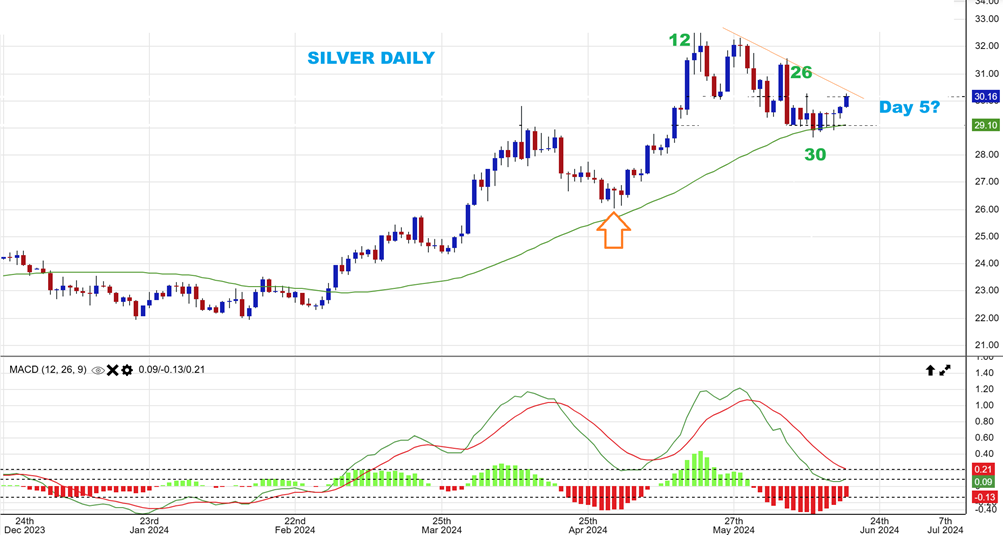
SILVER is interesting with a day 30 low and a push higher this week giving us a swing low. It could be day 5 of a 4th daily cycle, and it looks ready to break higher, but the 4th daily cycle should be a weaker one. You COULD buy this or Silver stocks with a stop and wait and see.
.
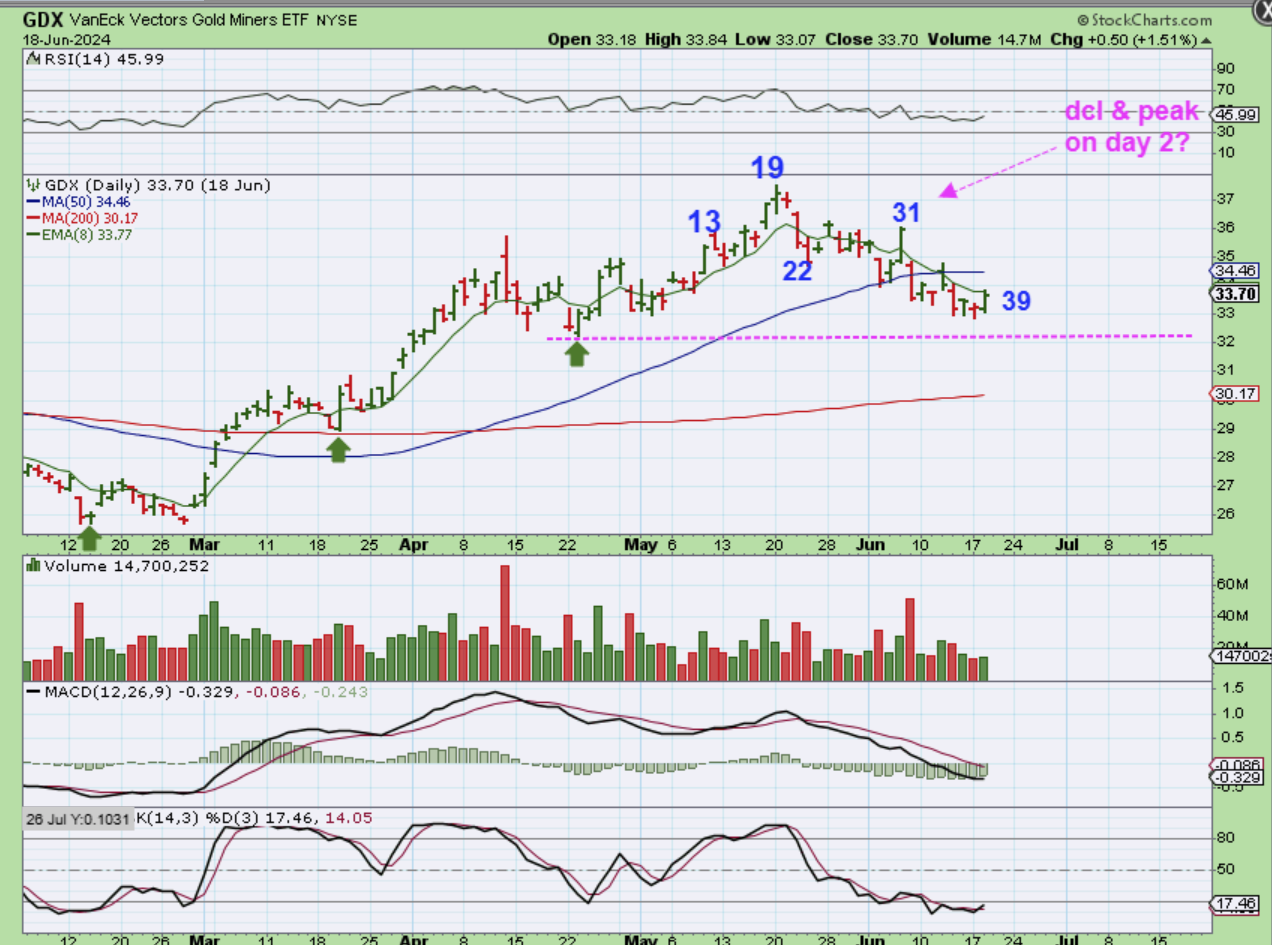
GDX is a bit confusing.
1. This could be a very long 39 day daily cycle.
2. It also MIGHT have put in a dcl at day 29 and then ‘peaked’ on day 2. It would now be on day 10 of a 4th daily cycle.
3. What makes these cycles so confusing? They are not having a sharp, clear sell off like they used to. Selling is subtle and the price is holding up and chopping sideways. This is making the dcls mild or unclear, but a push higher from here should be a dcl.
.
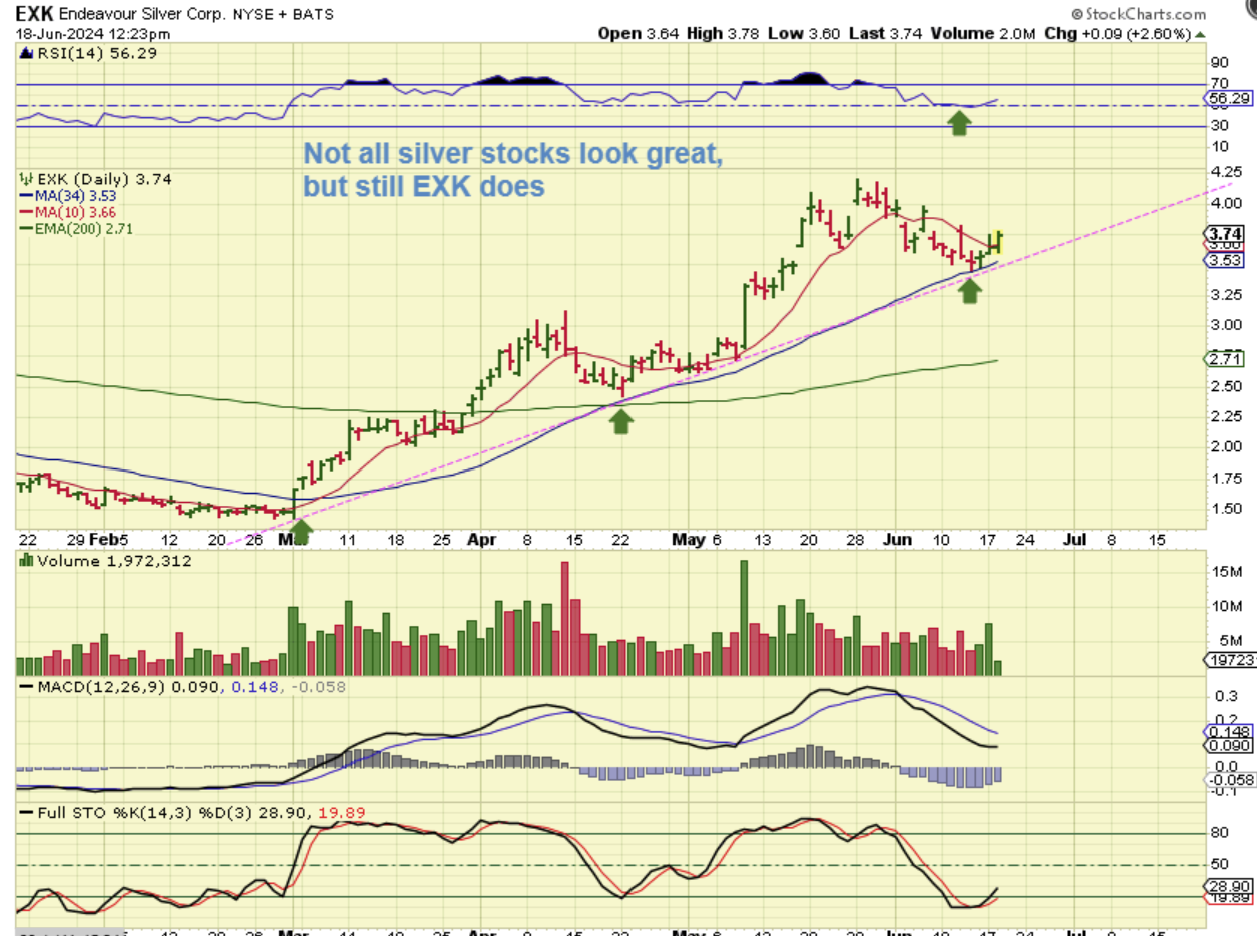
When I looked at SILVER starting to turn up this week, I also decided to run through my Silver miners, and a few look good (unlike when they used to sell off and drop like a rock).
.
EXK, for example, is bullish. It sold down to the 34 sma again and reversed there. I don’t usually count a daily cycle for individual stocks, because they can vary A LOT, but if I did, EXK had a low on day 37 and this is a buy (with a stop).
.
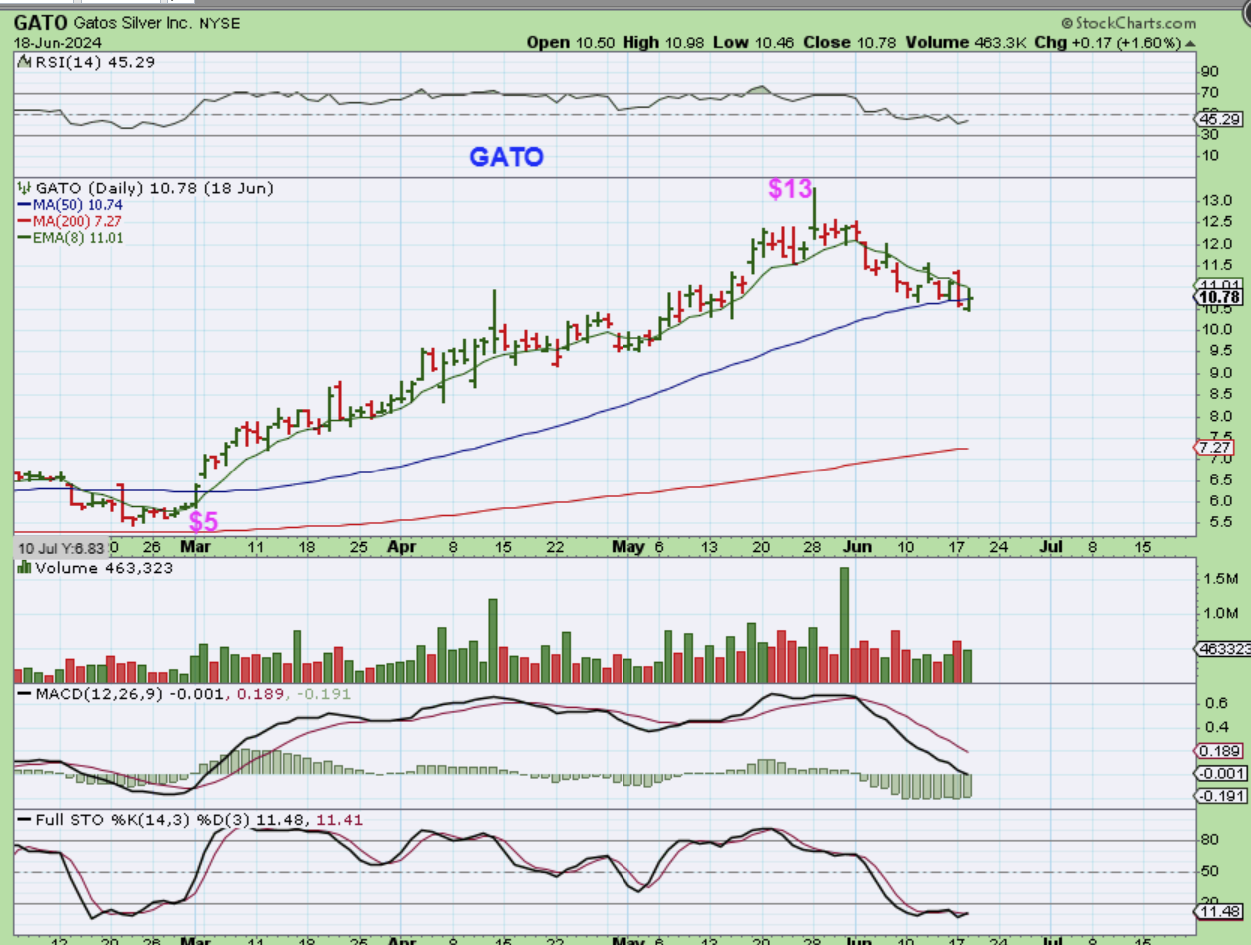
And GATO has done it again: $5 to $13 and a pullback to $10. If it pushes above the 50sma, it could be bought with a stop too.
.
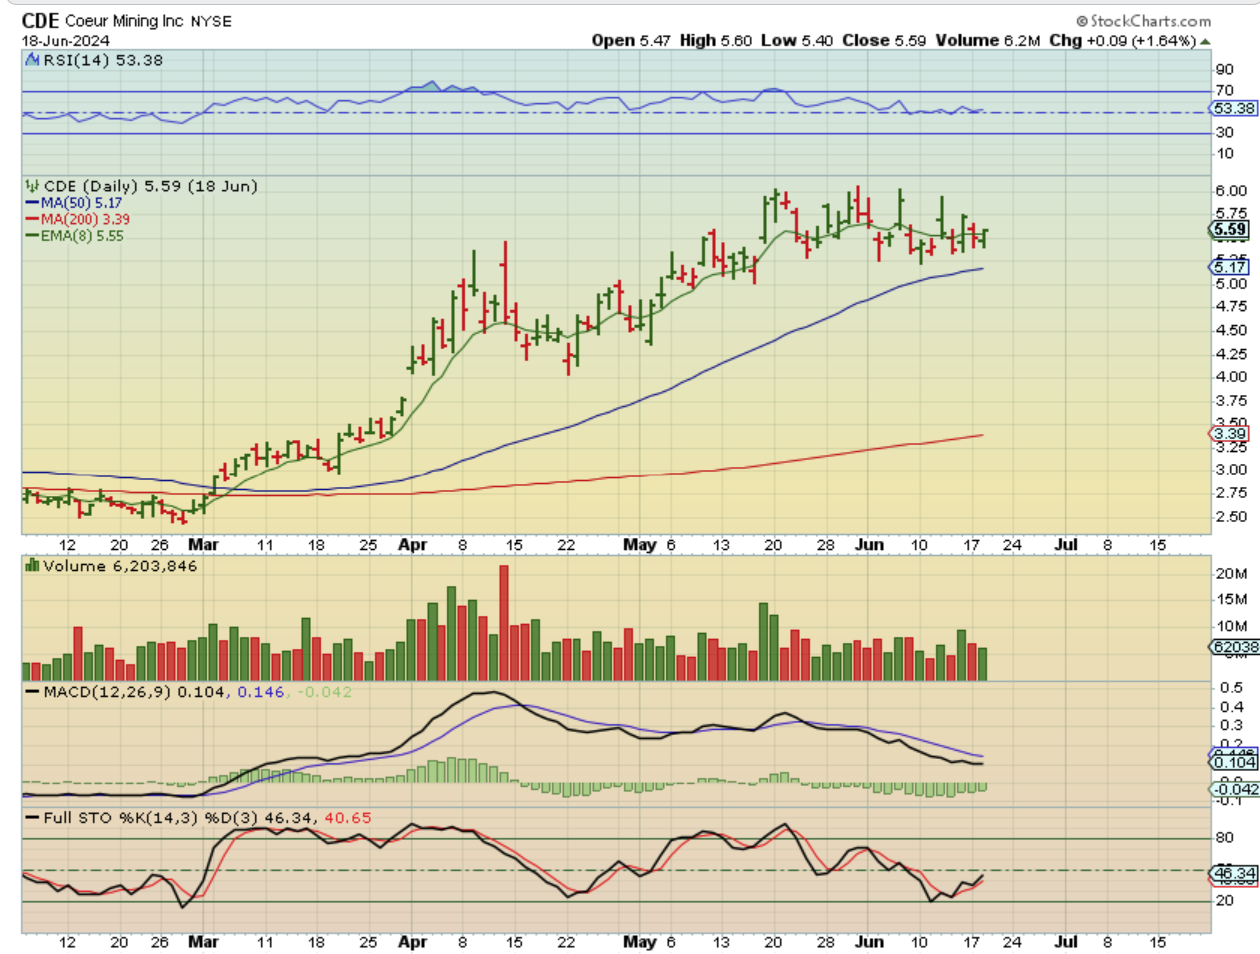
CDE has a very bullish look this late in the intermediate cycle, so SIlver stocks seem to be holding up well.
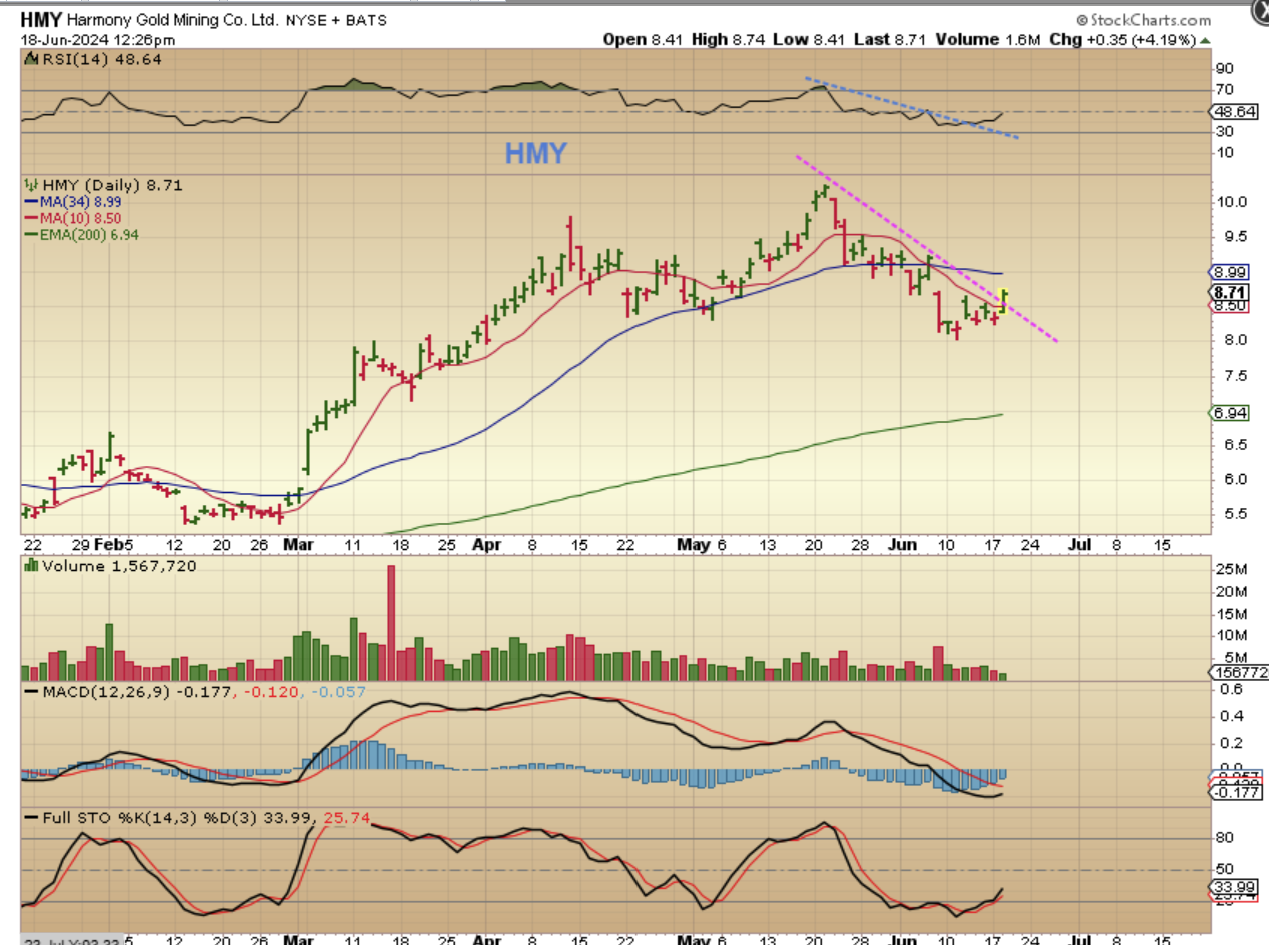
HMY sold off for 2 weeks, but it is improving and broke a downtrend too, so that may be the sign of a dcl too. That may not make this a buy though, if this is a 4th daily cycle, it could crawl under the 50sma and get rejected.
.
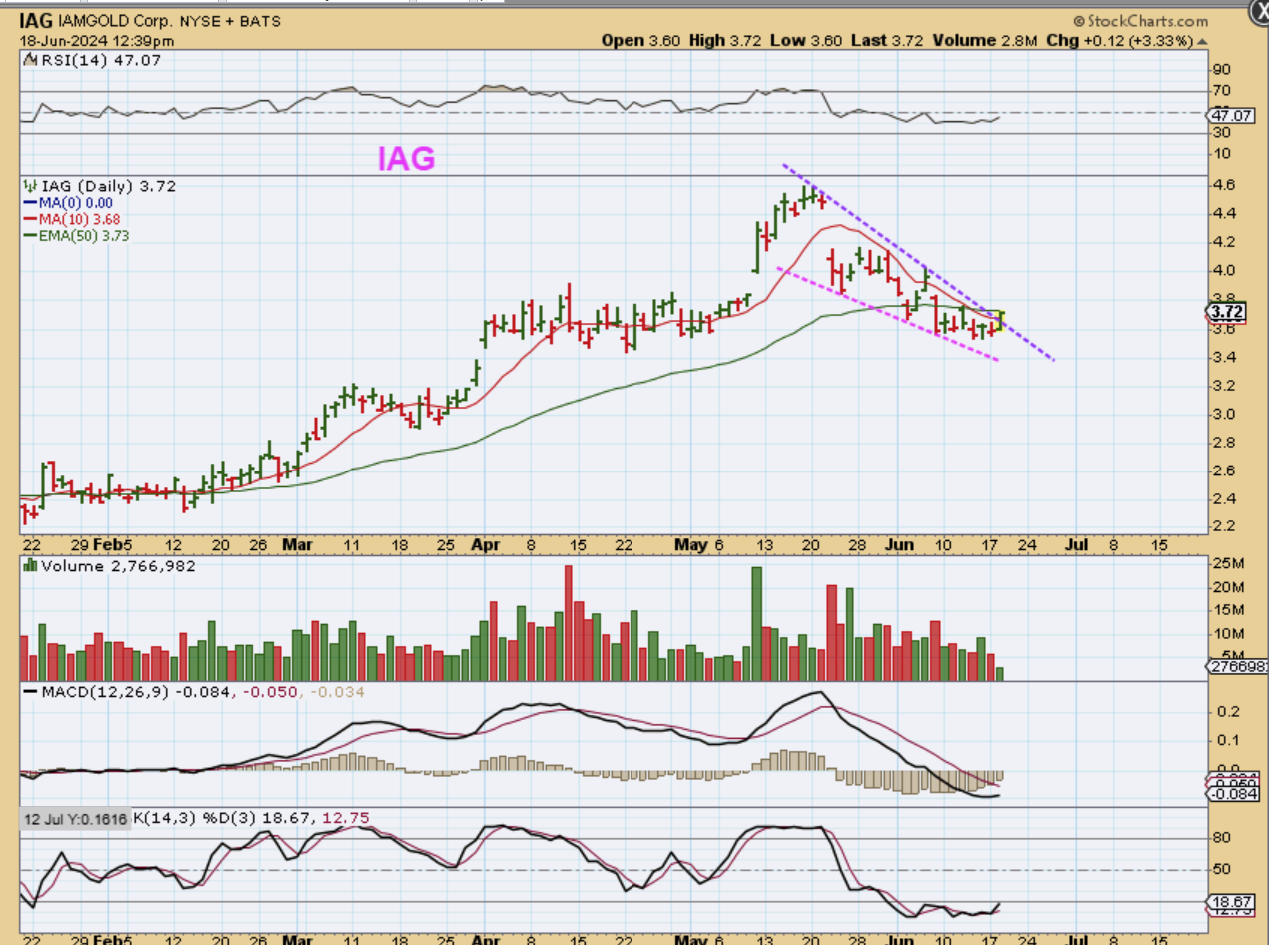
IAG is trying to regain the 50sma after crawling under it for 2 weeks. This is also breaking a downtrend, so it becomes a buy, but it may just be short term.
.
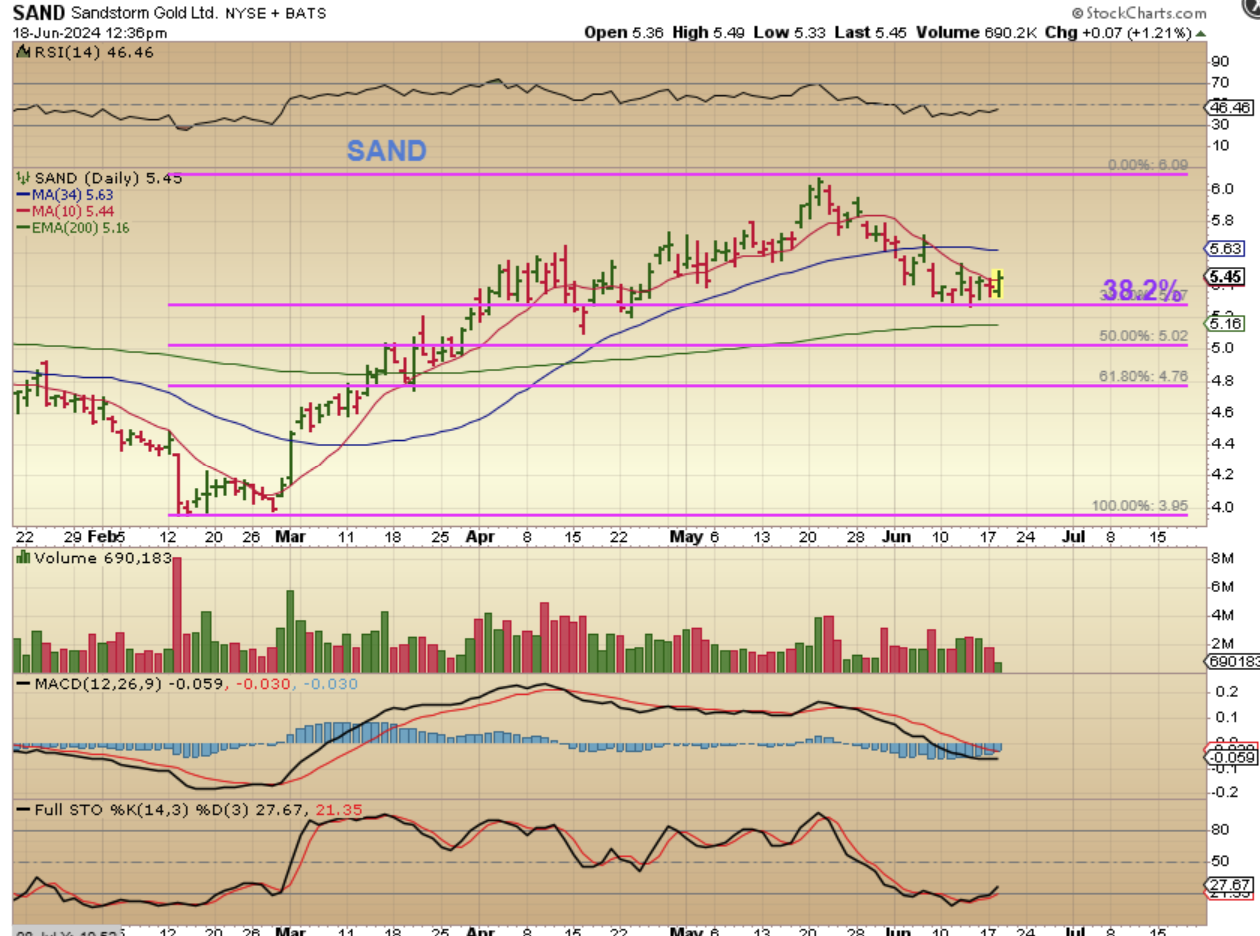
SAND only dropped 38% and is starting to churn sideways. Some Miners are starting to look bullish again, at least for the short term.
.We have reached the timing in The Precious Metals Sector for a dcl, and I am starting to see some of the Miners look like they are holding up against the selling. I pointed out some areas that you can buy, but If this is a weaker 4th daily cycle, it could ‘peak’ around day 7-12 or so, so I’d keep that in mind. I’ll discuss Bitcoin AND CRYPTO STOCKS AGAIN below, because some are ‘Breaking Out’ ahead of Bitcoin. Enjoy your Thursday and Friday trading!
.
~ALEX
.
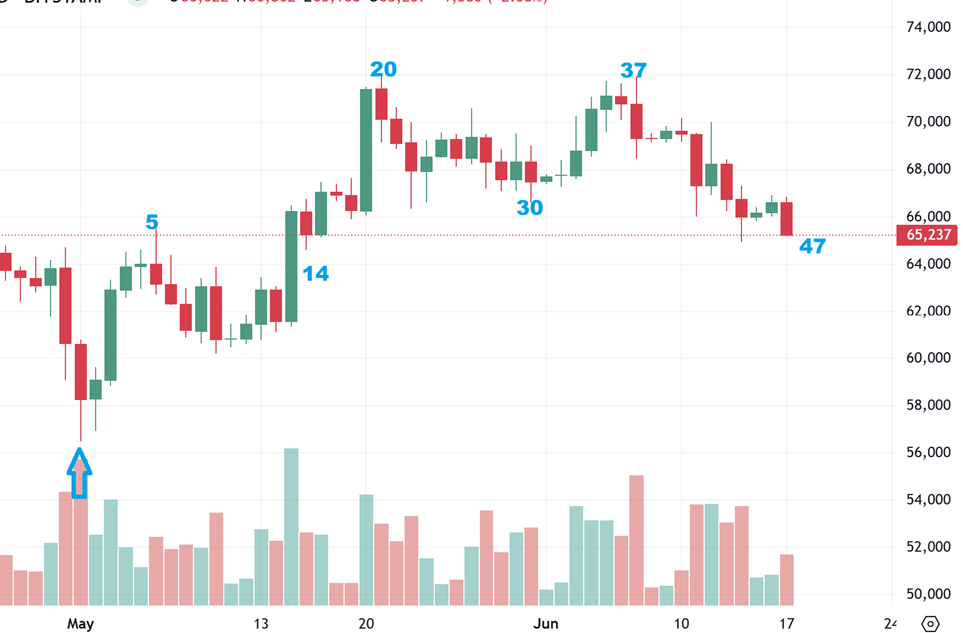
TUESDAYS REPORT FOR BITCOIN DAILY:
If we just pick up and count from the lowest point on May 1st, we find ourselves at day 47 (This actually broke to a new low over night too). This would have me expecting a continuation lower to make that massive inverse & shoulders pattern that I pointed out, with a dcl ahead, but many of the Crypto stocks are –in a very choppy manner— rising higher as Bitcoin drops. And I showed that in the past reports, and in Tuesdays report…
.
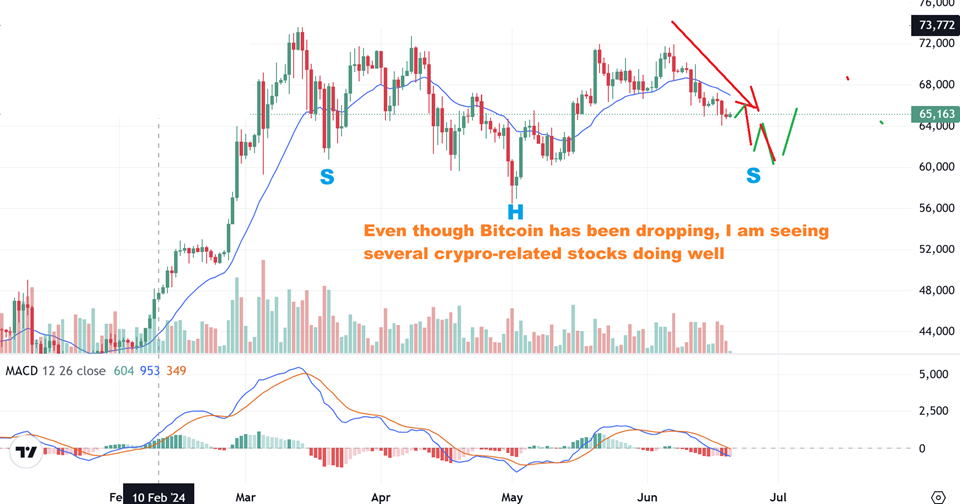
Bitcoin Wednesday Night:
1. I have mentioned that as Bitcoin sells off into the next dcl, it could form a large inverse H&S, as shown here.
2. That said, I also want to look again at some Crypto-related stocks, because as you can see, this is dropping, but some cryptos look to be under accumulation, some are rallying, and some may be ready to breakout and follow.
.
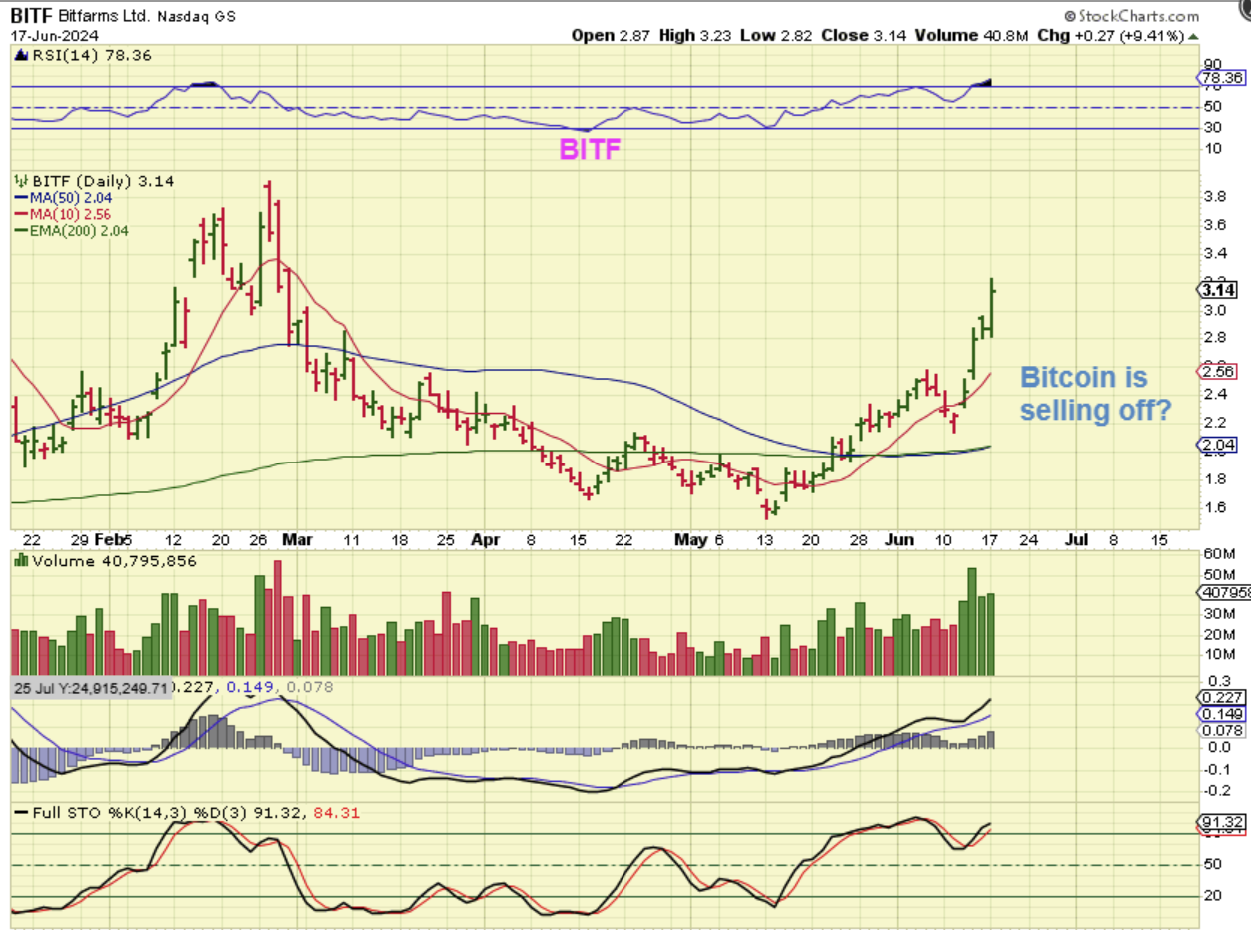
BITF is NOT dropping with Bitcoin, is it? BITF has broken out and begun to rally and the volume is impressive.
.
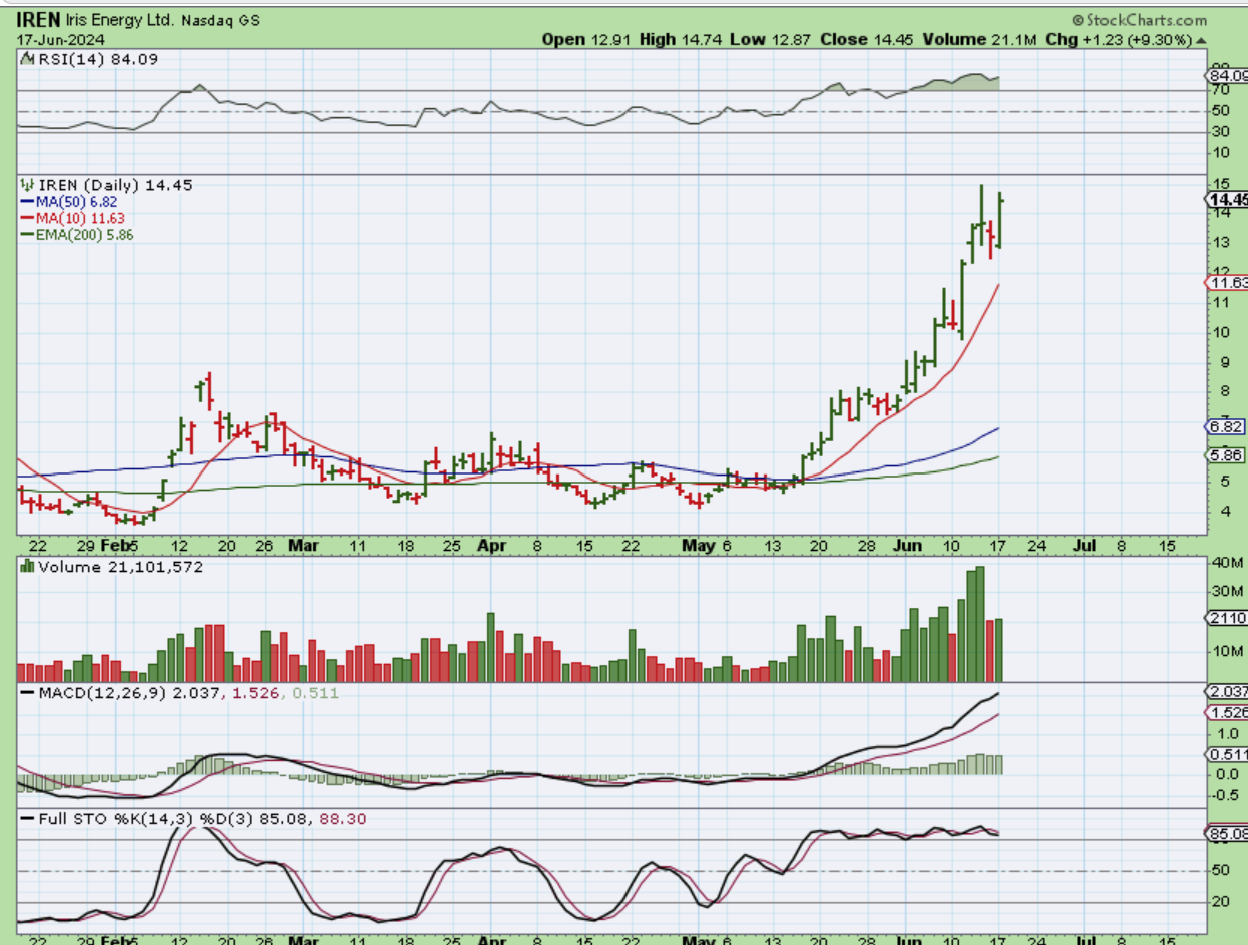
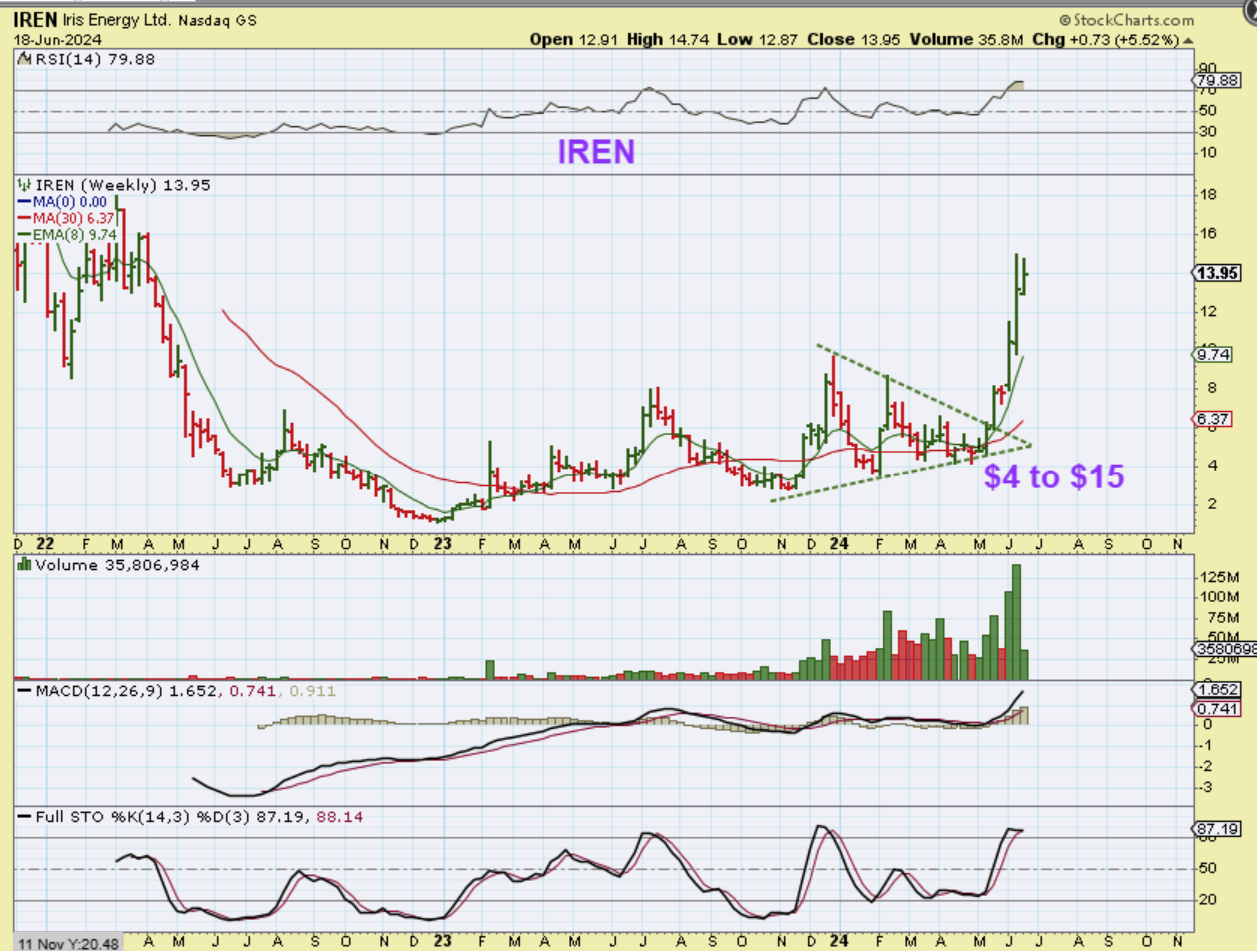
IREN has rallied with strong volume, but let me show you something else…
.
THE WEEKLY IREN chart gave us a downtrend break or triangle break and it ran strong with High volume.
.
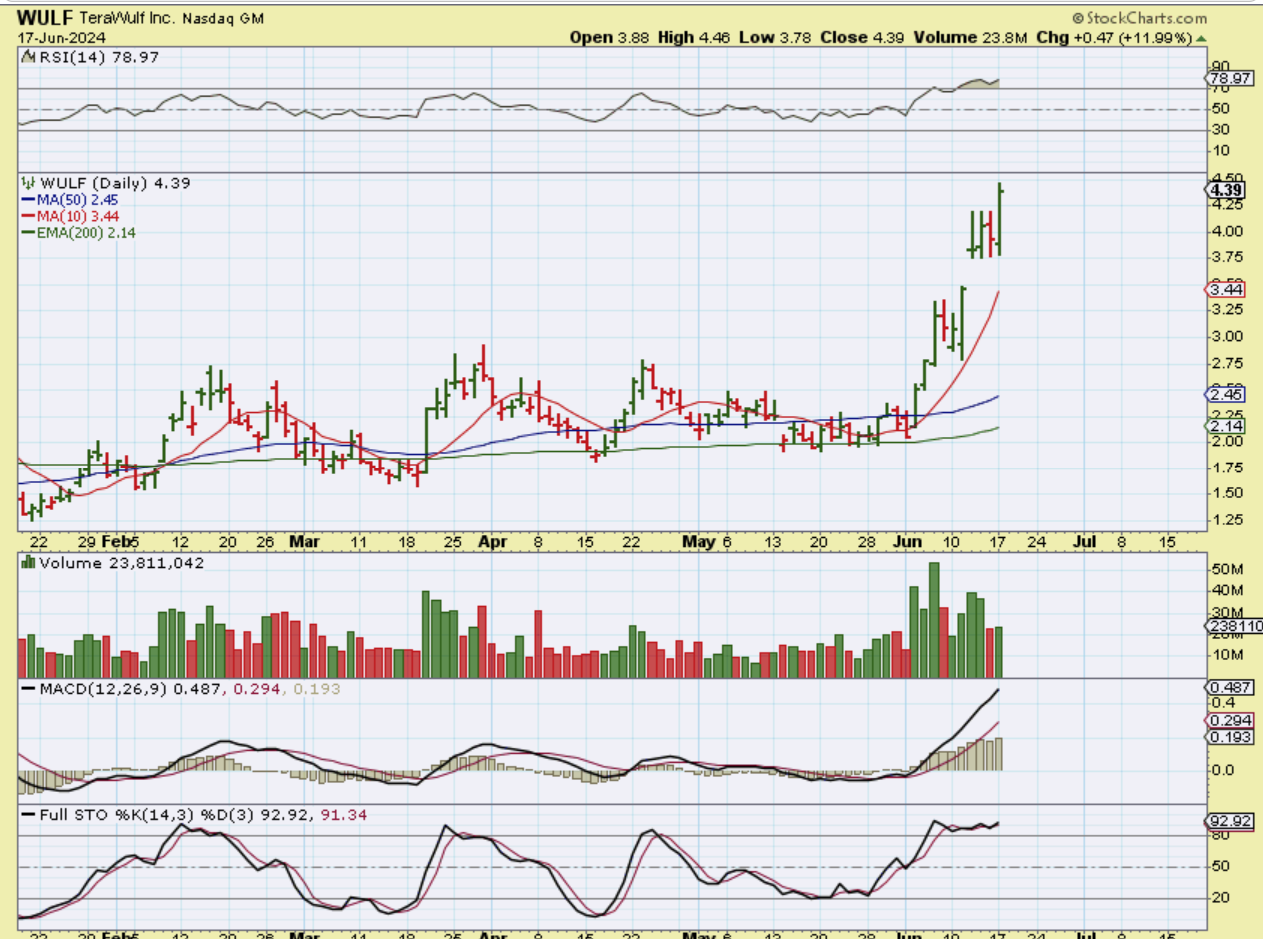
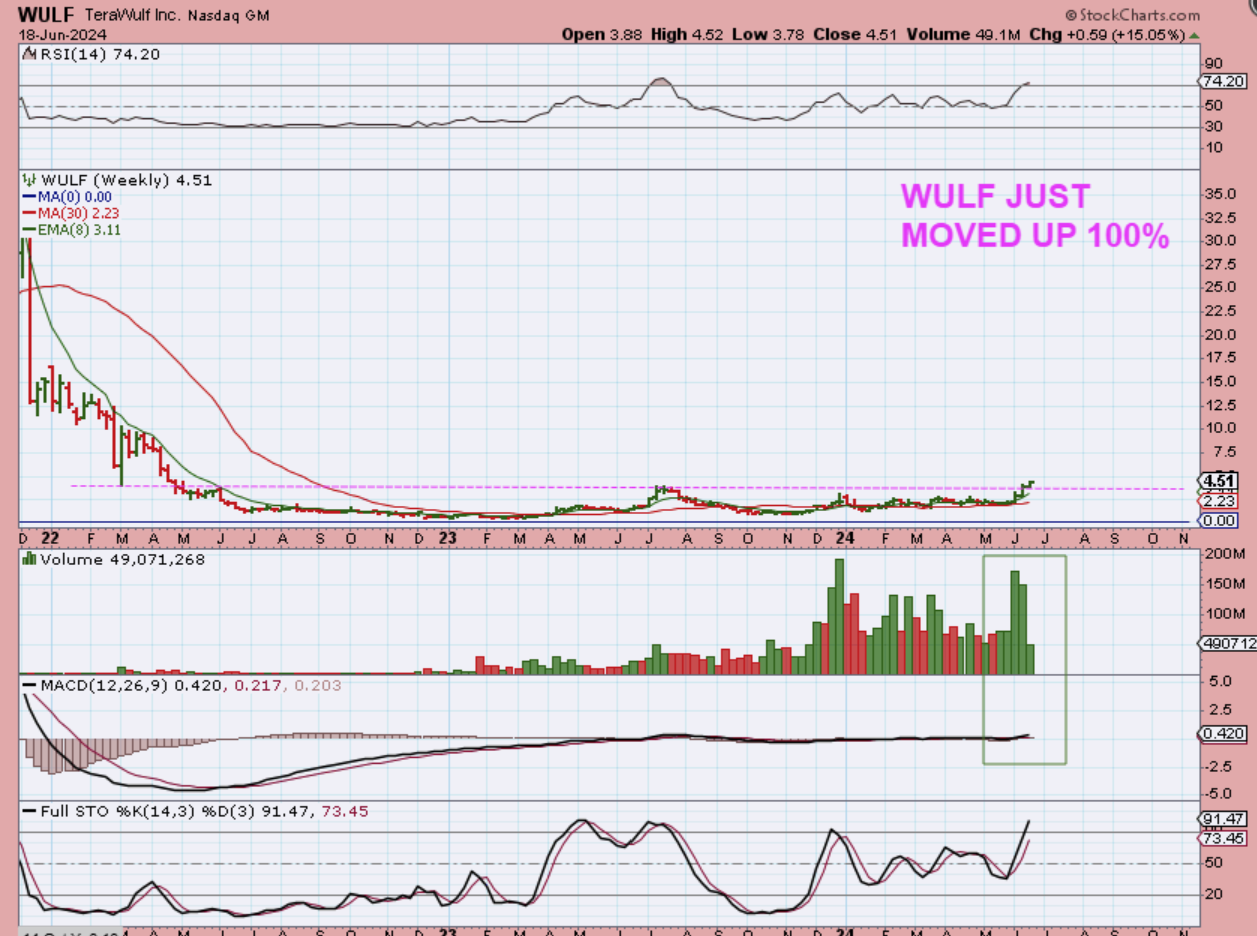
WULF broke a downtrend (not shown) and broke above the 50sma with a volume spike, and just kept going. WULF started to rally as Bitcoin dropped, so how is the weekly chart?
.
WULF WEEKLY has volume surging as it looks like it is just starting to leave this massive base that I used to show, so…
.
DOES ANYTHUNG ELSE LOOK INTERESTING AS BITCOIN SELLS OFF?
.
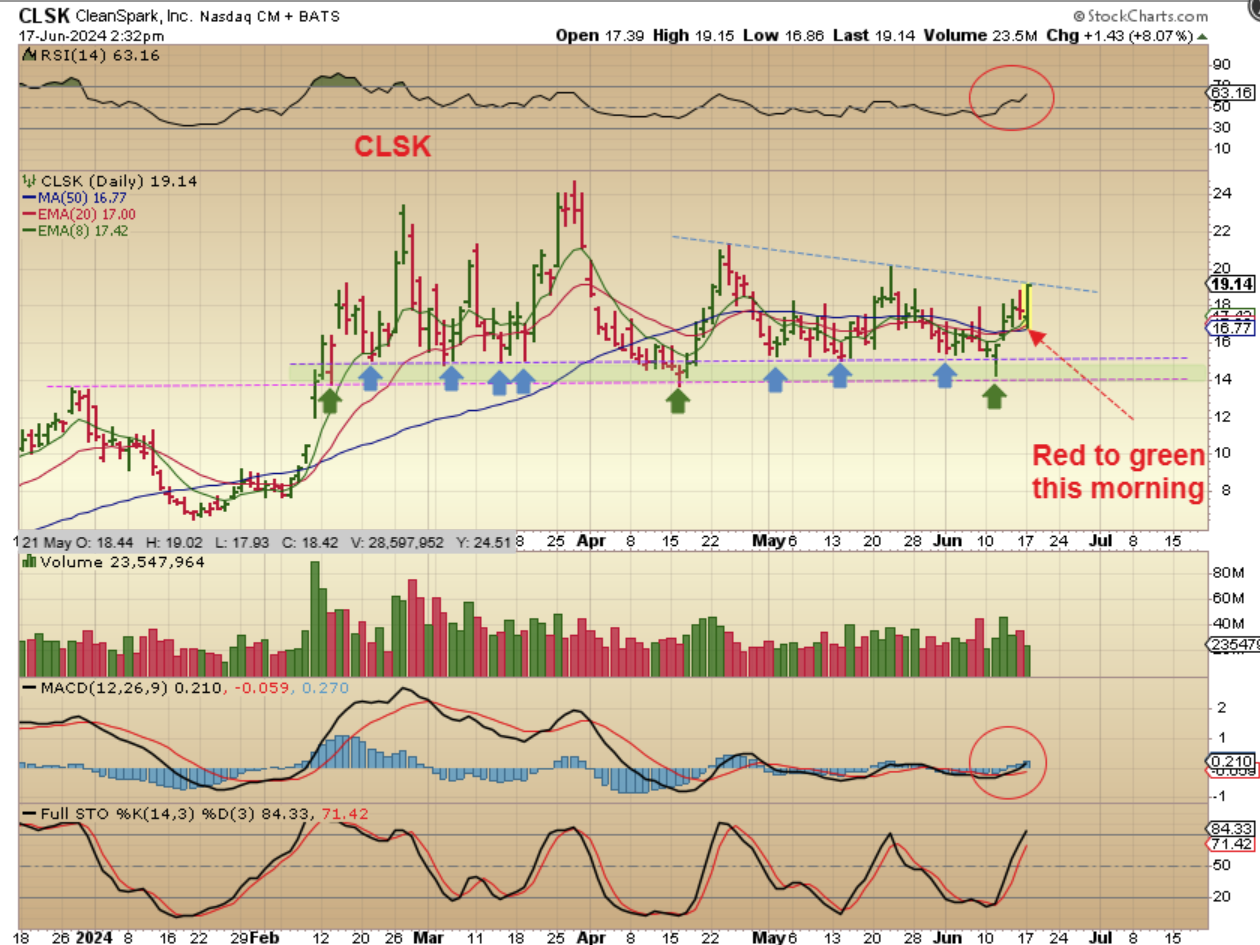
I pointed out repeatedly that $14 or $16 is ‘a low price buy point for CLSK’, to hold in a basket. Earlier this week I showed this chart, where CLSK is trying to break a downtrend line too THIS HAPPENED AS BITCOIN DROPS.
.
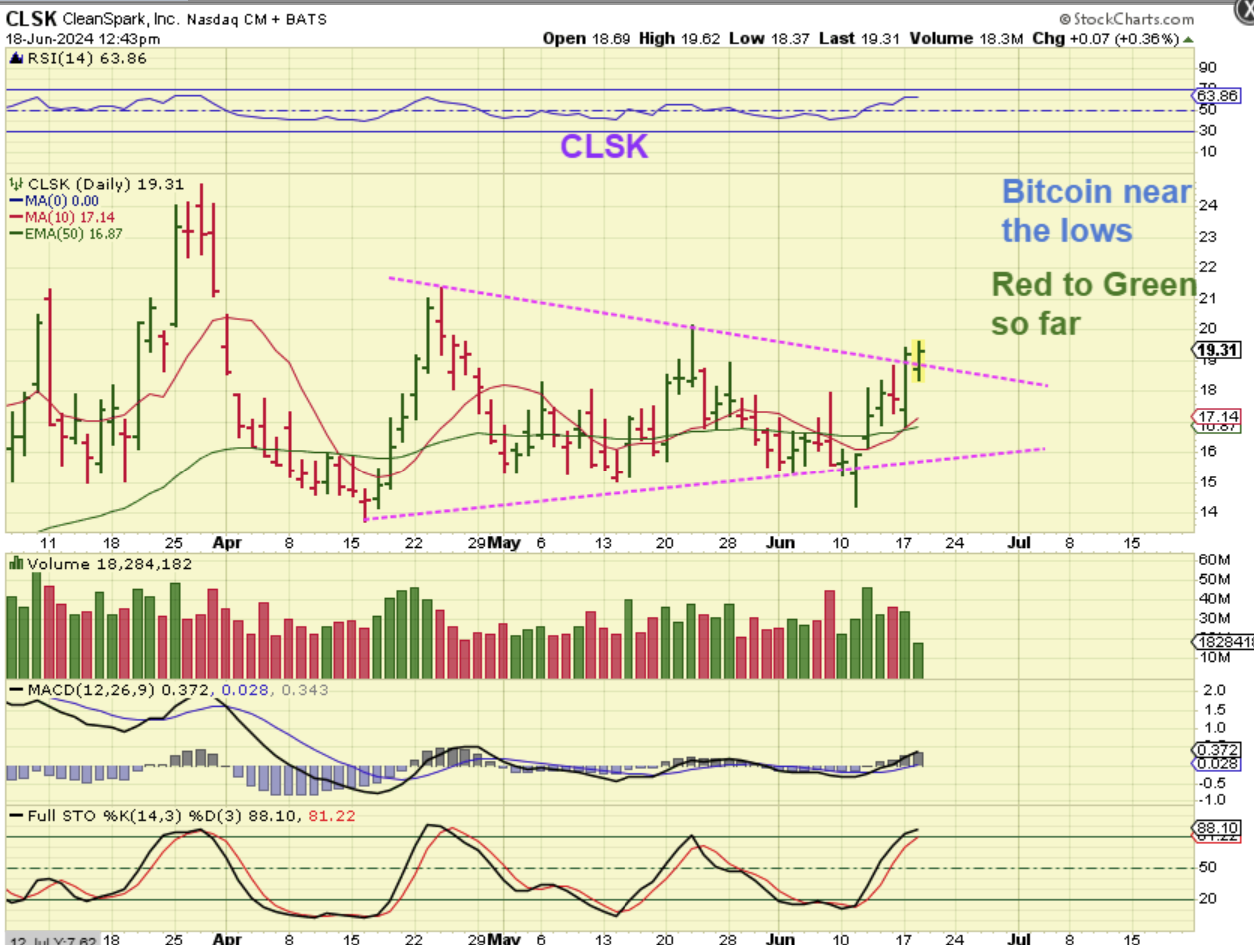
On Tuesday June 18, CLSK did continue to try to break that downtrend line, THIS HAPPENED AS BITCOIN SOLD OFF. So keep an eye on this one too. What about the weekly chart?
.
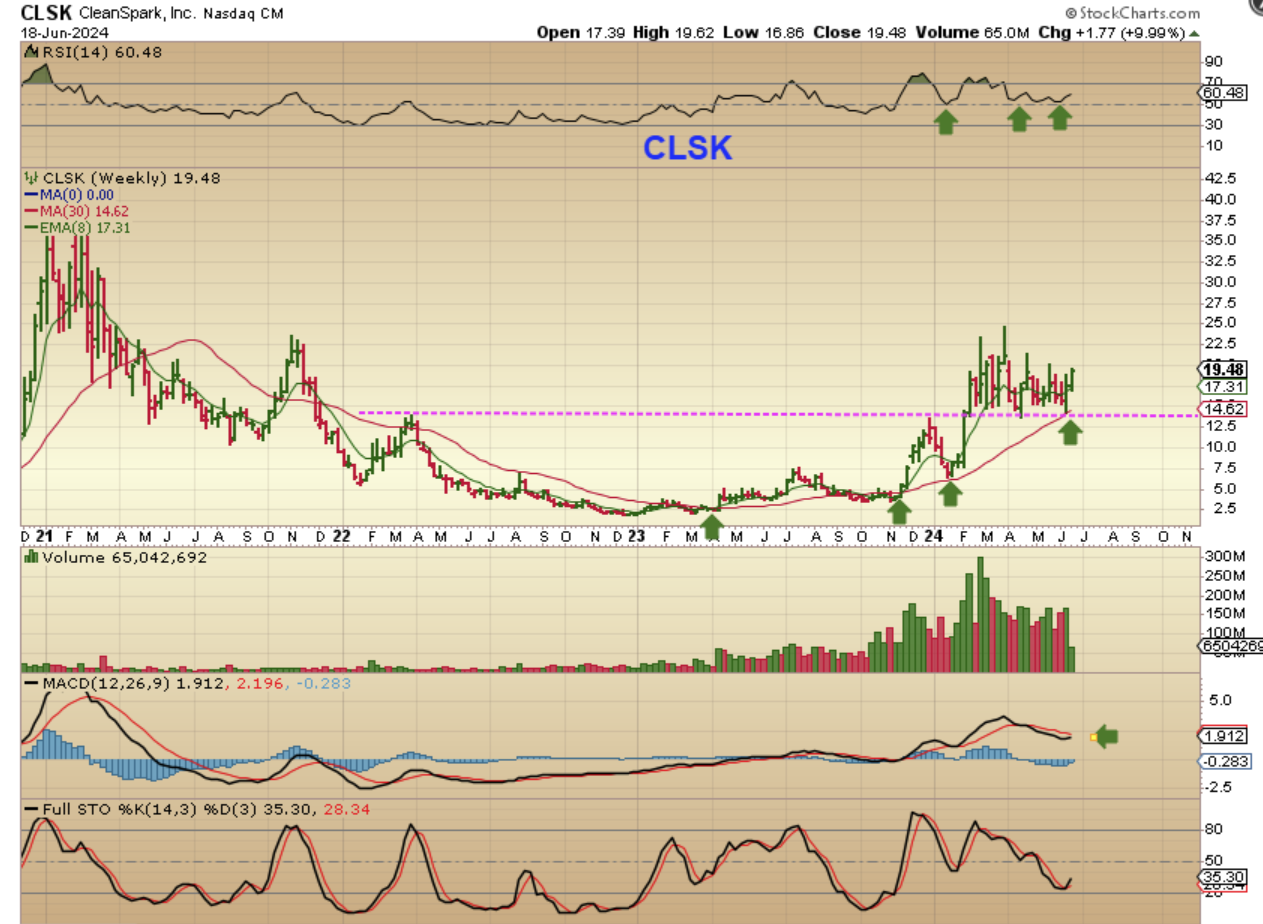
CLSK WEKLY- 2 weeks green. So now I look at the weekly chart and it has chopped sideways ABOVE a recent break out (that was as it was holding the $14 and $16 support areas). CLSK just tagged that 30 week ma and reversed higher too (Bullish), and has nice volume, so CLSK may be preparing to launch soon too. Remember: This 2 week climb came with Bitcoin dropping.
.
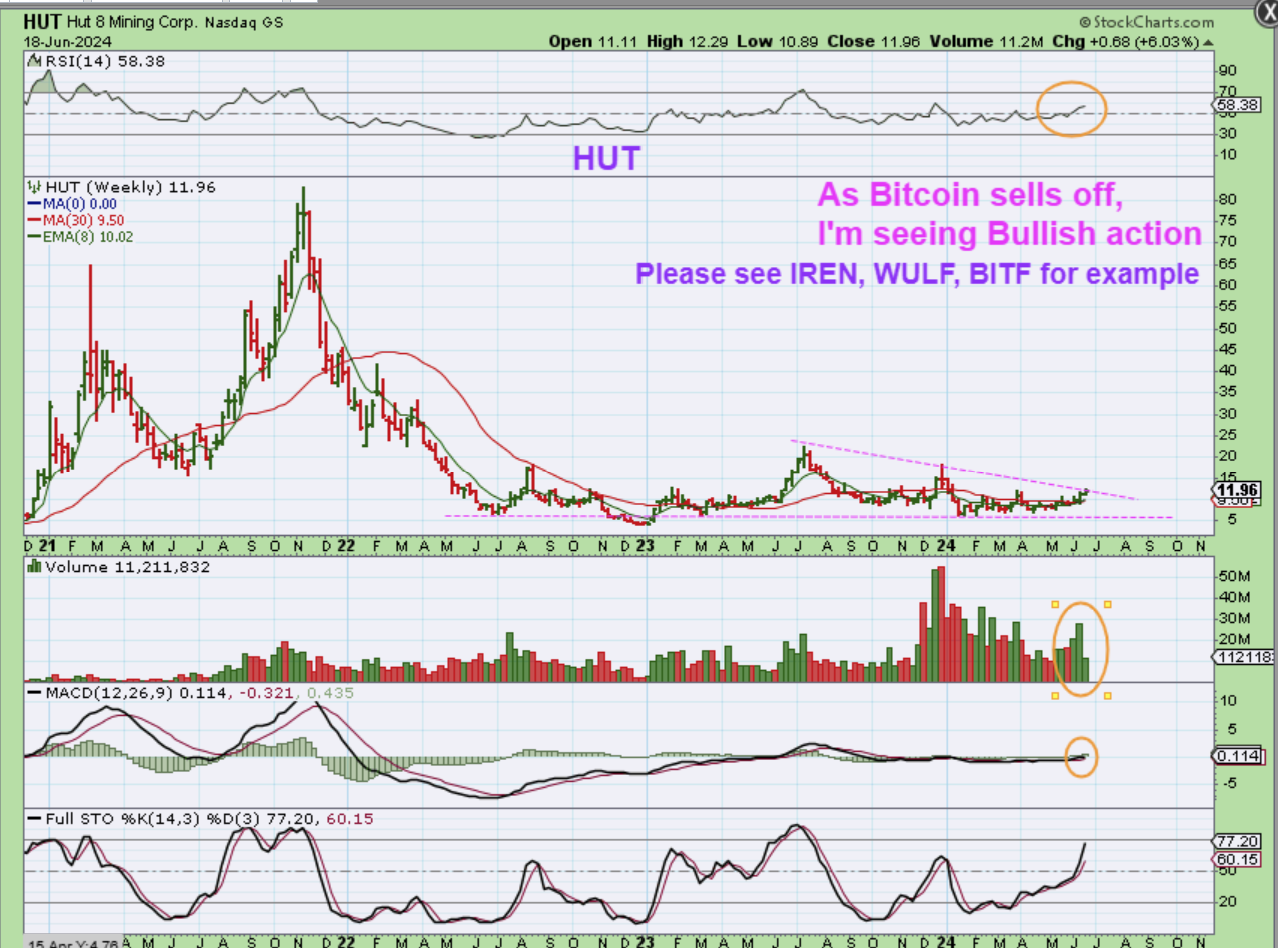
I showed HUT with this chart in Tuesdays report as also having broken out and back tested support. What do you think the weekly chart looks like?
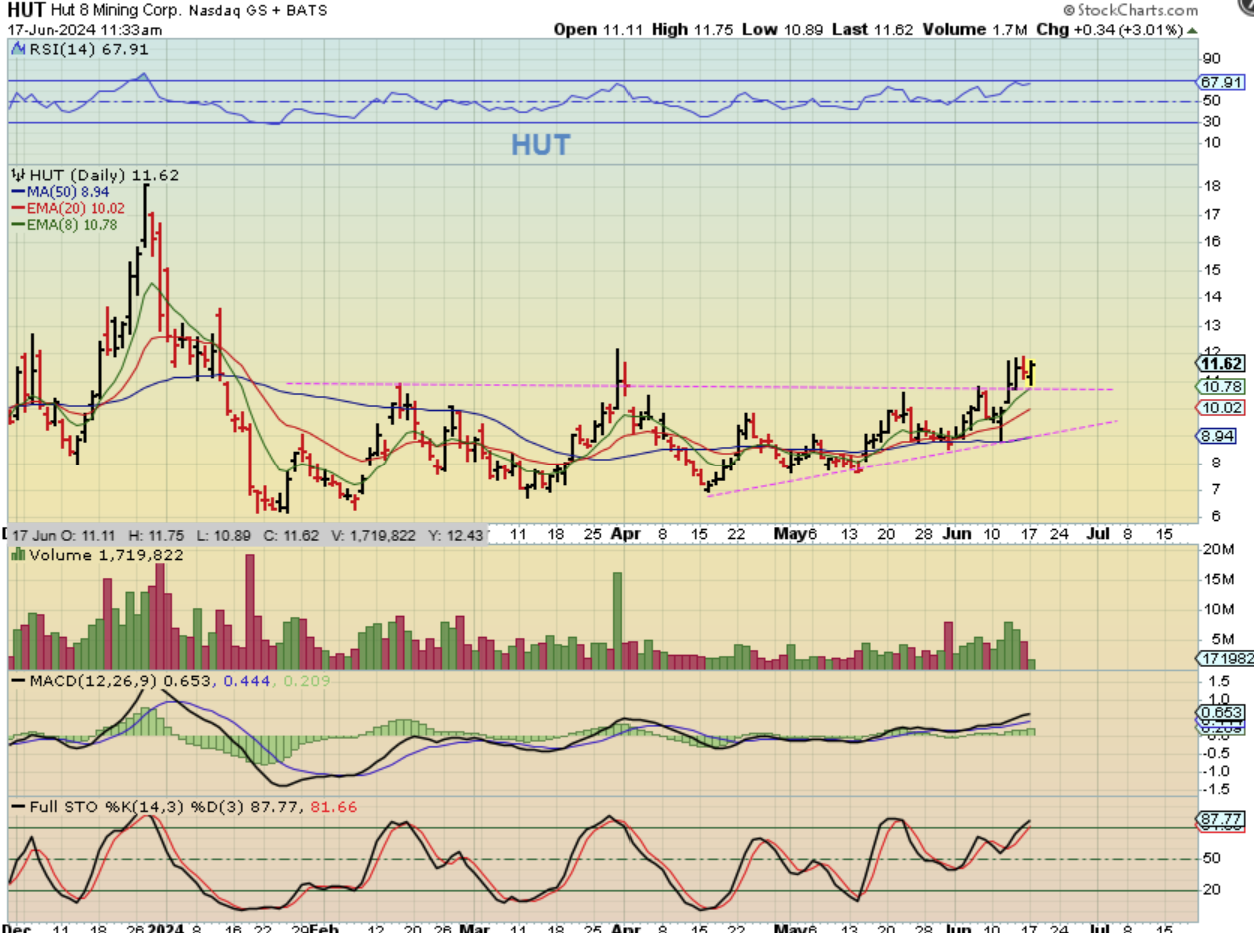
.
HUT WEEKLY – Again, Bitcoin has been selling down, but HUT is pushing on a downtrend line or wedge. Volume looks great too, since the weekly chart is only 2 days old this week. Is HUT ready to break out and run? That volume looks to be saying that it could be ready, but even if it doesn’t breakout now, it should when Bitcoin finally bottoms.
.
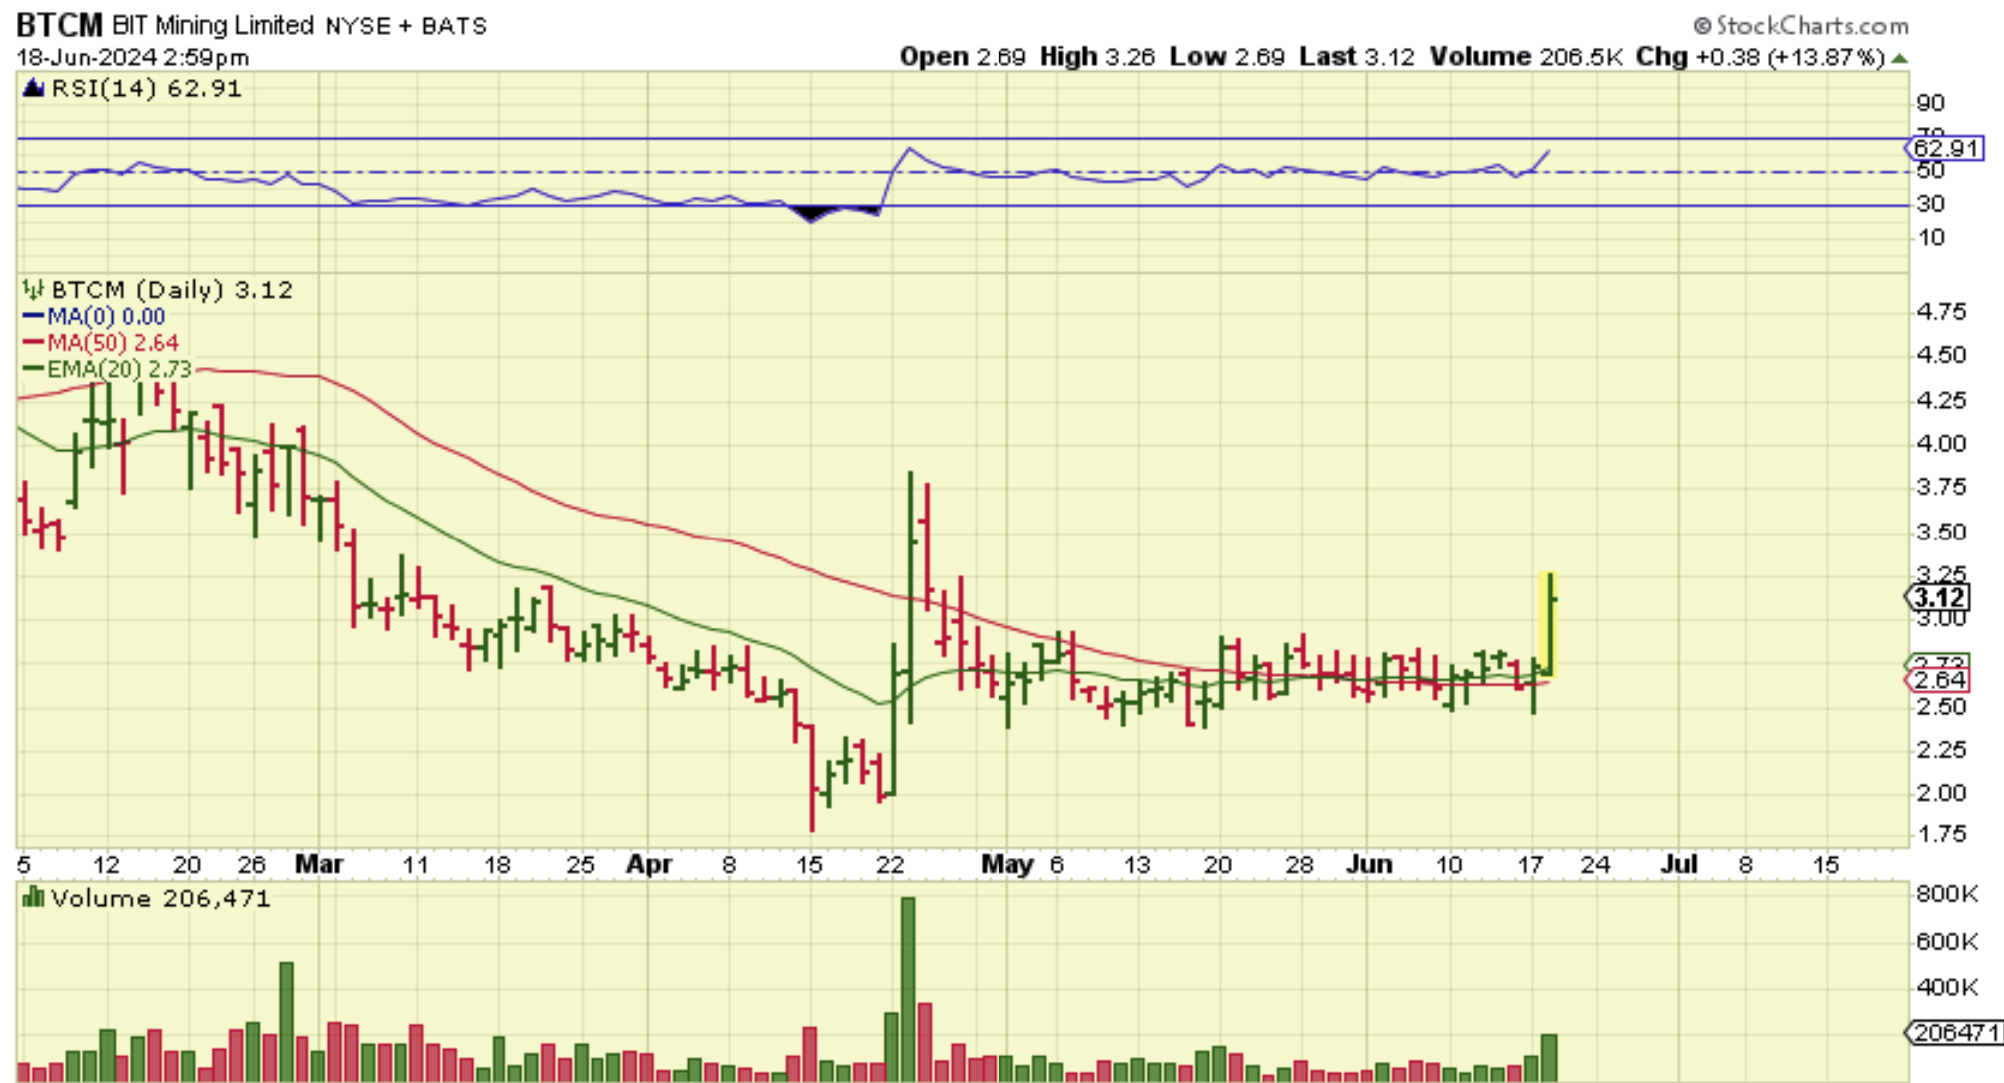
BTCM was starting to Pop with volume too, while Bitcoin dips lower. I think that some of these may be under accumulation, BEFORE the dcl in Bitcoin and the next strong breakout and run.
.

