June 2nd Weekend Review – More Clues
I’m on my way out the door, and I just finished this report. I did not have time to proof read this report and it is rather long, so please excuse any typos. If something seems unclear, feel free to ask for clarification in the comments area. I’ll be back late today. Thanks!
.
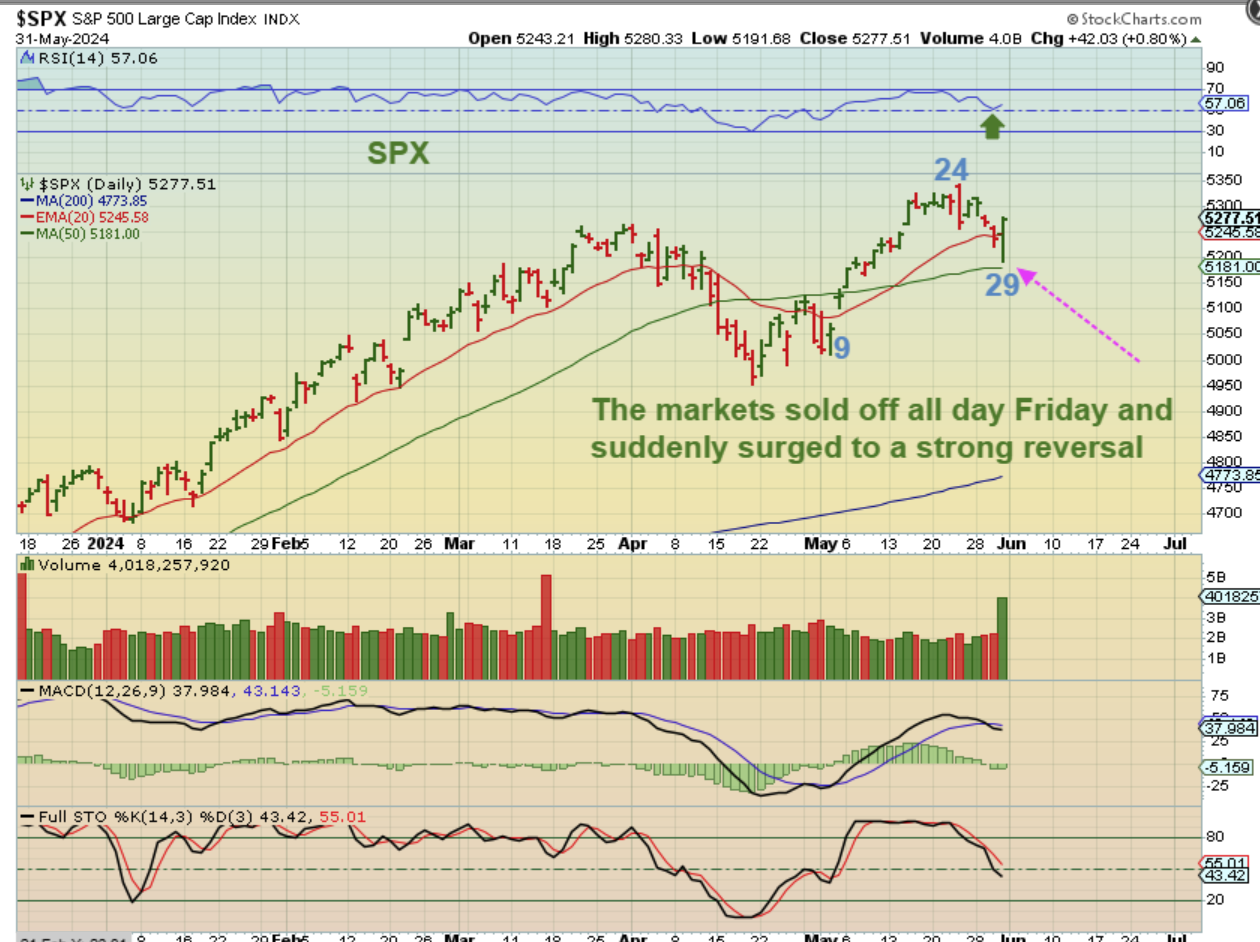
SPX DAILY – The General Markets have dropped lower ever since that day 24 bearish engulfing.
1. On Friday the markets sold off all day long on Friday….until…suddenly an intraday rally kicked in. That gave us what we would view as a bullish reversal.
2. This does make things a bit tricky, because it could be a half cycle low (since we did have some 50 day daily cycles), or
3. This might be an early dcl and now we start the 2nd daily cycle.
.
I just want to tell you why this makes me a little uneasy. Why?
.
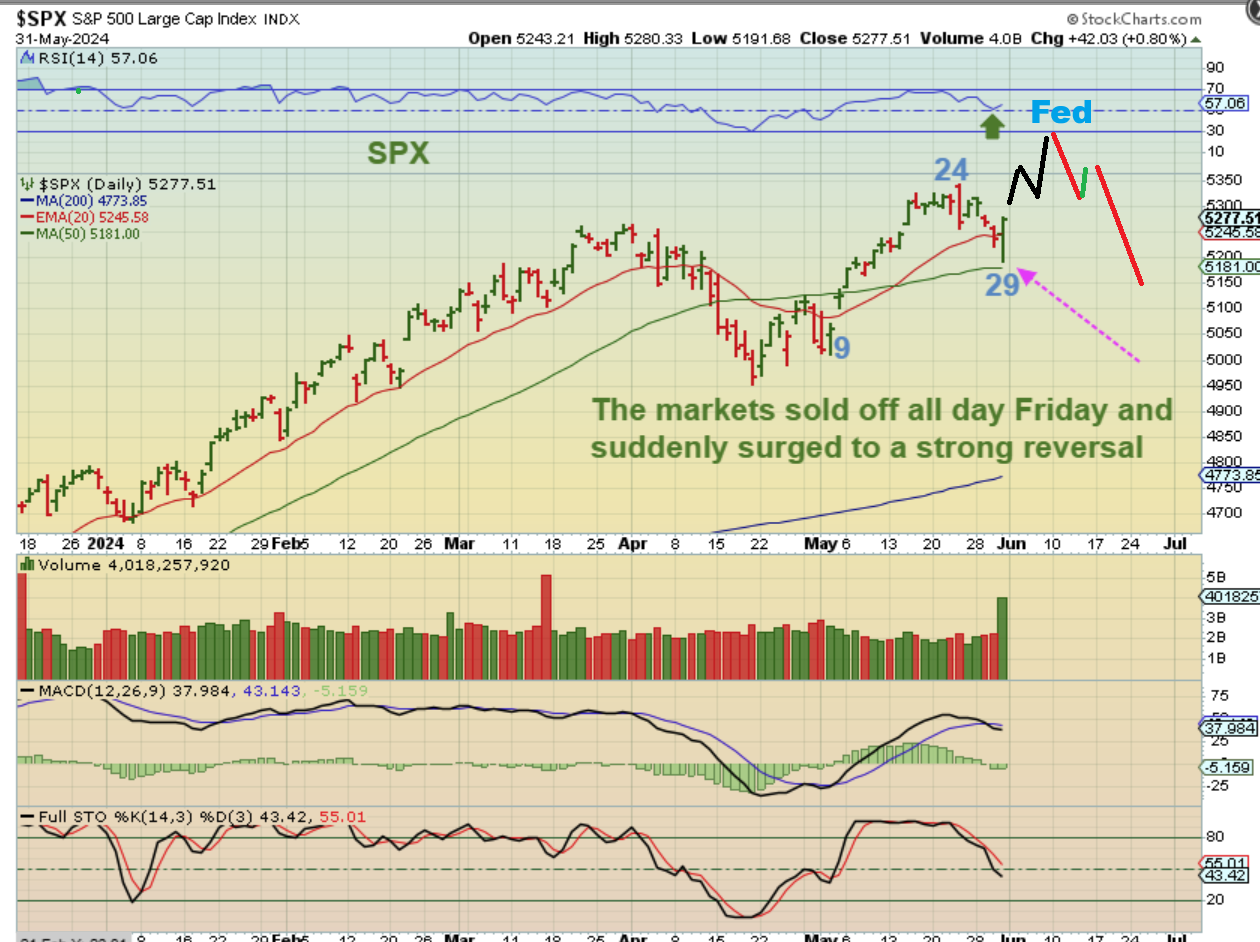
We had the Dow Theory appear, so in the back of our minds, I said that we might be looking for a ‘trend reversal’ with this intermediate cycle, starting in the 2nd daily cycle.
I still play it long and use trailing stops, but it could be dangerous in the 2nd daily cycle if we get a large gap down at one point, like the day after the Fed Mtg? That market correction could start with the Fed Mtg in 8 trading days. It could appear as a L.T. 2nd Daily cycle, so let’s just keep that in mind. That would be 5 waves up too. This set up looks quite bullish right now, but even though this set up looks quite bullish, the Weekly chart may be showing weakness?
.
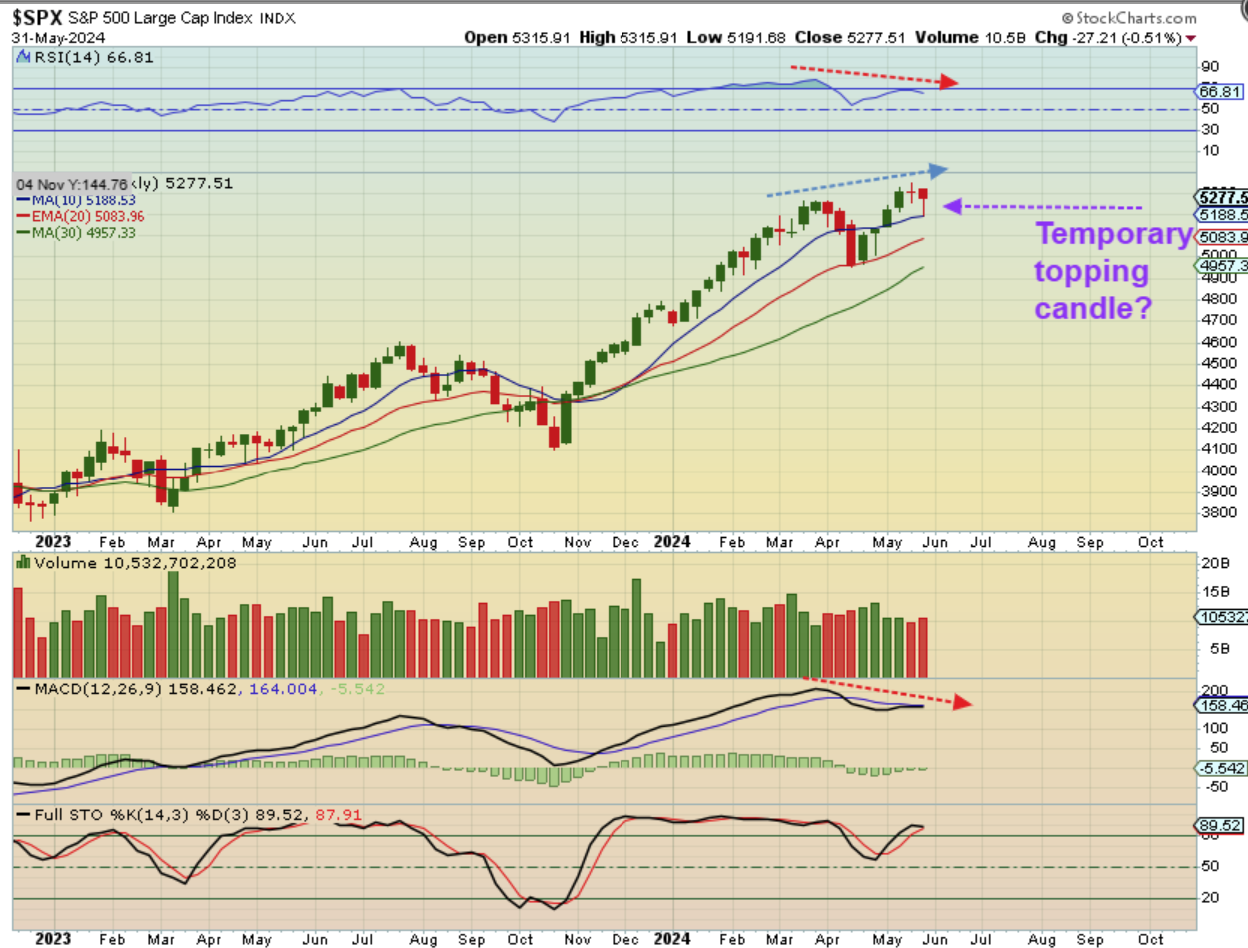
THE SPX WEEKLY also has a reversal candle right at the 10 week ma, and that is usually bullish, but these also can become topping candles. I do see divergence at the RSI & The MACD as we made new highs, so caution flags are posted on the beach now. There may be Sharks in the water, so we must swim at our own risk in what might be the 2nd daily cycle or the first that also may top on the Fed Wednesday.
.
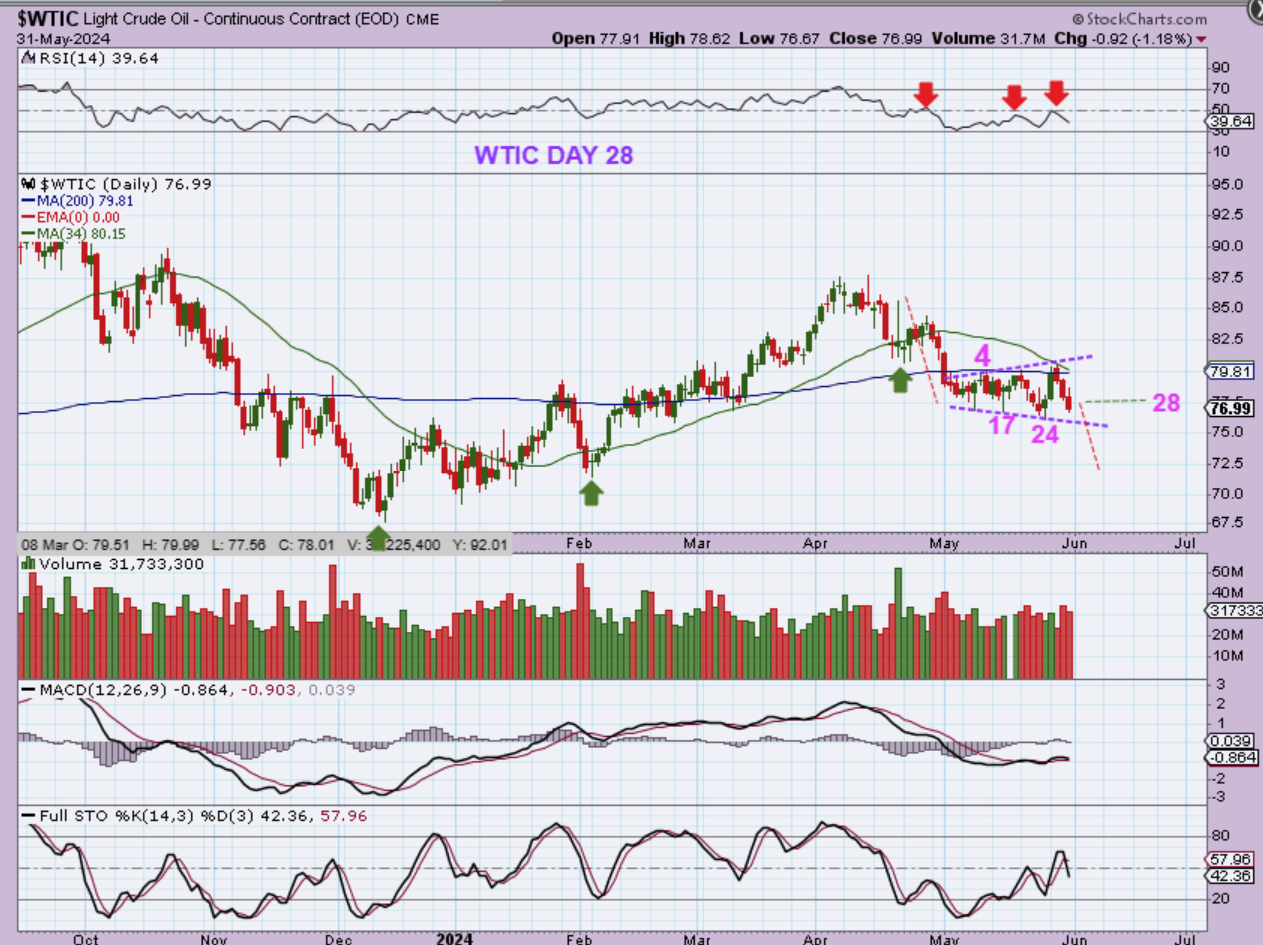
WTIC DAILY – I have been discussing the Oil chart as one that should continue lower. I see us only as being on day 28 (of possibly 50) and it ihas been chopping under the 200sma, unable to regain it.
.
FROM FRIDAYS REPORT: Day 10 of the 3rd daily cycle.
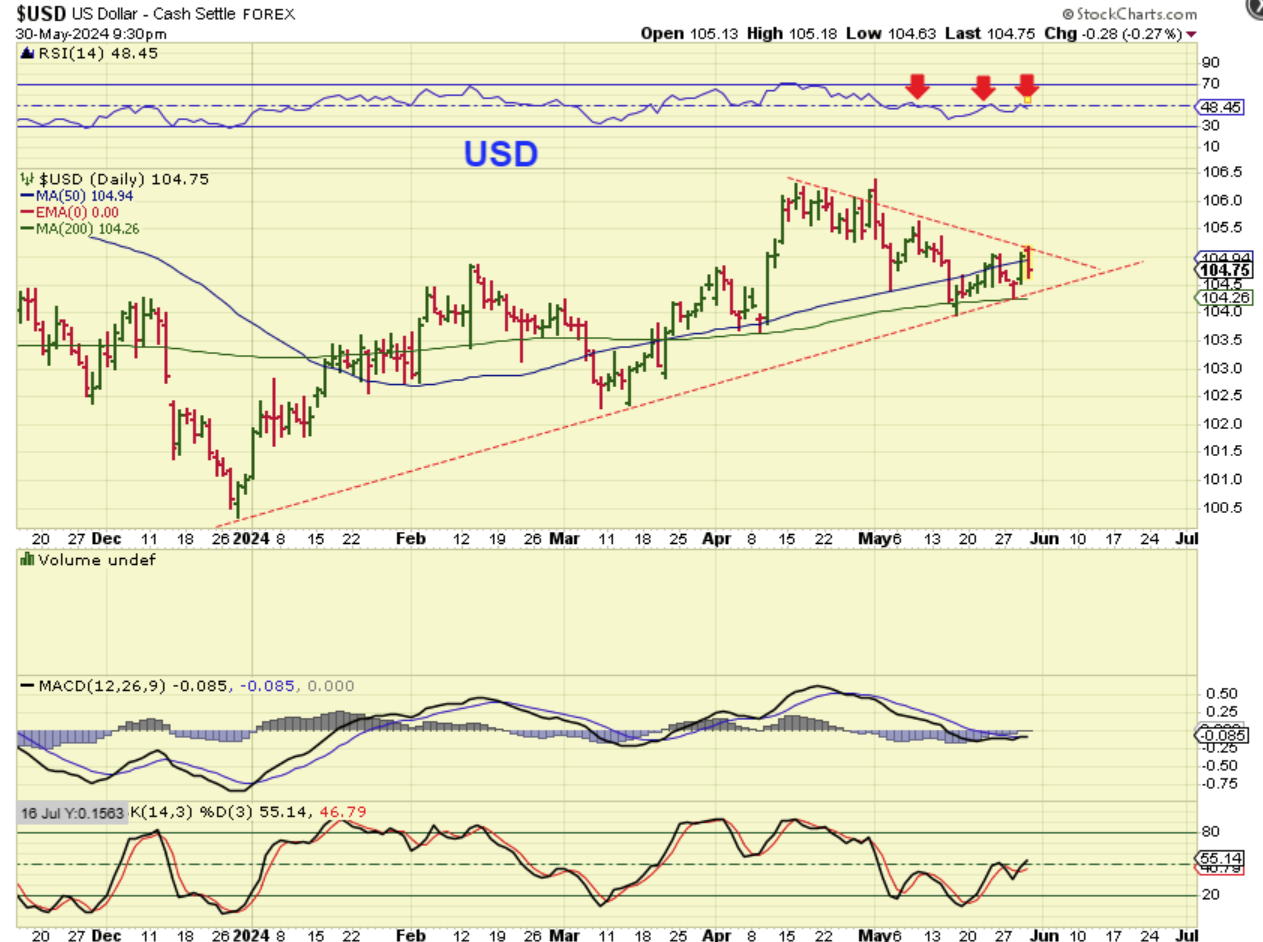
THE USD dropped on Thursday and I have been saying that I expect it to roll over into the next dcl. The USD’s path has not been affecting Gold very much like it used to.
.
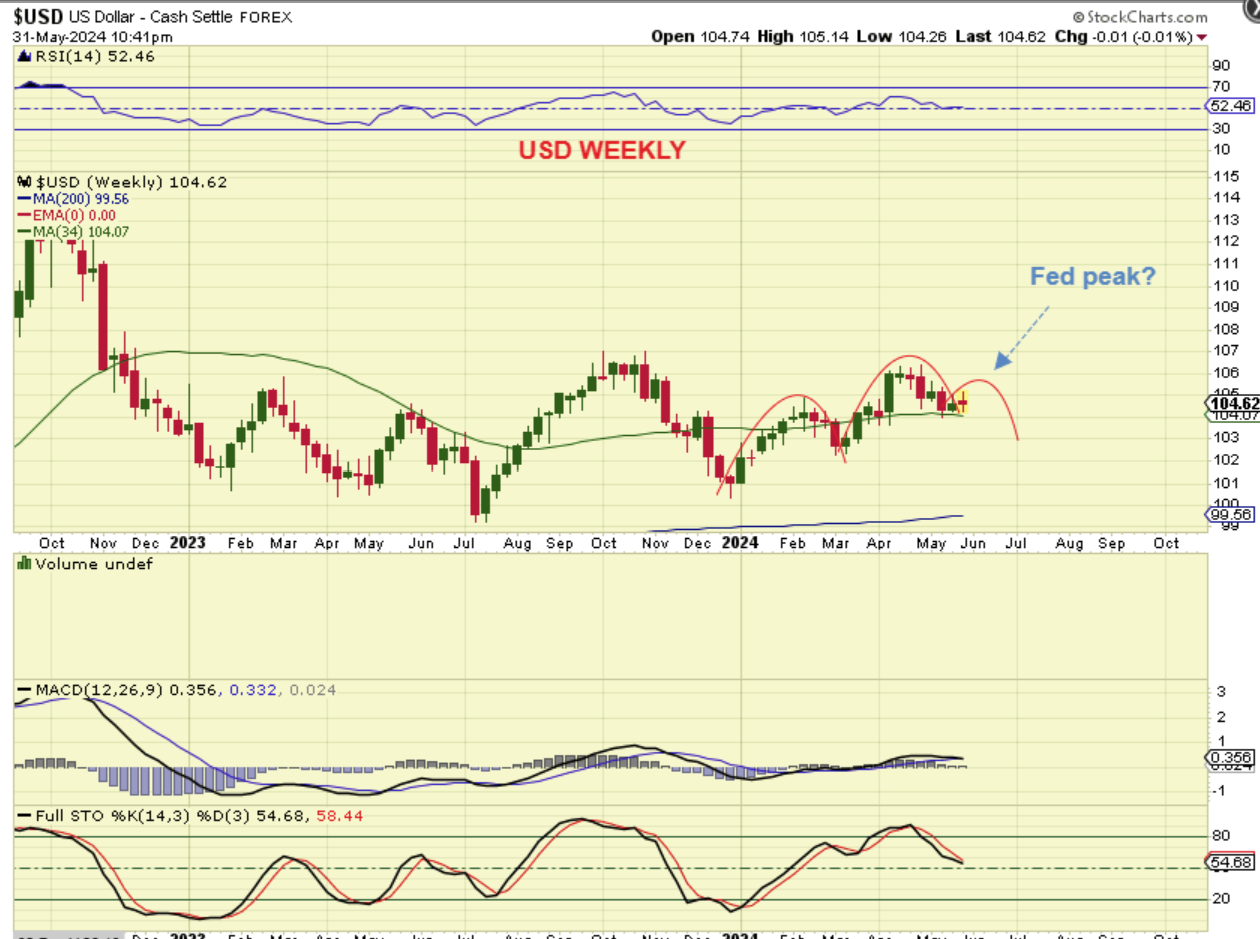
USD WEEKLY – So yes, I expect the USD to continue to roll over too, because it is on the 3rd daily cycle & struggling at the 50sma (seen on the daily chart above).
.
Note: I made the statement that if Gold dropped rapidly into the Fed Mtg, we could see that as possibly an ICL formation. I will show you why I said that, but after reviewing the weekly charts and Monthly charts (May ended), that honestly may be less likely. It is still possible, because we are in a strong bull market, but the weekly charts seem to be looking for a deeper ICL. Lets take a look at what I was seeing and why I said that in the first place:
.
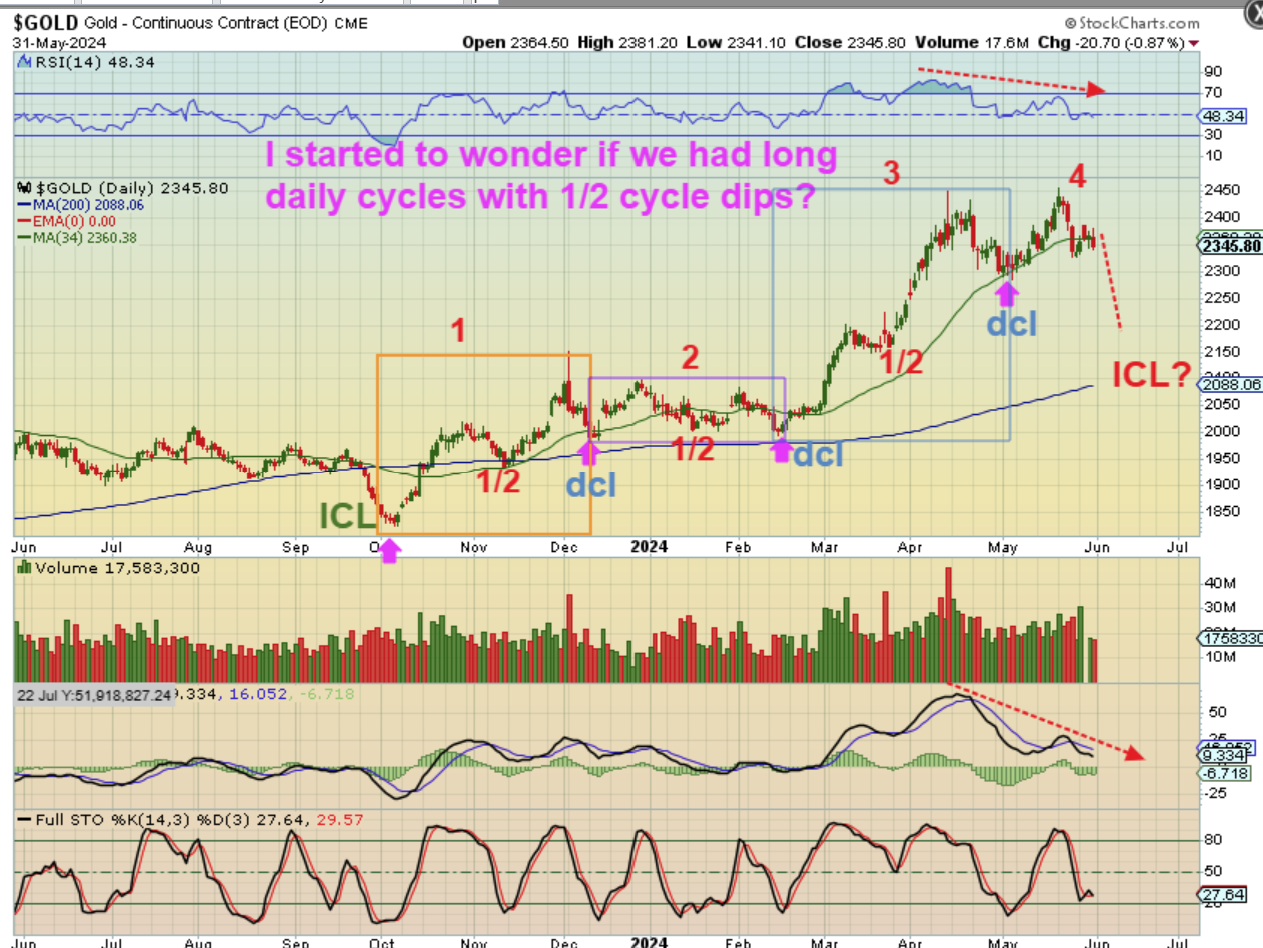
PLEASE FOLLOW ALONG AS I DISCUSS THE GOLD CYCLES – I was studying Gold and I said to myself,
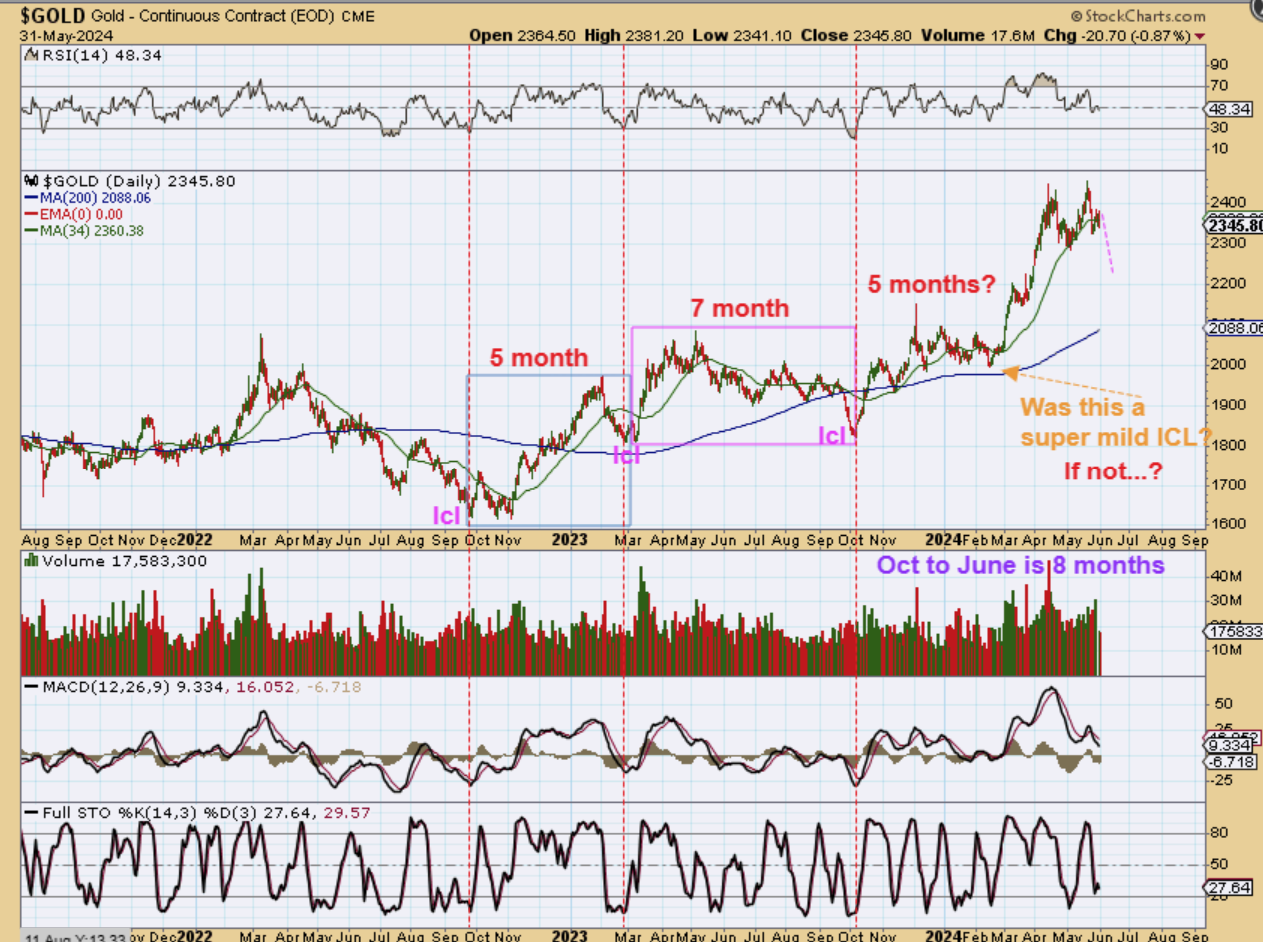
“Was that really an ICL in February? It didn’t even break below the 2nd daily cycle, did it?” Take a look at the ‘obvious ICLs’ in Oct/Nov 2022, March 2023, October 2023, an those were deep sell offs. Then in February, we didn’t break the 2nd dcl? Odd. I DID call that an ICL as it broke higher after 5 months and we DID buy it. It then broke the downtrend and rallied VERY STRONGLY in March- May, so we did great, but…I started to think last week, “Does that look like an ICL?: …
.
So I started to think, ” If THAT was not an ICL in Feb, then the last deep visible ICL was in October. See the chart. Currently I have this marked as 3 intermediate cycles. The current one would be 8 months though, if that was not an ICL in February. Could we have 3 long daily cycles instead of the short day 25 daily cycles that we’ve been counting? And if so, let me draw that for you…
.
This is the time period from the OCT 2023 ICL to now. I have changed it to longer daily cycles with 1/2 cycle lows:
.
You now see 3 long daily cycles instead of the shorter ’25 day daily cycles’ that we’ve been counting. That would now place us on the 4th daily cycle ‘double top’ and I said in my report that if we see a sharp sell off into the Fed Mtg, it could be an ICL. THIS IS WHAT I WAS SEEING AS POSSIBLY THE CYCLE SET UP. If so, we would be seeing a long 8 month intermediate Cycle, possibly ending at the Fed Mtg.
.
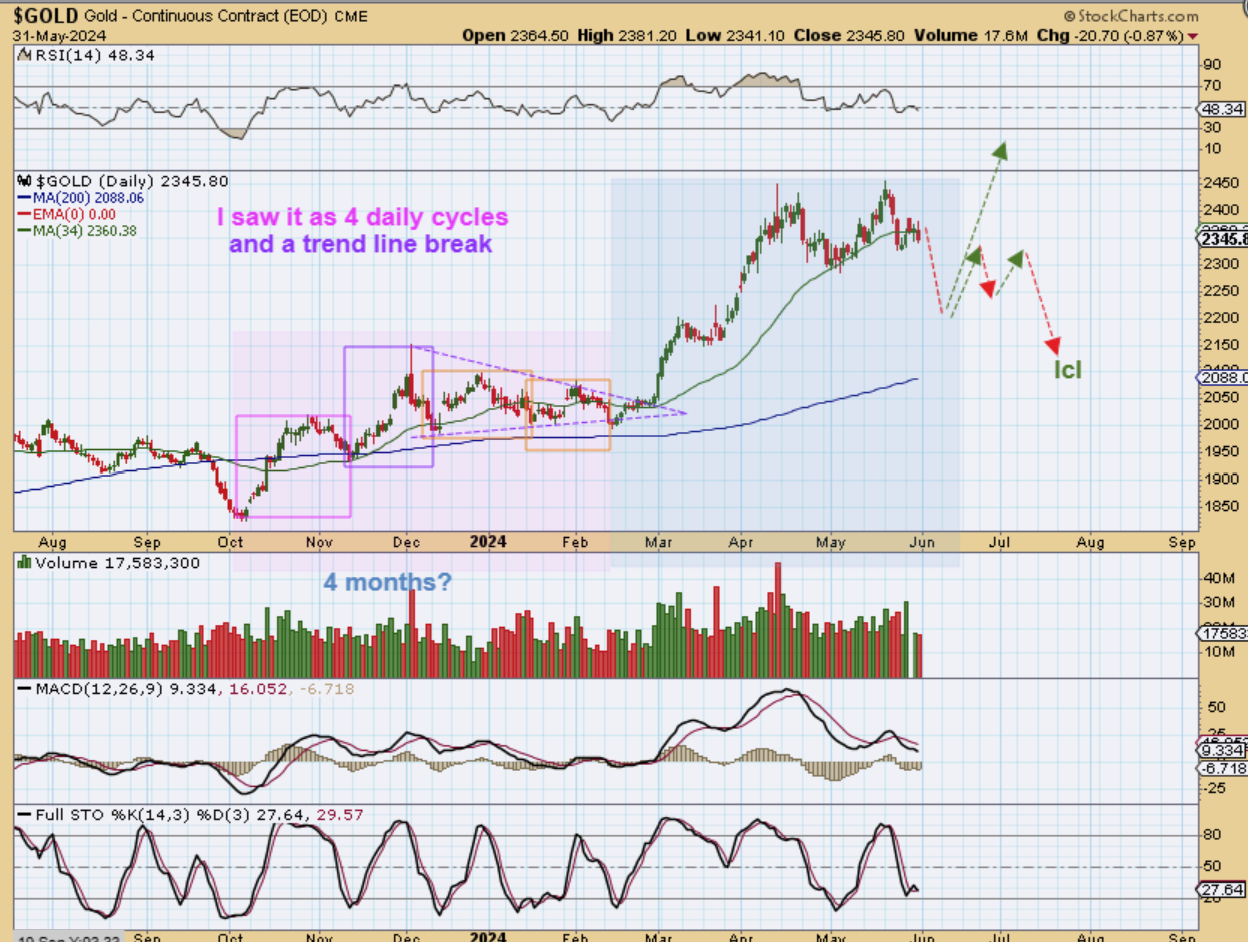
GOLD CYCLES – Back to the original set up for Gold, This is how we were viewing Gold all along.
The big question really is: “Was that an ICL in February?” It didn’t break the 2nd daily cycle low and I guess that it really doesn’t have to, and now I see that this sideways chop in the 3rd & 4th daily cycle helped to form a triangle by running a sideways correction. IF HIS COUNT STANDS, we would likely see another daily cycle and the drop could look as prolonged as what I have drawn here. A July ICL. A Tag of the 200sma? And then I looked at the weekly chart…
..
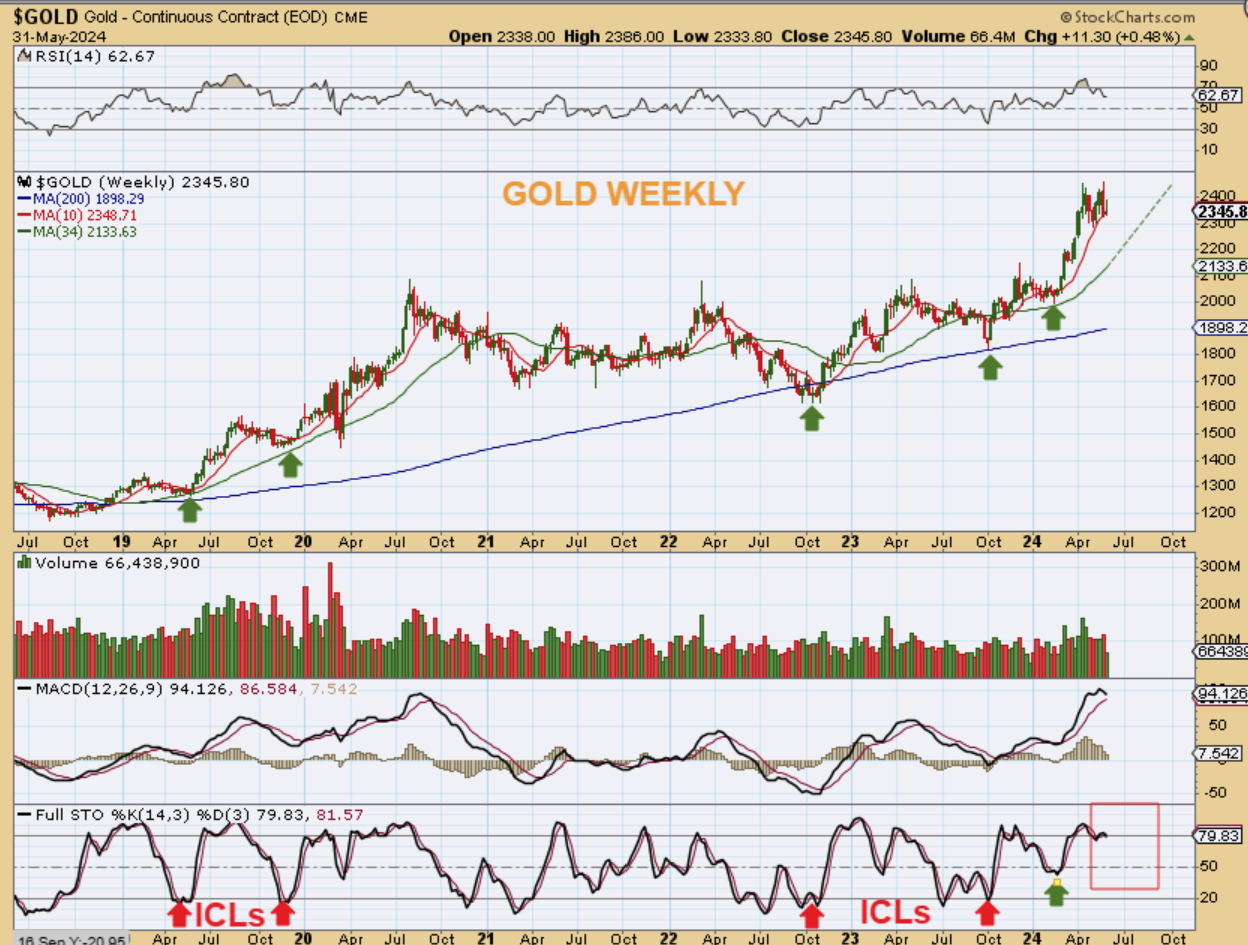
GOLD WEEKLY – So next I looked at the weekly chart and to be honest, this really looks like it needs to pullback for a month or so. We have RSI divergence at the highs, but more than that, past ICLs dropped made it down to the 50 mark or often 20 mark (The bottom) of the stochastics box. See the chart: We remain overbought and at the highs. A drop would reset sentiment and offer another entry, maybe in July.
.
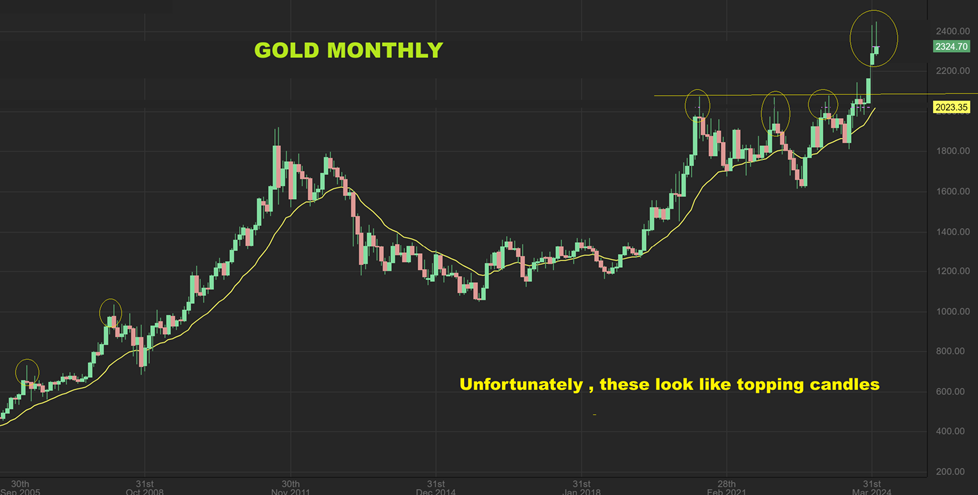
GOLD MONTHLY – Those are now 2 monthly reversal candles at the highs. This should help us to see that a drop is more likely than not.
.
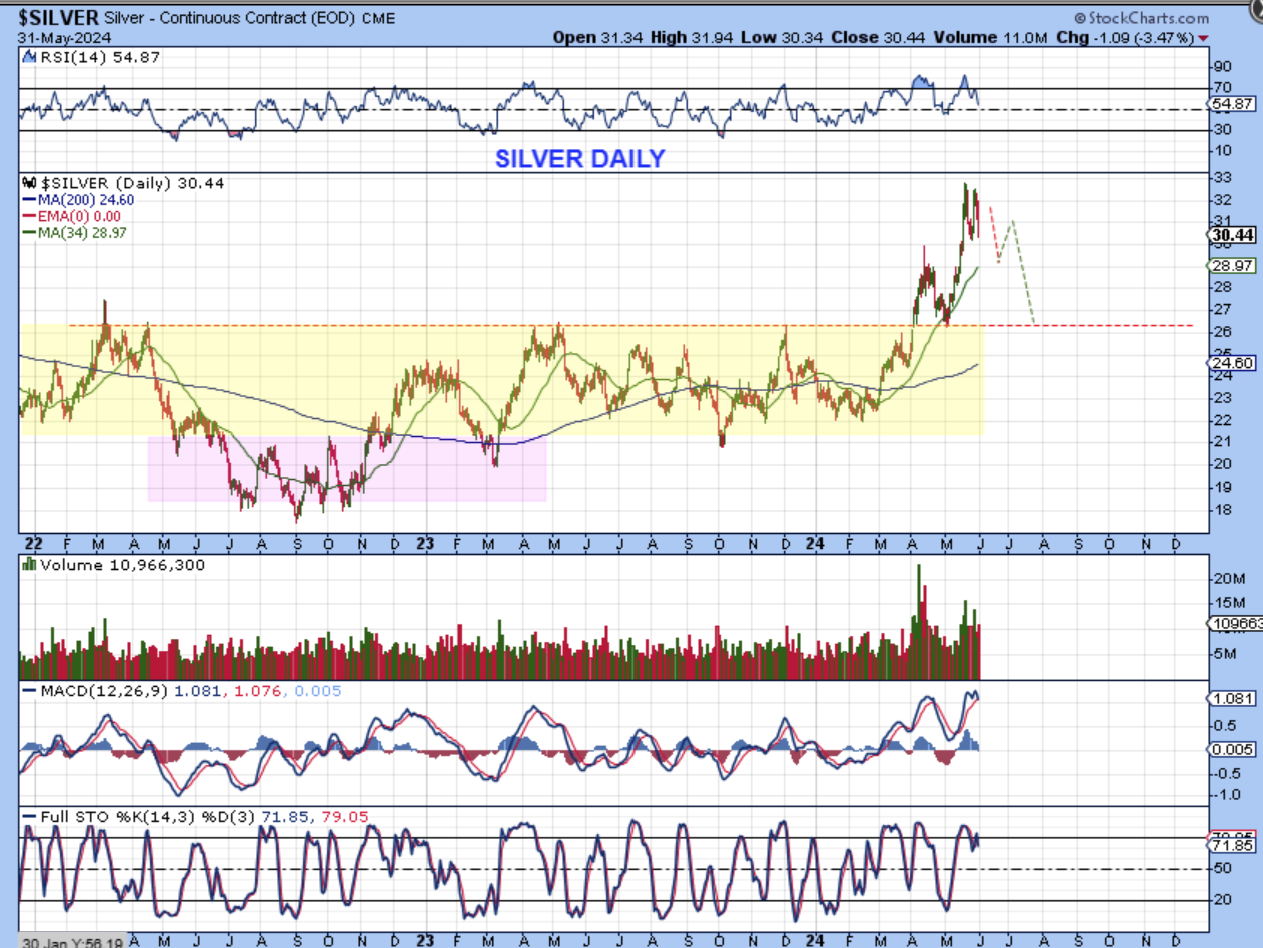
SILVER DAILY – I’ve drawn Silver dropping back to the $26-$27 area, but it does not have to drop down that far. I used the path to the 200sma and back test as a target, but the back test already took place and this could chop sideways and hold up better than drawn here (but when Silver moves, it DOES move quickly in either direction).
.
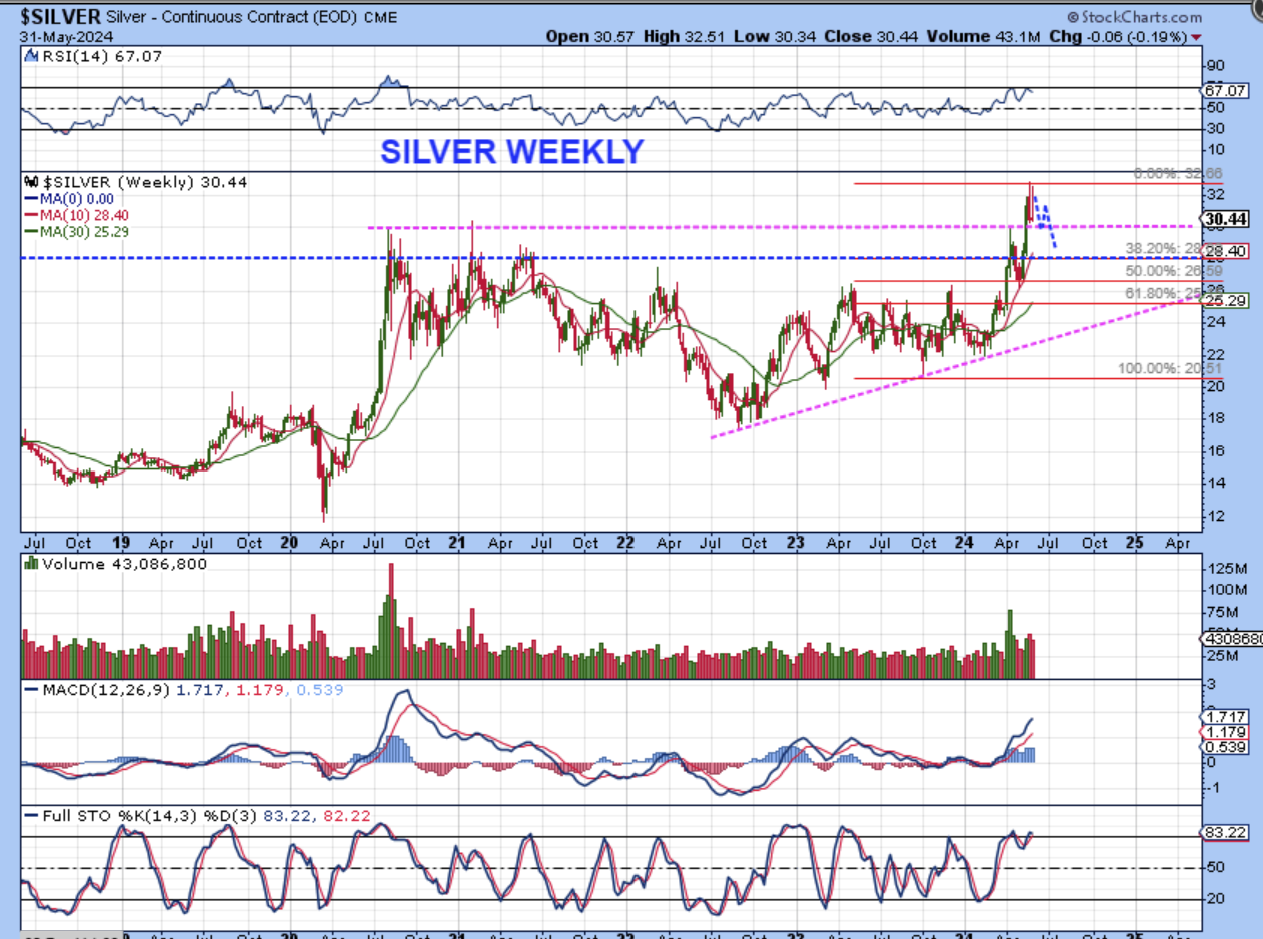
SILVER WEEKLY – We really need to allow some more time to better Guage how deeply Silver will drop (or not), but it will be an ICL drop and it is best to just expect a deeper drop. It also may not start until after the Fed Mtg(?), so we could see silver bounce and then roll over later, but an ICL will come due. $28 looks reasonable, but again, $26.50 is in the Fib zone too. I like to expect the worst and then just be ready to re-enter wherever the lows come in.
.
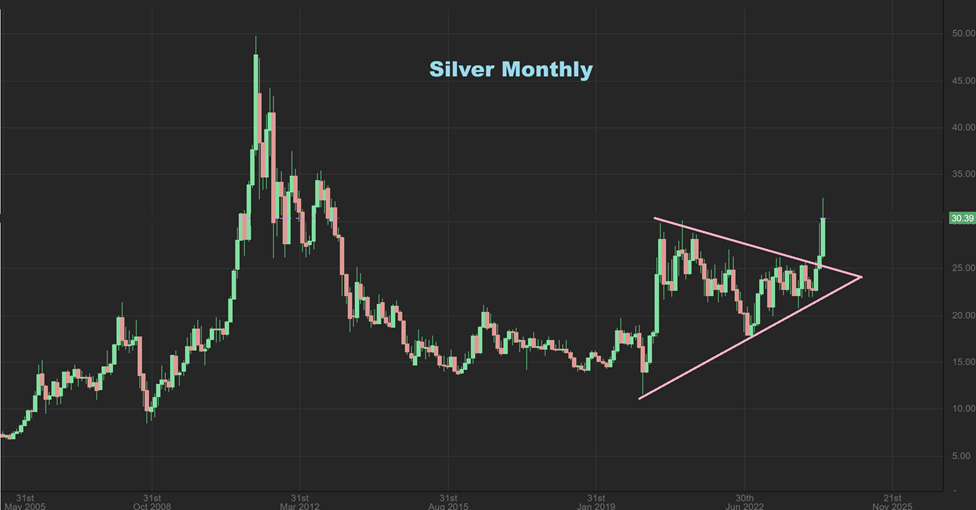
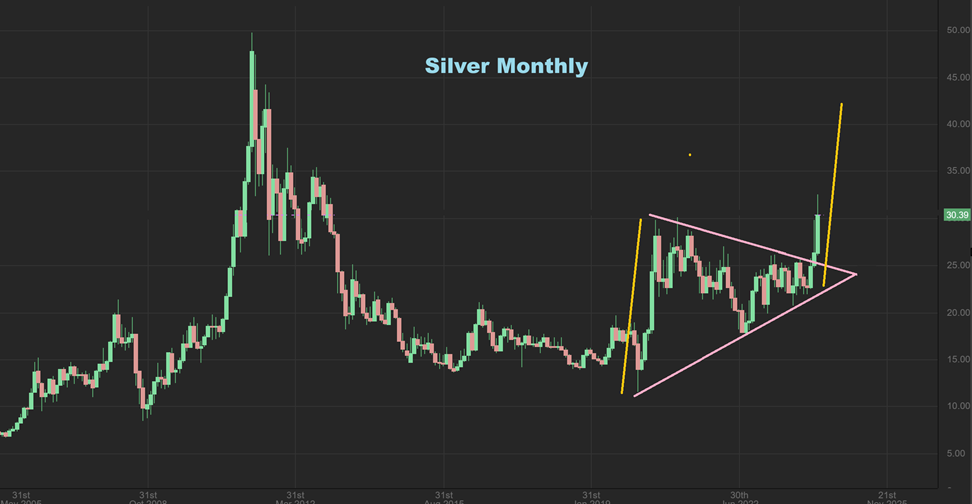
SILVER MONTHLY – The monthly chart simply shows that massive consolidation and then a breakout. The good news is that…
.
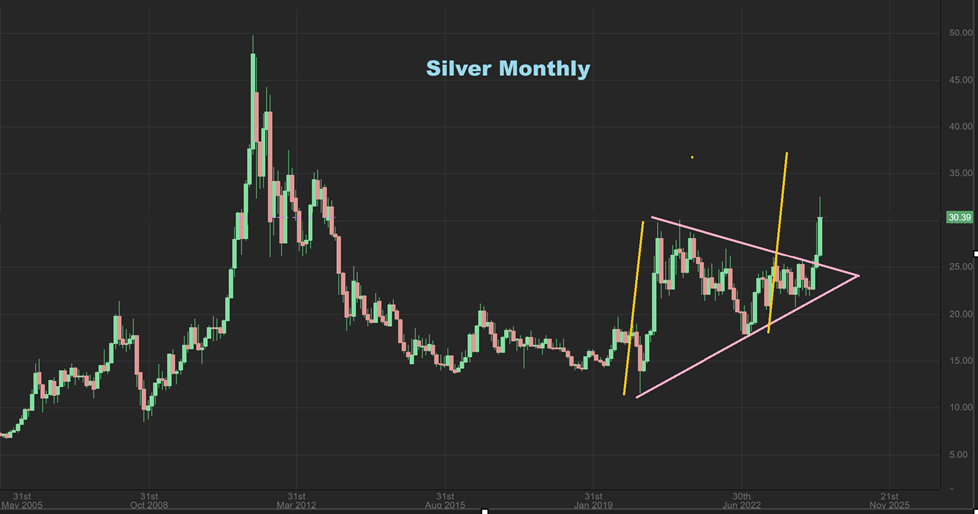
SILVER MONTHLY – If I put a measured move at the lows of the consolidation, the move has further to run and these often do extend, but even better than that is…
.
SILVER MONTHLY -Placing that measured move at the apex gives as a run toward the prior highs, and these DO tend to extend, so $50 is very possible. These are monthly charts , so a 1 or 2 month pause (ICL) does not change the outlook.
.
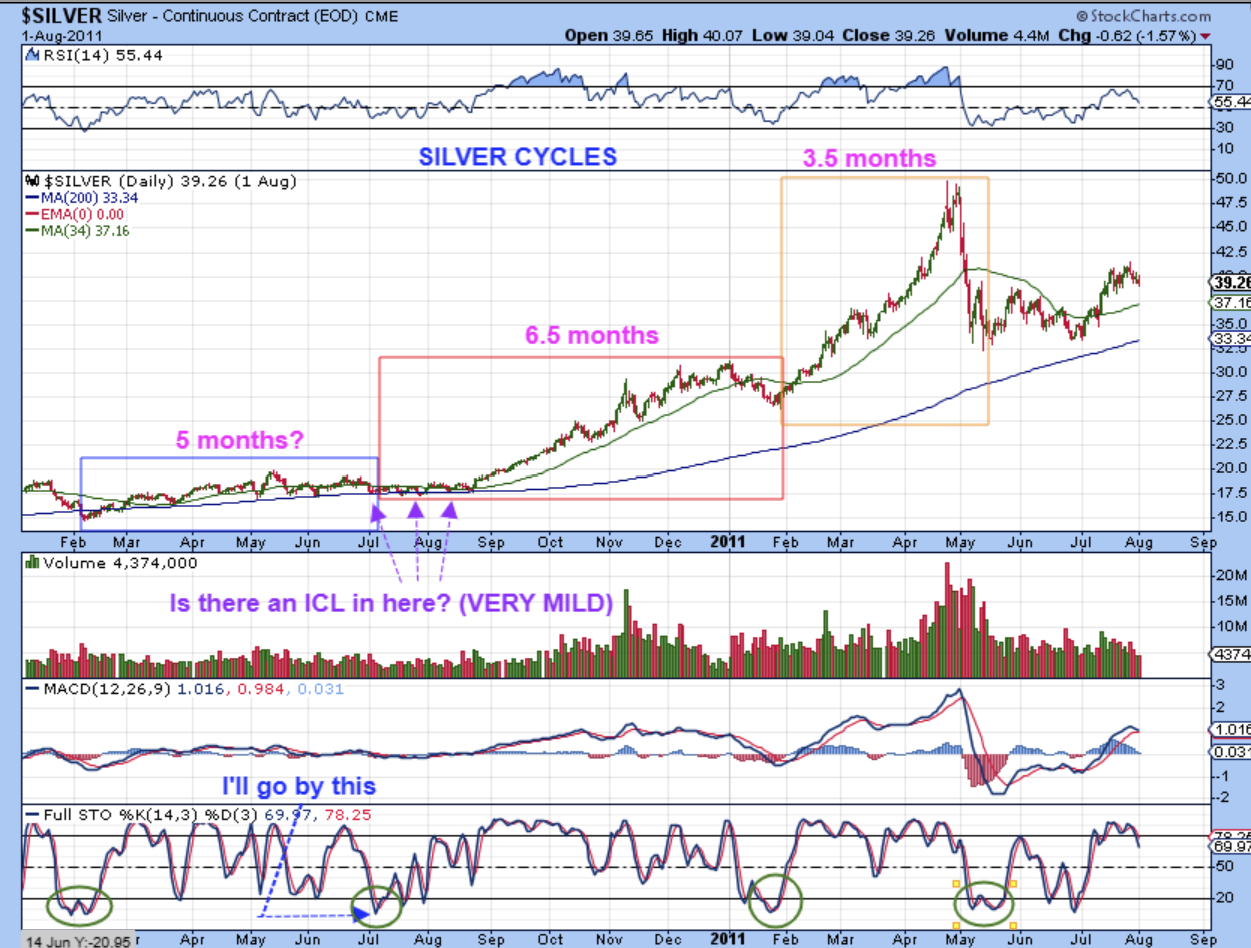
The last Run to $50: The SILVER 2011 BULL RUN & CYCLES – I noticed with Silver the same situation where an ICL was hardly visible during the bullish sideways consolidation. Once the Bull started to run to new highs, it put in a Feb 2011 ICL, and then the ramp up was spectacular. We may get a similar ICL drop and then a ramp up in 2024 too.
.
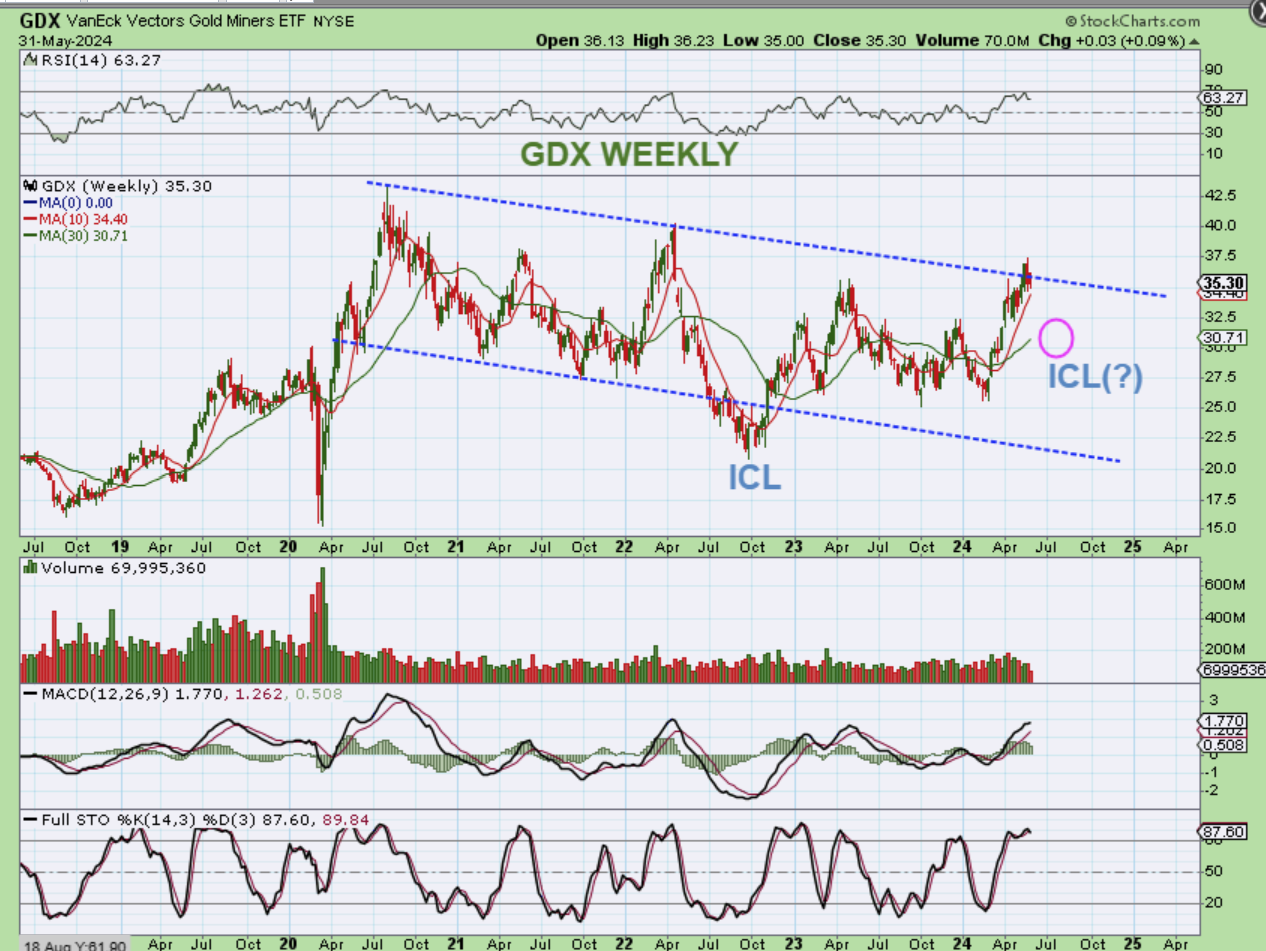
GDX WEEKLY: To be honest, when I looked at the Daily, Weekly, and Monthly chart of the GDX, it all looked the same. A dip is likely, but the Miners are somewhat close to the highs and we just need to assume that when Gold dips into an ICL, Miners will follow. Individual miners may act differently, but I am expecting a dip overall and a buying opportunity possibly in July.
.
So that is where we stand at the end of the week and the end of May. A strong reversal Friday for the General Markest could follow through next week, but I want to stay cautious heading into the Fed. I will continue to cover the markets and their movement with the midweek reports, and we will be heading into the Fed Mtg in 8 days, so anything could happen between now and then. Bitcoin has been choppy, and I will cover that below.
.
Enjoy the rest of your weekend!
.
~ALEX
,.
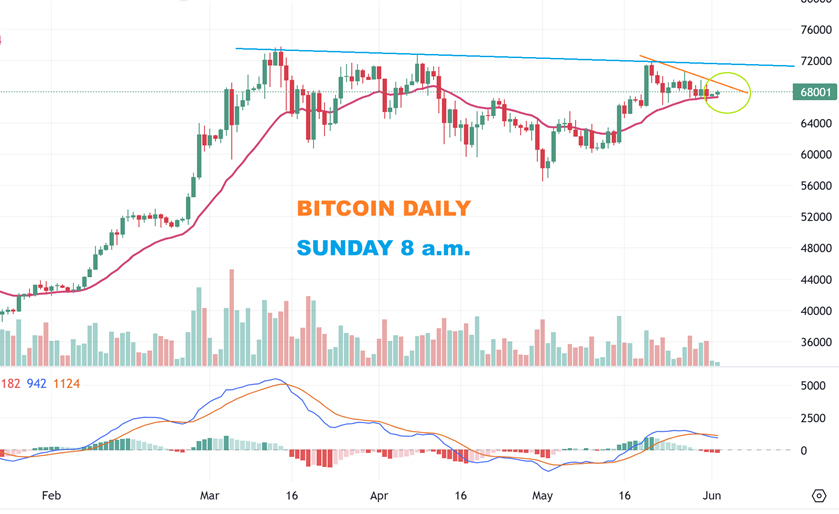
BITCOIN: I said on Friday…
JUST TO KEEP IT SIMPLE: This is Bitcoin at 6:30 a.m. Today, and I don’t think that the Crypto related stocks will run until this breaks out. We have several pop & drops to that area lately.
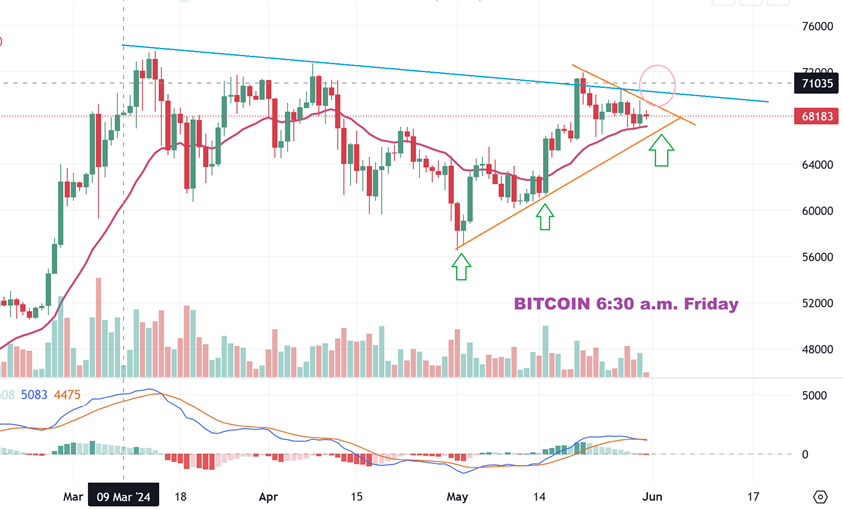
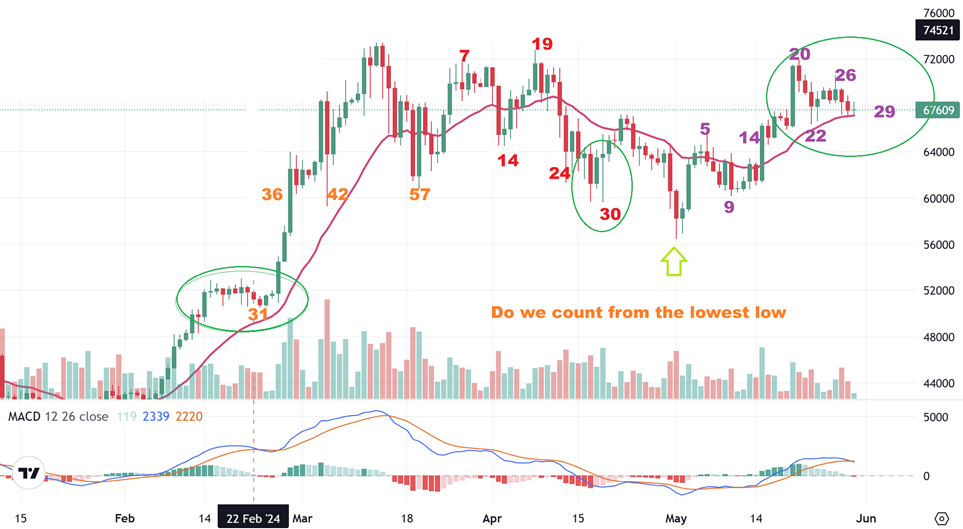
ALSO I DISCUSSED CYCLE COUNT, SINCE WE ARE LOOKING FOR A HALF CYCLE LOW AROUND DAY 30.
If I count from THE LAST VISIBLE LOW, we are on day 29 out of that lowest low, and that is the timing for a half cycle low and then we can move higher off of the 20 ema. IF I have to count from the triangle low though, it adds almost 10 days to the count, we’d ONLY be on day 20ish.
.
BITCOIN SUNDAY – So the count should be around day 30 for a half cycle low, but we are still waiting for a breakout, and then we’ll see if Bitcoin rallies to new highs or just continues to chop around for the entire 60 day cycle. The Crypto stocks are choppy, but they have been holding up rather well, so far.