
June 16th – The Weekend Report
.
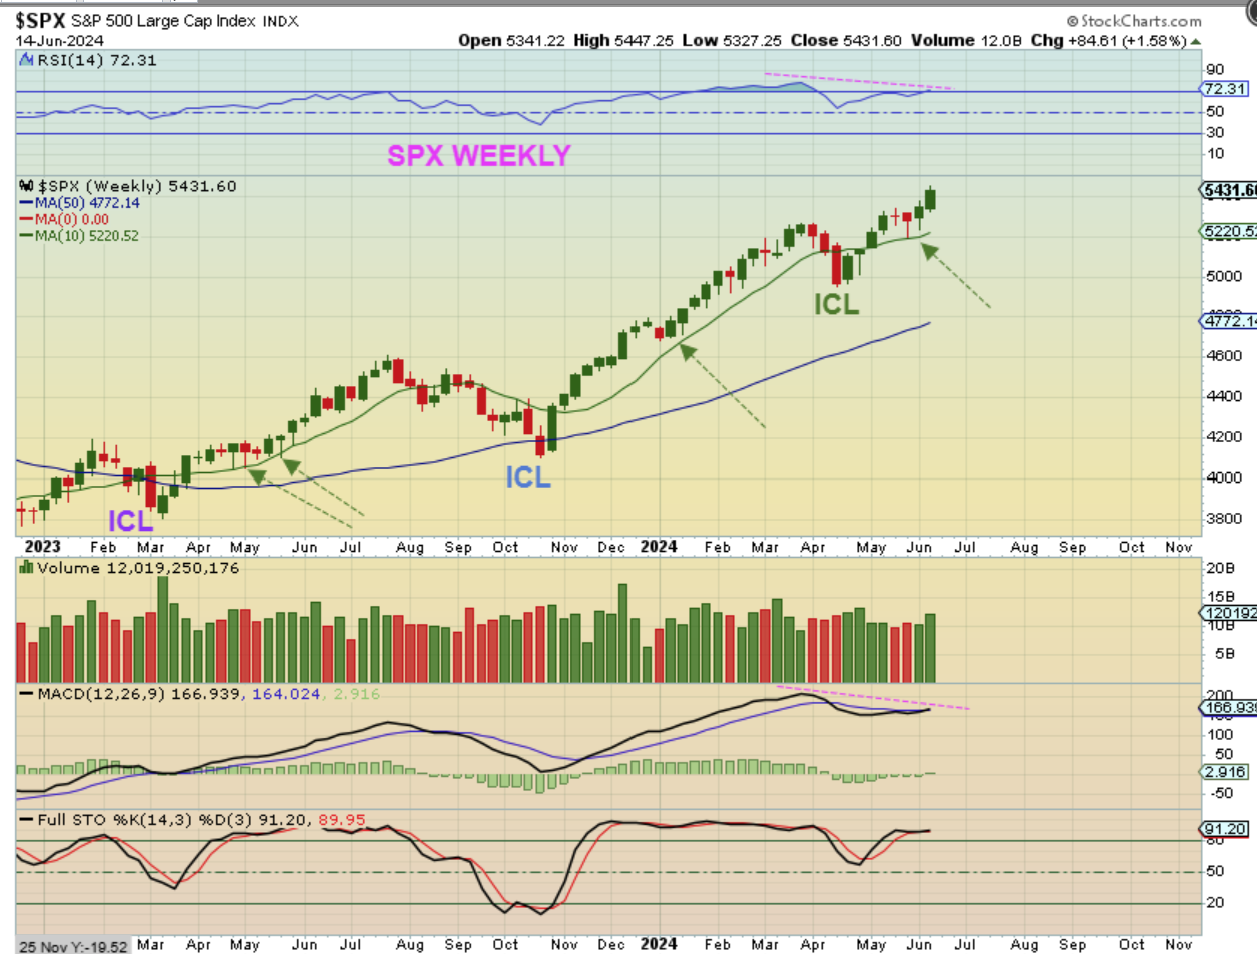
The SPX Weekly shows us that we had another nice week ( a Fed Week) For the General Markets and the Bull Run continued to new all-time highs. They like the news of a rate cut still in the works, and inflation dipping lower.
.
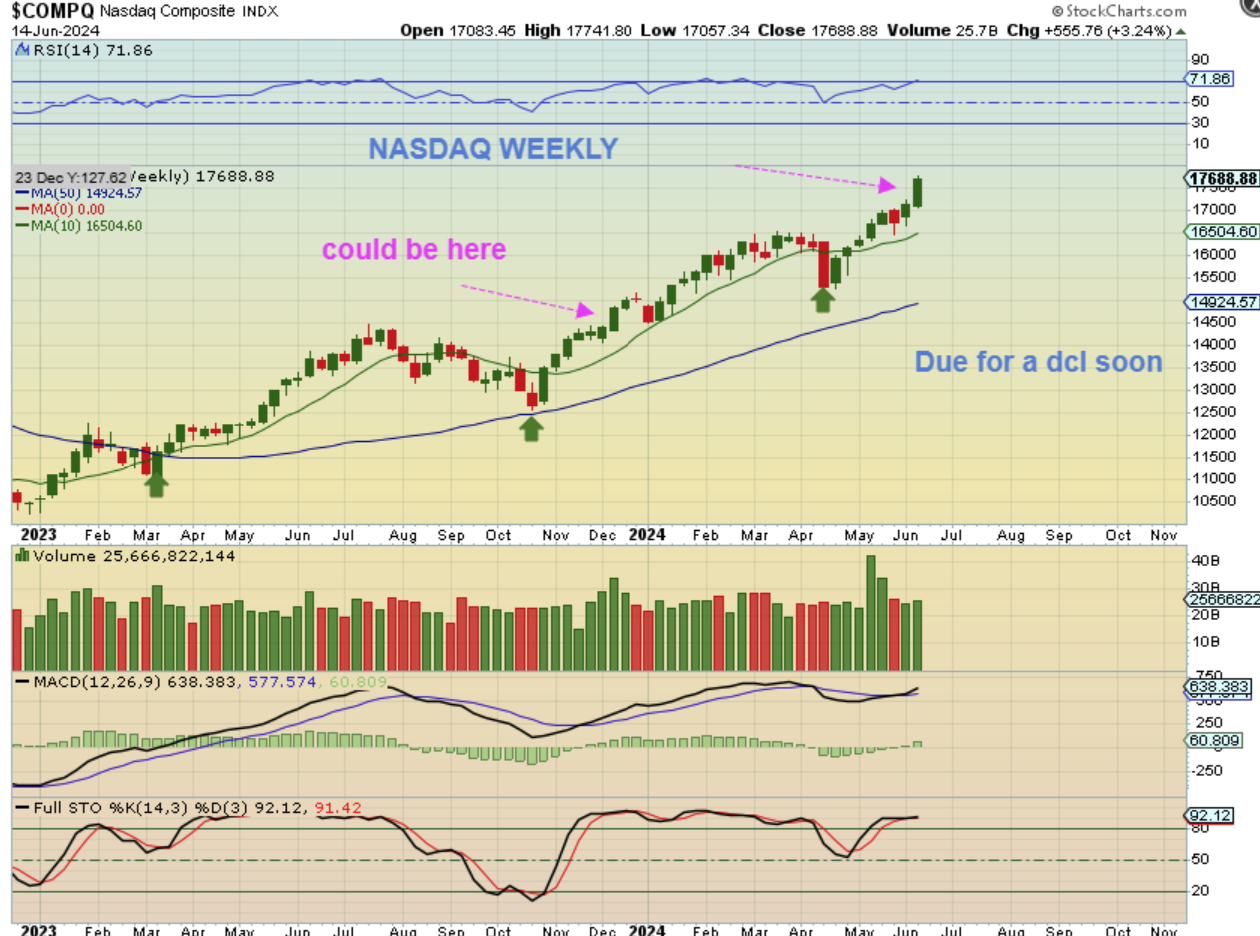
We go over to the NASDAQ WEEKLY and we see that the Tech Sector also had a great Fed Week, and APPL had a lot to do with that. So again, we have all-time highs here too. Coming out of the ICL , SPXL, TQQQ, and SOXL have made very nice gains, along with some of the stocks in these sectors.
.
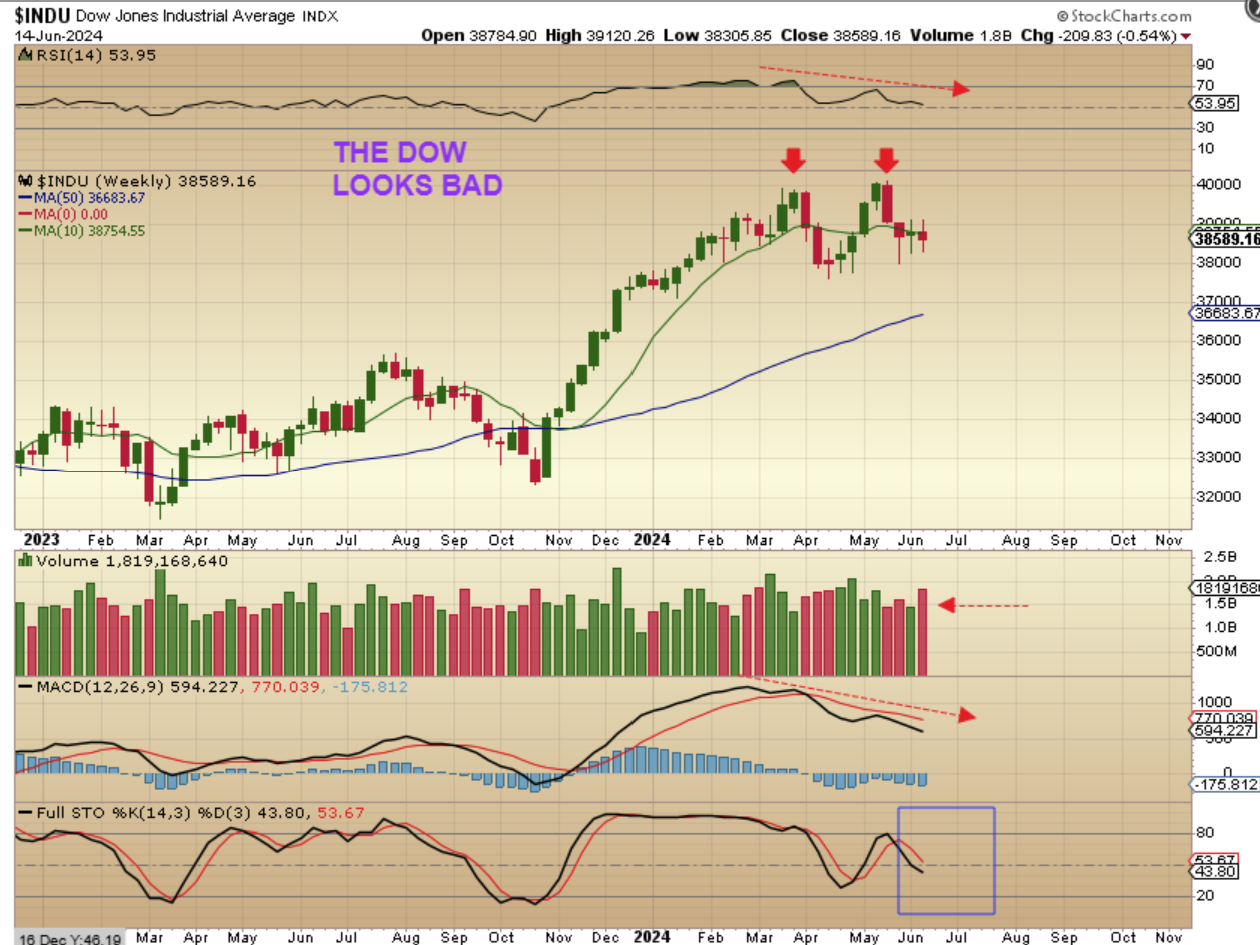
That said, The DOW JONES INDUSTRIAL AVERAGE has a double top with divergence, it had a red week, and looks ready to continue to limp along or sell down even deeper. We keep this in mind and keep an eye on things for the second daily cycle in the SPX and NASDAQ, to see if the weakness becomes contagious with the Dow Theory in play.
.
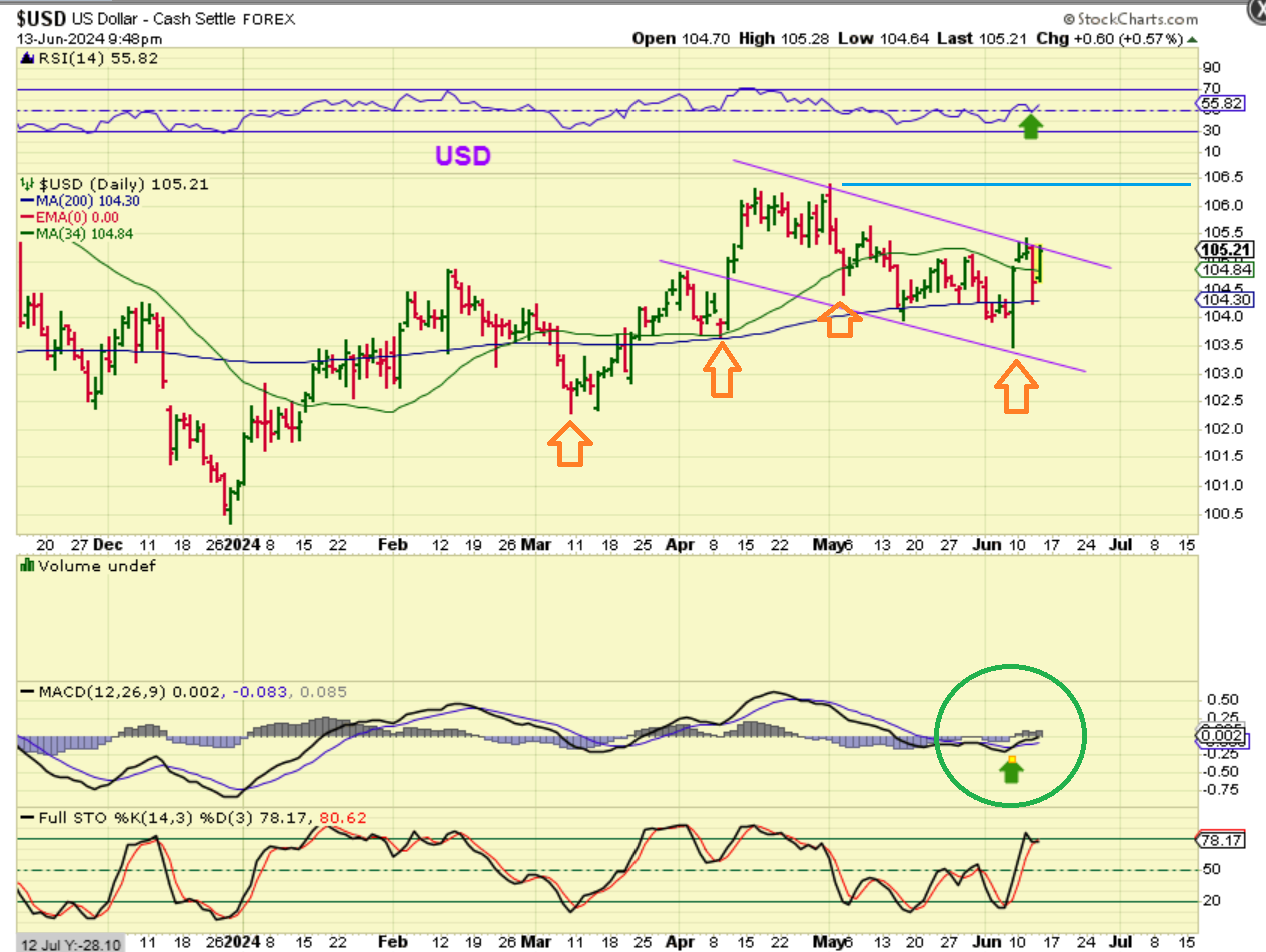
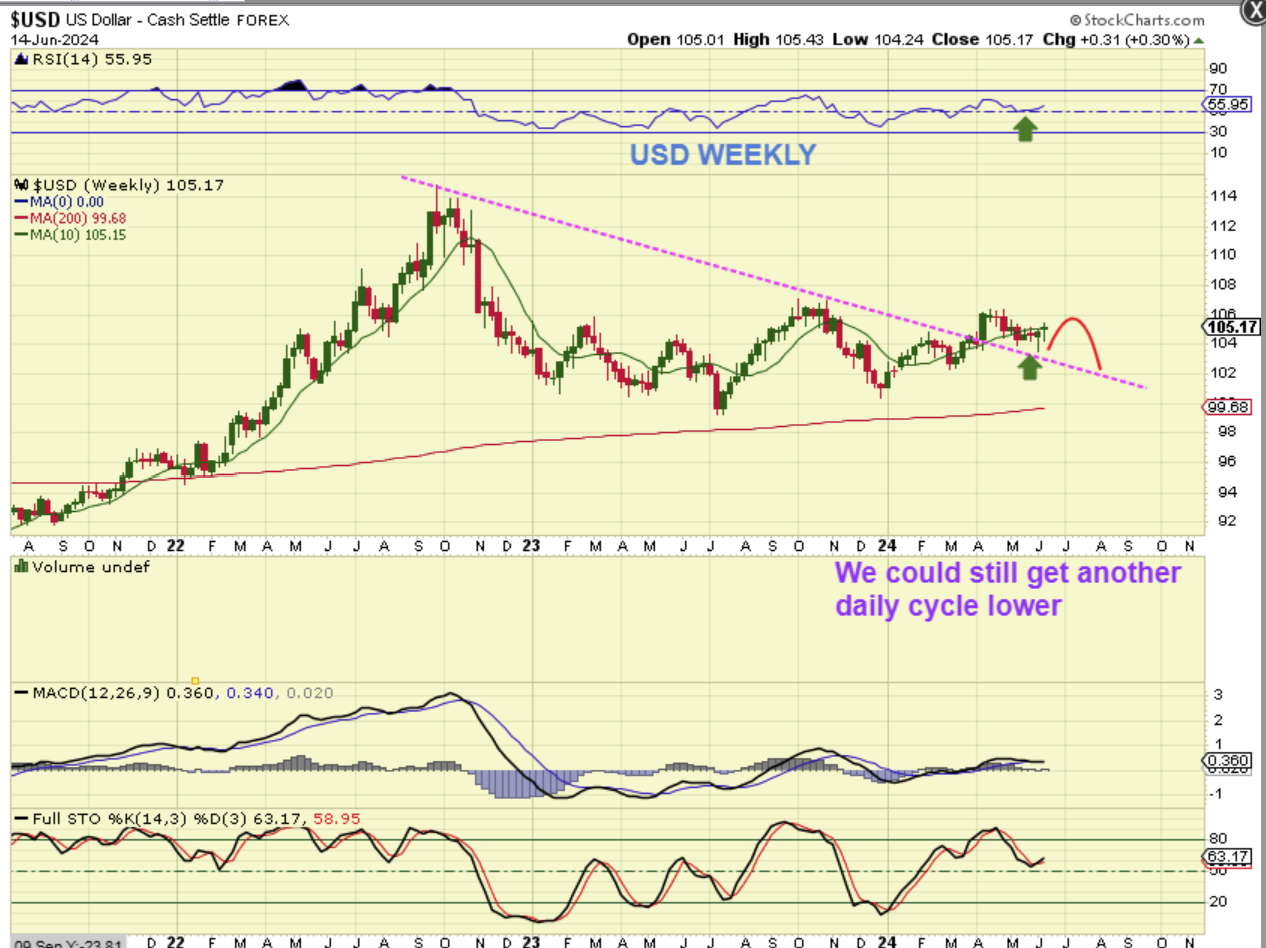
ON FRIDAY I SAID THIS FOR THE USD DAILY: And by the way, by the close on Friday the USD was down 2 cents.
.
The USD moved higher on Thursday and it did close above the 34 sma (& 50sma not shown), so this is showing strength and is likely a dcl with that new low strong reversal 5 days ago. Today would be day 5. If we break above the blue line, the USD would appear to have an ICL, and I wasn’t quite expecting that yet, but it seems that the USD is gaining strength.
.
USD WEEKLY: So the USD Daily did not break even higher, but on the weekly we did see it break a long term downtrend. Another daily cycle lower could back test the trendline, but we’ll just have to let this play out further to see if we have weakness and another daily cycle lower, or strength and more of a push higher.
.
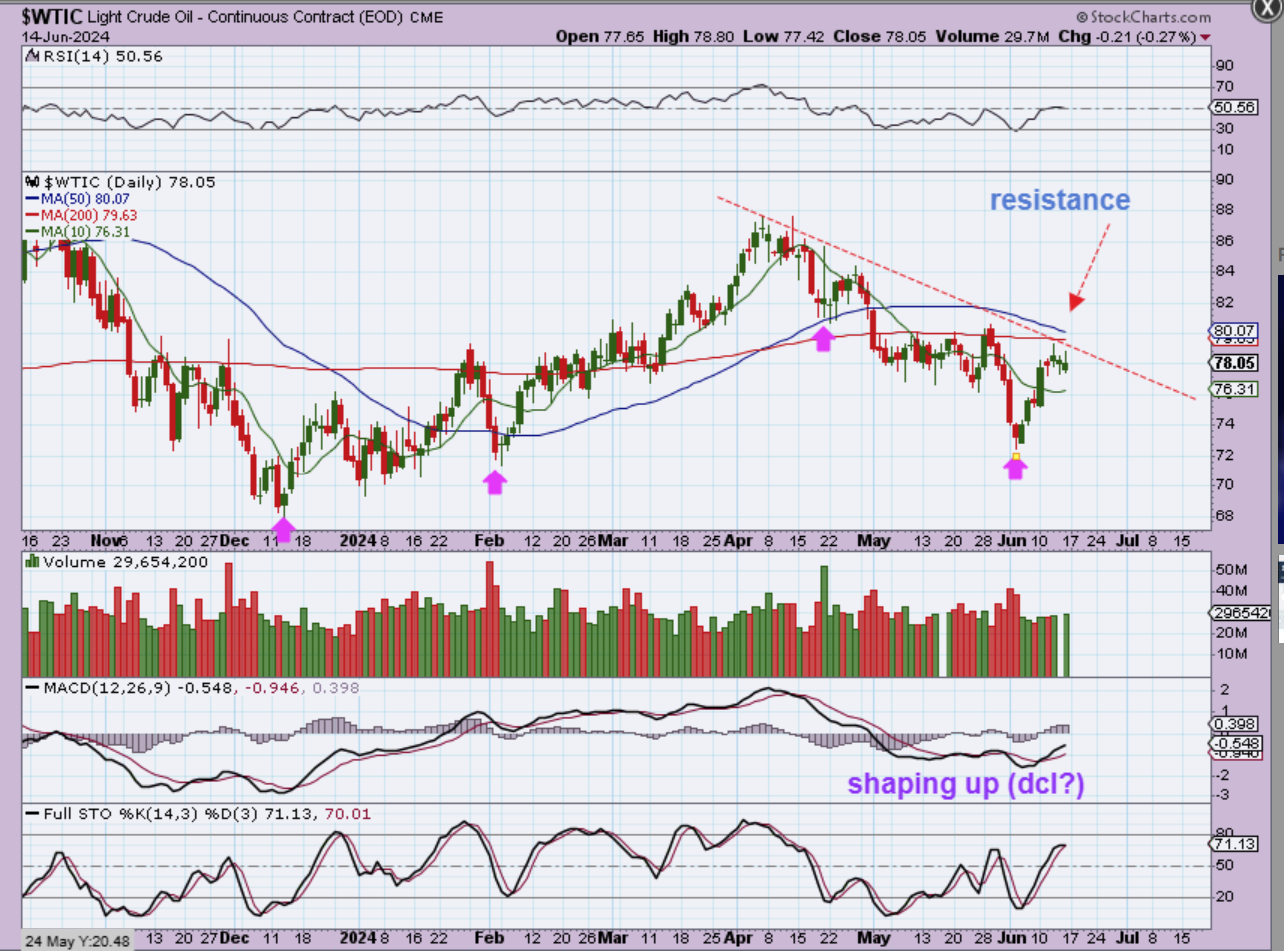
WTIC DAILY – Oil is still under that resistance area on the daily chart, so this daily cycle may peak right here as L.T. and roll over into an ICL drop.
.
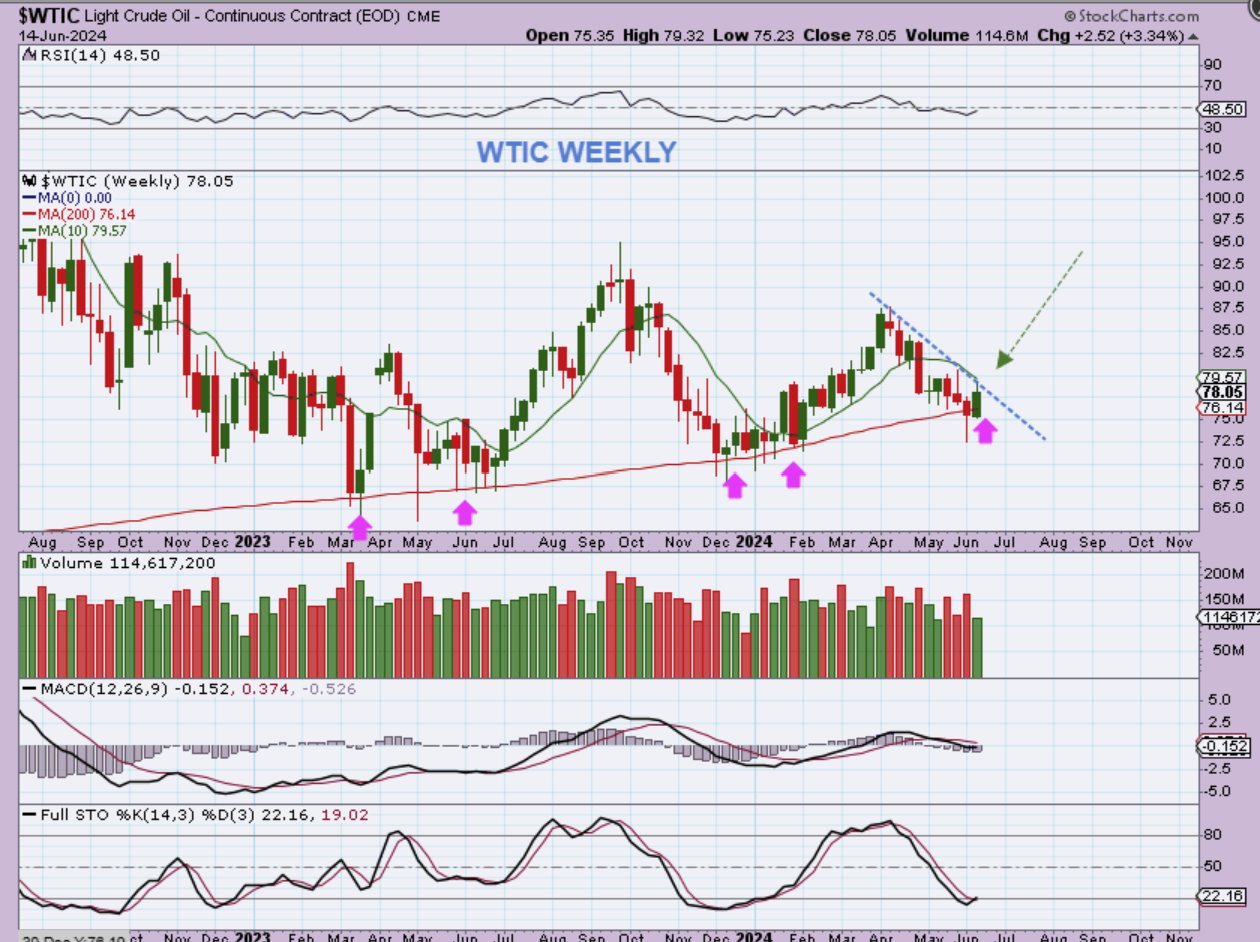
The Weekly WTIC Chart shows Oil at a support area though. A push higher above the 10 week ma & downtrend line would signal that an ICL already took place with that weekly reversal candle & dcl at the recent low.
.
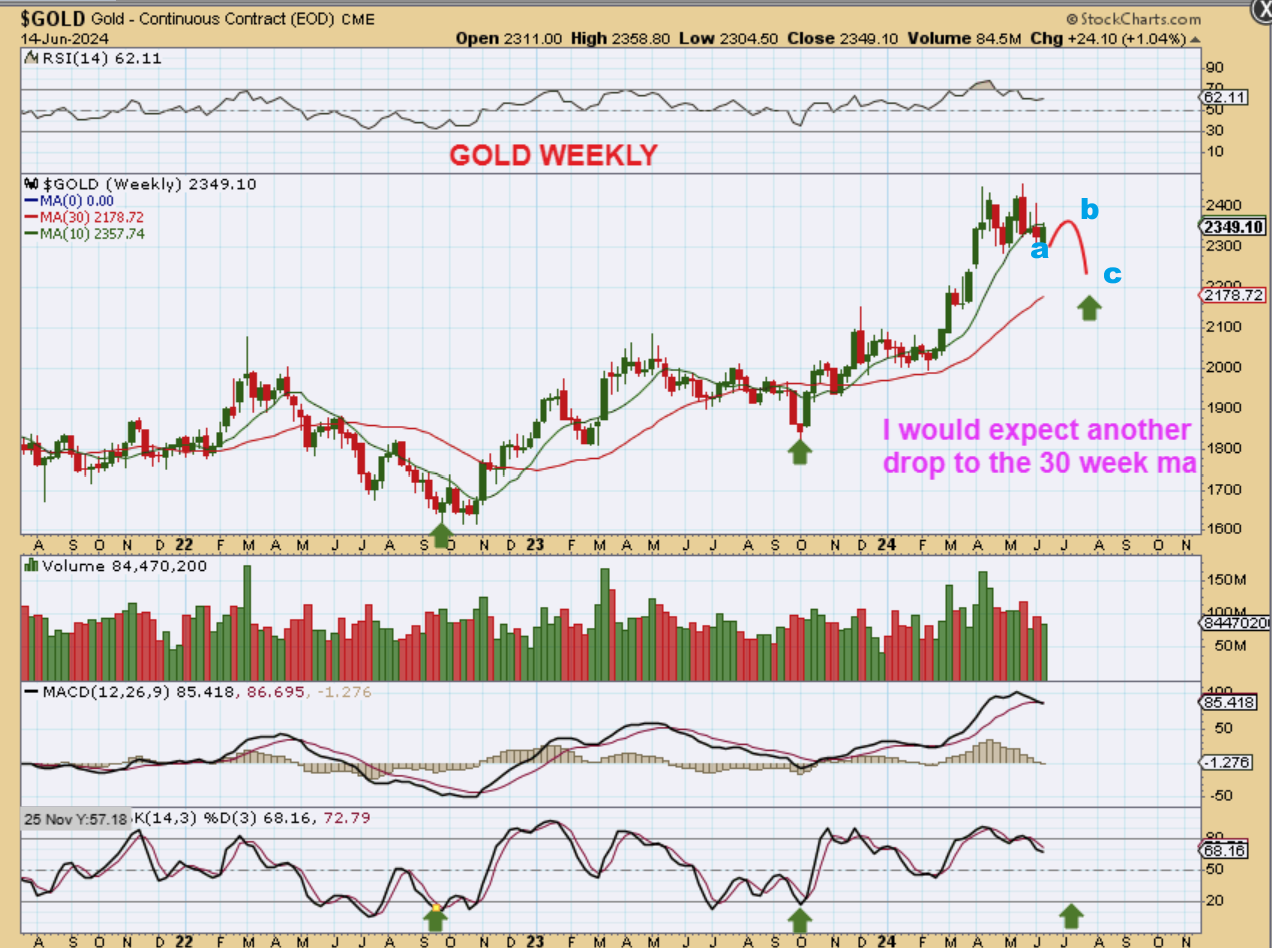
GOLD has been choppy and has had big weekly drops, but it also had some big weekly moves higher. So far the move has held up in a box near the highs by some buying & selling too. I do expect a selloff in the 4th daily cycle and I have drawn what could become the a-b-c drop into an ICL. We want to buy that ICL, since it should bring about a continuation of the breakout and run in precious metals.
.
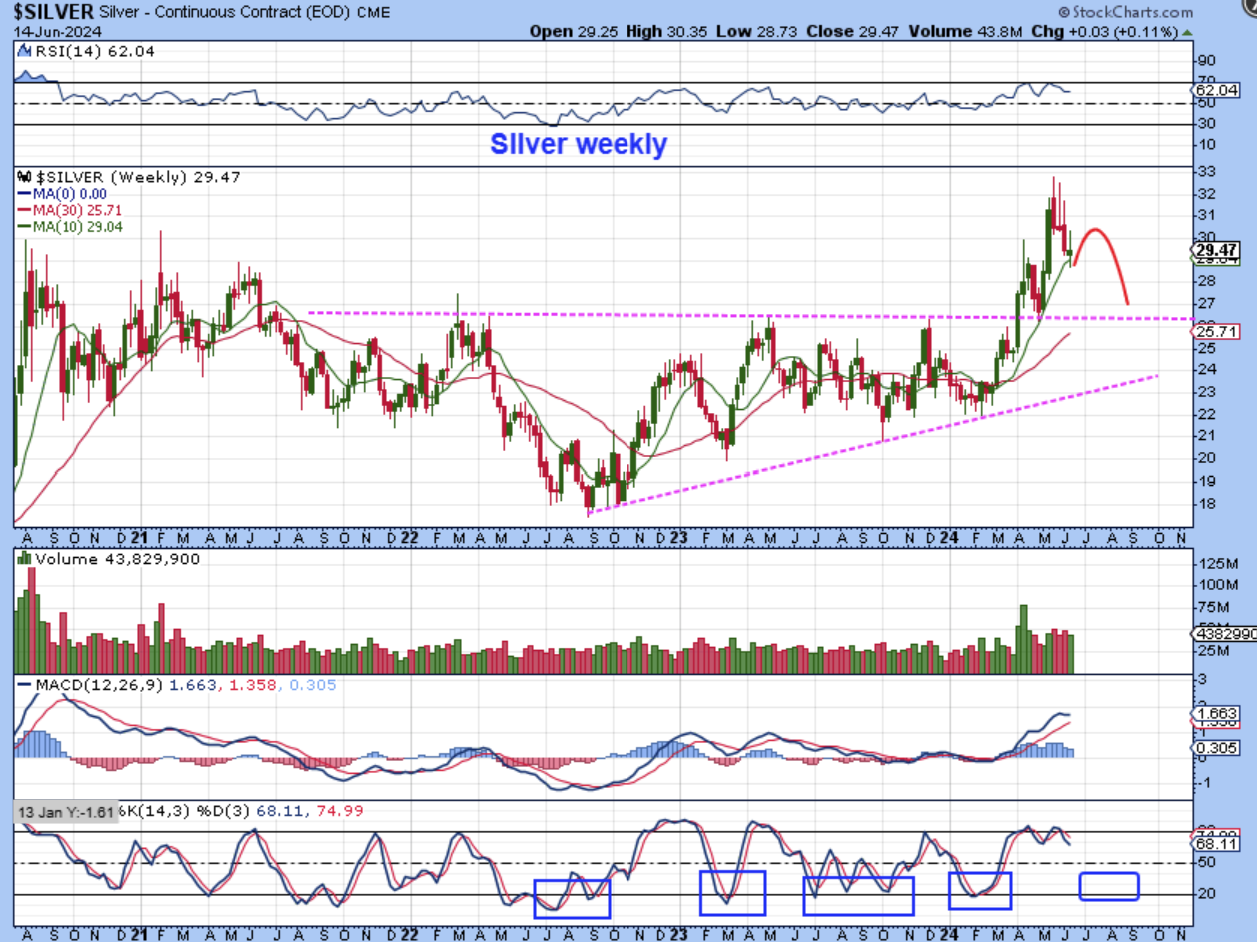
SILVER should also be showing us the intermediate ‘peak’ and now it will continue to drop down into an ICL. That will be an excellent place to go long.
.
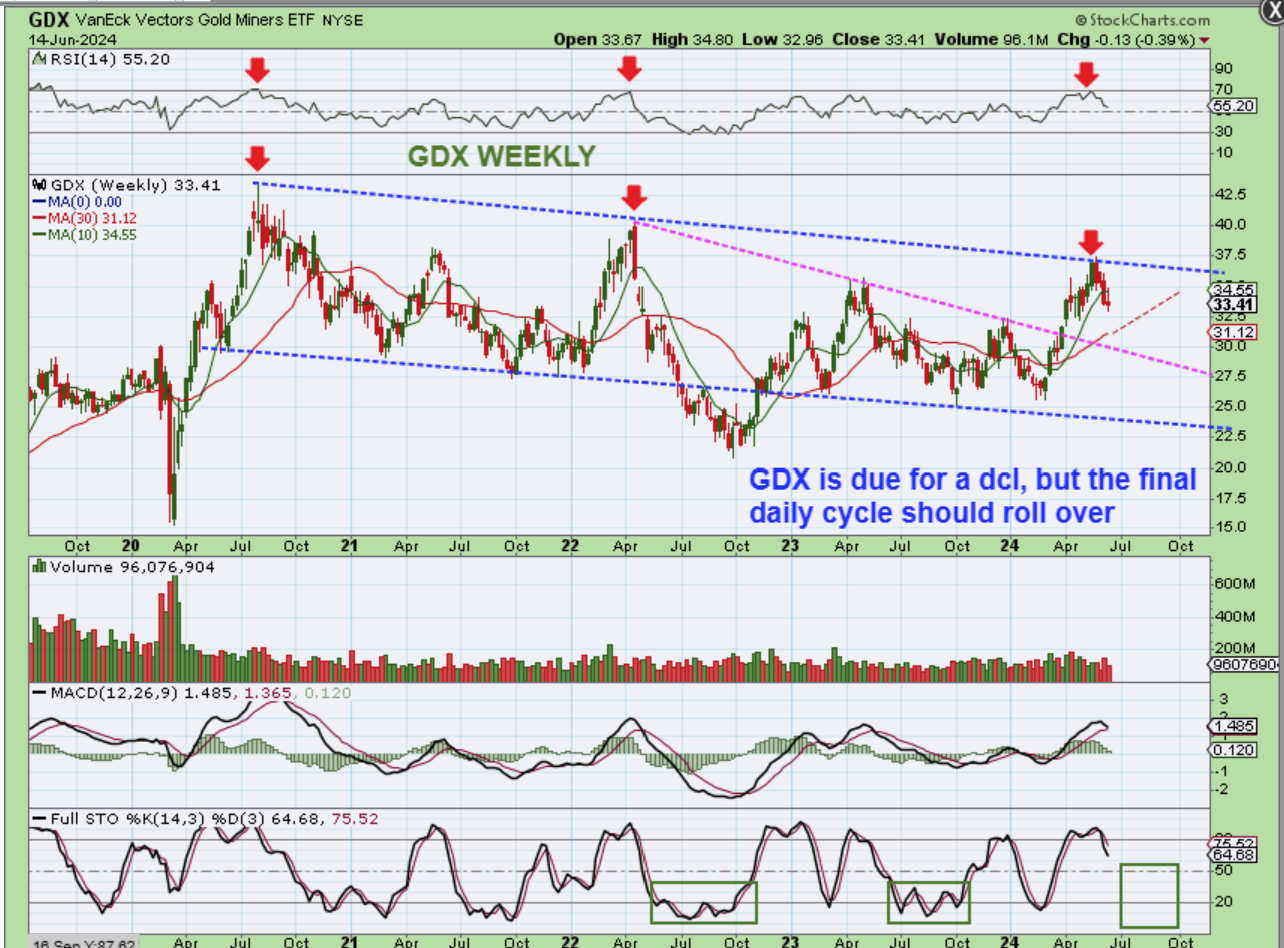
GDX – The Miners also peaked and I drew something similar to this last week to show the resistance overhead too. We need to allow ‘time’ to bring the price of the miners down to where they will put in their next ICL. That will be a major buy for another run higher and a breakout & run from this pattern.
.
So the Bulls remained in charge with the week of the Fed again, even though they have pushed off Rate Cuts. In early January there were talks of 3 cuts in 2024, but now its down to probably just 1 cut, and yet the markets continue to rally onward and upward. We are due for dips and drops into a dcl (in some cases it could be the ICL) and we want to buy those dips, especially if we get that ICL in the Precious Metals. Another rally to all-time highs should follow and the miners could finally break out and really pick up speed when they do. I’ll cover Bitcoin below, have a great weekend!
.
~ALEX
.
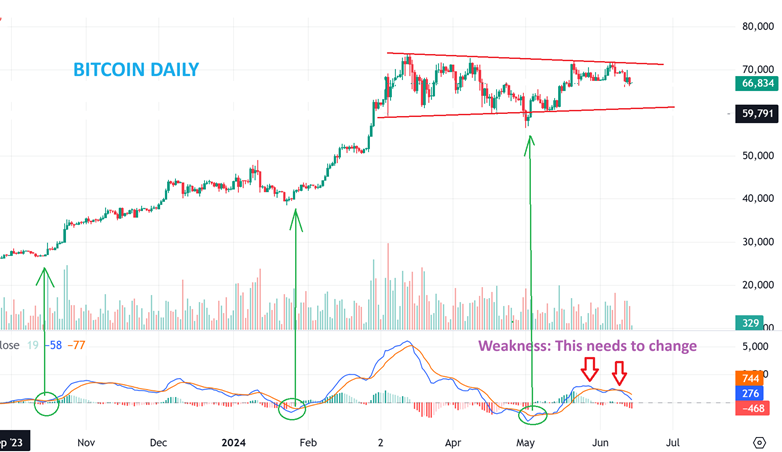
In Fridays report I discussed this for BITCOIN –
1. You can clearly see the MACD marking the lows as a nice buy point 3 times on this chart.
2. Right now The MACD is showing weakness at the highs of this consolidation. That CAN change with a breakout, but we would need to start seeing a move higher shortly, because we are trading 30 plus days out of the low. My thoughts on this becoming a long sideways intermediate cycle consolidation could fulfill, with a dip into day 60 eventually taking place.
3. Crypto miners are ‘holding up’, but so is Bitcoin as it trades near the highs.
4. If it breaks out, miners will break out, but if it doesn’t and drops into day 60? Miners will sell down too, and they can really move, so a drop to the lows of this consolidation would not even be one that I want to ride in a basket. We need a breakout soon here.
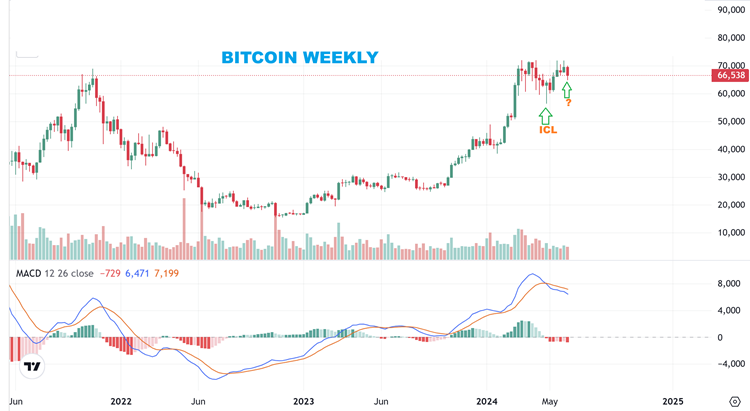
BITCOIN WEEKLY– So what I’m seeing here on the weekly chart is a reversal from the first ell off, and that is the ICL that we bought. Now I expected a ‘dip’ into roughly a day 30 1/2 cycle low, and then a bounce and eventually another day 60 low (Could be a higher low in an uptrend). We could start higher from here, as mentioned in prior reports, or we could see one big long consolidation into day 60. I will draw both ideas on the next daily chart.
BITCOIN DAILY – So I just want to be clear that for me, it is ‘Do – or – Die’ Time. We should see the next run higher from this mid-point area with the count now near the 30 day mark, or else this is likely to become one long consolidation and the day 60 (ish) low will come in at the lows, as seen on my chart.
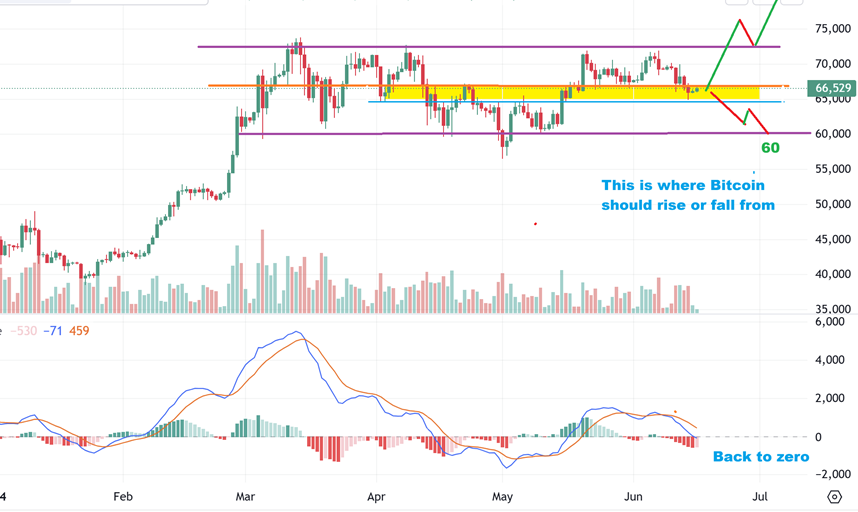
.
And again, this weekly chart that I had above is a weekly reversal candle forming and so it would be in line with a move higher now, but we’ll see if we get the follow through or not.

