
Tuesday May 7th
.
FRIDAYS REPORT:
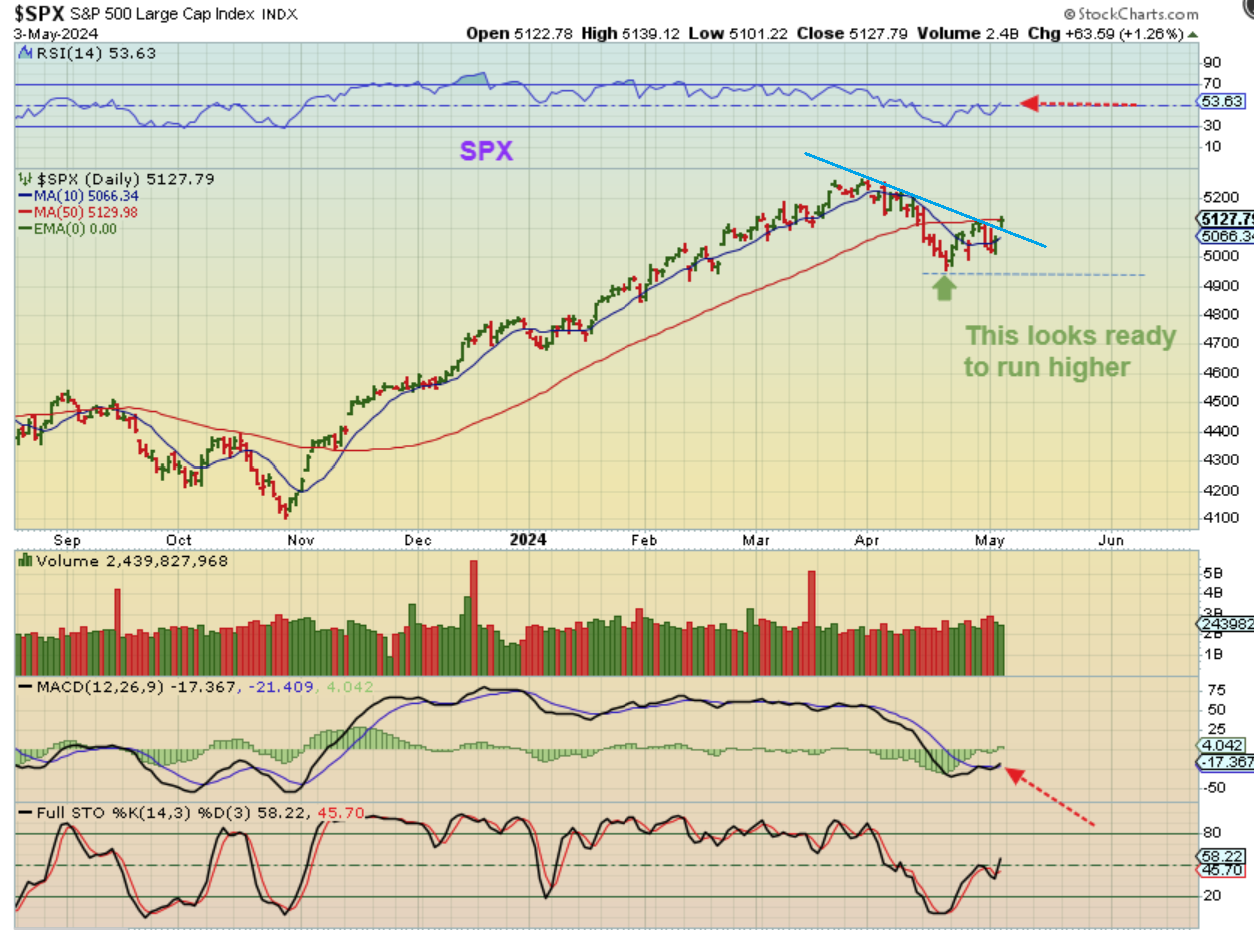
The Daily for The SPX shows us more upside right to the 50sma, and this does look like it could just go higher from here.
1. It broke the downtrend as a starter, and the MACD is crossing higher.
2. The 10sma is curling back up and it seems as though the F.O.M.C Meeting & speech have given the markets more hope when the Fed said that he doesn’t expect a rate hike next.
.
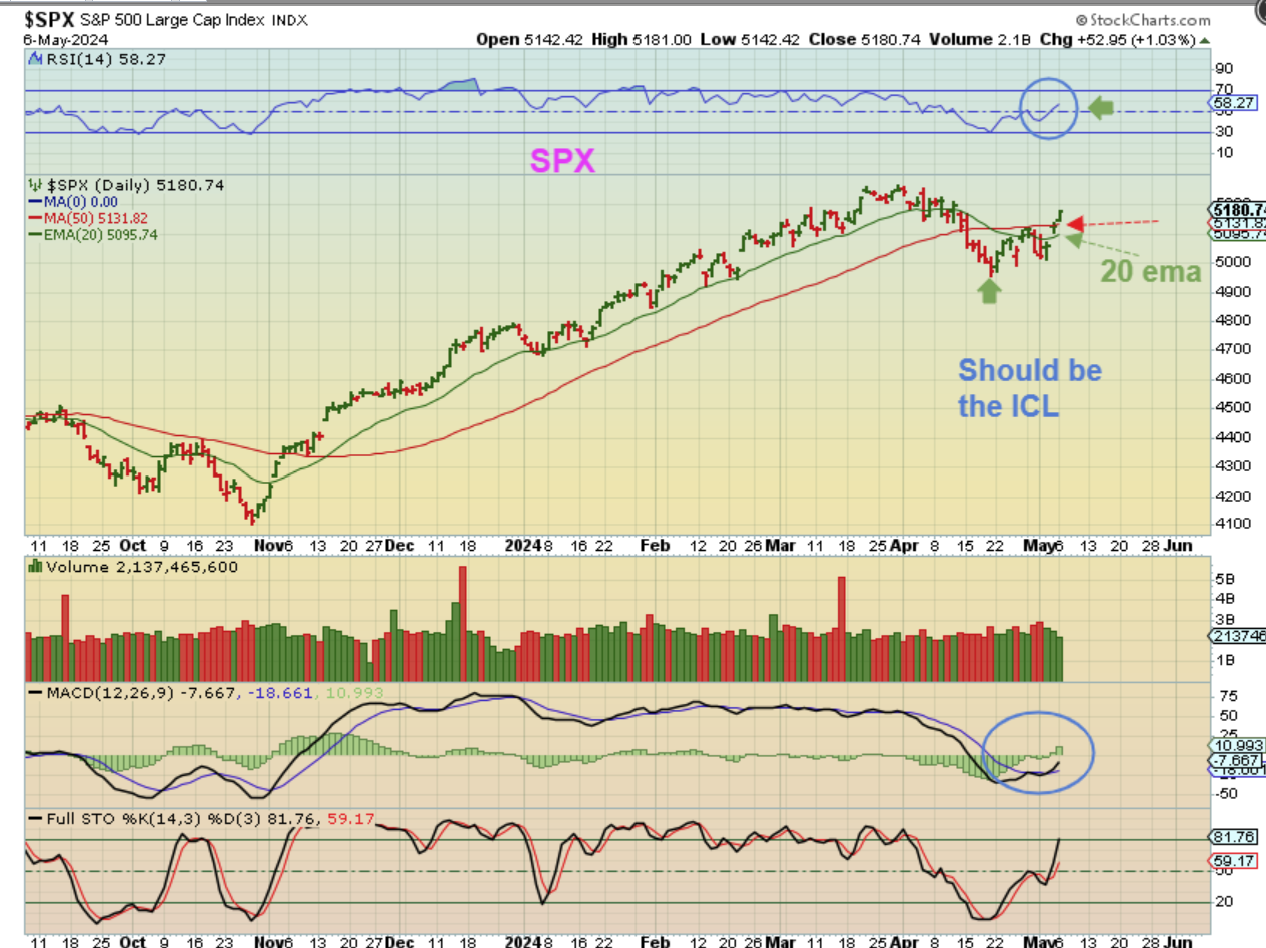
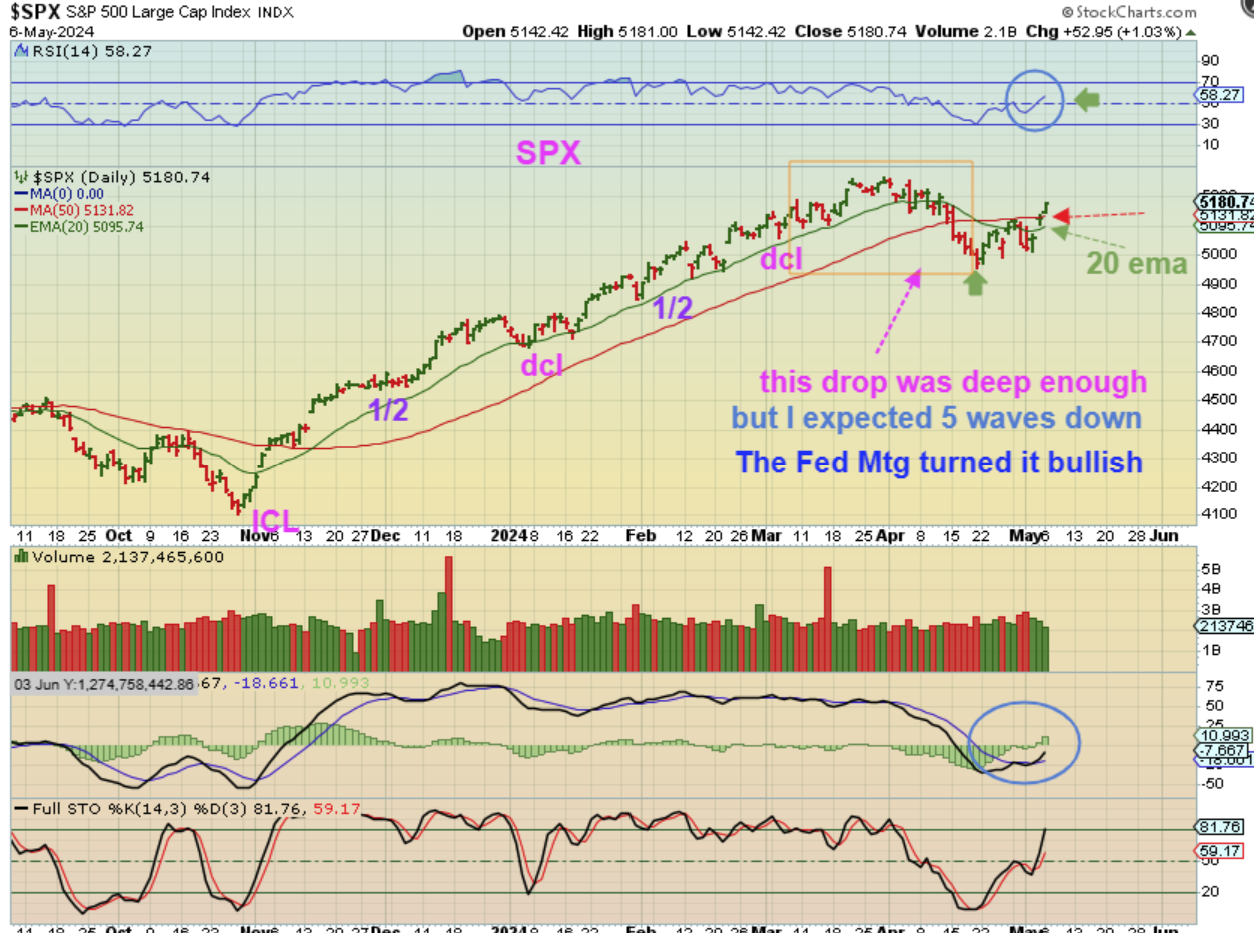
THE SPX did continue to push higher and was able to break above the 50sma & downtrend line. After a drop like that, we are now 6 months ahead of the last ICL, so that drop (far different from the prior smaller dcl dips), must have been one that leads us to the ICL. I expected a 5 wave drop, but thistrend line break and recapture of the 50sma is showing us that the drop has ended.
.
SPX – This labelling would only give us 3 visible daily cycles, but it was so strong that the last dcl was vague as it reached the peak. Recovering the 50sma is quite bullish…
.
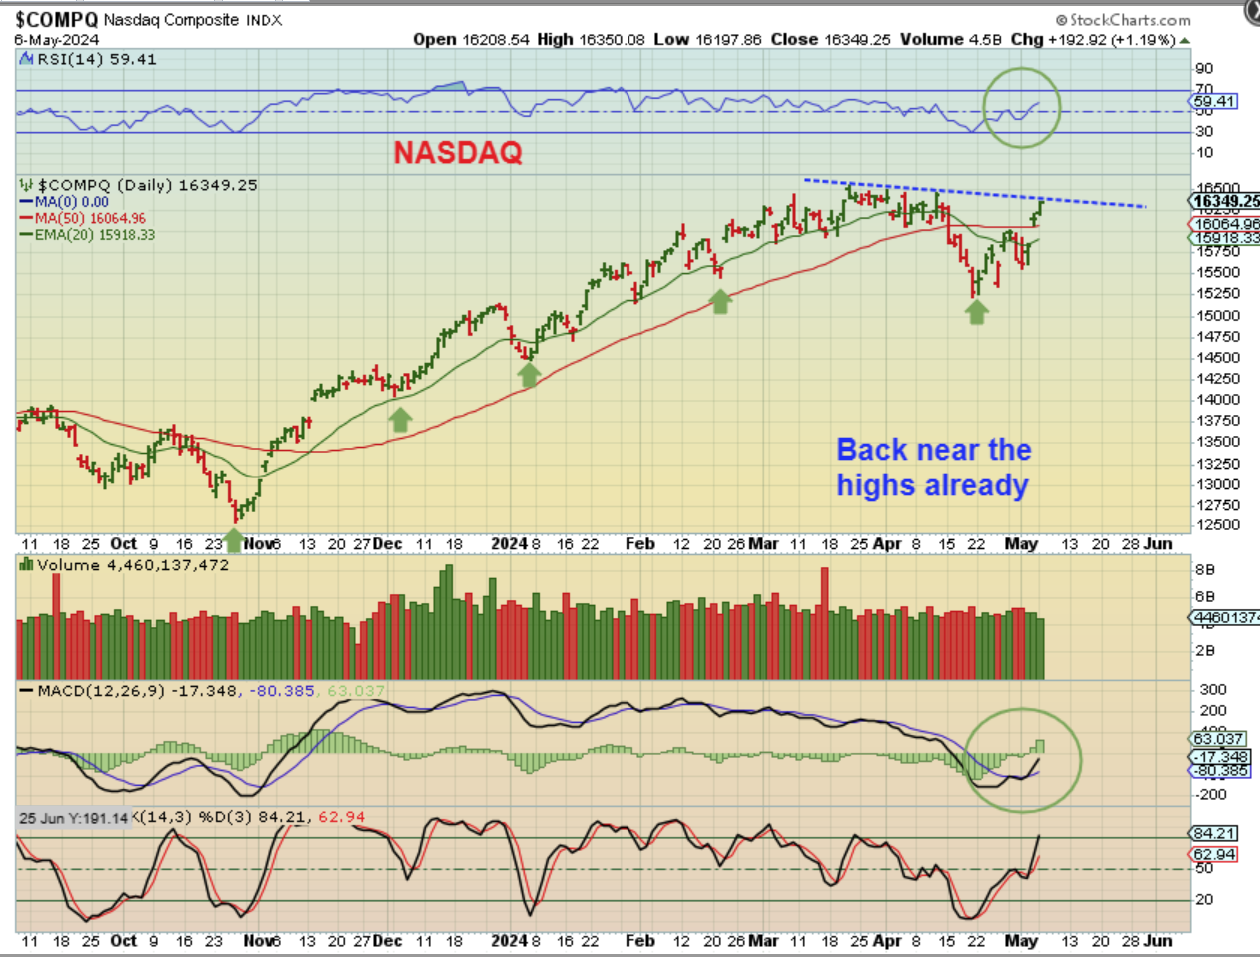
IN THE WEEKEND REPORT, THE NASDAQ HAD REGAINED THE 10 WEEK MA (Bullish). I said…
.
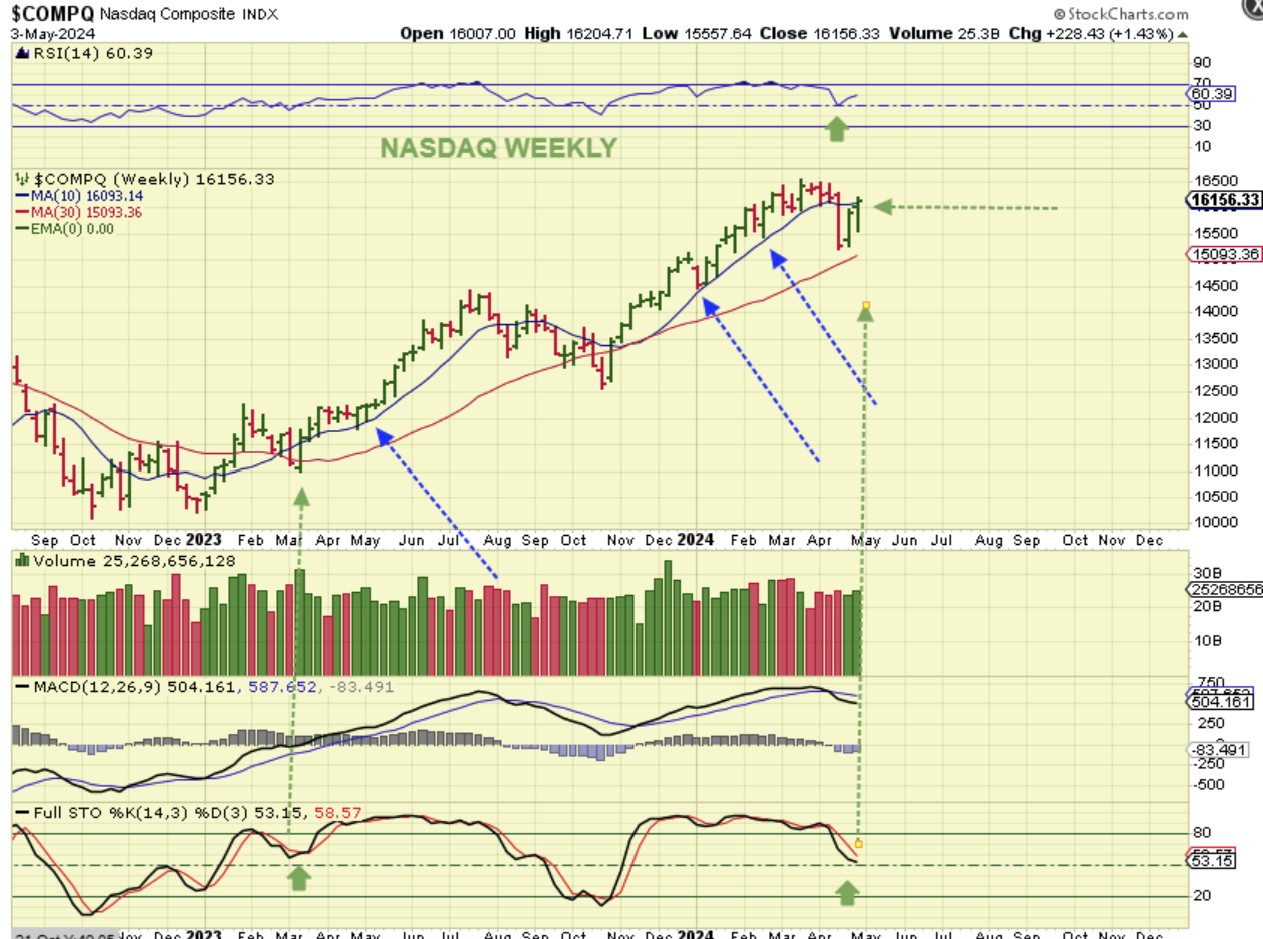
THE NASDAQ WEEKLY: After quite a sharp one week drop, the Nasdaq Weekly actually DID recover the 10sma, so this looks bullish,
.
THE NASDAQ did not break above the downtrend line yet, but take a look at price. The Nasdaq is actually almost right back at the highs, after regaining the 50sma last Friday. This ICL in April looks very similar to the ICL in late October.
.
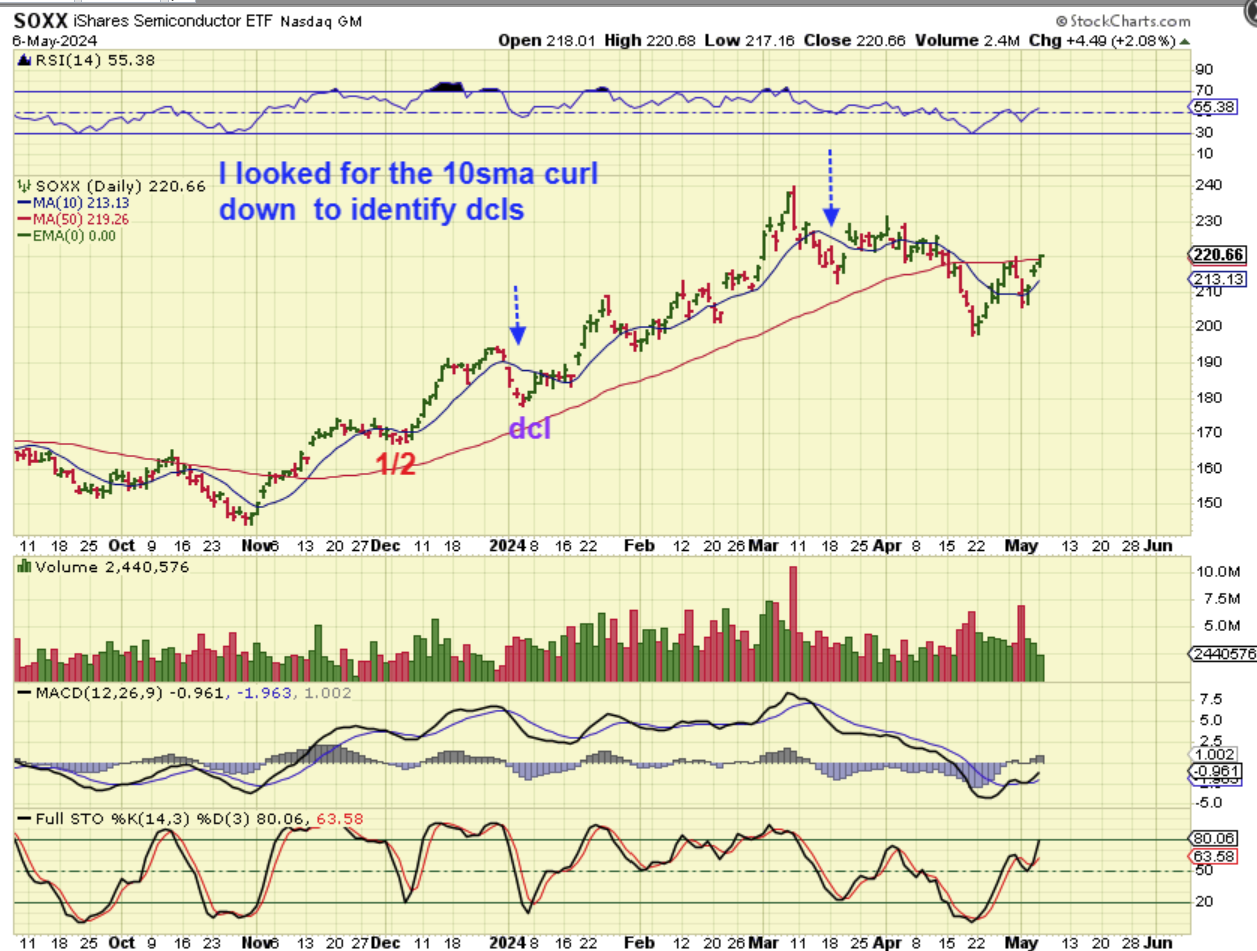
With The SOXX I only see the 10sma curl down twice and we usually use that to identify where a dcl took place. Using that last 10sma dip into a low, we would only be at day 22 at that low, and that is too early for a General Market dcl, but I can’t argue with what I see unfolding here. After the Fed mentioned no rate hikes and a possible cut in the future, the bounce to the 50sma found added strength.
.
Conclusion: The General Markets bounced to the 50sma and then found follow through, enough to break back above the 50sma. This has to be marked as a milder ICL. A stop at the 50sma should be enough.
.
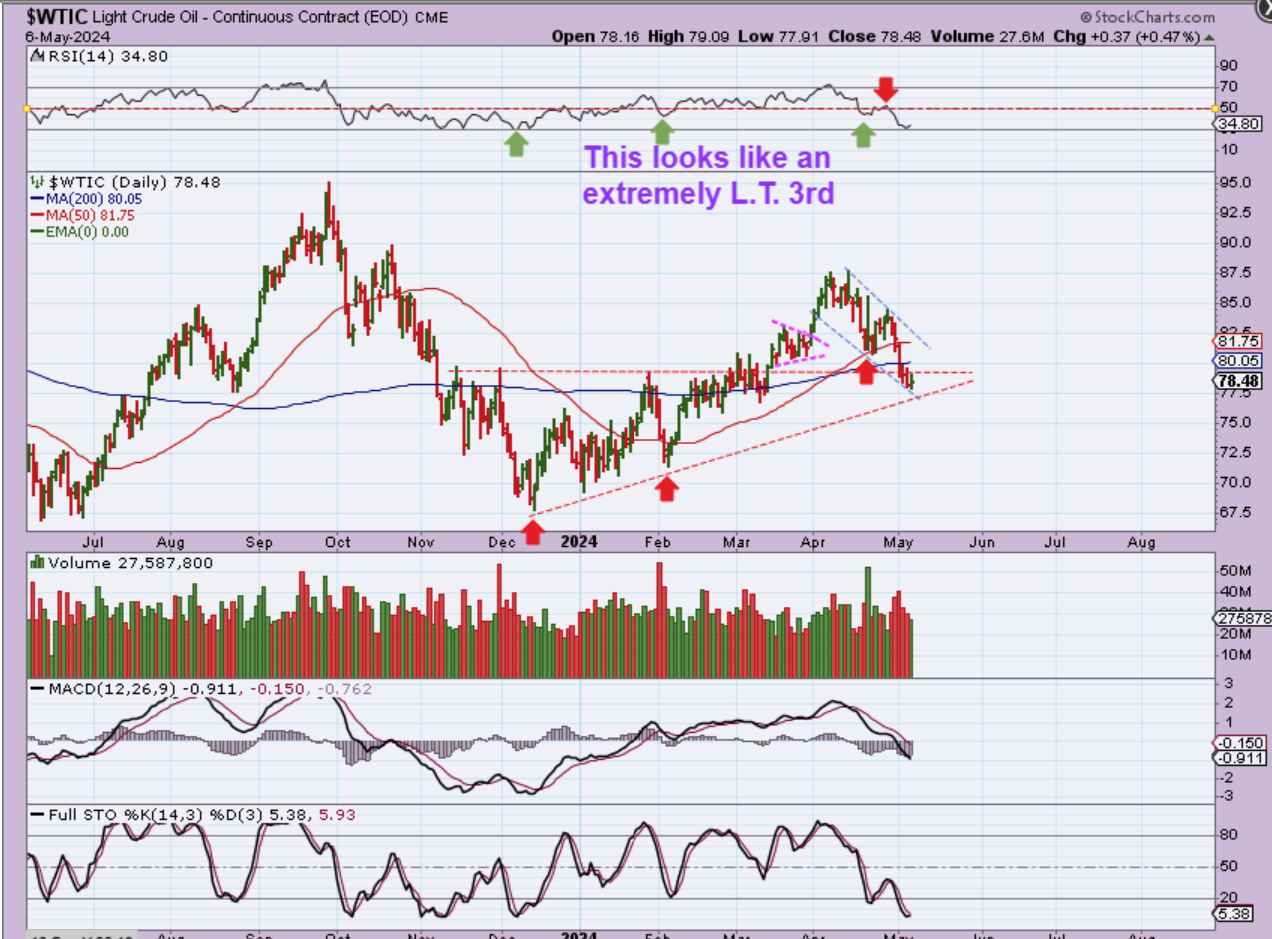
WTIC – Oil bottomed perfectly on the 50sma near the 50 day cycle count. Then we had that Fed Mtg where inflation was discussed as not being overly concerning and after Oil had bounced, it then rolled over and now looks very weak, as though a 3rd daily cycle formed as very L.T. – There is a chance that we have a VERY long daily cycle in Oil and will form a dcl here, but I think that we may bounce and roll over at this point. The Oil Stocks also look weak.
.
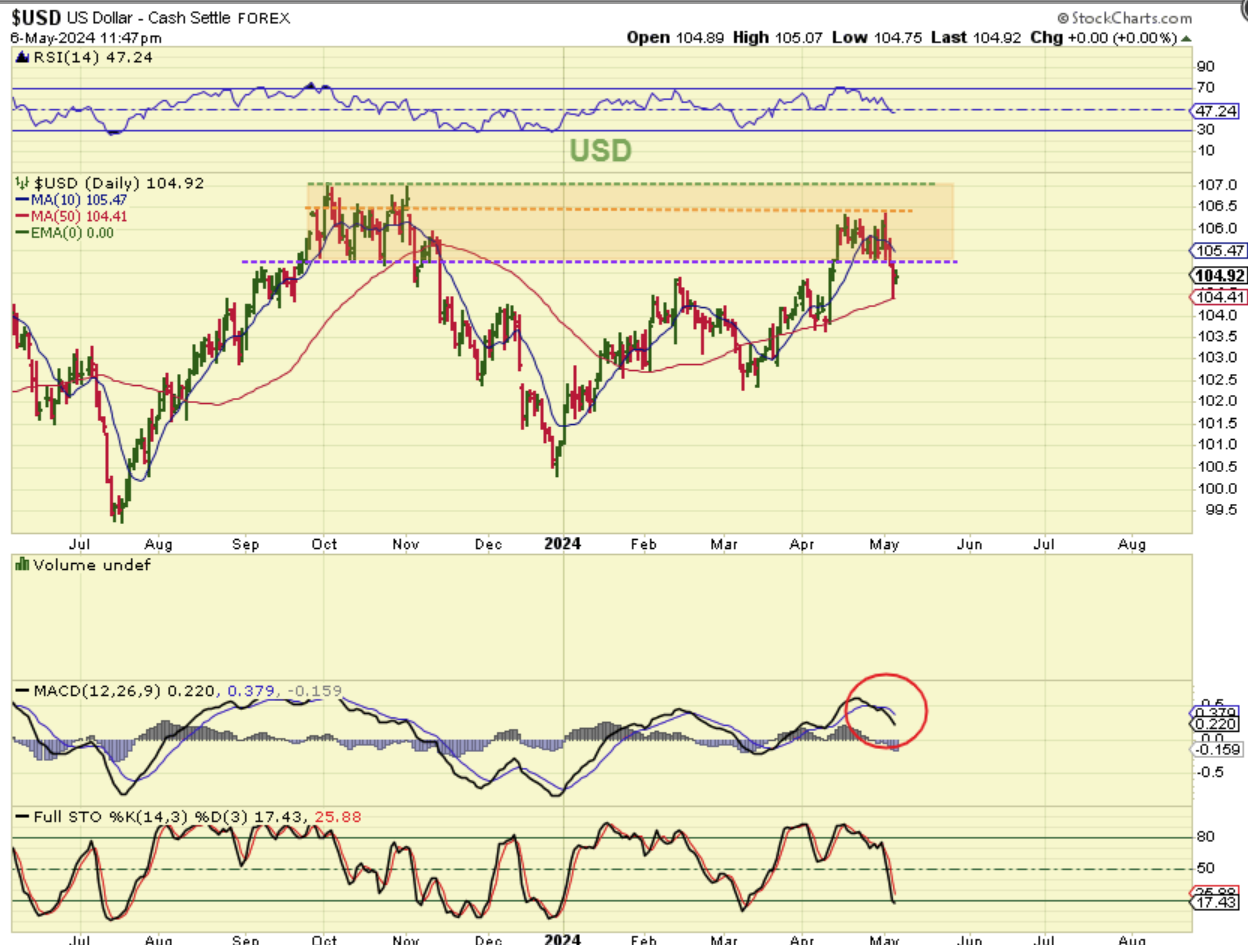
THE USD is not really affecting Gold at this point, it was just chopping sideways and then it also dropped last week with the Fed Mtg.
.
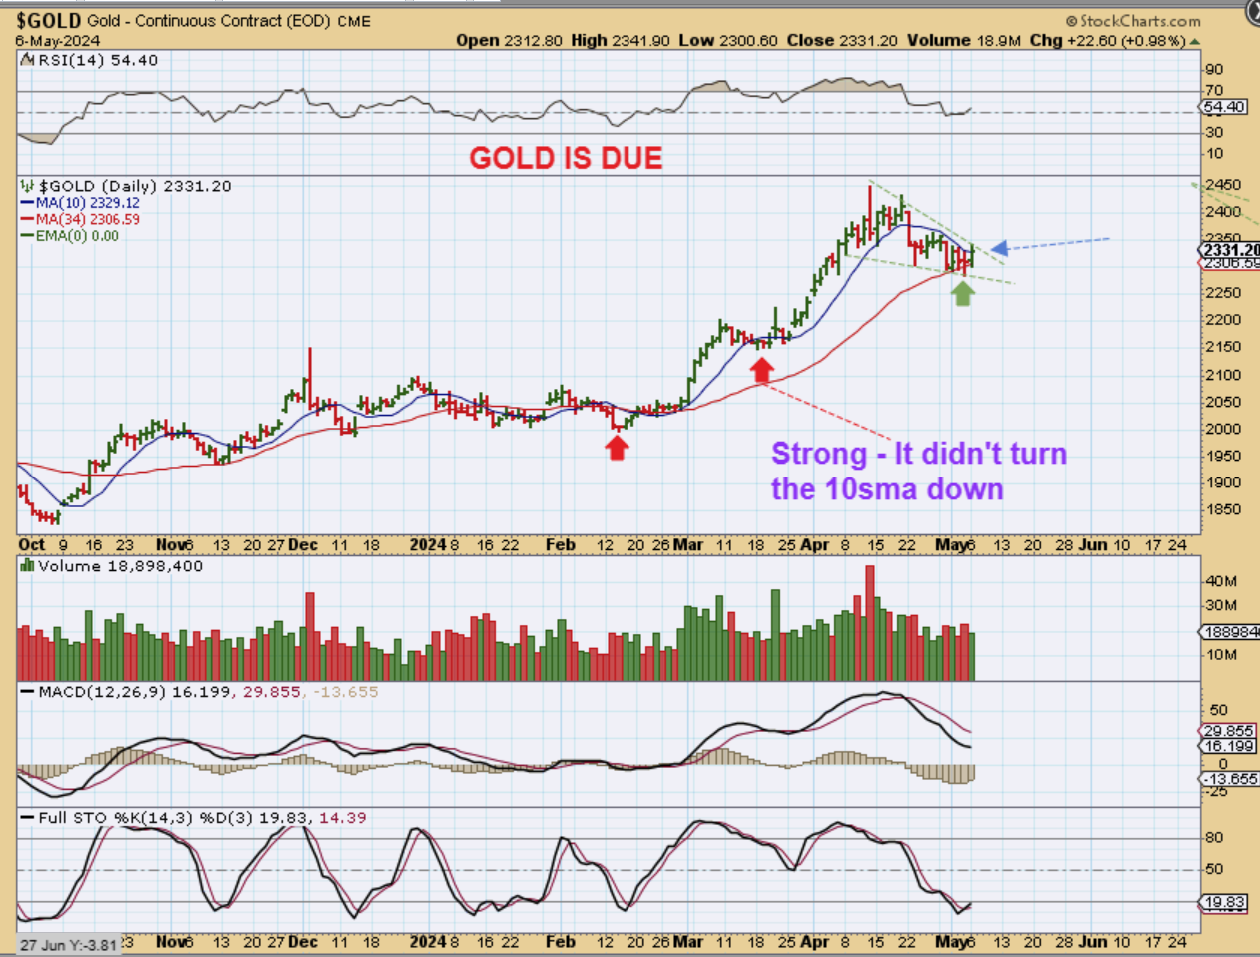
GOLD reversed at the support of the 34sma. It also attempted to move above the 10sma to form a swing low, so the cycle count is on the next chart.
.
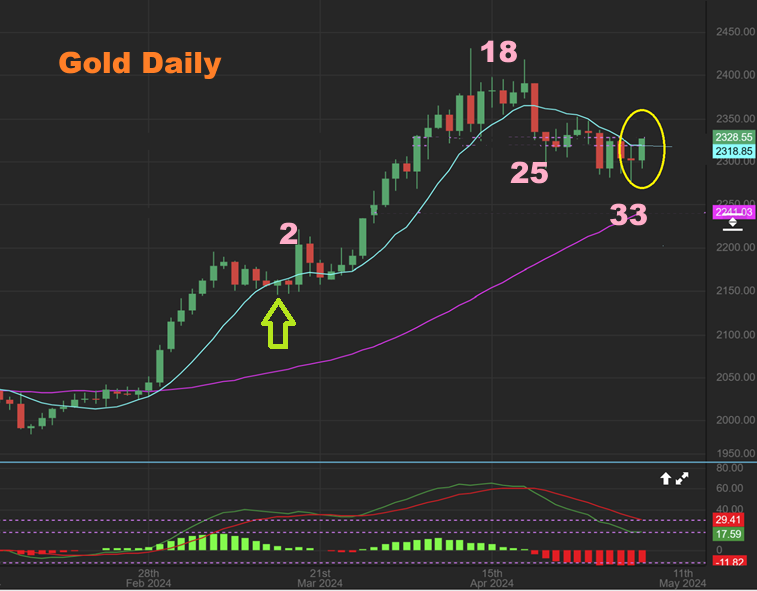
GOLD used to put in a dcl at roughly day 32 and here we see a day 33 low on Spot Gold. Price then moved up on Sunday and tried to close above that 10sma to give us a confirmed dcl. There is a strong possibility that this is the swing low and dcl at day 33.
.
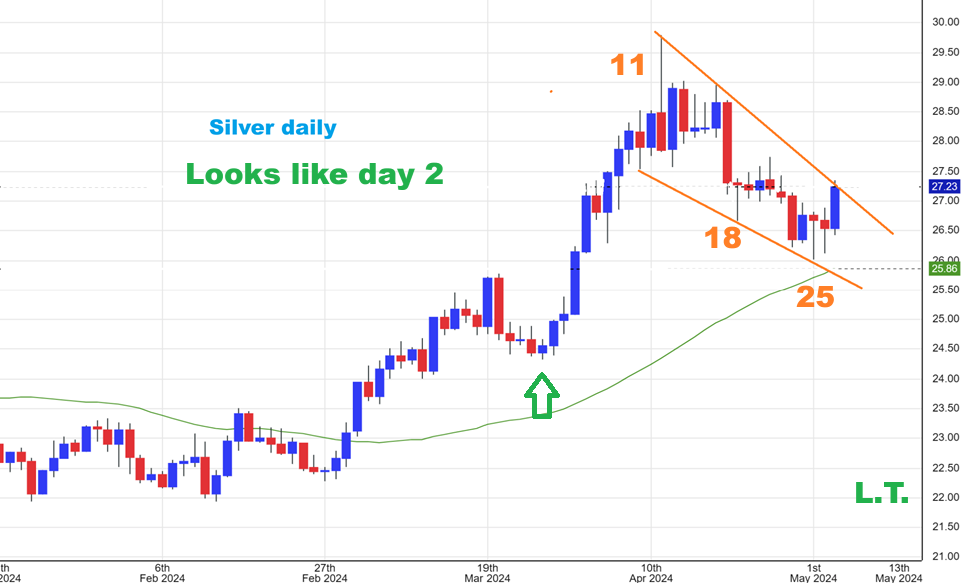
SILVER had a much less muted move, as it surged higher on Monday. This would give Silver a day 25 dcl just above the 50sma, and if Gold & Silver both bottom here, they can sync up, as mentioned in the weekend report.
.
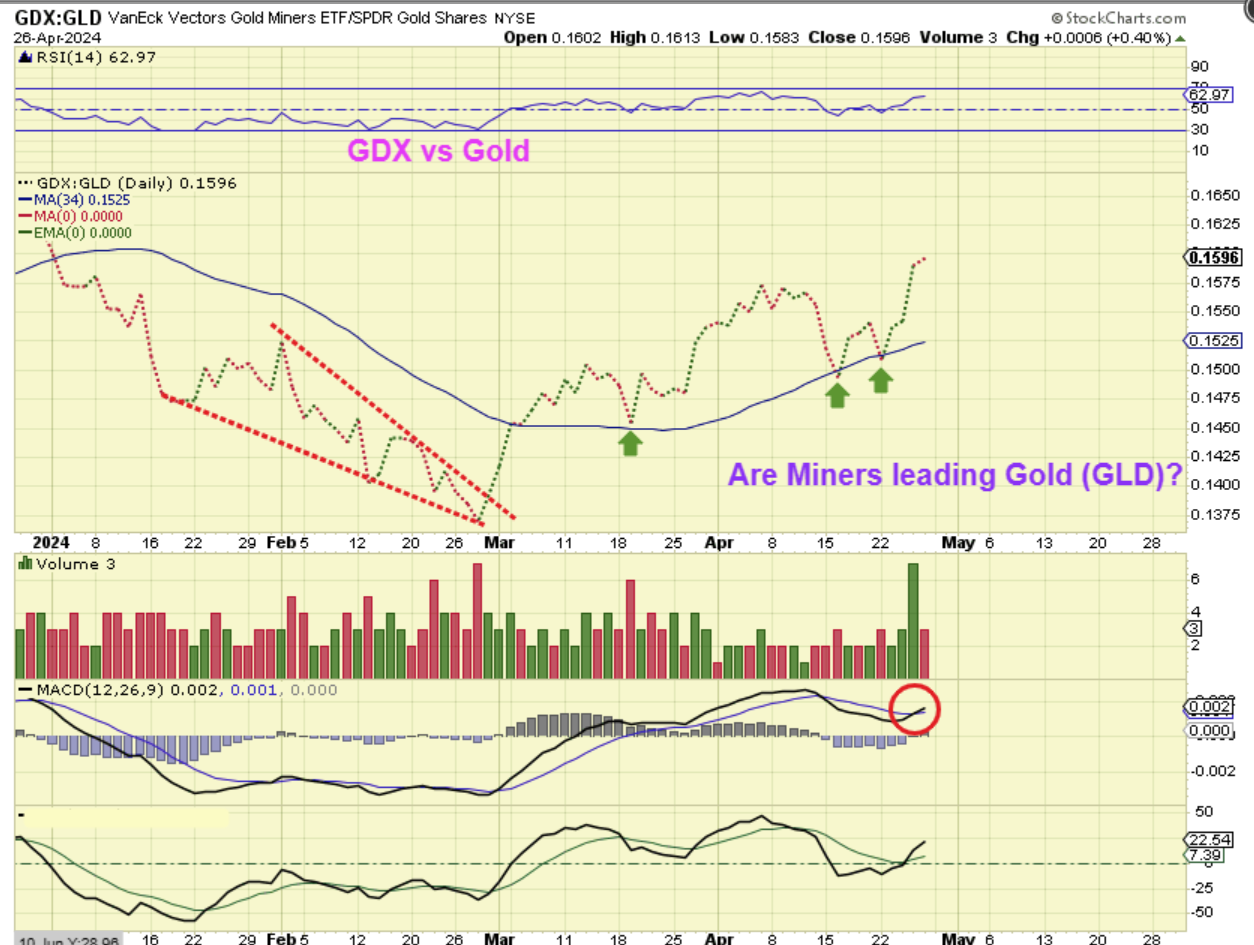
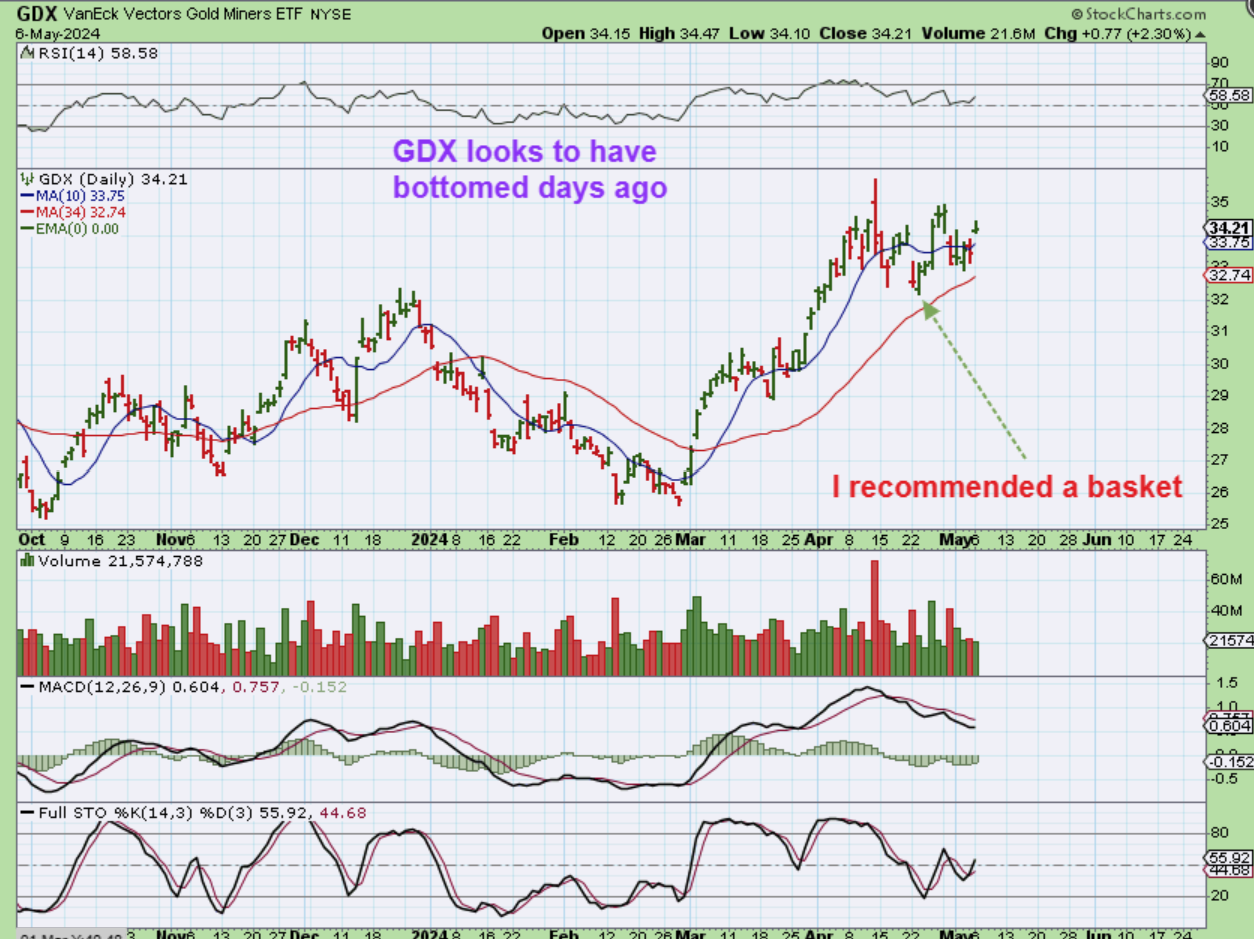
ON APRIL 26 – I started to mention that buying a basket again seemed prudent, even though Gold & Silver didn’t bottom. Why? I pointed out that Miners were leading Gold with this chart. I also showed that IAG, KGC, NEM, NGD, and a few other stocks already looked to have bottomed. Well…
.
Here we are several days later and GDX does appear to have bottomed well before the Metals. With Gold and Silver confirming their swing lows, Miners should be able to gain some more upside. I just want to mention that if the 3rd daily cycle is to become L.T. for Gold, Miners will likely peak when Gold does.
.
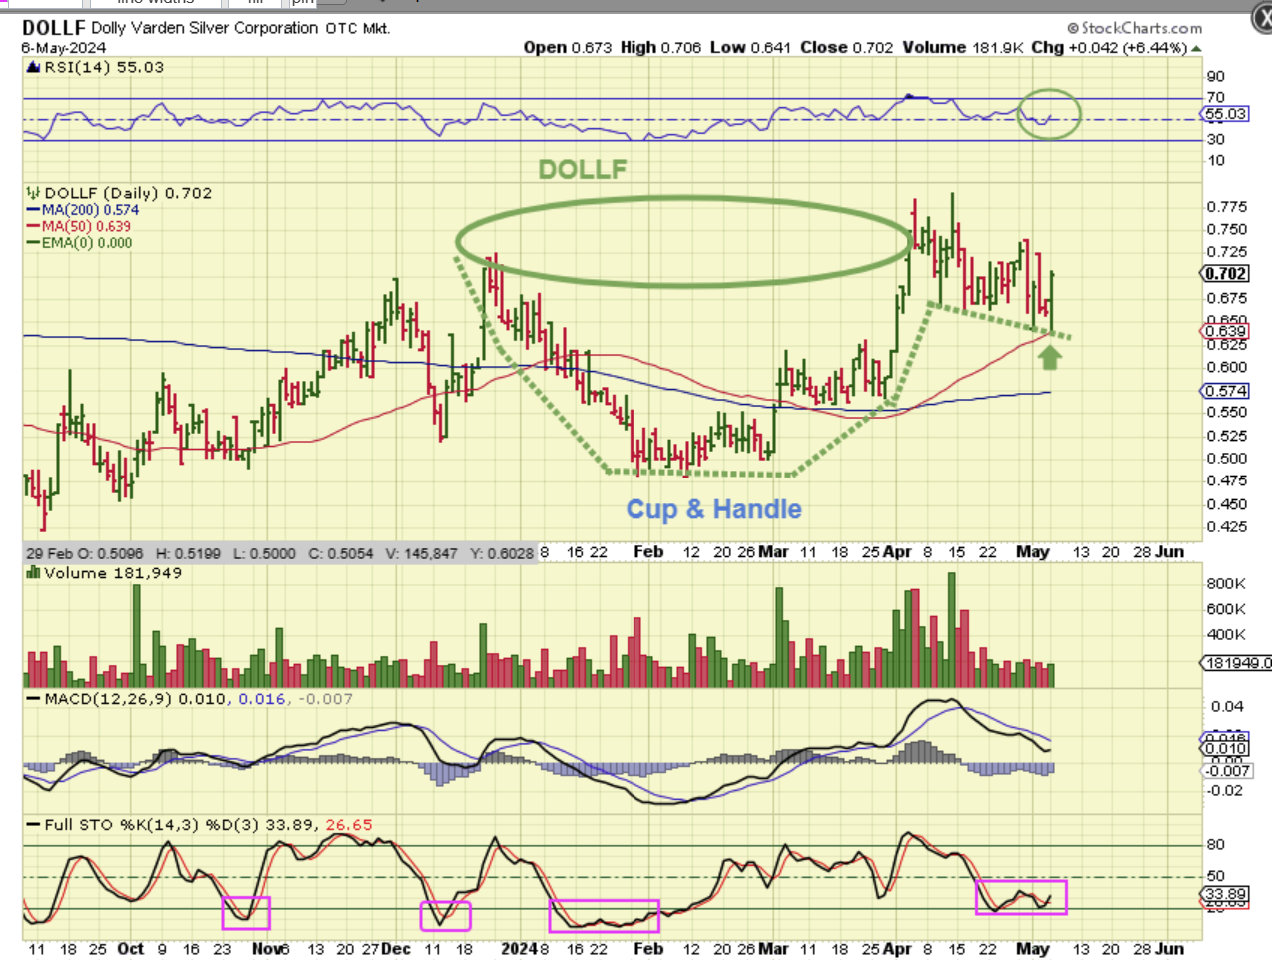
I was looking at a couple of the smaller Miners/ explorers, and noticed that DOLLF looks like a cup and handle after the last run and pullback. This is probably as low as this pullback will drop. It tagged the 50sma yesterday.
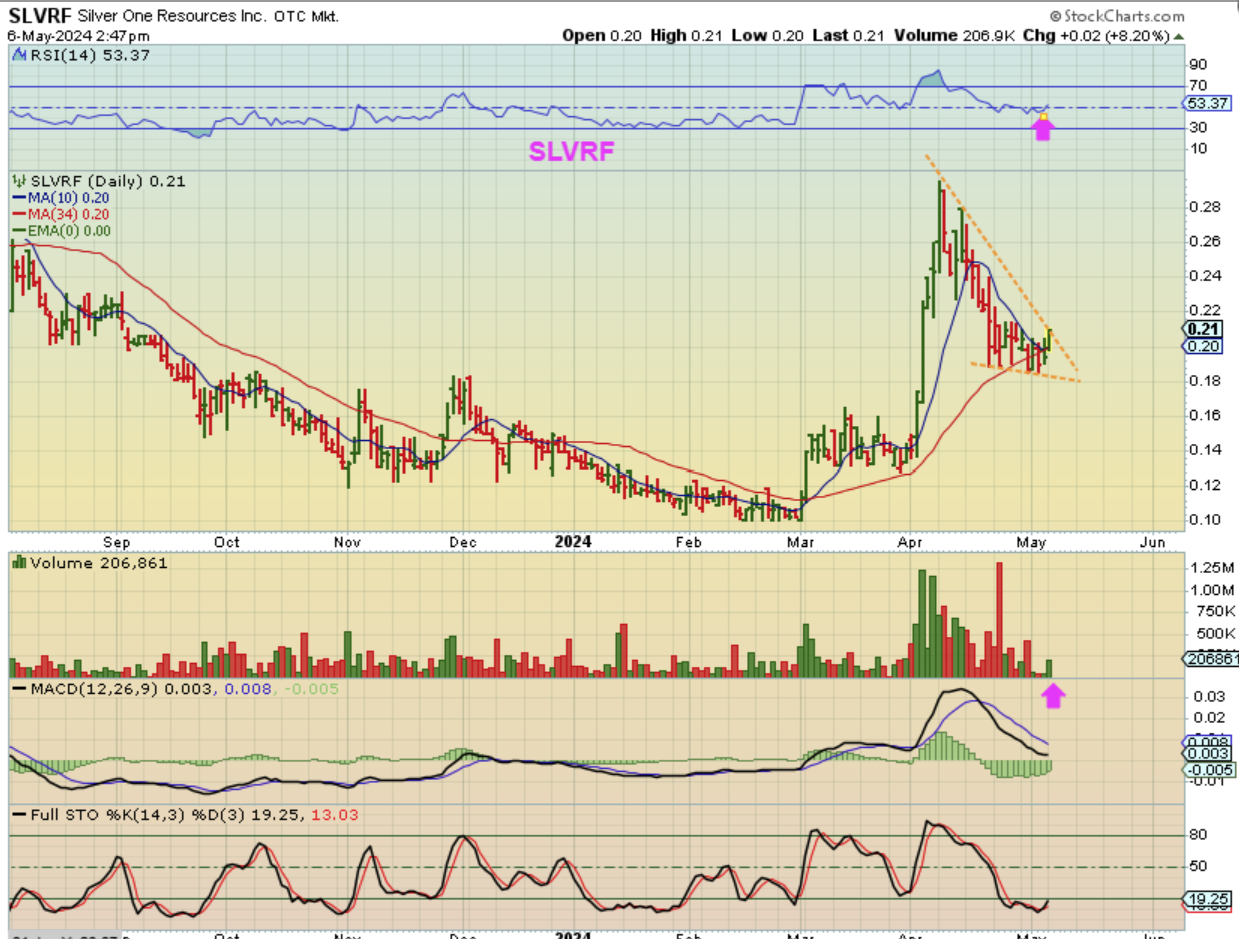
SLVRF also landed at a support area, the 34 sma, and that is where it turned higher in March.
.
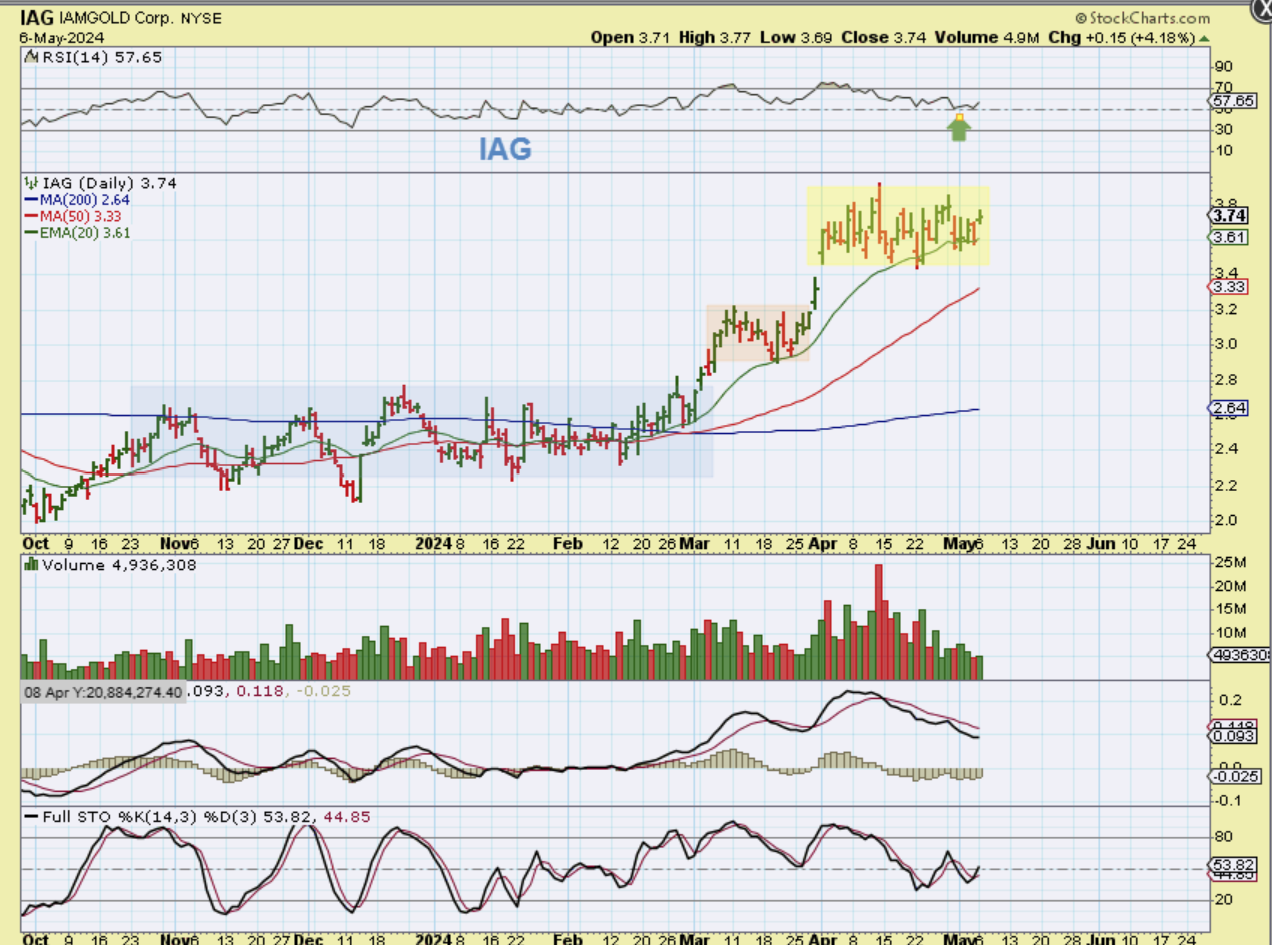
IAG in recent reports I have been pointing out that IAG, KGC, AEM, NGD, NEM, etc are already consolidating up near the highs, so the dip was mild for some Miners and buying a basket was recommended as of last Wednesday.
.
So we did get more upside follow through after the Fed mtg and into Monday with the General Markets. The last prolonged sell off into an ICL was in October, 6 months ago, so this looks to be the ICL and we should get more upside for months. Oil is still struggling, and if that was a dcl that we saw at the 50sma(& the timing was perfect for one), then Oil has a lot of choppiness and downside left. We are awaiting the Precious Metals swing low confirmation & DCL, but the Miners seem to be leading the way. Enjoy your Tuesday trading.
.
~ALEX
.
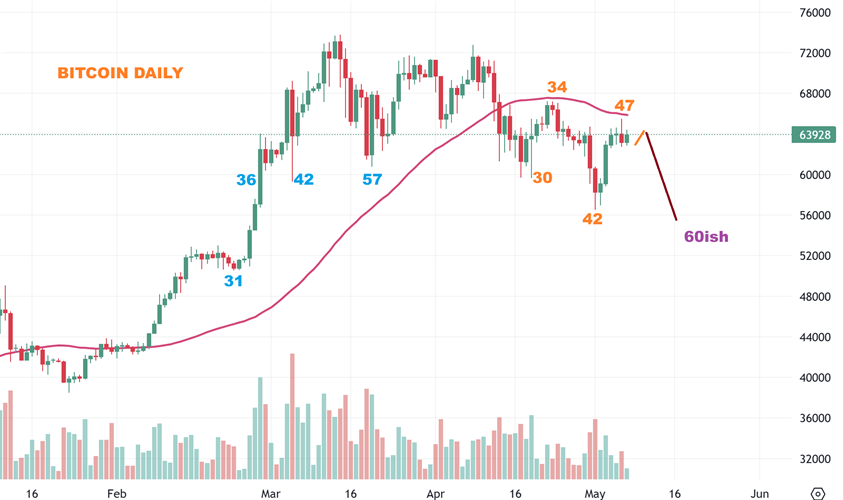
BITCOIN has now been held back at the 50sma twice. The last low was only day 42, so I would expect one more dip lower into the 60ish day time-period. That said, I mentioned that I would start looking to see if the Crypto-stocks might bottom first. Oddly enough, they are already showing signs of strength…
.
For example:
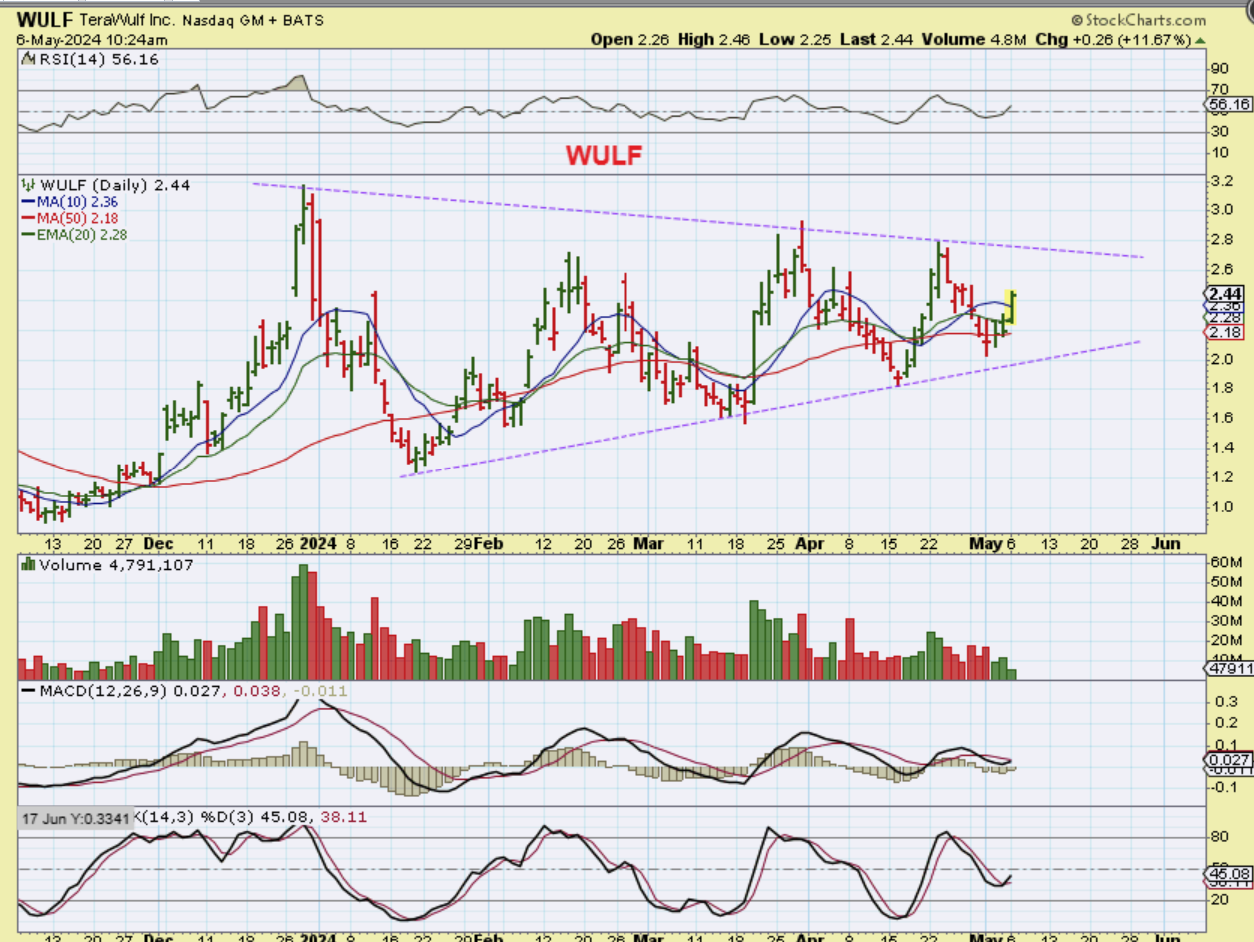
WULF has a series of higher lows and looks to be forming a large bullish triangle. Look at the chart of Bitcoin again above, and you’ll see day 42 was a lower low, and in WULF it was not. It is showing strength when Bitcoin sells off.
.
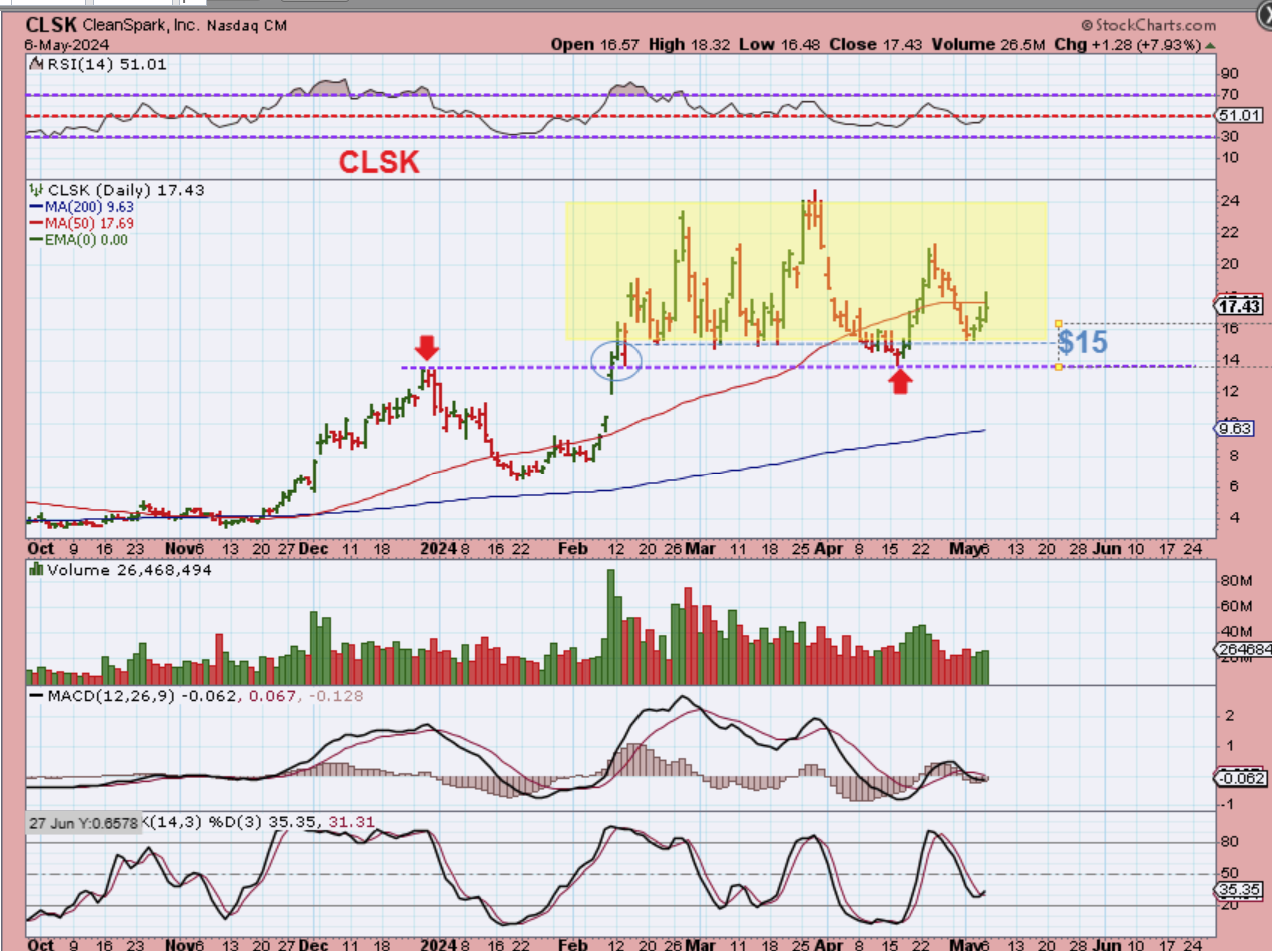
CLSK also had a higher low recently, and I find this set up is interesting. $15 was support. That last low in April actually back-tested the prior highs near $14 (that is normal), and it broke the $15 support area that has held up in the past. This makes me wonder if that $14 low is the final low and $15 will hold up when Bitcoin drops again.
.
Again, just take a look at the day 30 lows and then see how the next day 42 low broke below it for a ‘lower low’…
.
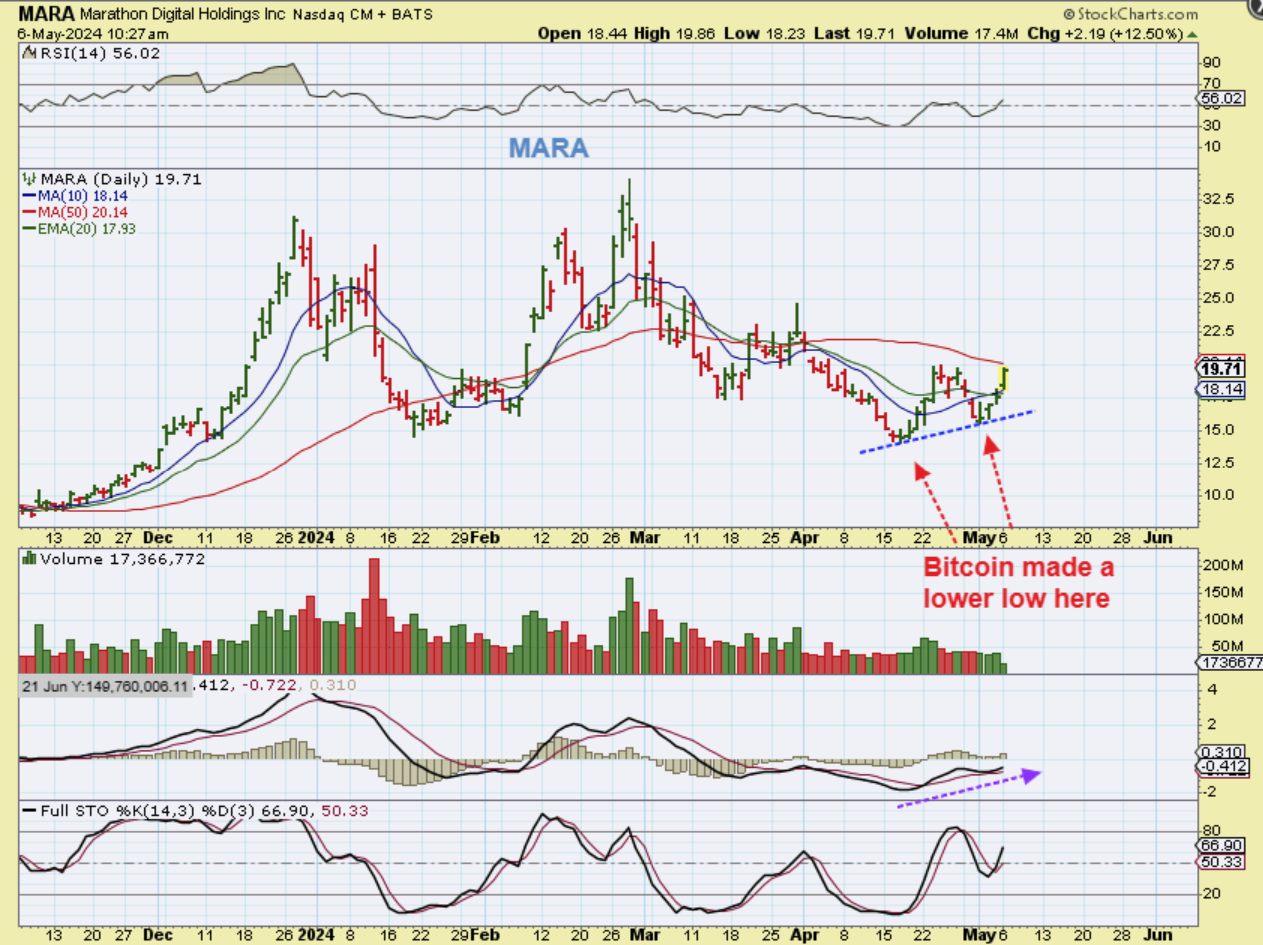
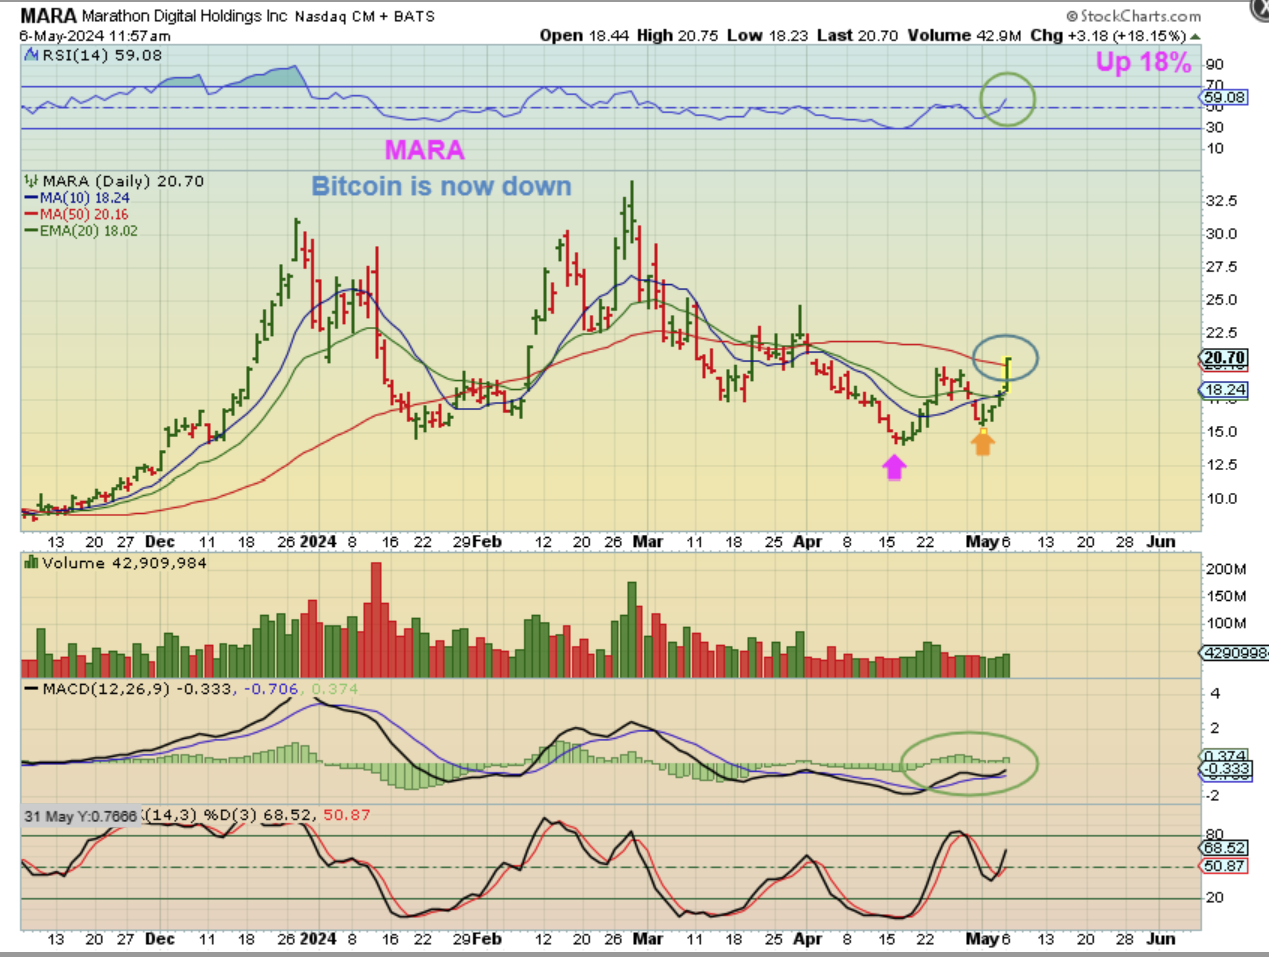
MARA put in a higher low. Also Mara was heading for the 50sma and was up 12.5% so I grabbed this chart and posted it in the comments, since many of these were showing strength, and…
.
MARA actually broke above the 50sma , up 18% and it closed above the 50sma. The RSI is above the 50% mark and the MACD now has a higher cross over. These Crypto Stocks look to be bottoming before Bitcoin.
.
Those crypto-stocks seem to be signaling that Bitcoin will bottom soon, right? Yes, and many of those stocks look to have already bottomed, so if Bitcoin breaks above the 50 sma, that could be a sign of strength that may indicate that we have an extremely early low in Bitcoin. I know…
.
I know that the bitcoin day 30 & day 60 ‘counts’ has been very accurate in the past, it really has, but there just seems to be something about that last Fed Meeting that renewed the bullishness in these markets. We’ll just have to wait and see, but the General Markets were able to push above their 50sma after the Fed decision and speech. It would be very odd to me to see Bitcoin push above the 50sma from here without 1 more dip. The count from the January lows to a day 57 dcl is very obvious and accurate to me. The next 30 day 1/2 cycle low was clear too. A day 42 dcl would be pretty much unheard of, but I’ll be watching this development closely, since the Crypto-Stocks are an excellent trade opportunity.
.

