May 25th Weekend Review – Just Resting?
I mentioned that one of our readers was discussing the Dow Theory, and now a different reader has asked me to explain what the Dow Theory is. I will do that in this report, but honestly I feel that you could just google it and understand it fairly well from that description too, so you may want to also do that. Here, I will use a couple of charts to explain it in the weekend report.
.
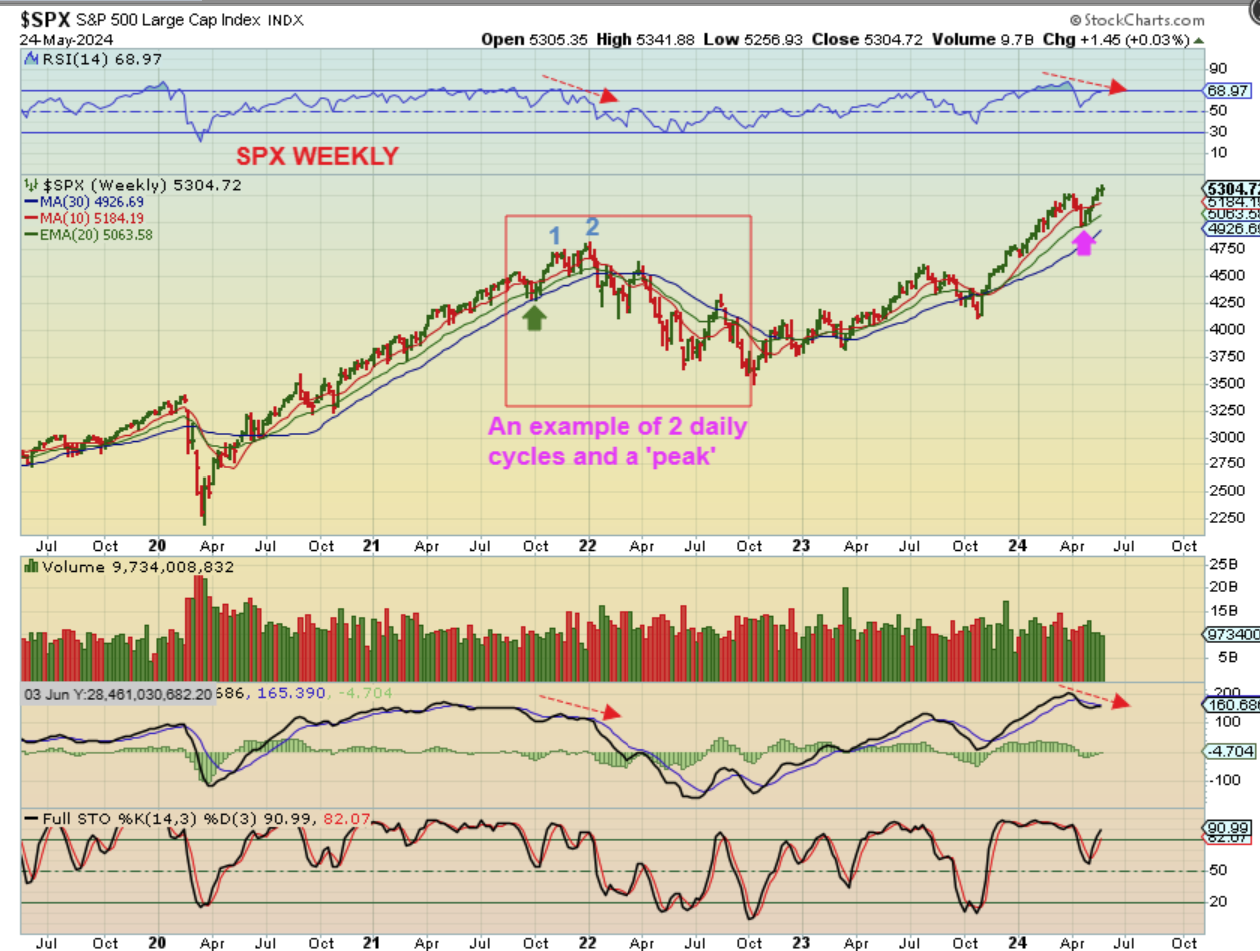
SPX – We have an ICL and a new all-time high was reached in this first daily cycle. The markets look strong, but notice the divergence with the RSI & MACD as we make all-time highs. That is often a warning that the markets may be getting a little ahead of themselves. In 2021, we saw that with the first 2 daily cycles out of an ICL too. It was a double top that dipped into a correction.
.
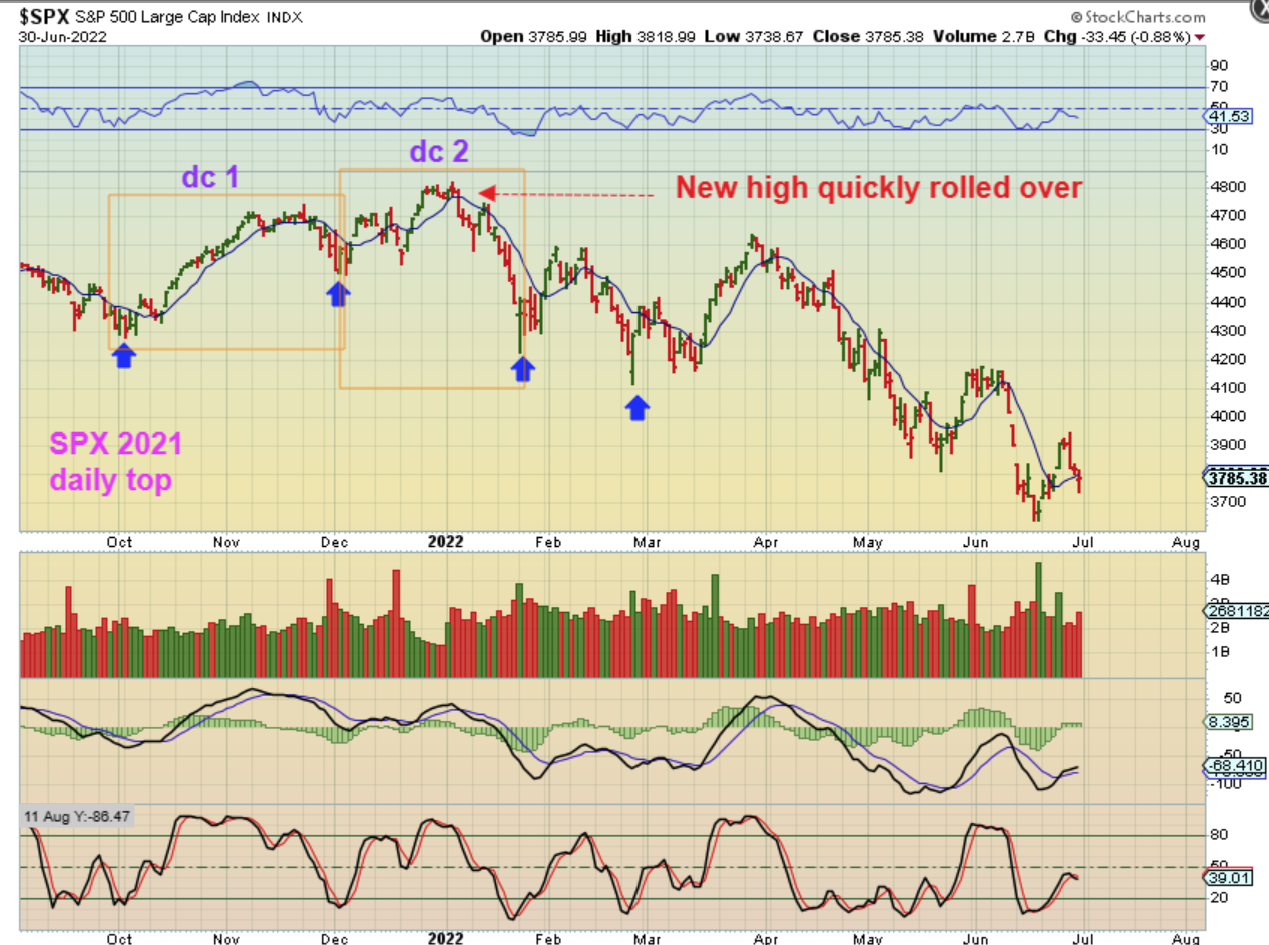
So we can go to the daily chart of The SPX and zoom in on 2021 where we see that
1. We had a strong first daily cycle, and then
2. The 2nd daily cycle one gave us the ‘peak’ with divergence, and a sharp drop developed with that 2nd daily cycle after it topped.
.
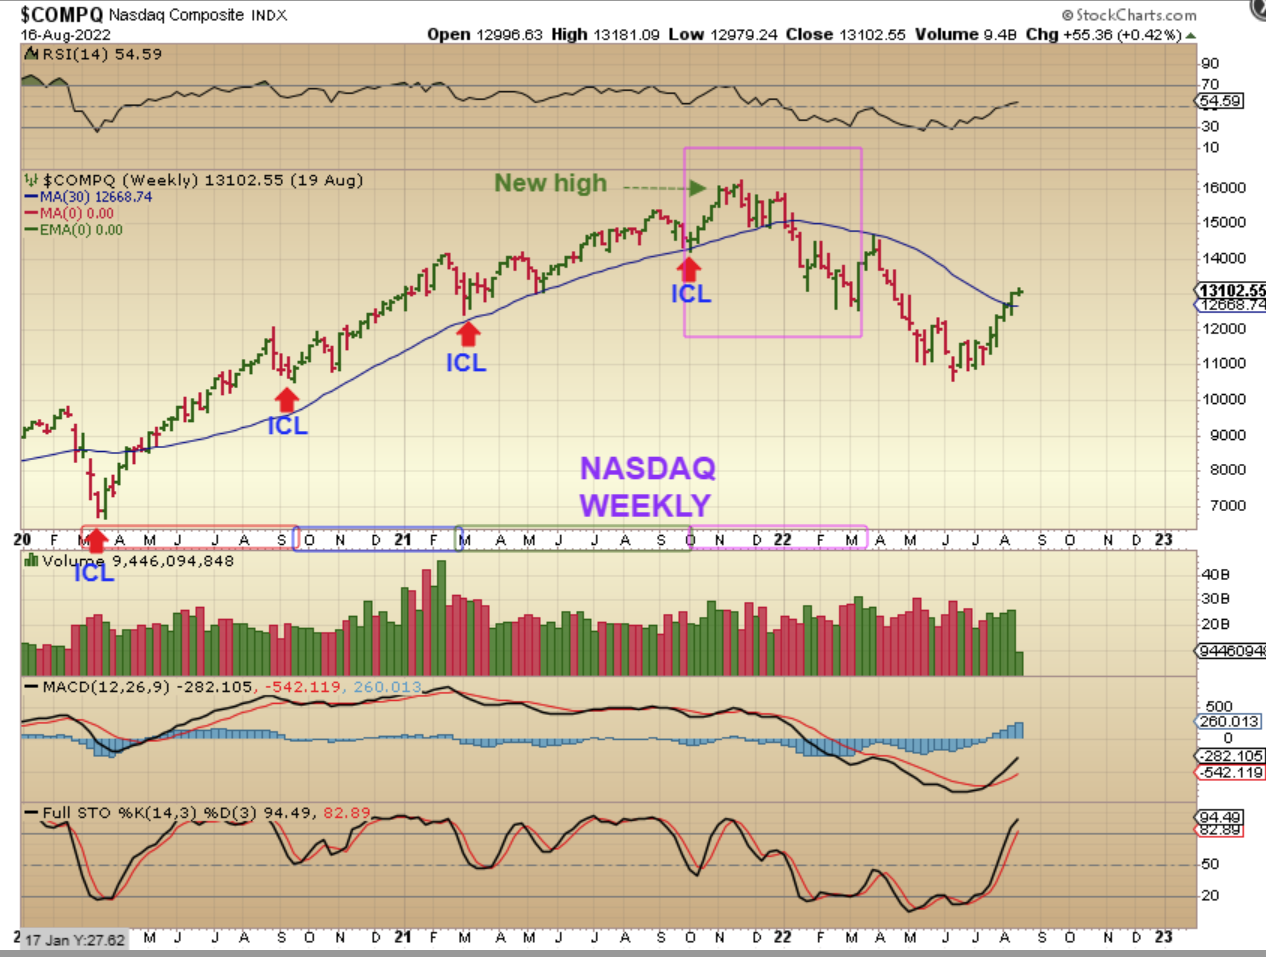
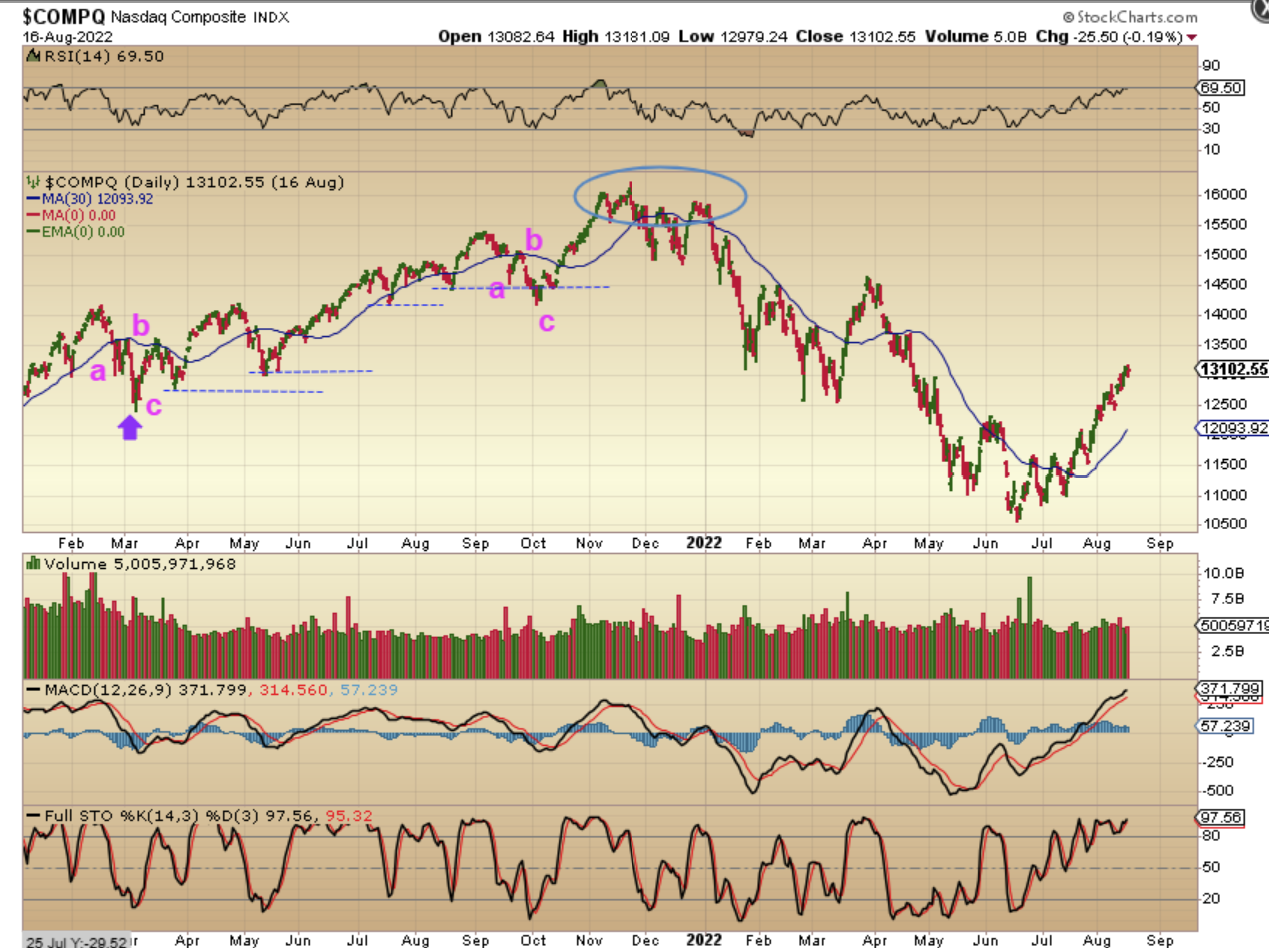
NASDAQ WEEKLY 2021 – 2022: You can see the Bull run and the ICLs along the way, and suddenly the Nasdaq peaked too.
..
NASDAQ 2021-2022 Daily: After an a-b-c drop into an ICL, the Nasdaq made new all -time highs and then the tech sector also got choppy and toppy. It is likely that institutional selling at the top prevented it from making new highs again, because they sell their big positions into strength. Next, we saw the market correction.
..
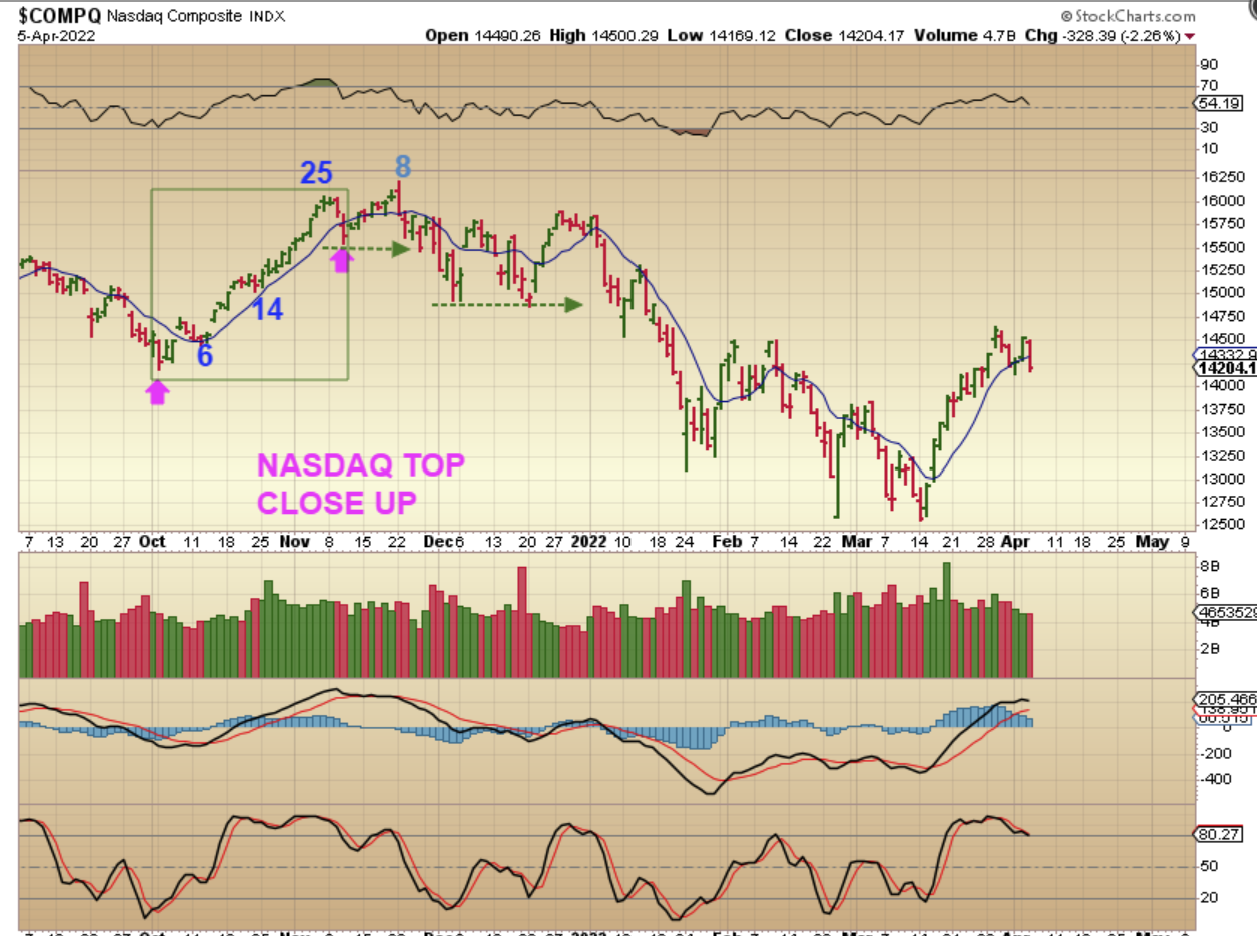
NASDAQ DAILY – I drew this as roughly a 30 day daily cycle, and a day 8 peak in the 2nd daily cycle, but actually the Nasdaq was weaker than the SPX, and it is very likely that day 8 was really 36 and the next drop after day 8 was all the first daily cycle. Then the 2nd daily cycle could not make a new high and that was the lower high double top for the Nasdaq.
.
Now what about the DOW THEORY?
.
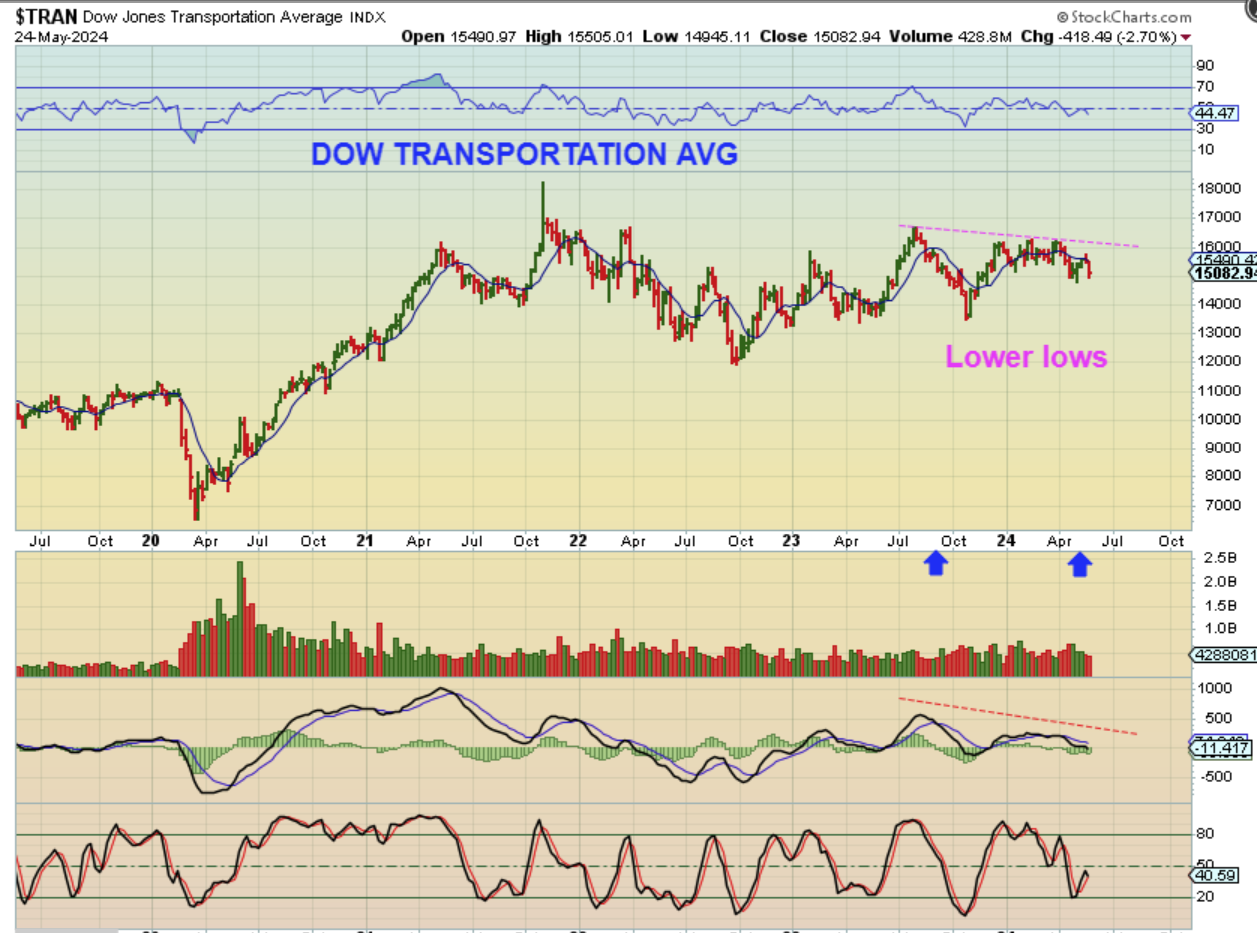
The Dow Theory is basically in play when the Dow or the Dow transports do not follow each other to new highs. In other words, if the DJIA makes new highs above an important prior high, but the transports remain weak and does not also make that new high, it does not support the DJIA trend higher. The theory is that they need to balance out and the Dow Jones that made new highs will drop. The trend will end. That is BASICALLY it, and you can google it for more details, but let’s view it on charts…
.
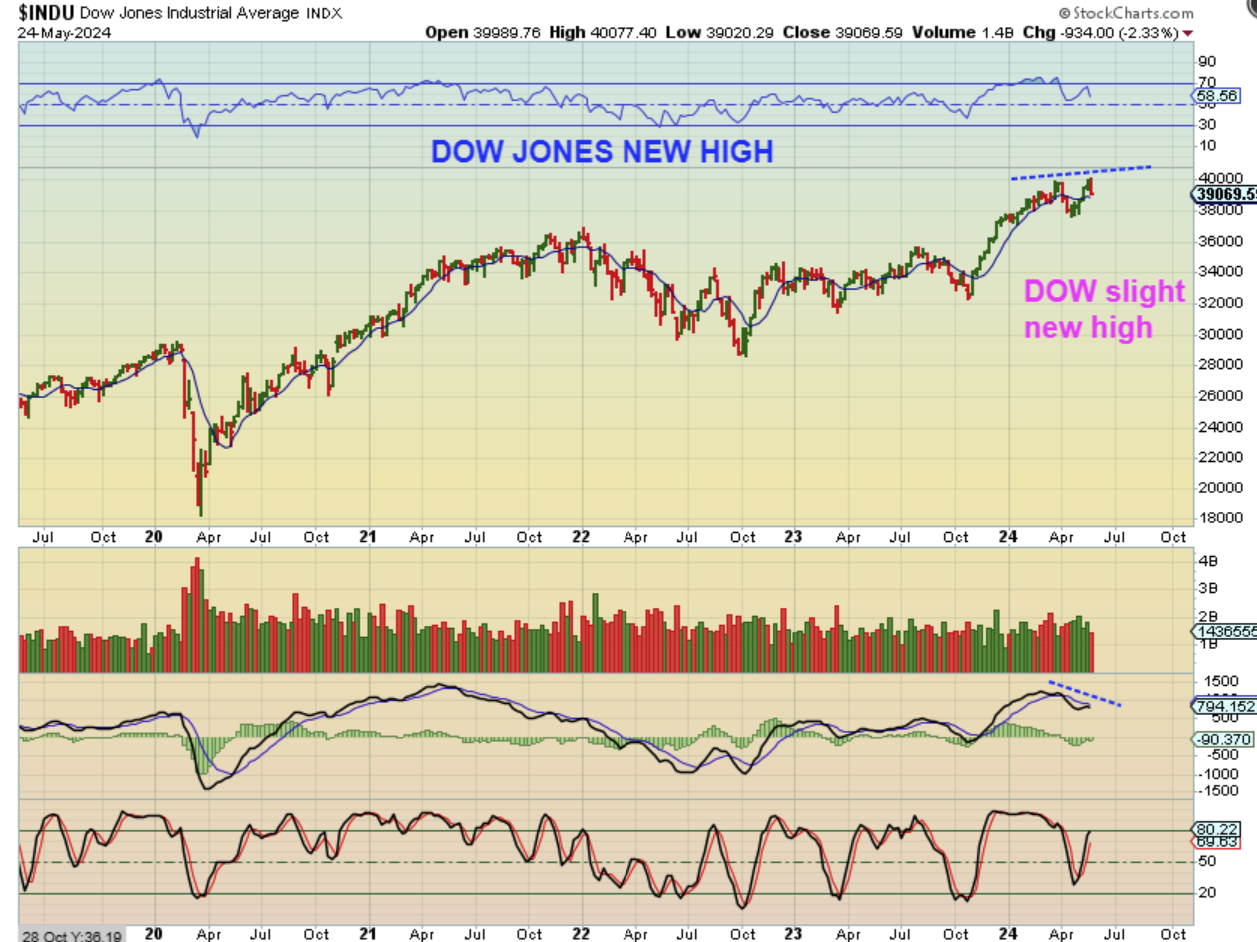
DOW JONES – The DOW just made new all-time highs as you can see here. We do see divergence with the RSI and MACD, but sometimes that alone can be resolved with a little sideways choppy action into a dcl and then the next highs could show less divergence, however…
.
So the Dow made new all-time highs, but with the Dow Theory, the Transports need to verify the DJIA New all-time Highs and the trend higher.
.
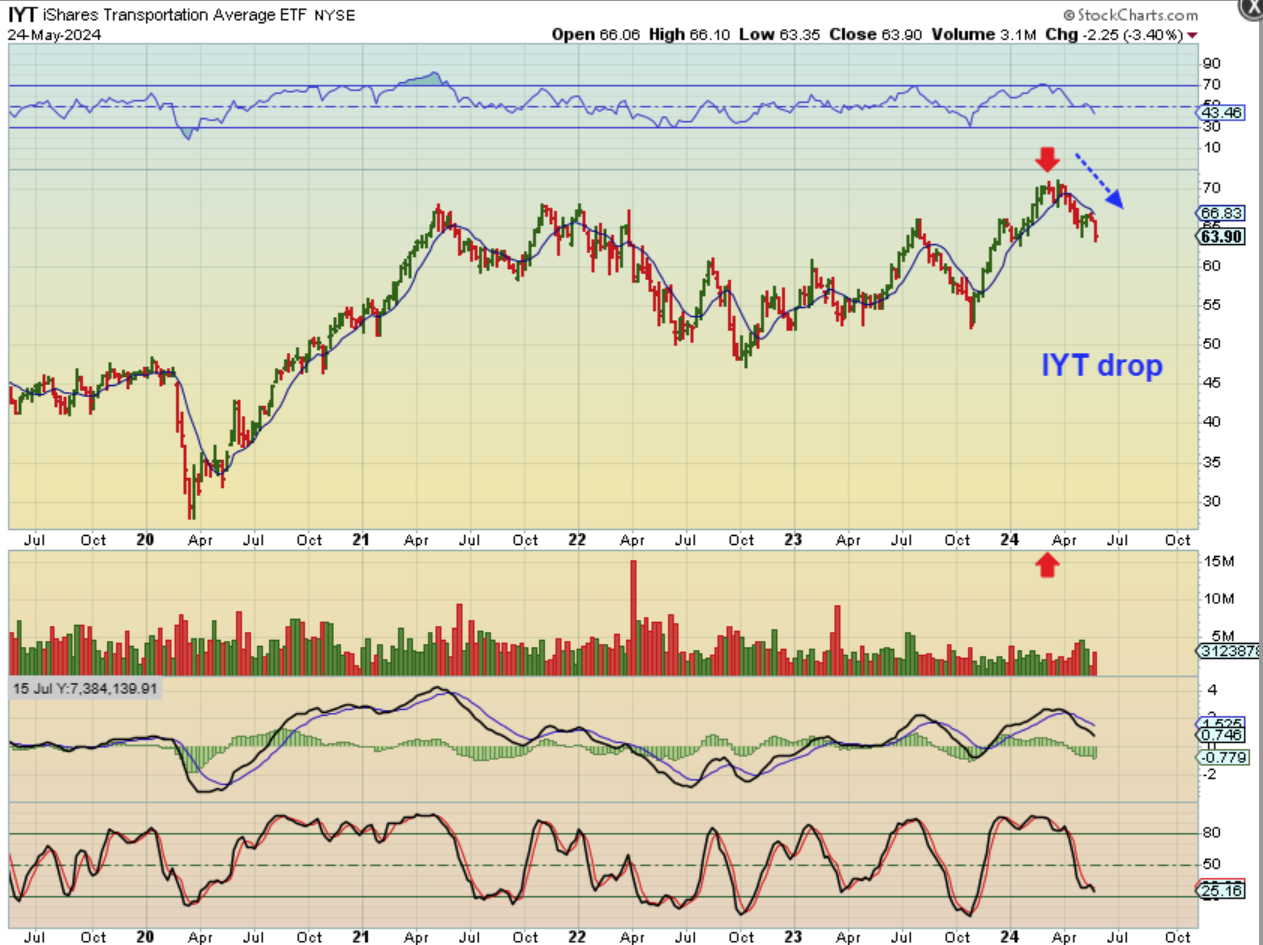
IYT ( Transportation Avg) – The IYT is not even close to the new highs and it also looks like a small head and shoulders pattern. Also…
.
THE TRAN has been lagging and is not even at 2 year highs. So when this happens, it can be indicating that the DOW trend higher will end, and we’ll get a drop from all-time highs where a correction can begin. I would expect that correction to start with the 2nd daily cycle, so we raise stops and stay awake. Shorting the markets could be an option after proof of a topping action, but before then I’d keep stops trailing to lock in great gains made out of the ICL.
.
So what about the DOW THEORY? In conclusion it is calling for the trend to end. The dip and push to new highs that we’ve seen daily cycle after daily cycle would begin to see lower highs and lower lows over time. THAT could be what we see the markets give us in the summer months. It is something to keep an eye on.
,
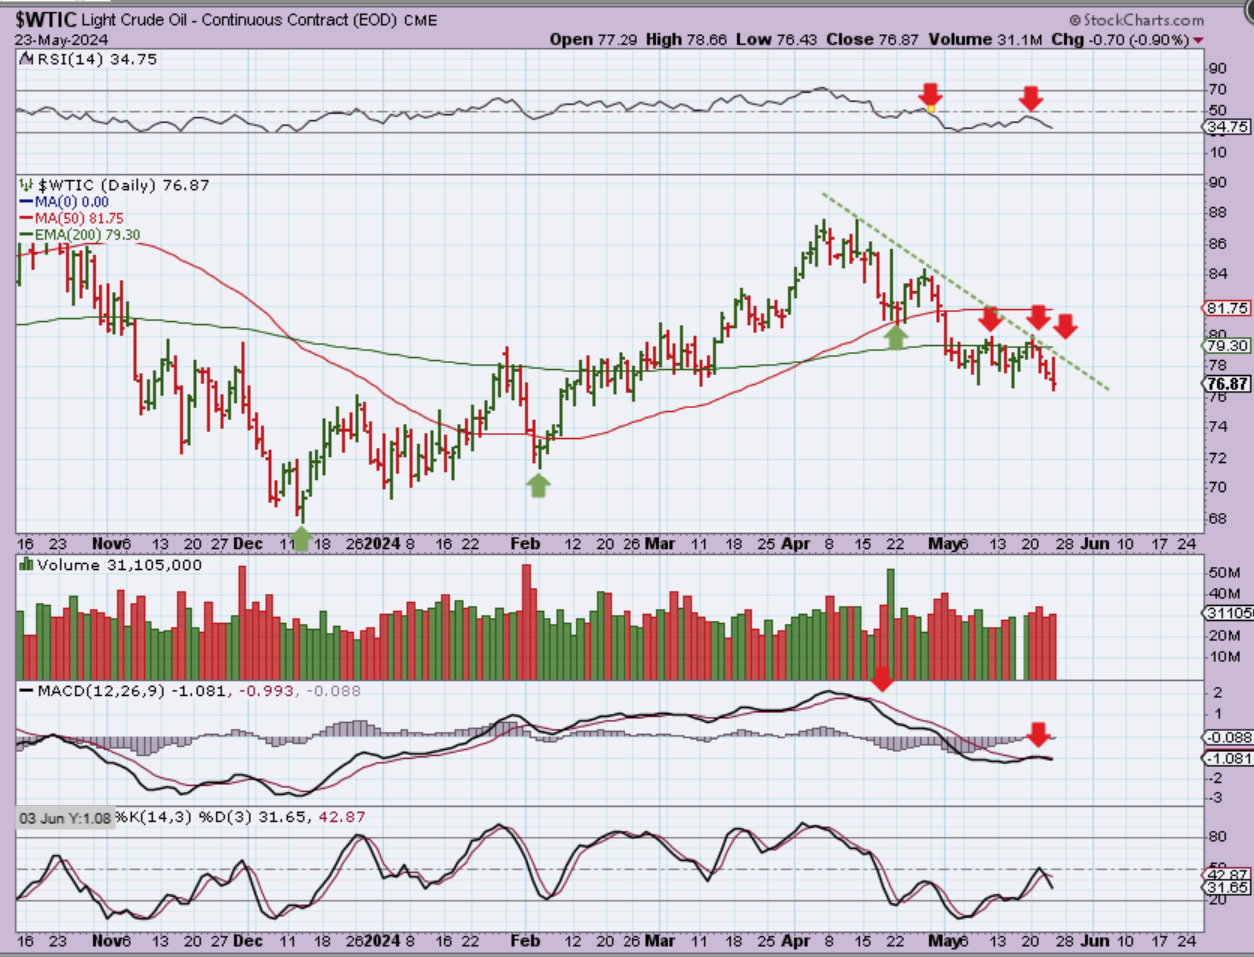
In Fridays report I said, “Oil tried to run up to that 200 ema or sma again, but it then sold off. I believe that we are in a weak 3rd daily cycle and Oil will drop even lower over time.” This only looks like day 23 or possible 40-50 days.
.
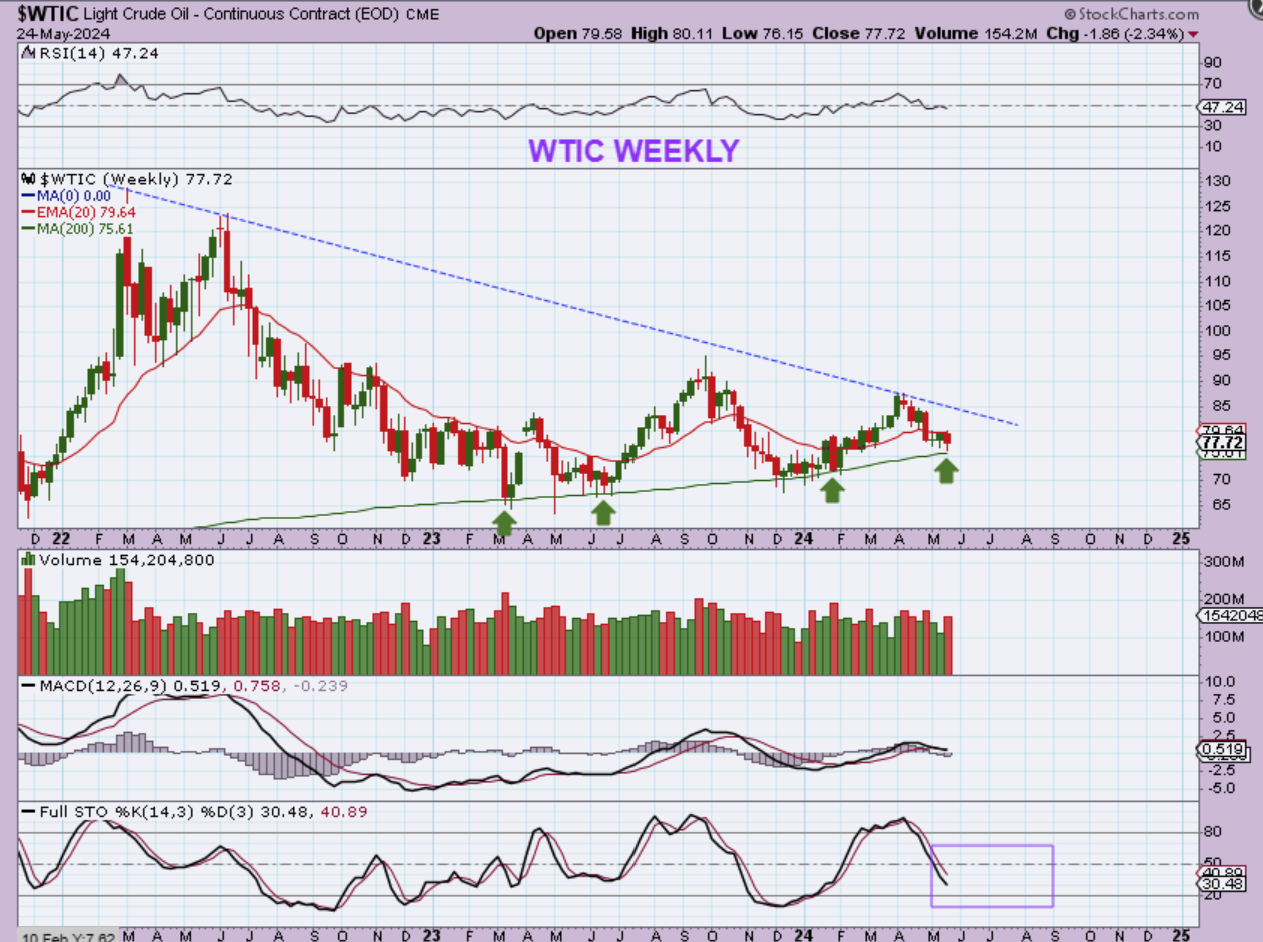
WTIC WEEKLY – Oil has landed at support, but I am actually still expecting more downside. Why? When we looked at the daily cycles in the chart above, Friday would only be day 24, so there is more time left in this falling daily cycle. As you can see, Oil has been very choppy week after week along this 200 ma in the past. That may repeat.
.
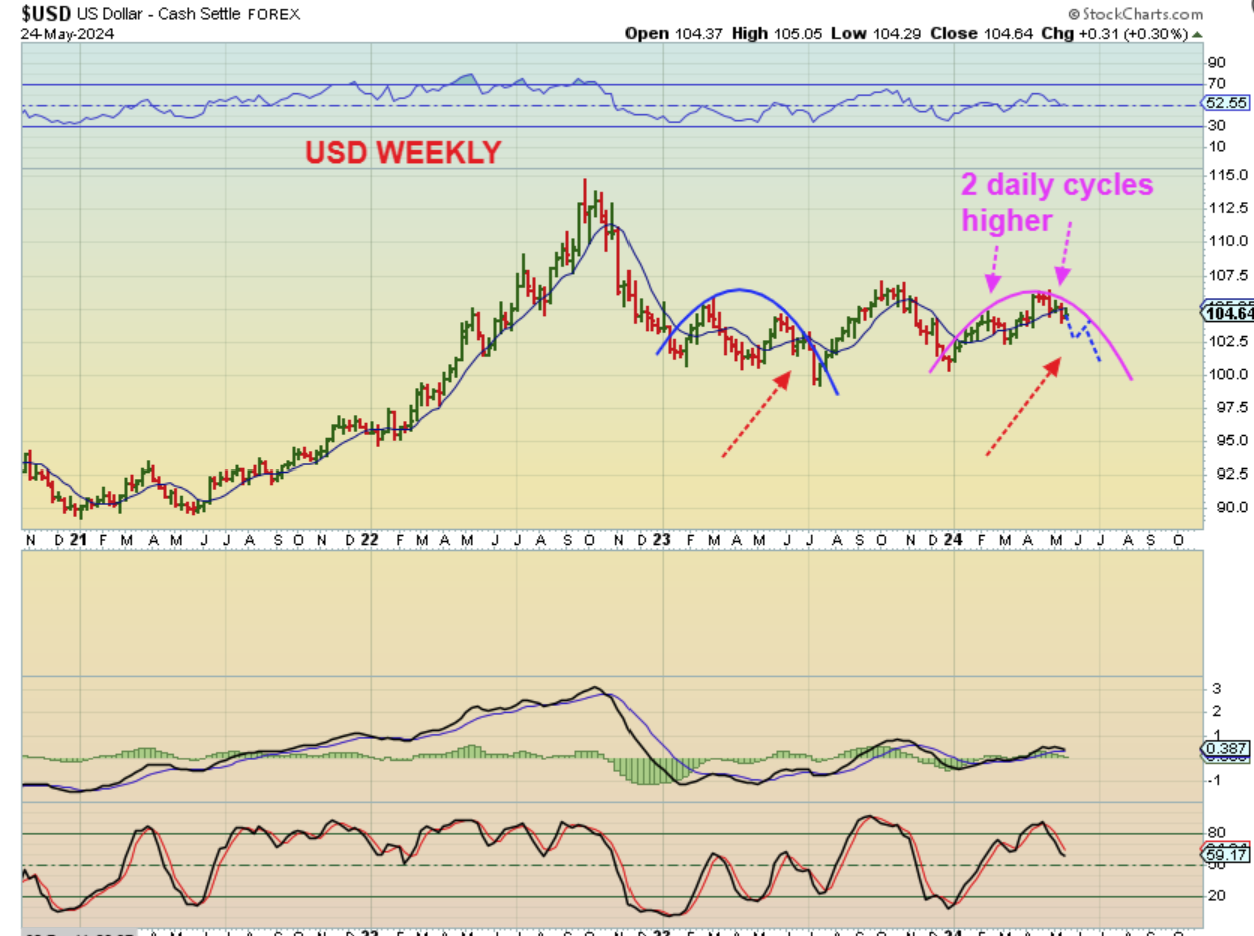
THE USD looks to have started the 3rd daily cycle and after an initial bounce out of the dcl, this one is expected to start to roll over as a failing 3rd daily cycle.
.
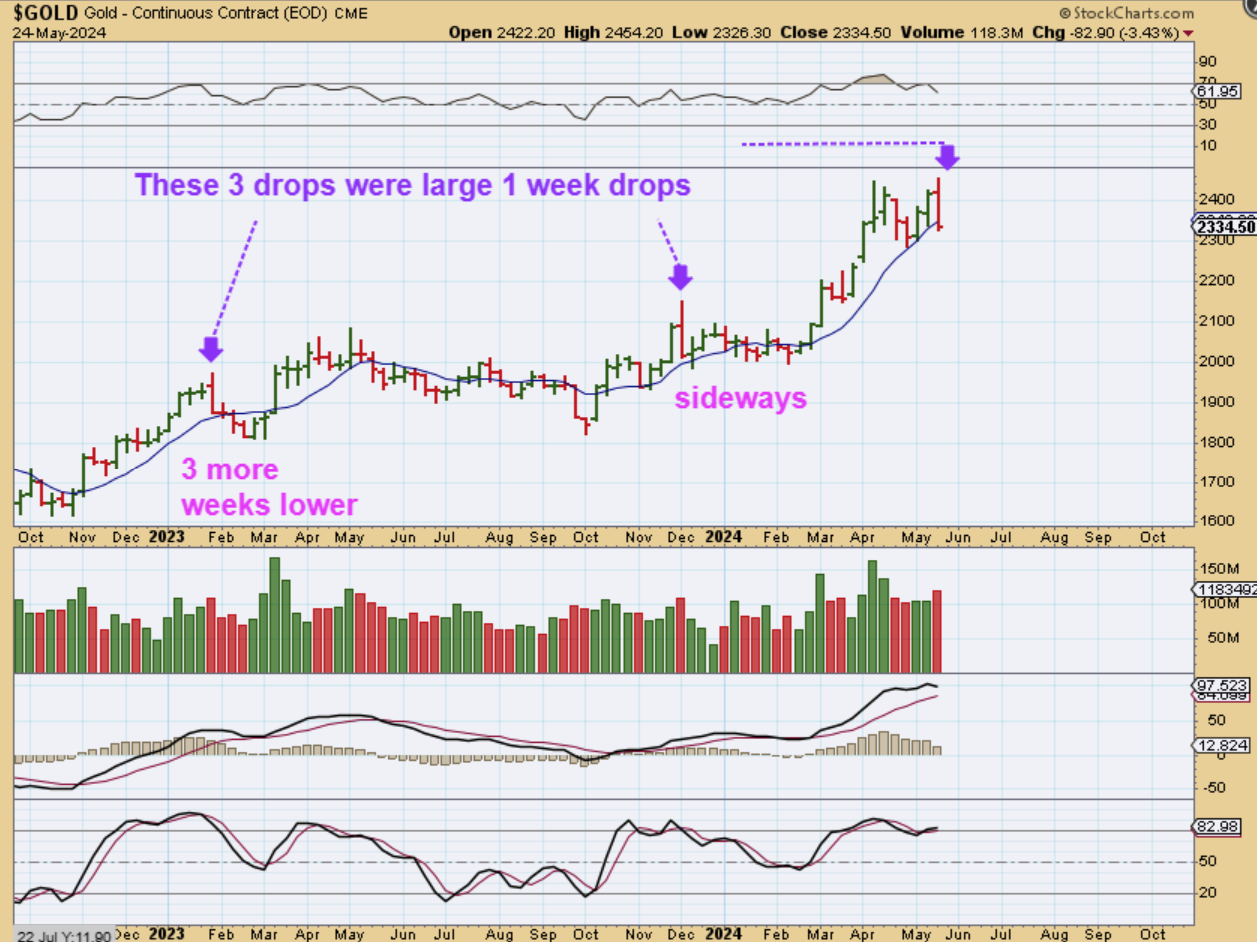
The GOLD WEEKLY CHART shows a sharp drop off of the highs last week. We did discuss that after those 2 strong daily cycles out of the ICL, this next 3rd daily cycle could form a L.T. With a sharp one week drop like that, does that mean we’ll now see a waterfall sell off? Well, it could be a double top, but…
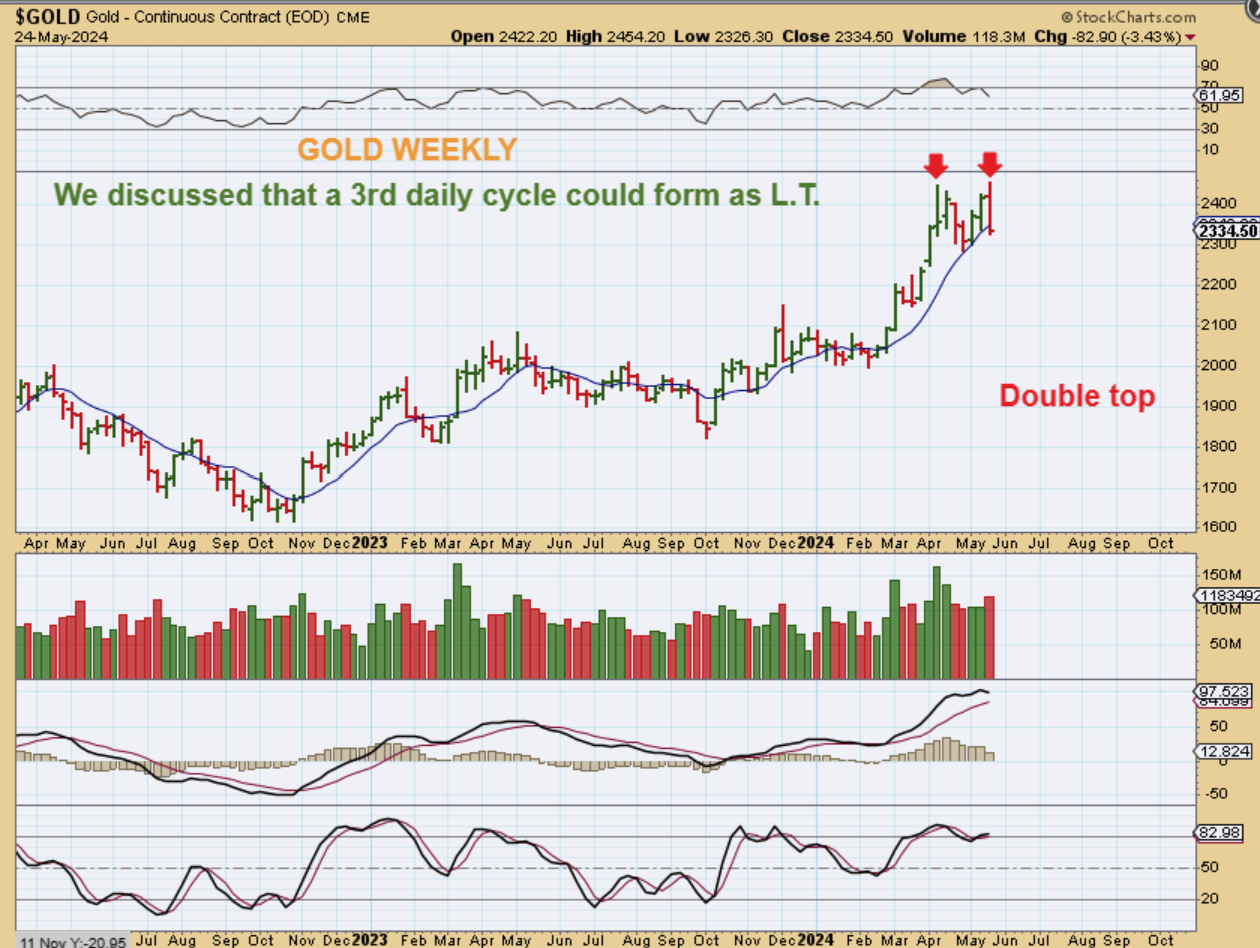
.
GOLD WEEKLY– With a sharp one week drop like that, does that mean we’ll now see a waterfall sell off? Not necessarily.
1. In early 2023 we saw a sharp drop and it WAS followed by 3 more weeks of selling, but it was smaller candles.
2. Notice that in December 2023 when we saw that Spike and reversal similar to now, Gold was actually green for 3 weeks after that, where I wrote ‘sideways’. So we just have to wait and see what we get next, but this ‘test’ of the other spike high has RSI divergence, and it could be signaling that a pull back is next for the 3rd & 4th daily cycles.
.
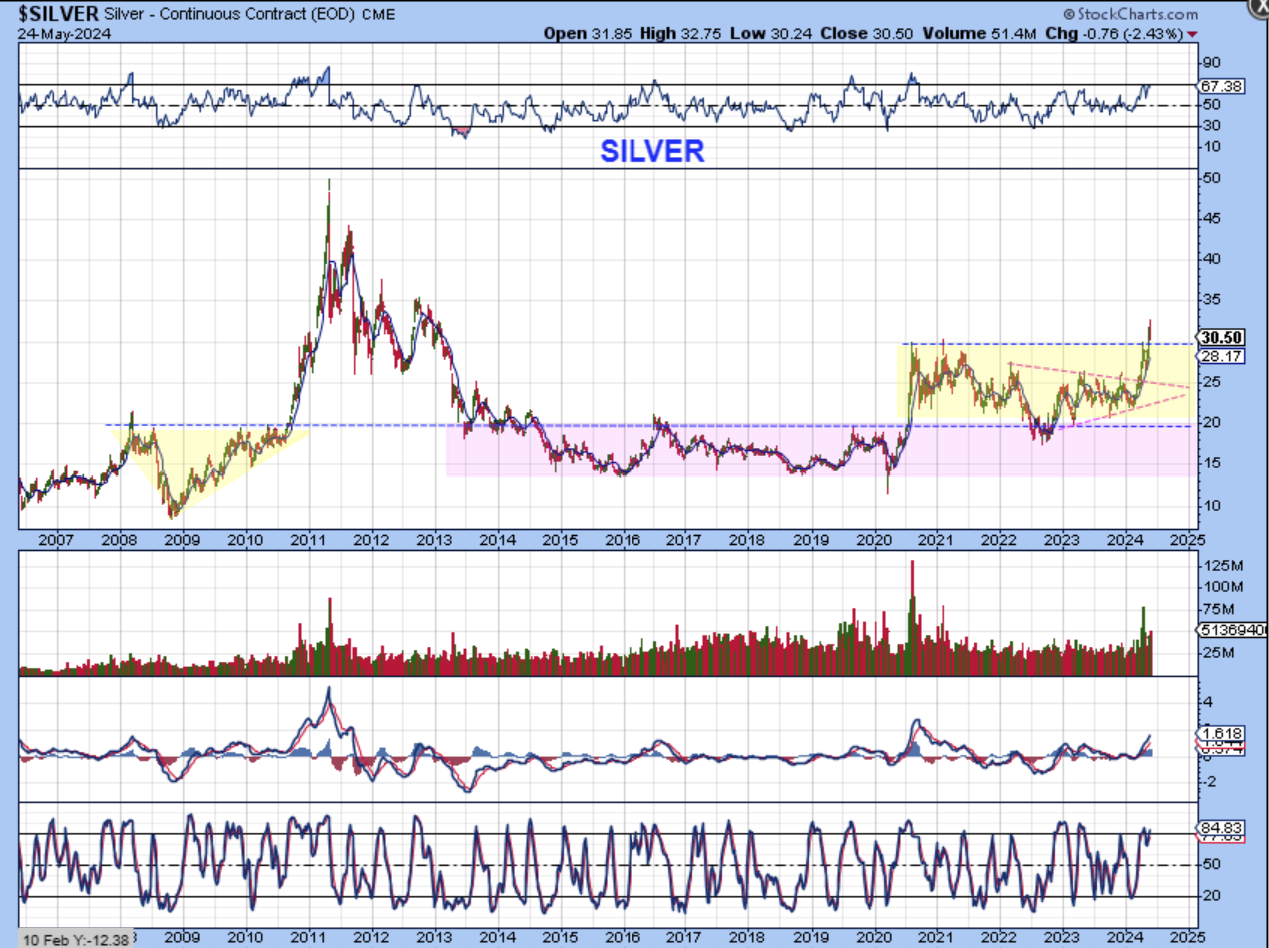
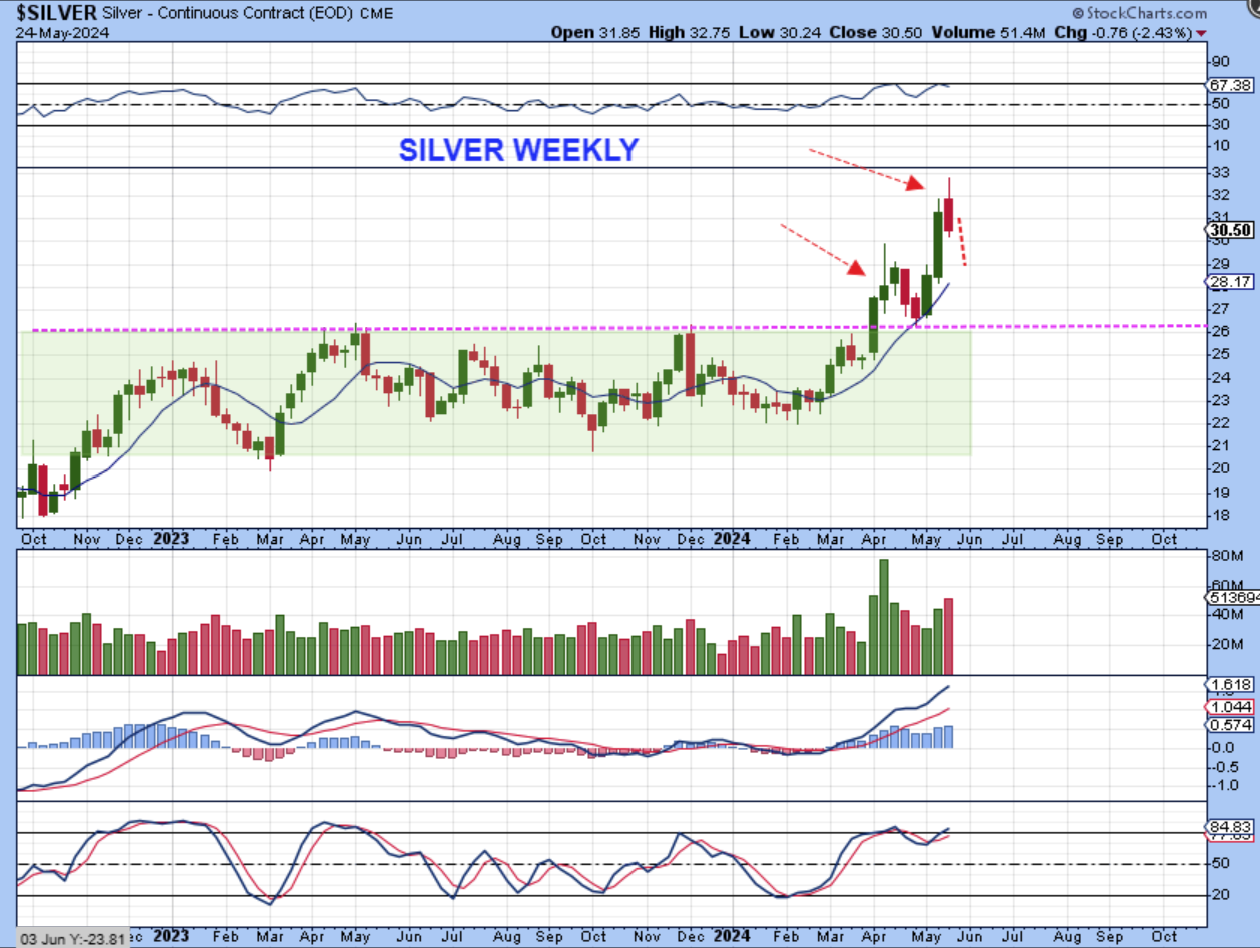
Silver broke out above that $30 area. If Gold and Silver are going to chop down into a dcl, that may just give us a Silver back test of that breakout.
.
SILVER reached new highs and then sold off on Wednesday and Thursday. The selling could continue and if it does, it would be giving us a L.T. Daily Cycle, since Silver peaked on day 12 of 16 so far.
.
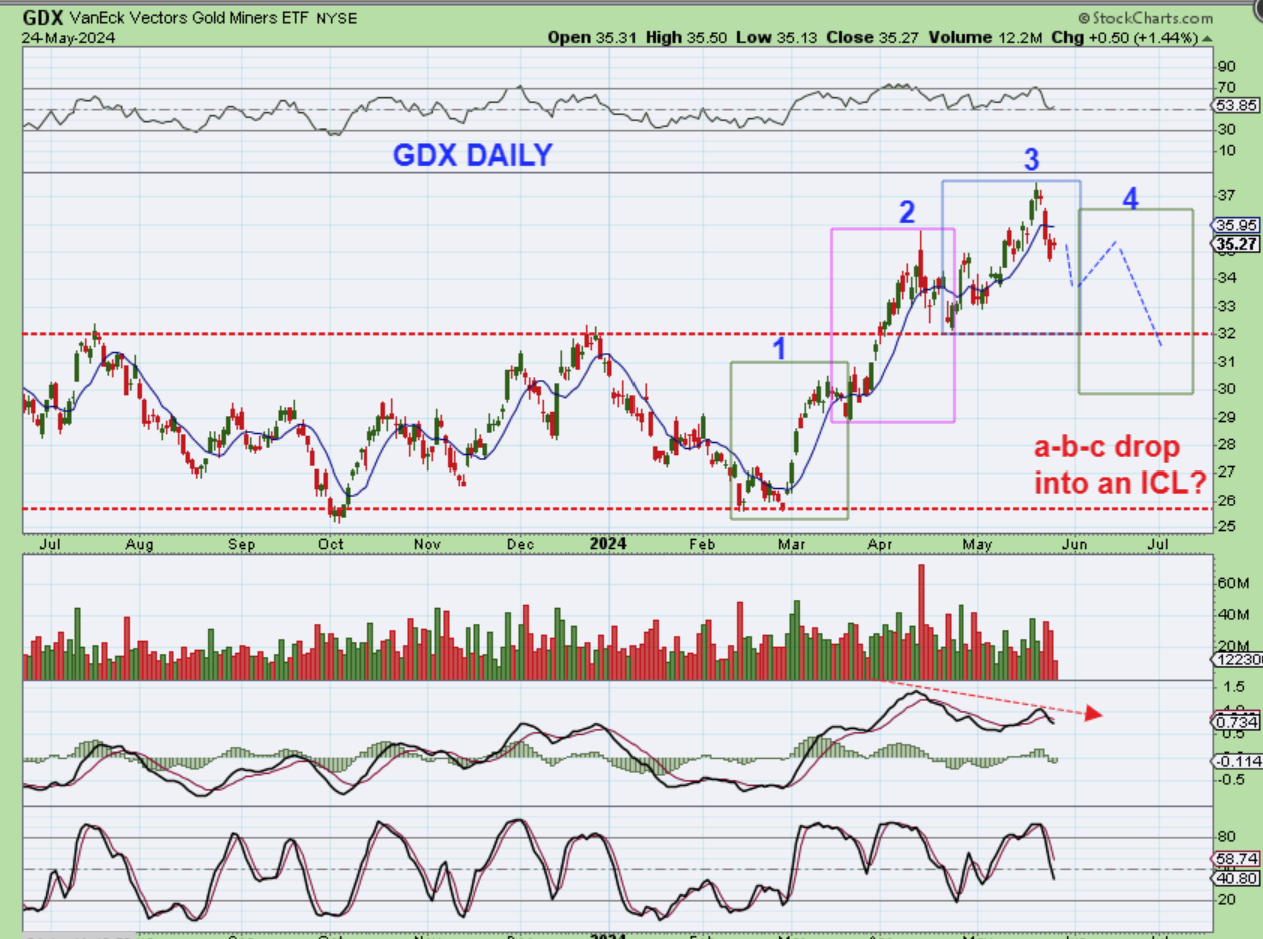
GDX had 3 strong daily cycles so far, but the selling also kicked in on Wednesday and Thursday of last week (FOMC Minutes were released on Wednesday too). The MACD had fairly strong divergence with the 3rd daily cycles high. This selling could lead to an a-b-c drop into the next ICL. I am not buying Miners until this plays out further.
Conclusion, we are deep in the 3rd daily cycle for Miners, it has been a strong run since Feb/March, but I think that it needs a rest.
.
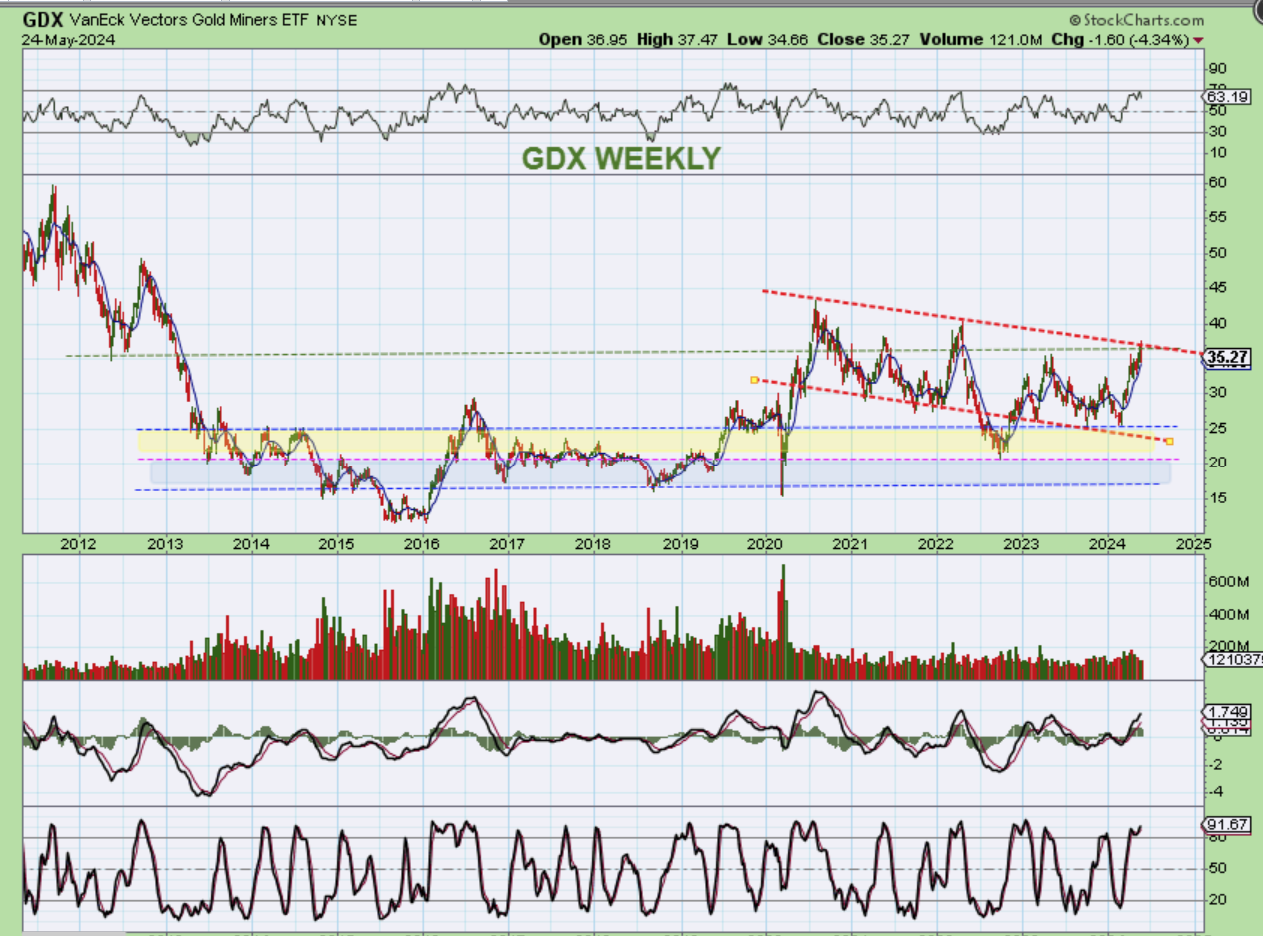
The Bigger picture for The GDX WEEKLY CHART shows that the Miners reached the upper trendline of a downward sloping channel. A pullback here would make sense, to build up some energy to break out in the future.
Conclusion: We are in the 3rd daily cycle and I am now expecting a pullback here, not a breakout (yet).
.
So we saw a pause in our bull runs this week and that choppy sell off may continue into next week too. We need to be mindful of the Dow Theory in play, because if the Transports do not confirm the trend, that trend can end (with a correction).
.
Oil remains choppy and this should be in a failed 3rd daily cycle with more time left to chop & drop.
.
Gold, Silver, and The Miners have had a strong run since the March lows and Oct 2023 lows (ICLs), but when they enter a 3rd daily cycle, usually 1 of 2 things can happen.
1. That 3rd daily cycle can peak as right translated, and then they drop in the 4th & maybe a 5th daily cycle (to the next ICL), or
2. That 3rd cycle can peak L.T., maybe by day 10-13 or so, and then they drop into a dcl followed by a 4th daily cycle into an ICL (and maybe even a 5th daily cycle, we just have to watch and see). So far we’ve been seeing 4 daily cycles and then the bull starts to run again.
.
For my personal trading, I’ve begun shifting most of my attention to Bitcoin, and you’ve seen me discussing that a lot lately. I’ll discuss that below.
.
Enjoy your weekend, which is a long weekend in the U.S. !
.
~ALEX
.
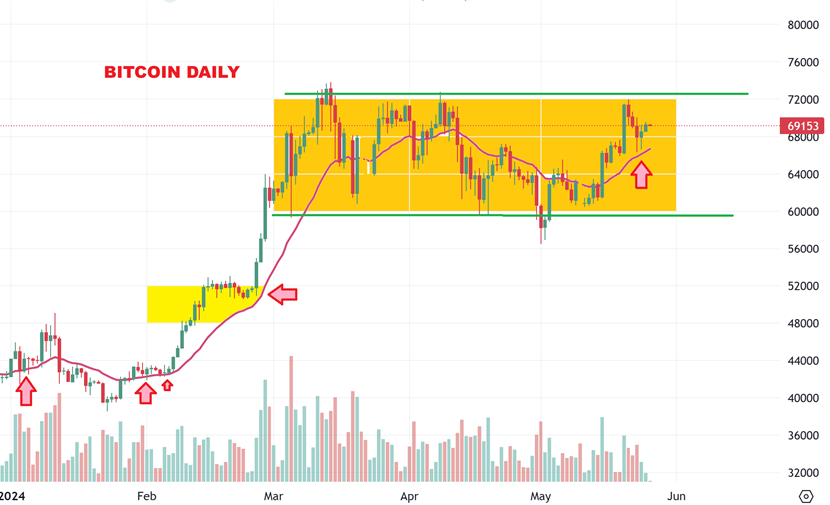
BITCOIN :
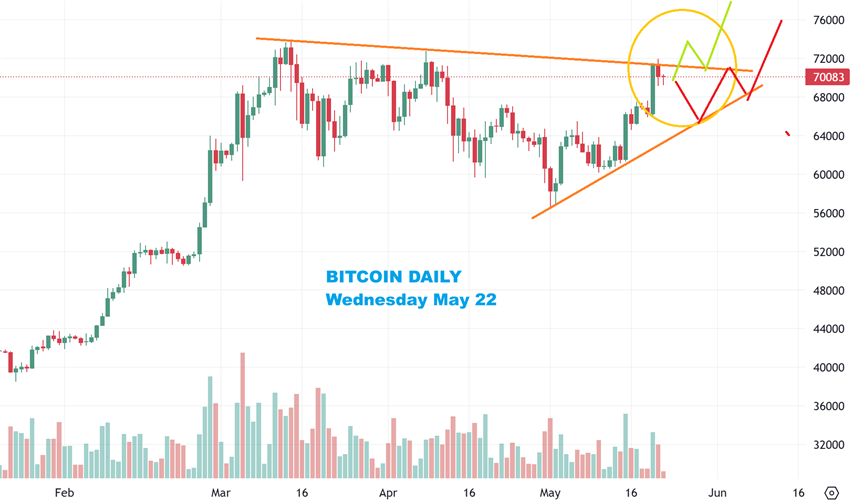
EARLIER IN THE WEEK WE LOOKED AT BITCOIN LIKE THIS: It could break out or pull back and then break out.
.
BITCOIN – So far Bitcoin pulled back, and…
.
BITCOIN reversed right above the 20 ema, which did act as a support area on the last run higher. I really think that it is just a matter of time before this consolidation breaks out and runs higher.
.
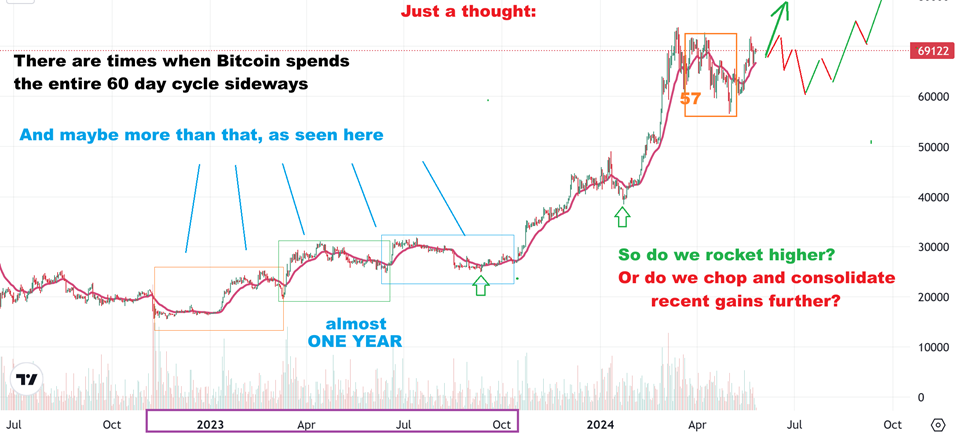
JUST A THOUGHT – A SIDENOTE. I’M JUST THINKING OUT LOUD HERE:
.
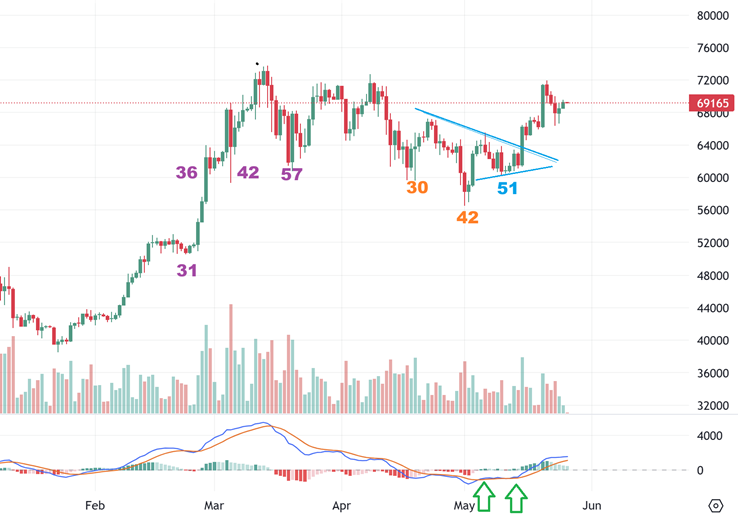
BITCOIN just spent a 60 day daily cycle going sideways, and we’ve seen that in the past too. Actually, we have seen multiple cycles stacked up sideways with chop as seen on this chart, right? Price went sideways & slightly higher for roughly an entire year last year. Could we chop again like that in THIS daily cycle? Maybe / Maybe not, we just don’t know, so I drew that in on this chart.