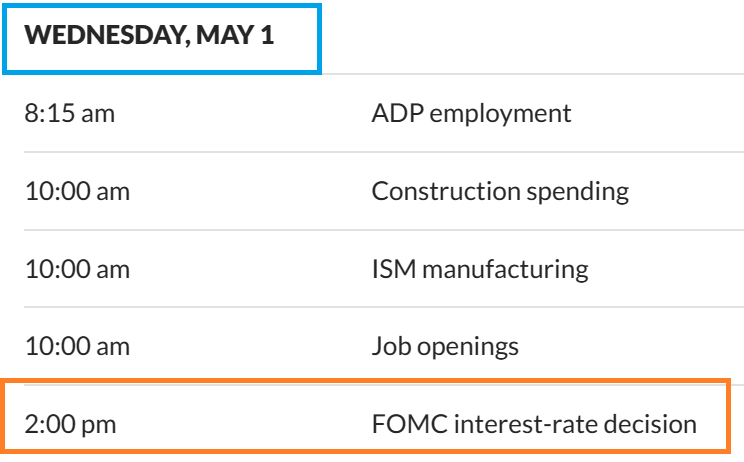
May 1st – Fed Wednesday
DATA – Today is the FOMC Meeting, and what else can I say that you don’t already know? It gets VERY volatile after 2 p.m. and especially during the 2:30 speech and Q&A That follows, so let’s just say the final 2 hrs of the day. We have seen a change in the inflation data readings, so we may see a change to the Feds approach going forward. Starting at the end of last year, Chairman Powell has discussed rate cuts in 2024, and that has caused a rally in the Markets and Precious Metals. Now that could change since inflation has perked up, and THAT could affect what he says today, which in turn could affect the reaction of the markets. On to the charts…
.
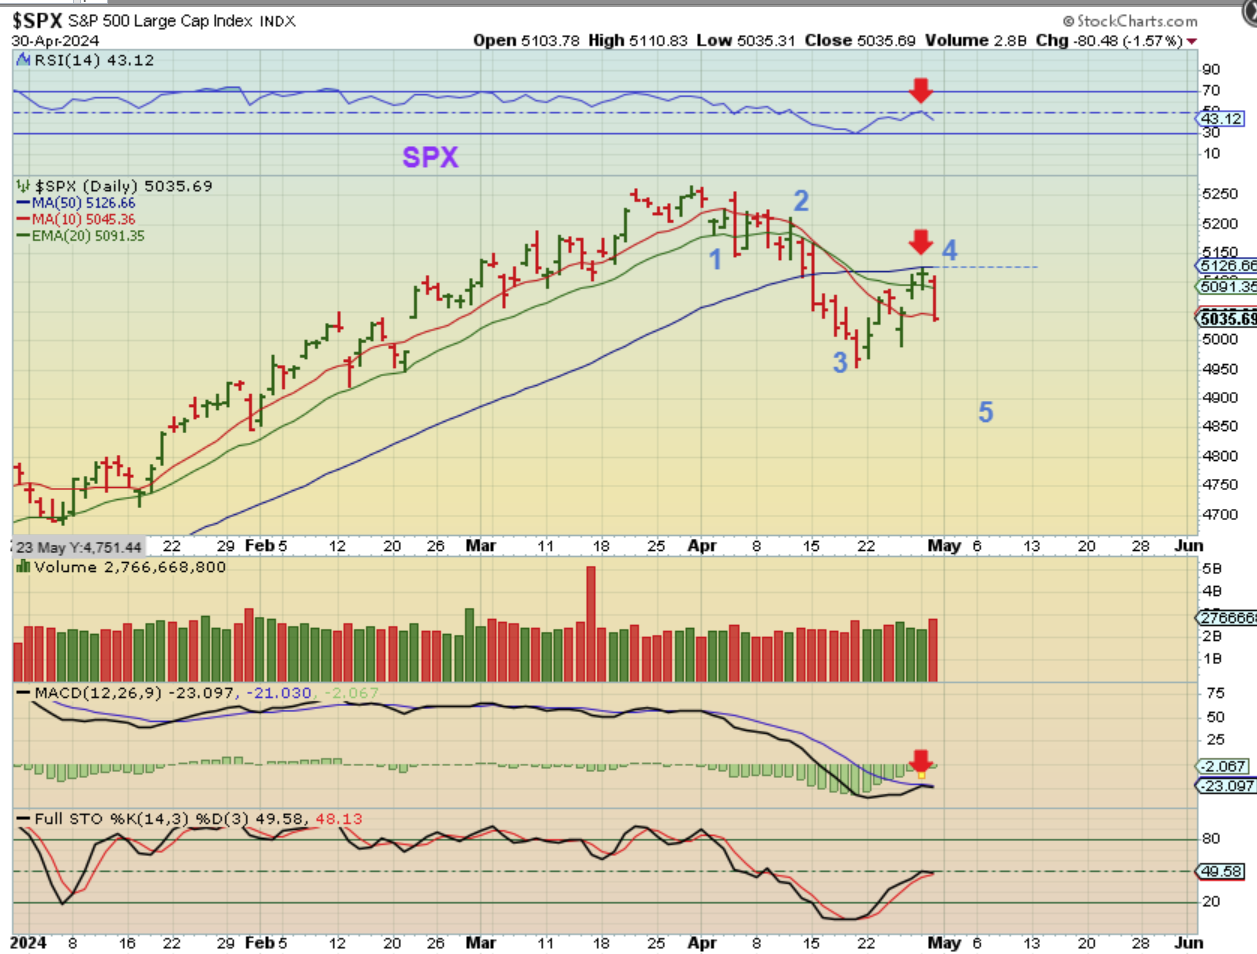
SPX – I had discussed the back test of the 50sma and a possible 5th wave down. It does look like that drop has started and the FOMC MTG could give it an extra push lower. The MACD and the RSI never did cross bullishly on this 6 day bounce.
.
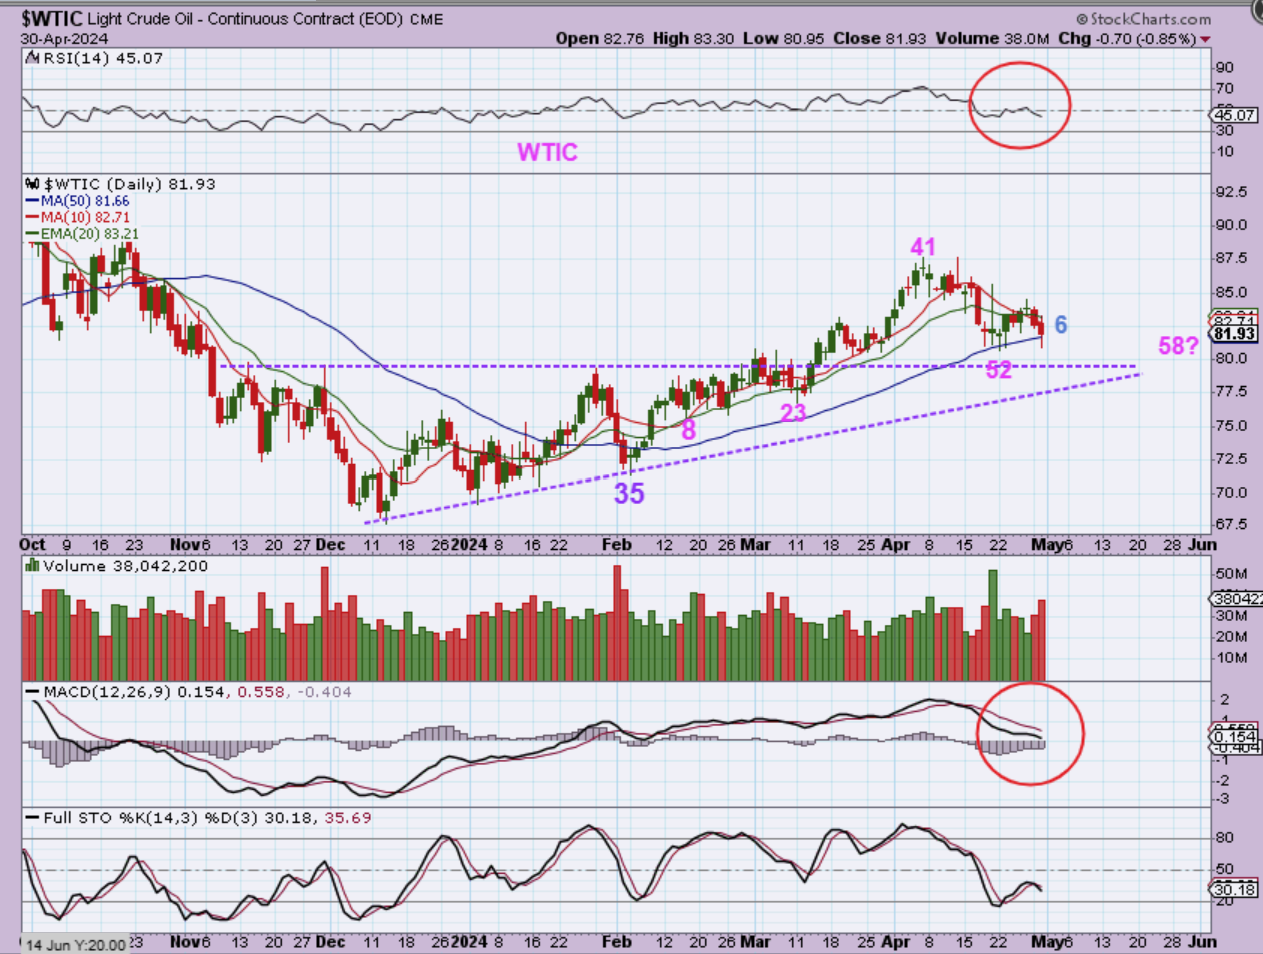
WTIC – Oil really should have a dcl in place at day 52, but it did only close above the 10sma for 1 day. Even with that, it should be the dcl and this should be the 3rd daily cycle. Day 6 threatened the day 52 lows and bounced back to hold above the 50sma yesterday. We need that to continue, but this does look to be weakening for some reason.
.
Sidenote: If that was NOT day 6 and we were still in the 2nd daily cycle, then it would be day 58 -OR- it also may mean that Oil just peaked on day 4 and is in for a long daily cycle lower (less likely). Less likely, but Oil stocks had a rough day too…
.
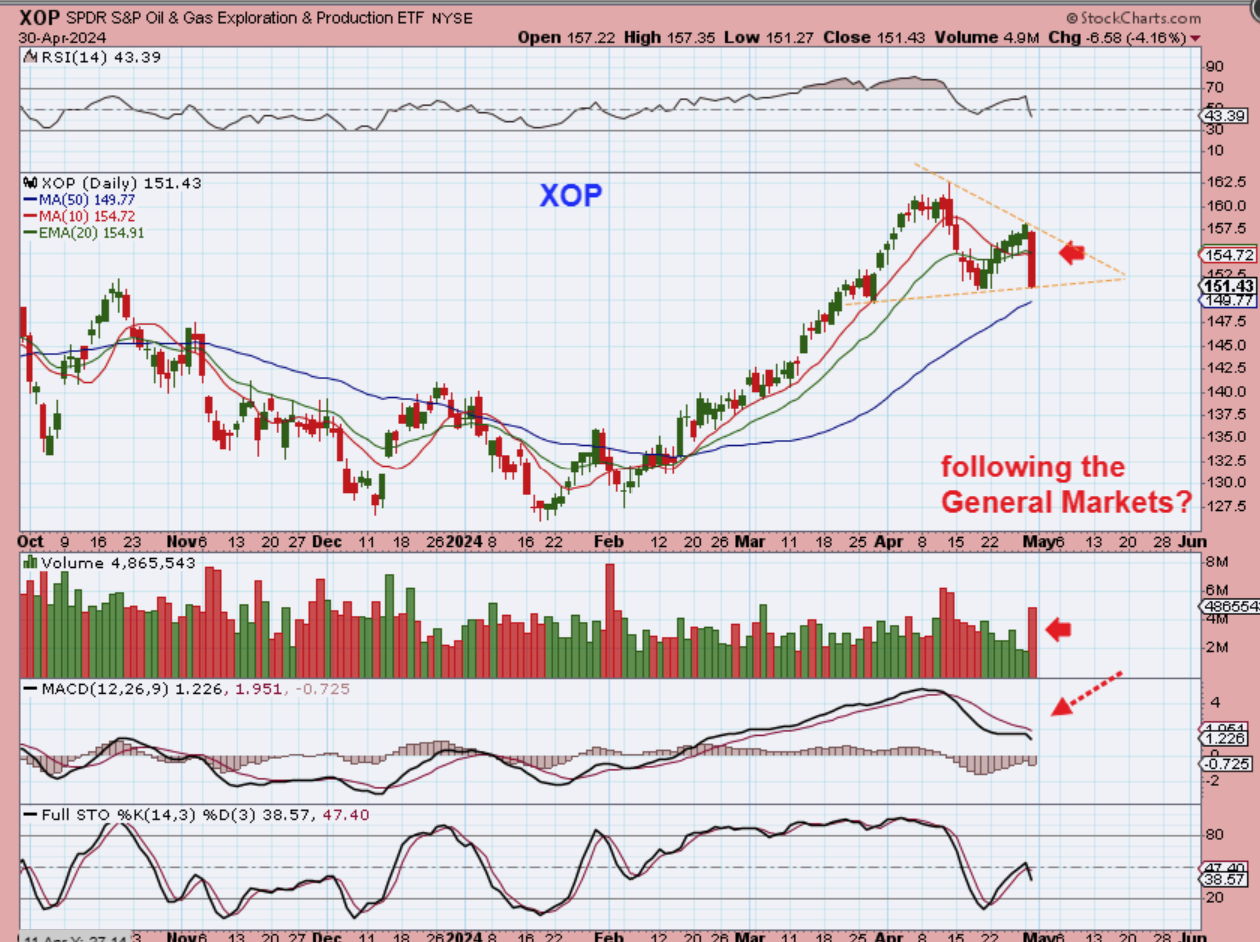
XOP – Did Oil Stocks follow Oil and The General Markets down? That sharp drop erased 6 days of a rally, and this is suddenly ugly too. To be honest, this does not look pretty and…
.
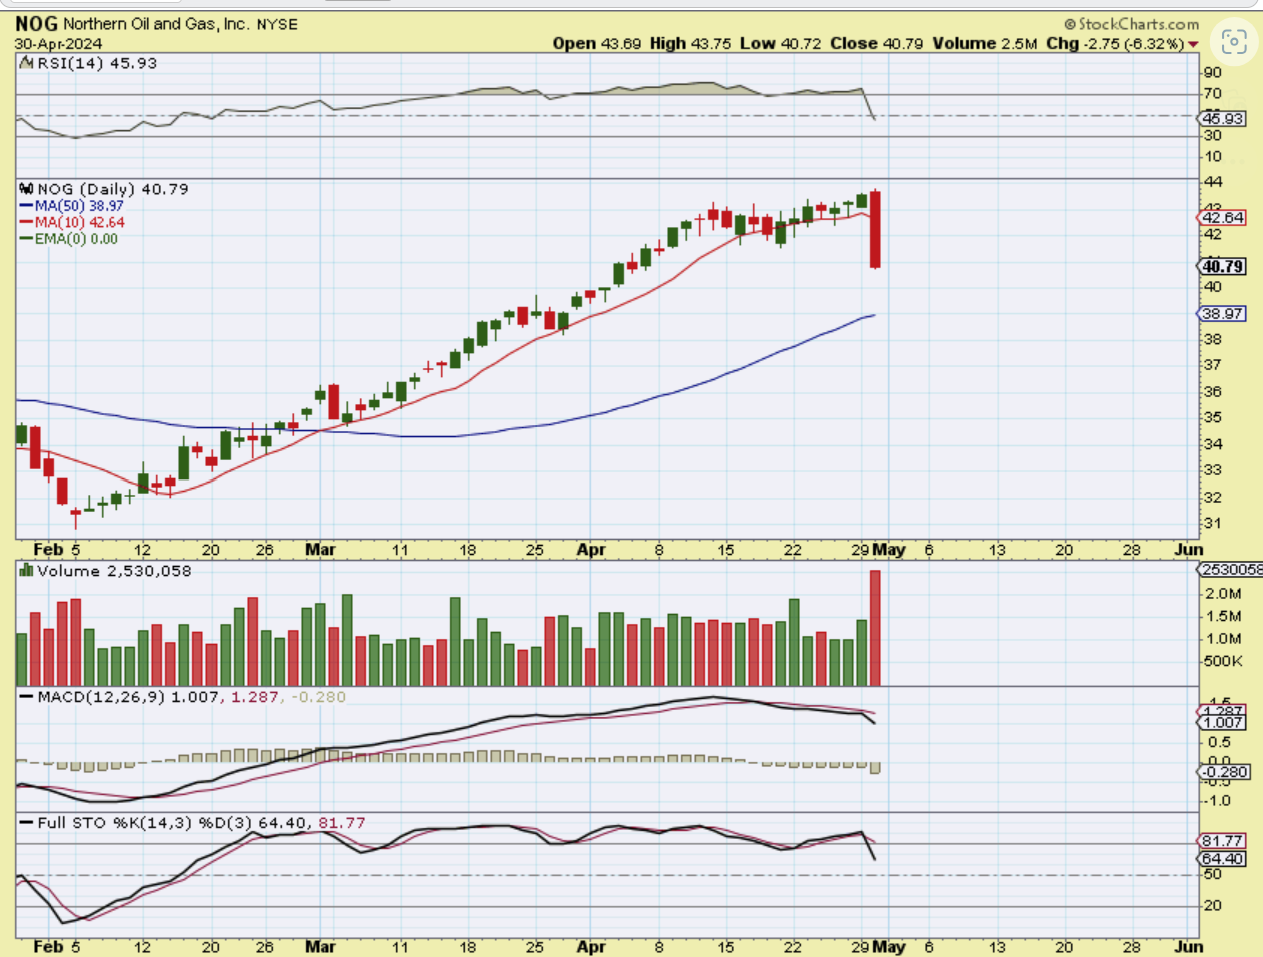
What about the strong leaders that I liked? I have always talked about NOG, ERF, MRO, VLO, OKE, etc and I buy NOG when I trade this sector. Well, they all pulled back too. (NOG ACTUALLY RELEASED EARNINGS AND THIS WAS THE HEADLINE).
.

..
Did this simply follow the markets and Oil down? This was the result of an earnings beat? A high volume plunge for NOG? When I buy a stock, I have certain expectations, and this isn’t one of them. I would have sold this with a stop under that low 7 days ago, and wait to see how the dust settles. There is no reason to hang on and possibly ride this down.
.
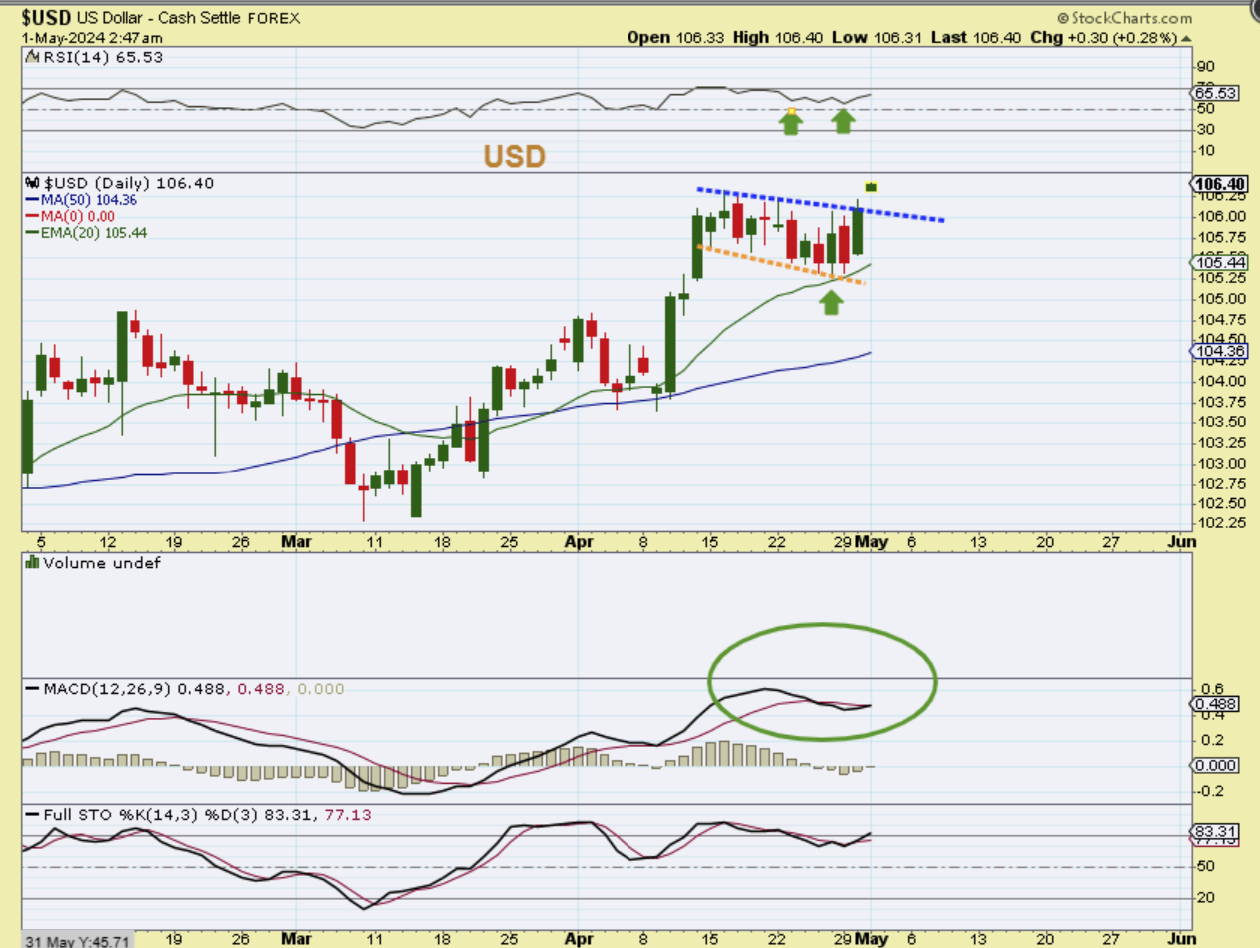
The USD pushed higher out of this bull flag.
.
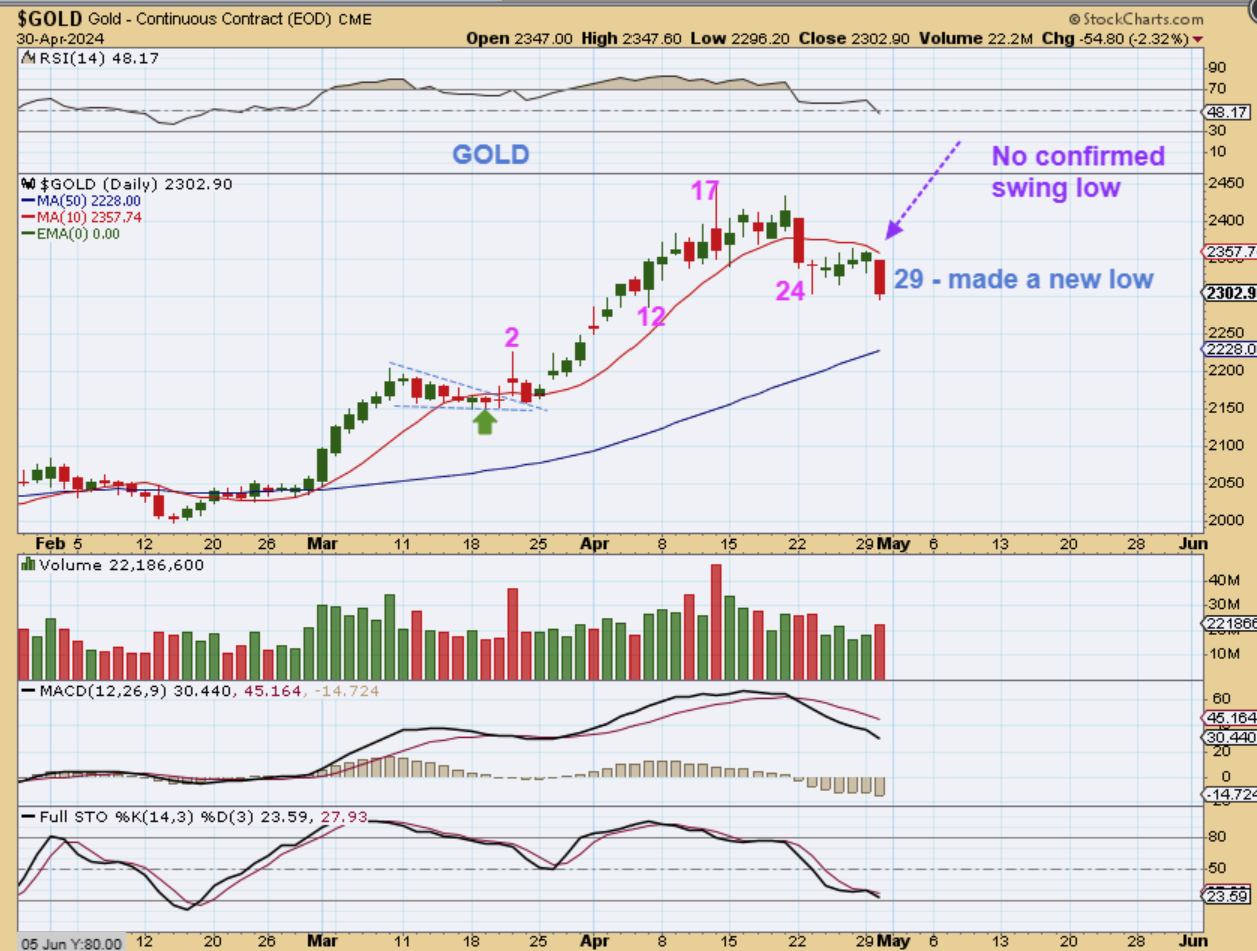
GOLD did not confirm a dcl on Monday or Tuesday by closing above the 10sma, and it actually dropped to a slightly new low yesterday. That makes this day 29, and it looks like we may be heading back to the longer daily cycles. Will it bottom on day 30, which is The Fed Day? Will Gold bottom on day 31, which is the day after the FOMC Mtg? We just have to wait and see how it plays out, but it could fall down to the 50sma and that may be a dip for the rest of this week.
.
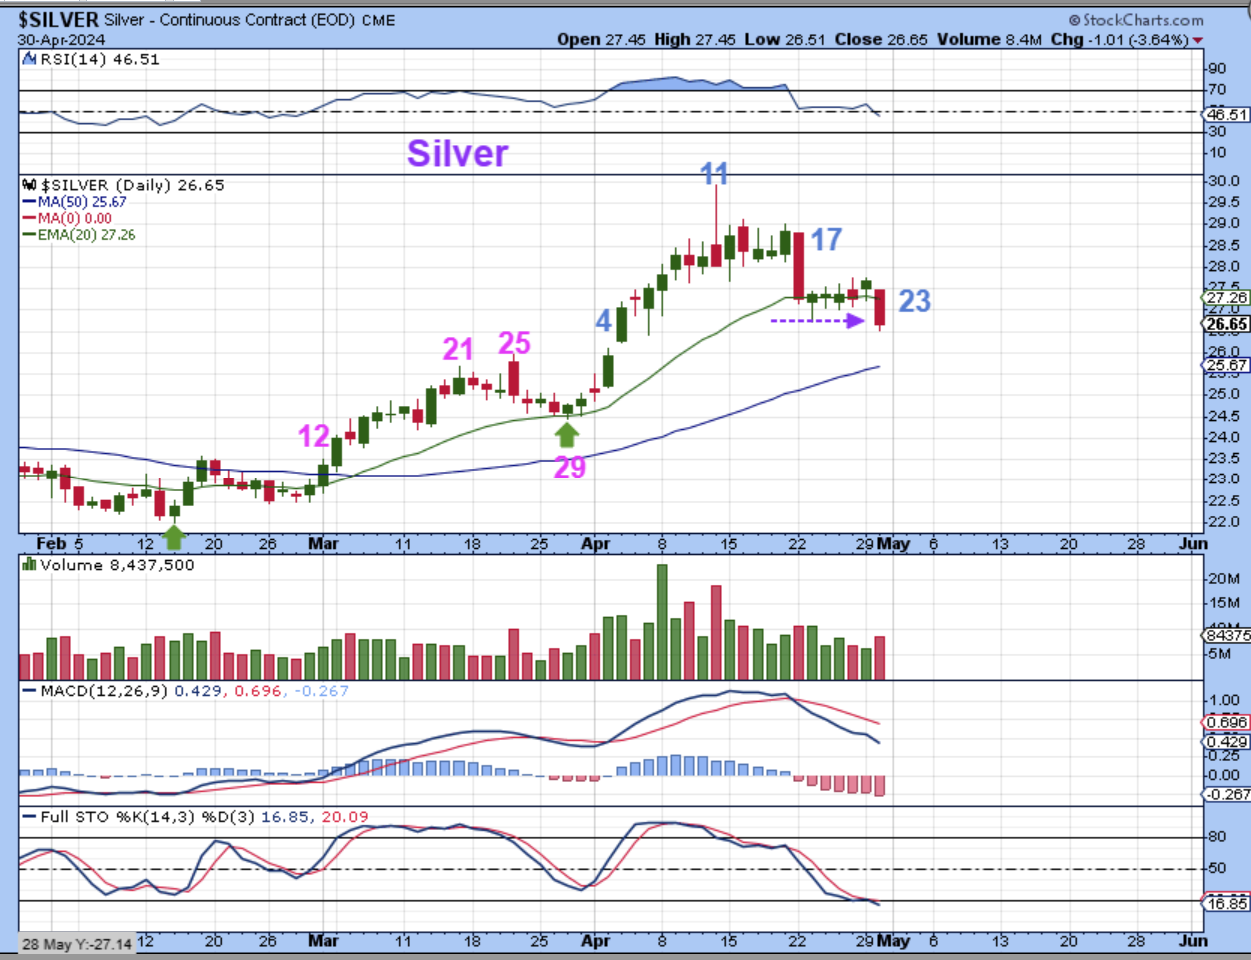
SILVER also made a new low (The daily cycle count was short with Silver, so we somewhat expected this). This is day 23 for Silver. I’d love to see the 50sma hold price or have price dip below and recover as a shake out. That could happen on Fed Wednesday or on the day after, but again, we have to just wait for the swing low to form that dcl.
.
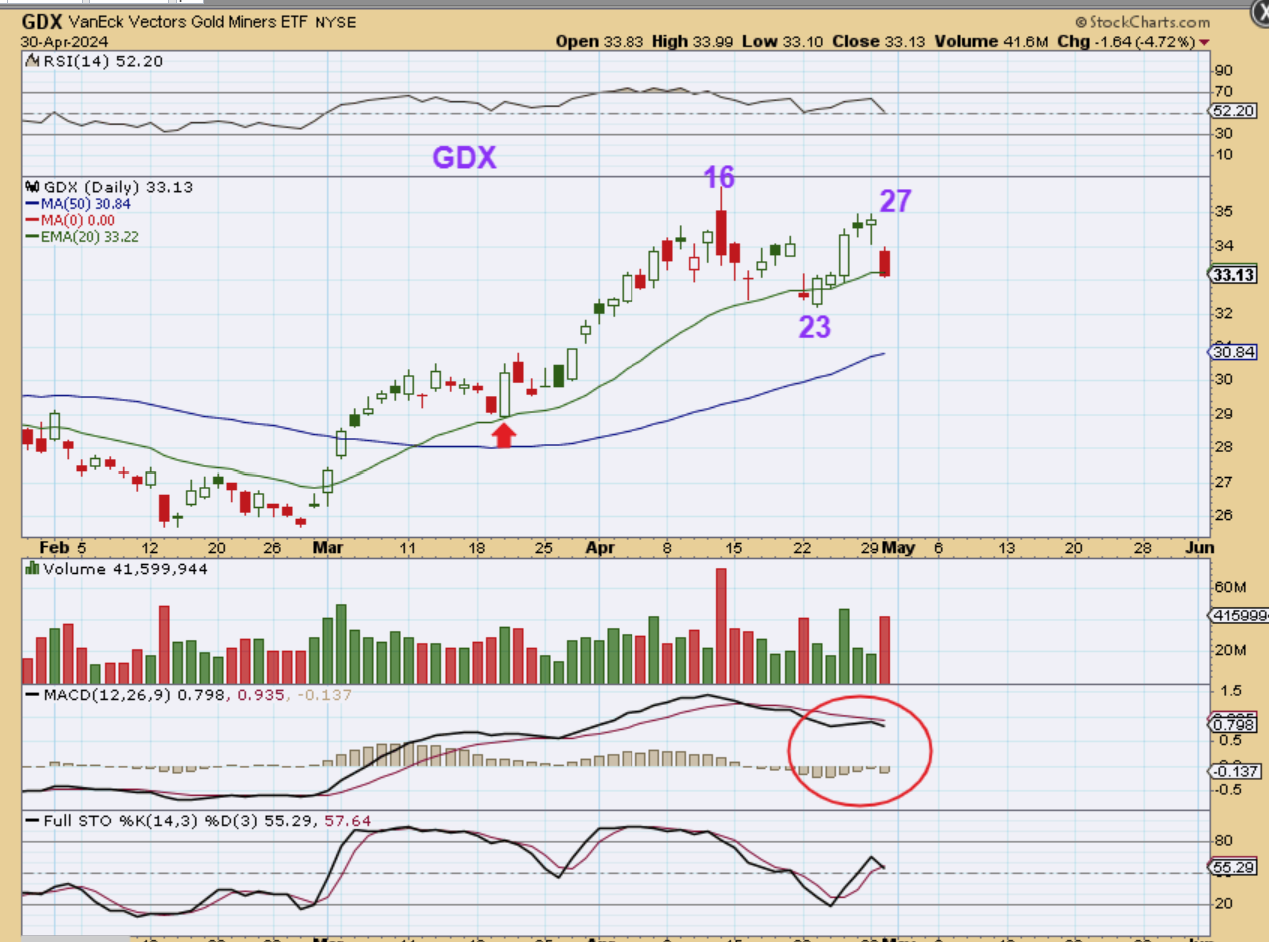
GDX itself is on day 29 on Fed Wednesday(or day5?). Day 23 dcl is usually considered early, but lately day 25 lows were acceptable, so we’ll just see what happens after the Fed Speech today.
.
The General Markets were rejected at the 50sma, and that was mentioned as a possibility last week. That was where I wanted to try to go short and I actually did go short all yesterday when the markets reversed, but when the MJ Stocks shot up with huge volume, I jumped in a few of those and closed my short to focus on the other 5 stocks. Well, today is a Fed Wednesday and that usually causes a lot of volatility and indecision, so prepare accordingly. The Precious Metals Sector used to put in a dcl after day 32, and that would be next week, but lately the dcls have been very early, near day 25. That means that we could see the lows form on or shortly after the Fed speech. All we can do is wait, but it feels like the opening Theme Picture as we approach that time period. I will discuss Bitcoin and MJ’s below. Enjoy your Fed Wednesday?
.
~ALEX
.
Yesterday I wrote: BITCOIN is basically doing what I thought it would with that failed daily cycle.
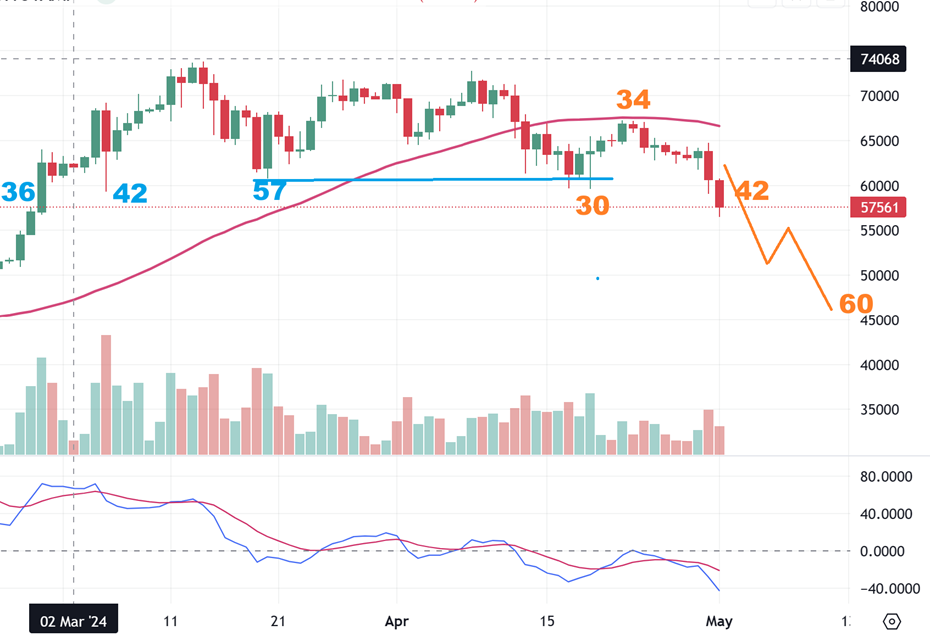
When we get to the day 60 area, this may offer an EXCELLENT buying opportunity, but for now it has failed and then was rejected at the resistance area of the 50sma. It will likely stay under the 50sma for the rest of this daily cycle. I have mentioned that I am watching the $48,000 to $52,000 area to possibly bottom .
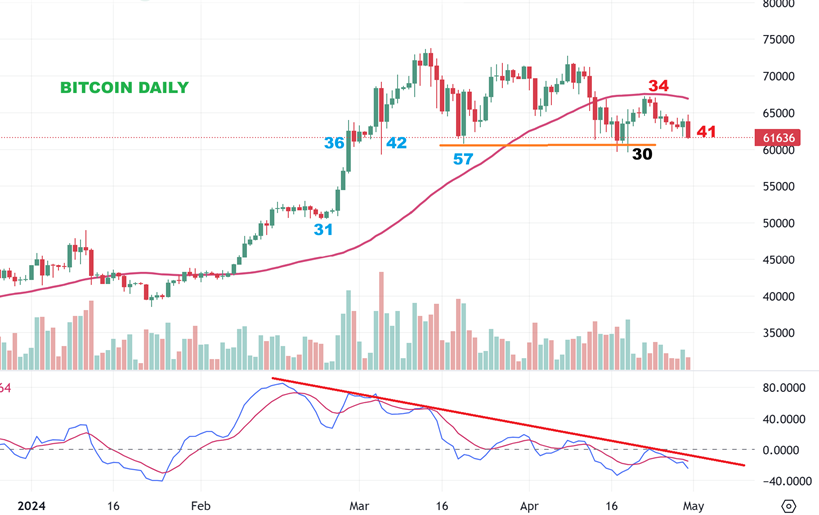
BITCOIN; Day 42 actually has now broken below that half cycle low at day 30 too, so this is playing out as expected. When we reach a low at day 60 or so, THAT may offer an exceptional buying opportunity. That would now be roughly 20 days away (3 weeks away, because this trades 7 days a week).
.
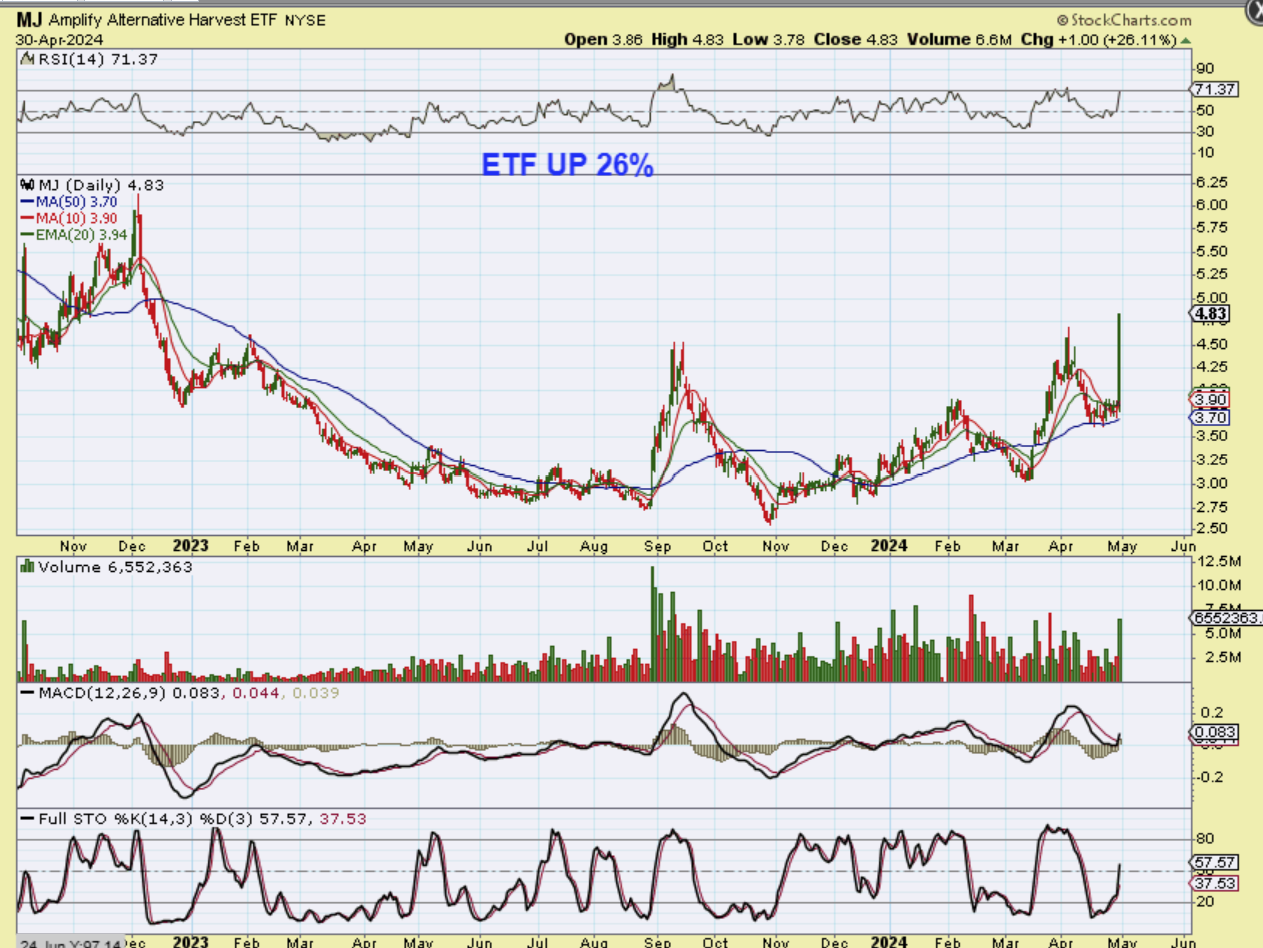
MJ ETF – Since when does an unleveraged ETF jump up 26%.
Yesterday at 1 p.m. ET a report mentioned that the Biden Administration will reclassify Marijuana into the same category as Tylenol or any other over the counter medicines. I saw every MJ Stock POP on HUGE volume and intraday I got a major buy signal, so I jumped into CGC, ACB, SNDL, OGI, and VFF just as quickly as I could. Let me show you some charts to explain…
.
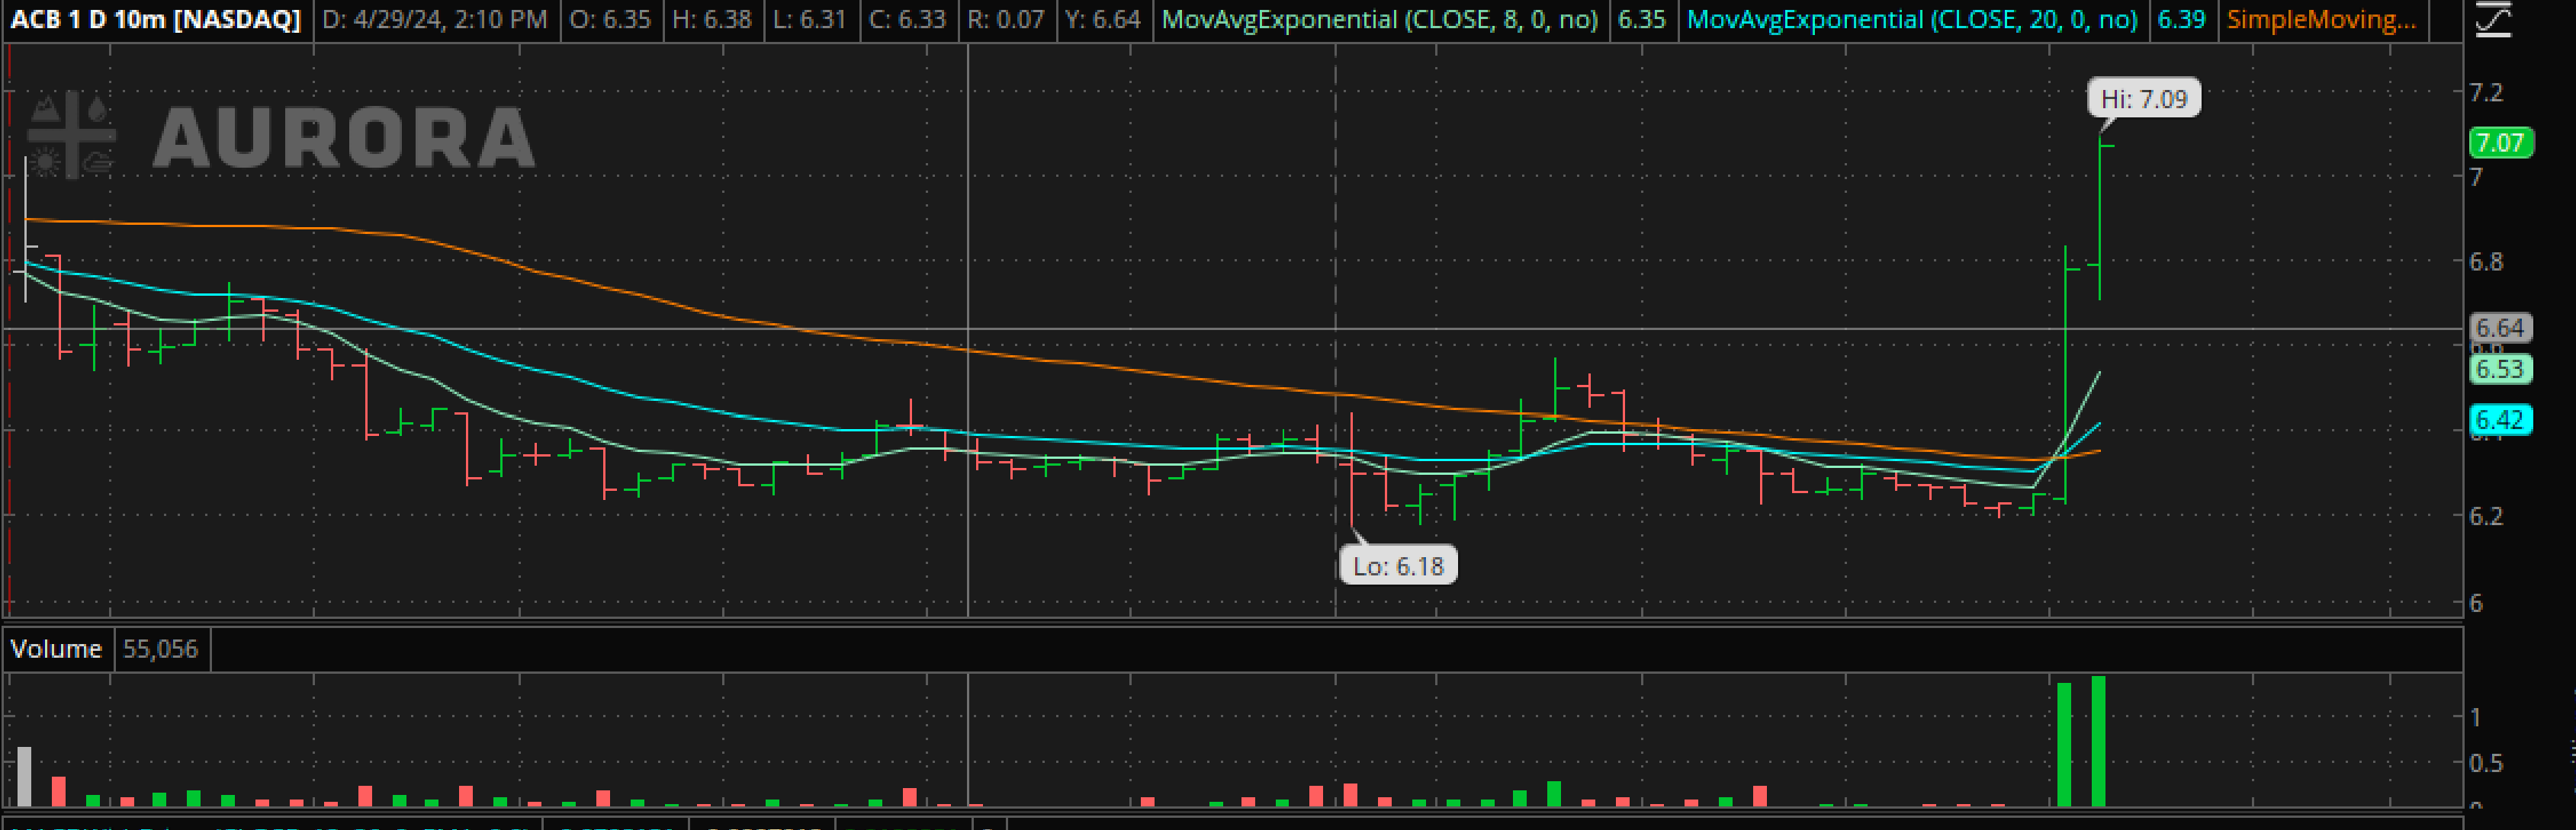
ED & I had discussed that ACB and CGC were on support on Monday, so that was a buy with a stop. I then saw every MJ Stock POP on HUGE volume and intraday I got a major buy signal, so I jumped into more CGC, ACB, and added SNDL, OGI, and VFF just as quickly as I could. I then posted in the comments that something was happening in this sector. Let me show you some charts to explain…They went from up 5% to up 8% and then just kept climbing and with some up 40-80%, I sold 1/2 or more in case they drop back on Wednesday.
.
I POSTED THIS LIVE TO SHOW THE INITIAL POP THAT CAUSED ME TO BUY MJ STOCKS, but these were moving very quickly. I got in on the first POP under $7 and it closed above $9 (up nearly 40%).
.
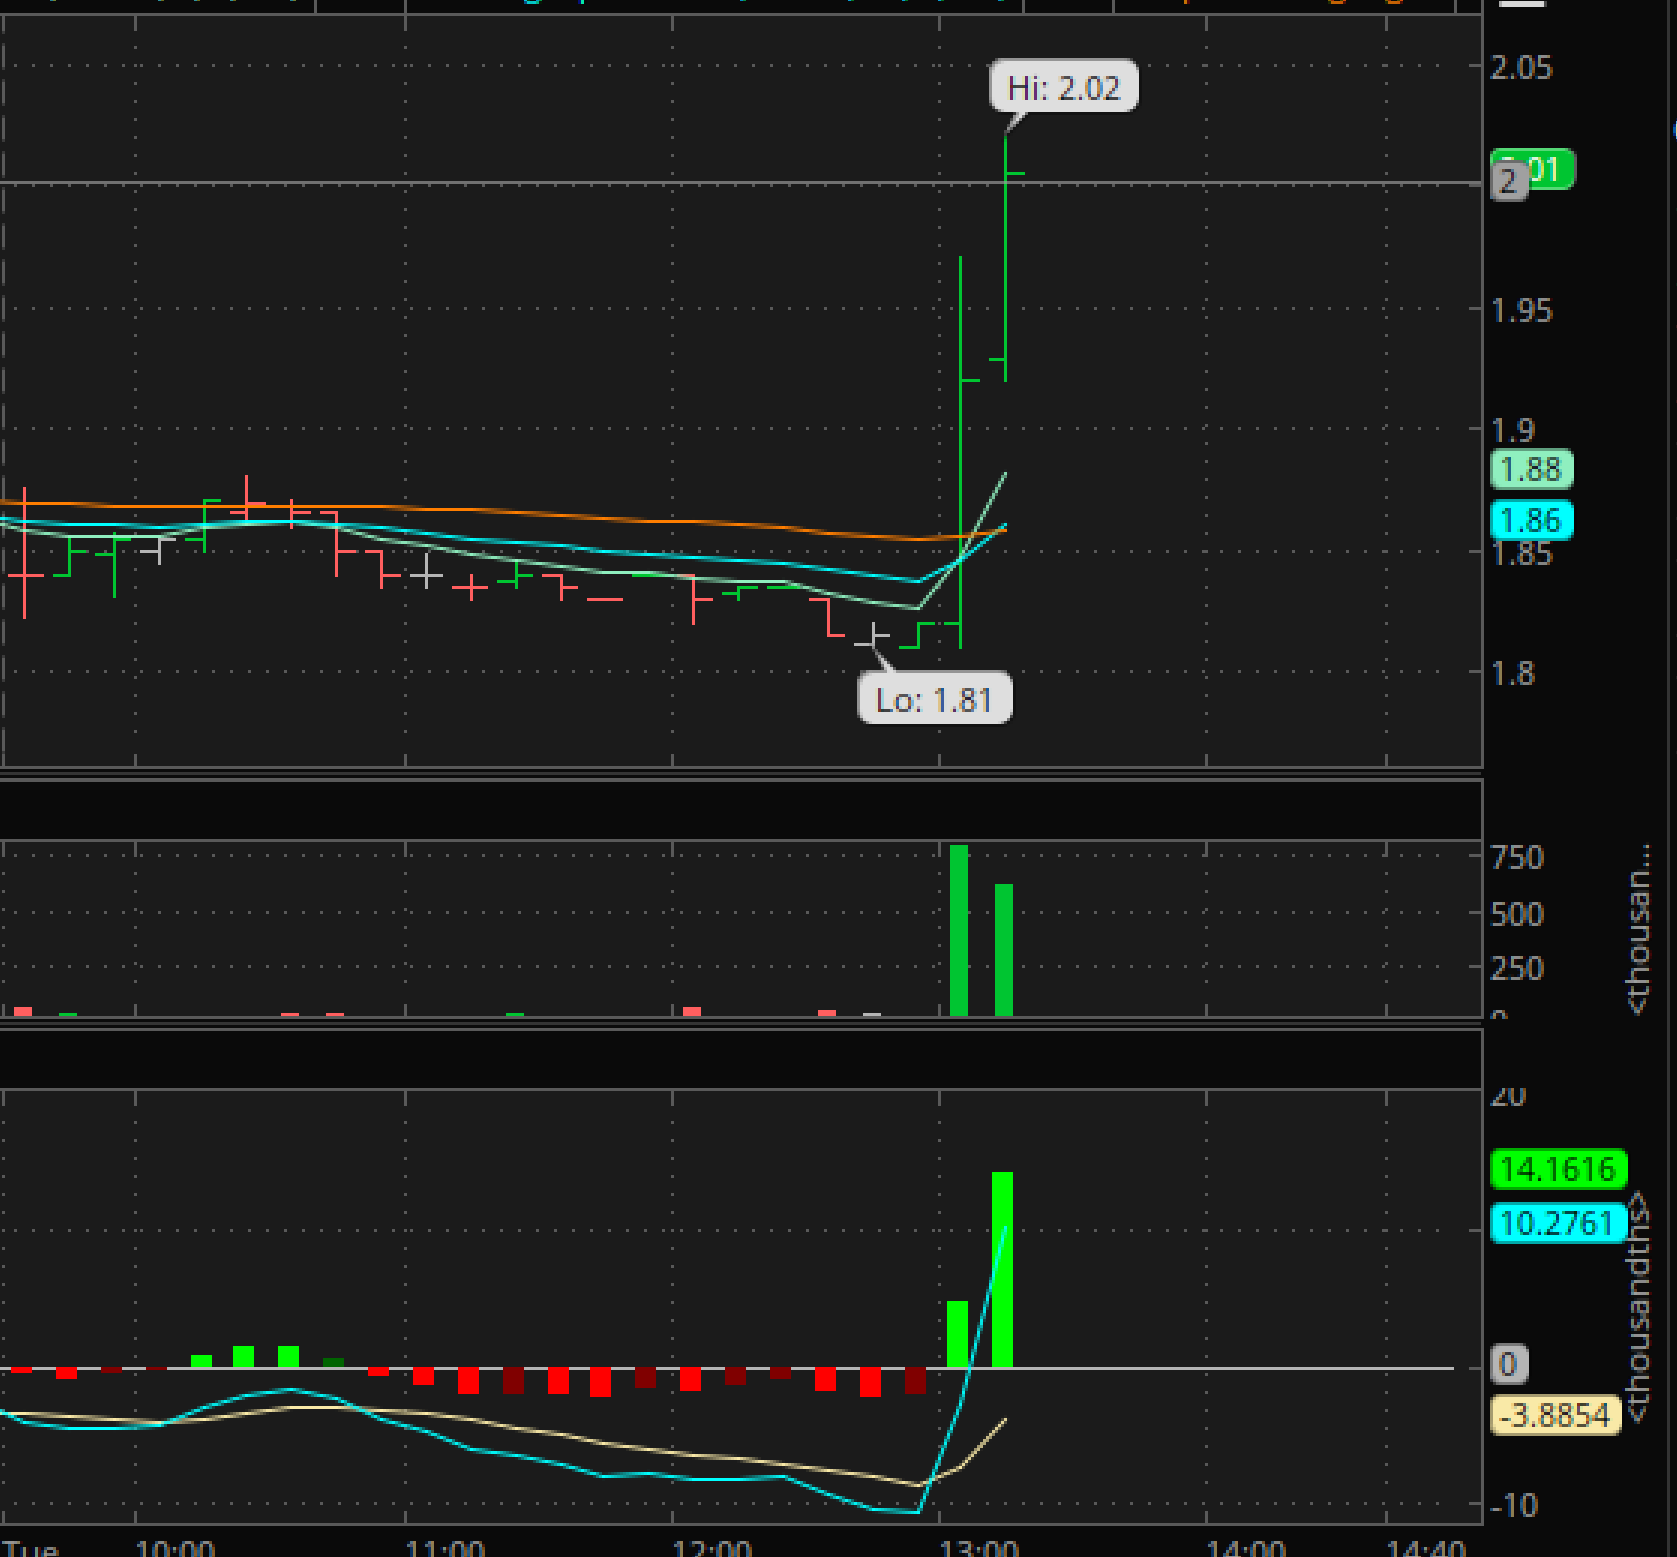
Every MJ Stock was looking like this, and they all did this at the same time. This was OGI and it went on to close up (only) 13%, so this may have more upside left in it.
I’ll post some more of the charts below, but I’m sure that some are wondering “How do you get in now?” There is no ‘safe’ way to enter after this big of a pop, where you wouldn’t risk a pullback. You can get in later, after they pull back for days to a support level.
.
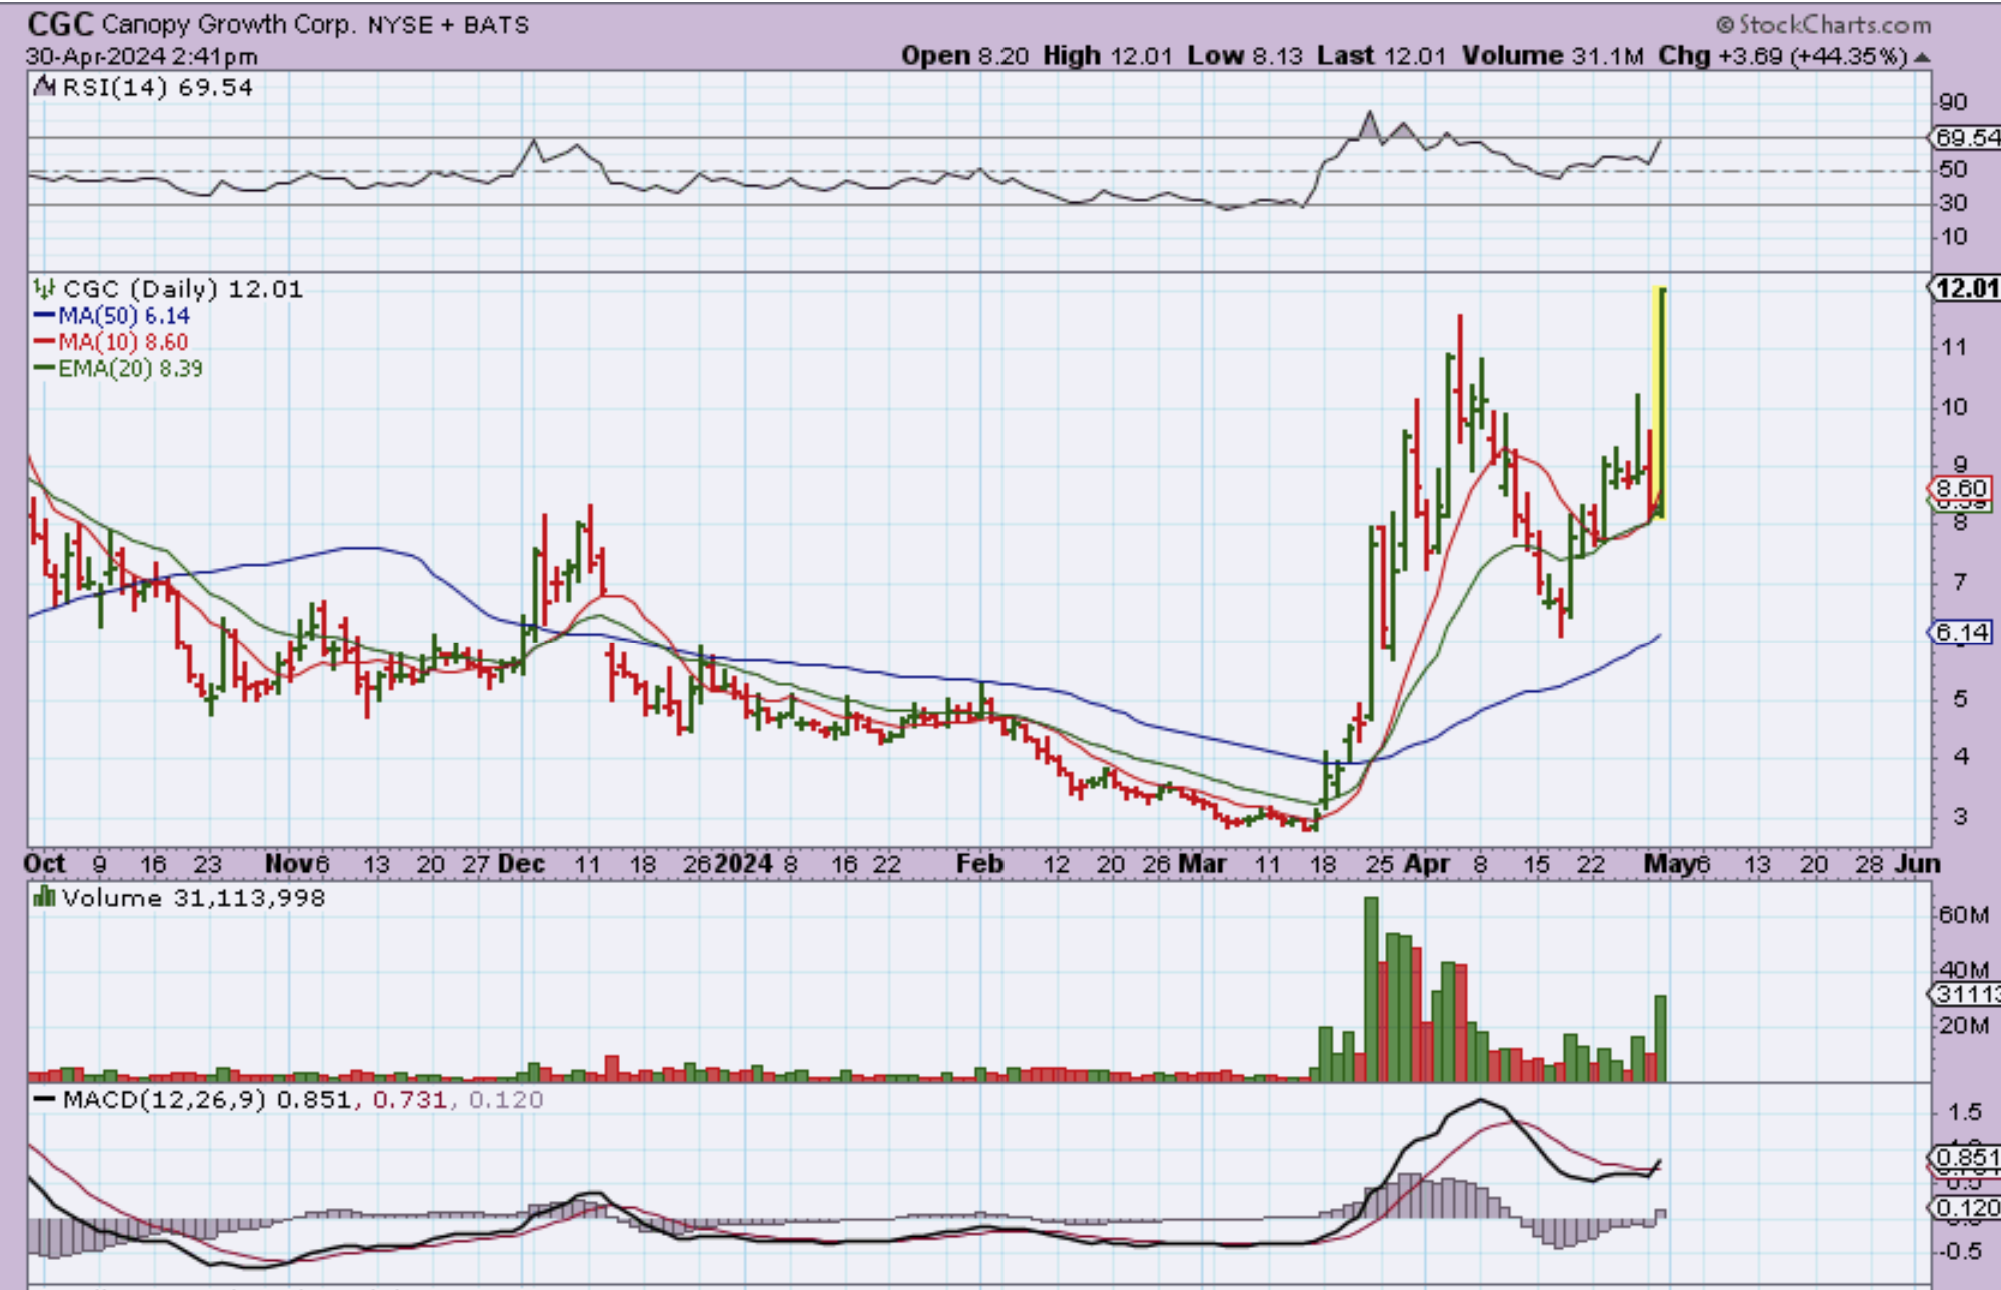
This was captured after CGC popped and was up 44% and still running.
.
Again, “How do you get in now?” As mentioned, there is no ‘safe’ way to buy right now, where you wouldn’t risk a pullback.
.
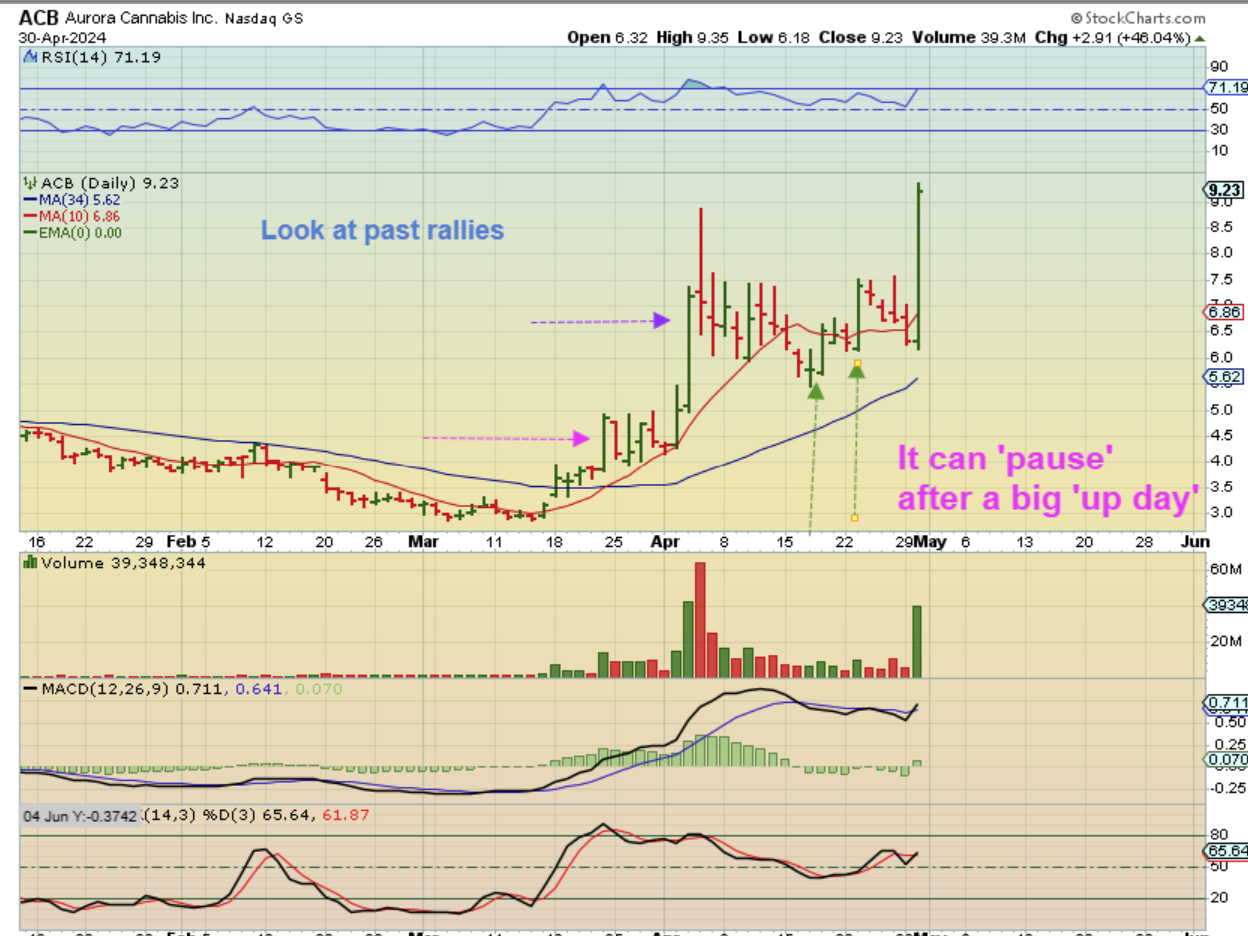
What I do is I look at past rallies in ACB, CGC, SNDL, etc. How did they act after a large ‘UP DAY’?
Sometimes they just dropped on the day after a large Pop. Other times we see that they had follow through buying to push them higher. At other times they ‘paused’ and continued higher after a sideways crawl. I also see on some of these times where they gapped lower the next day, but buyers stepped in and they closed higher, so these could gap down today and yet close higher too. There is NO way to know for sure.
.
More charts and what to do next?
.
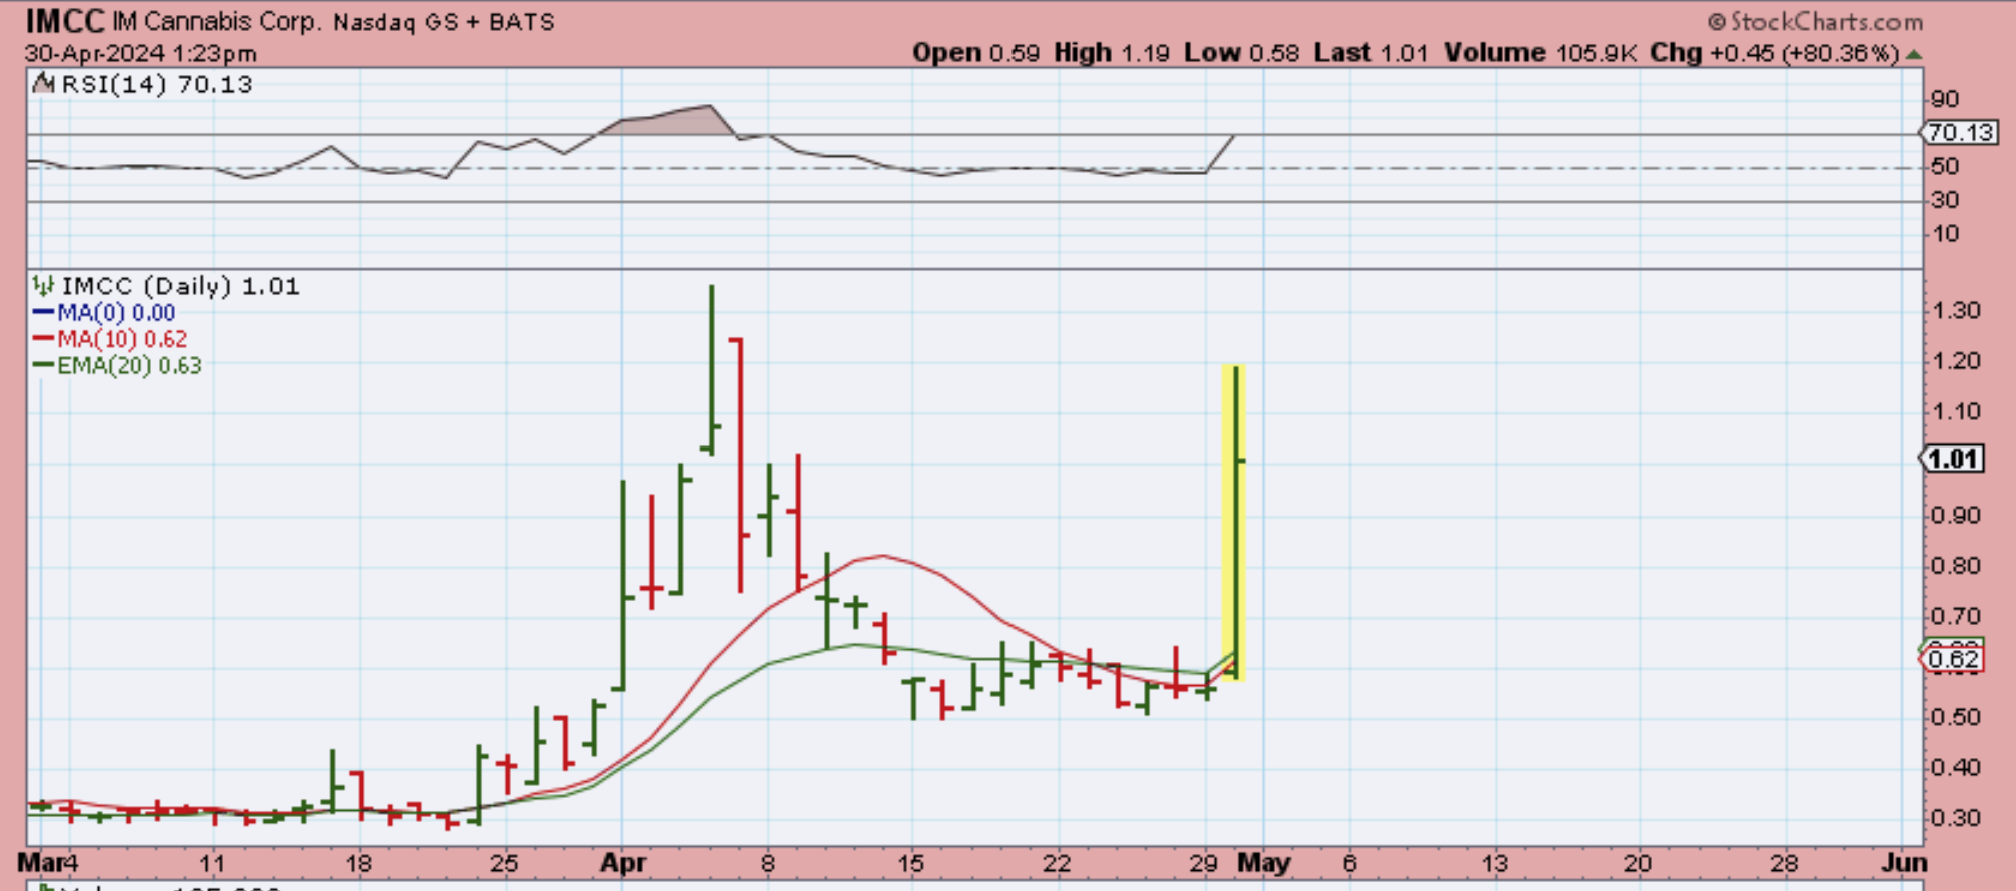
IMCC Popped up 100% Right away. You can see that this is the second run in 2 months, and in past reports I have discussed that this sector looks to be bottoming. That makes them ‘Buy the dip” candidates if they start to act predictably at different support levels.
.
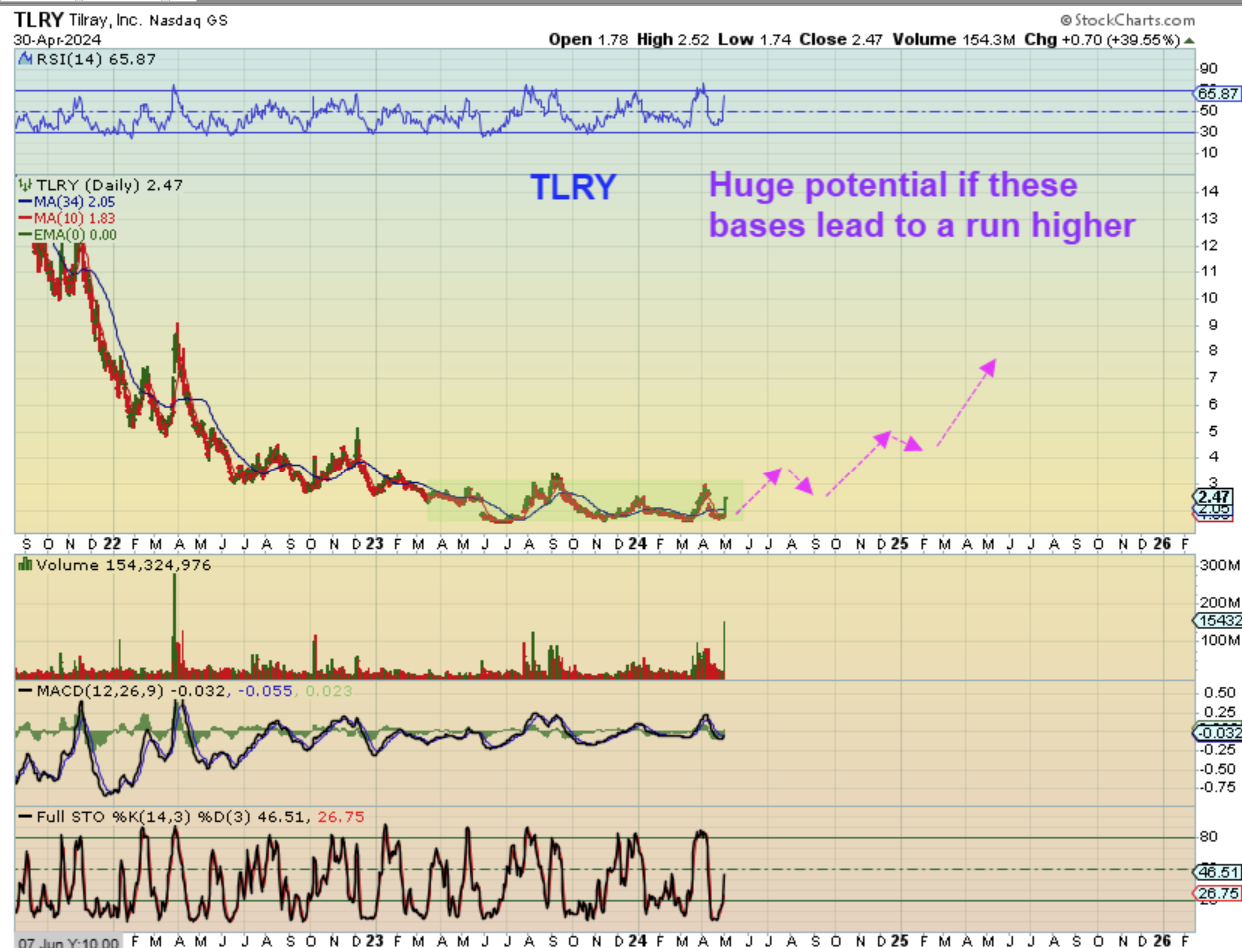
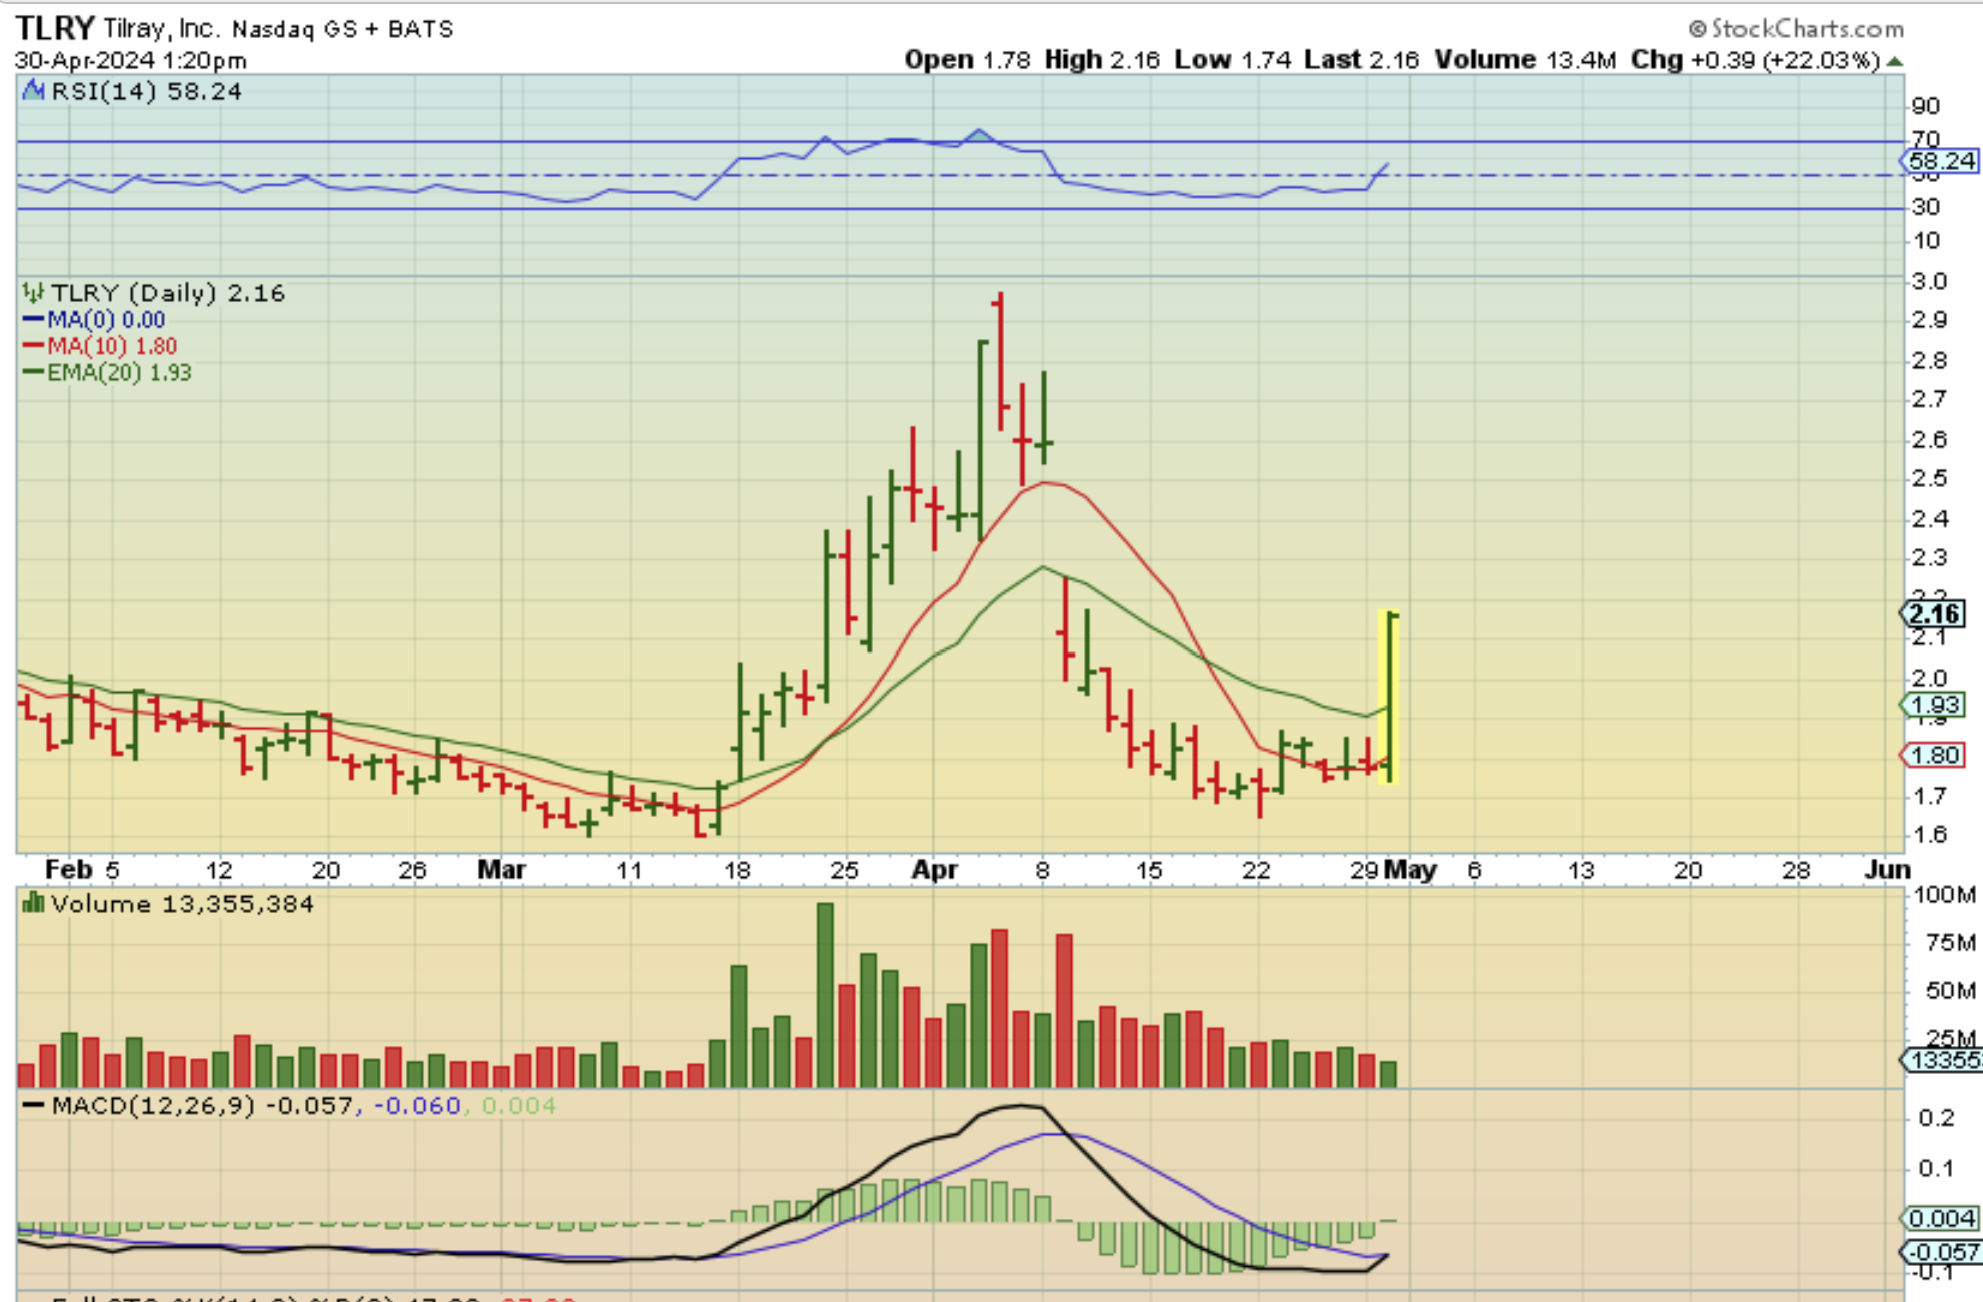
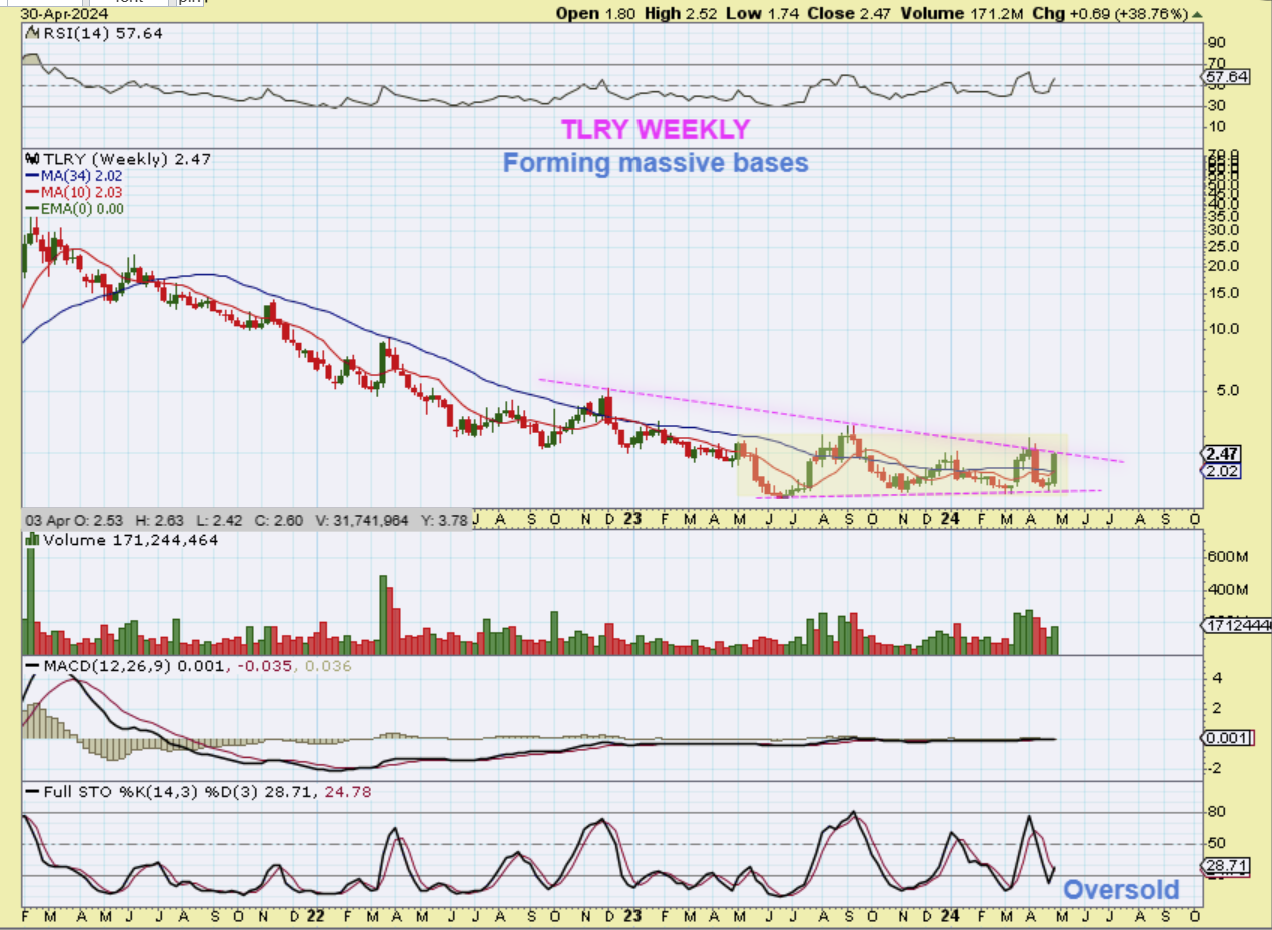
TLRY I just want to show you again, the potential that these have if they start to break from their bases and trend higher. This means that buying the dips in a buy & hold manner may pay off if you can take the choppiness and possible volatility. Most people cannot, and learn that with Precious Metals Miners for example, when they hold during a pullback.
,
So TLRY has had a strong run in March as part of the bottoming process. After a deep dip, it Popped yesterday up 22% by 1:20 p.m., so you can see how quickly and steadily that buying was. This chart was captured at 1:20 p.m.
.
Why am I showing you this now, if it is unsafe to just jump in and see if we get more upside (unless you are a day trader)?
.
Again, This part of the report is a repeat of what I have said in past reports: That these are most likely bottoming out and when they leave those bases and trend higher, these could easily double and triple over time. With that change in classification, these could break out now or they may pull back and then move higher again, beginning that trend higher.
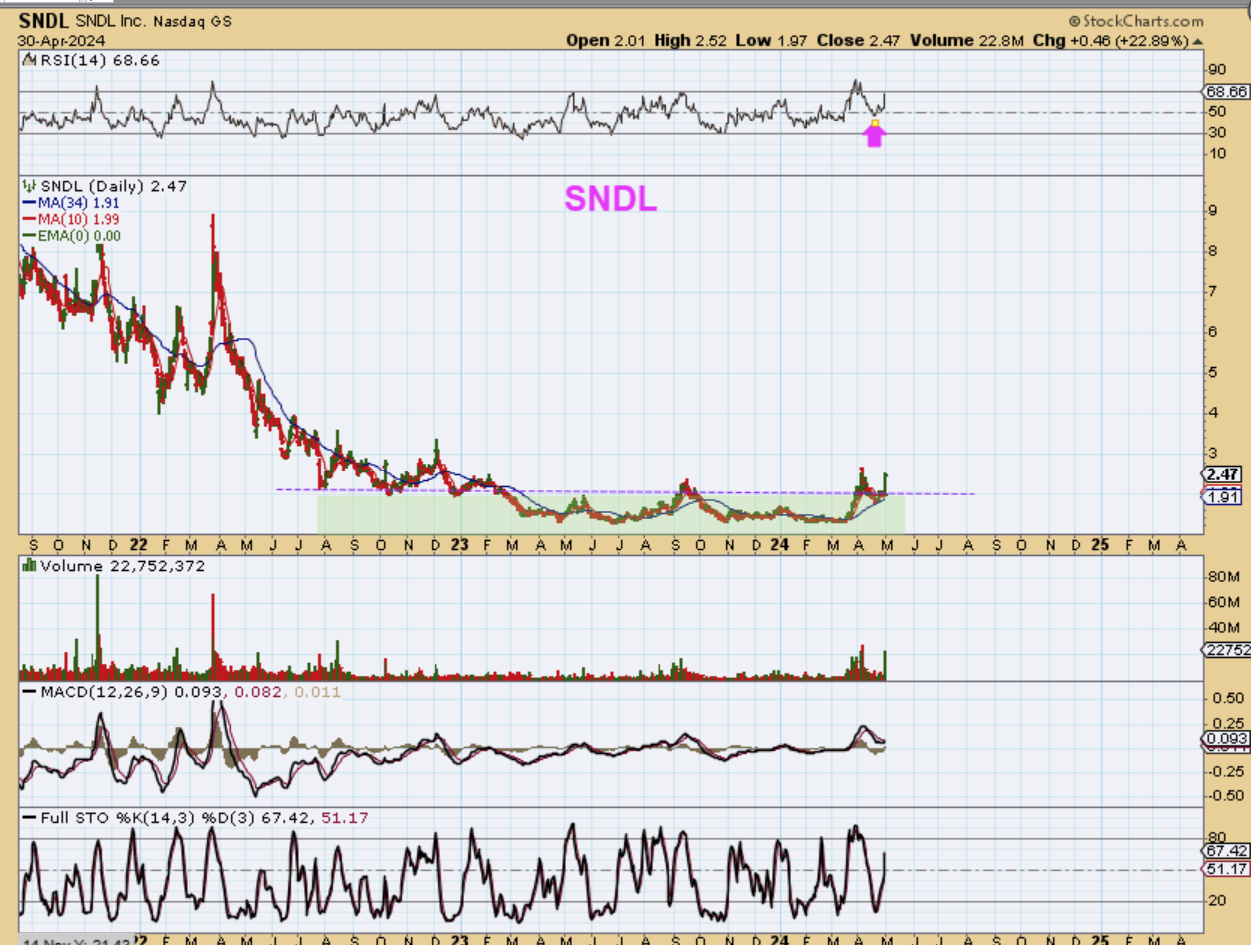
SNDL I am going to be watching these when they pull back again, because some already seem to be breaking from their bases and that usually leads to a trending move higher. SNDL looks like a breakout and back test already took place.
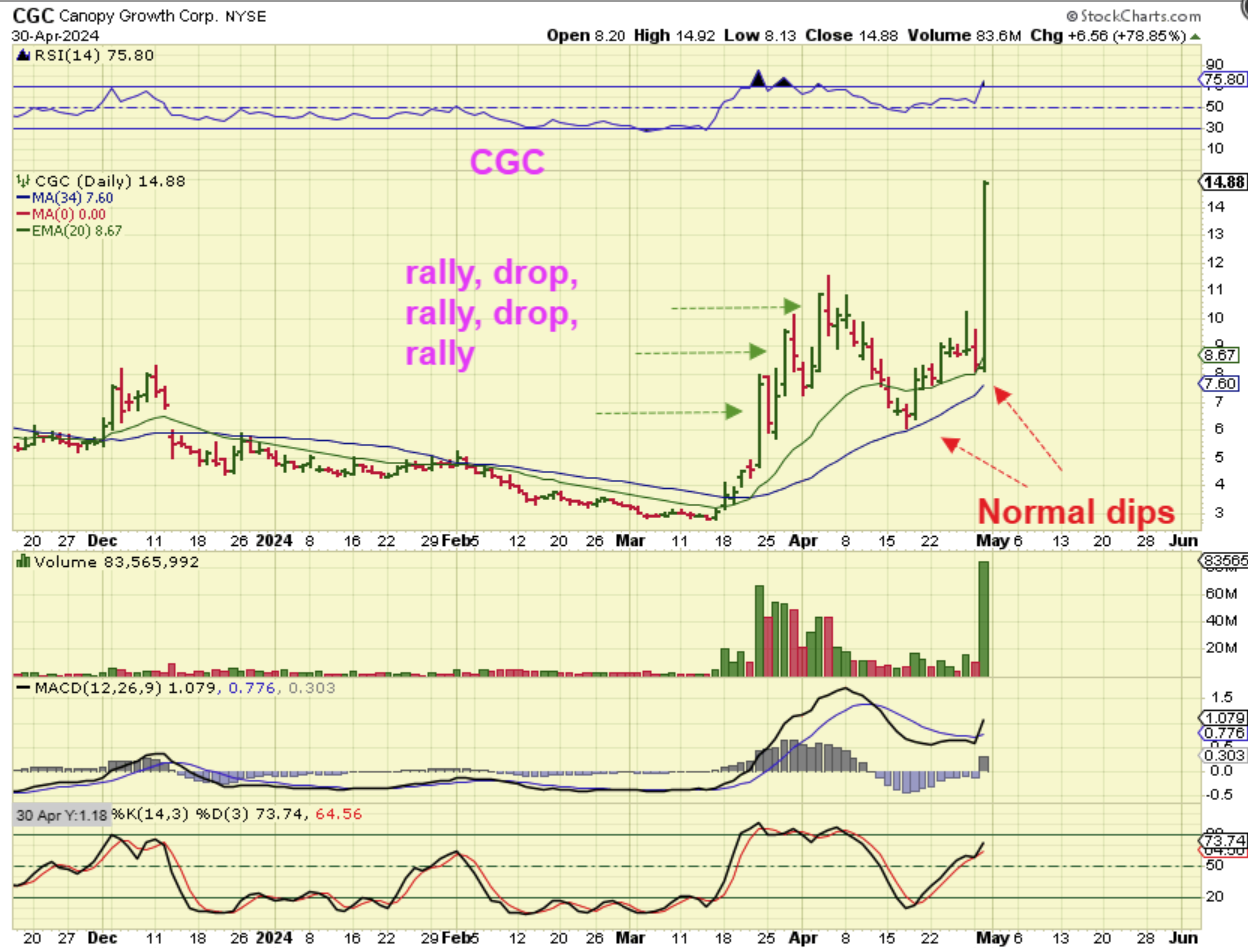
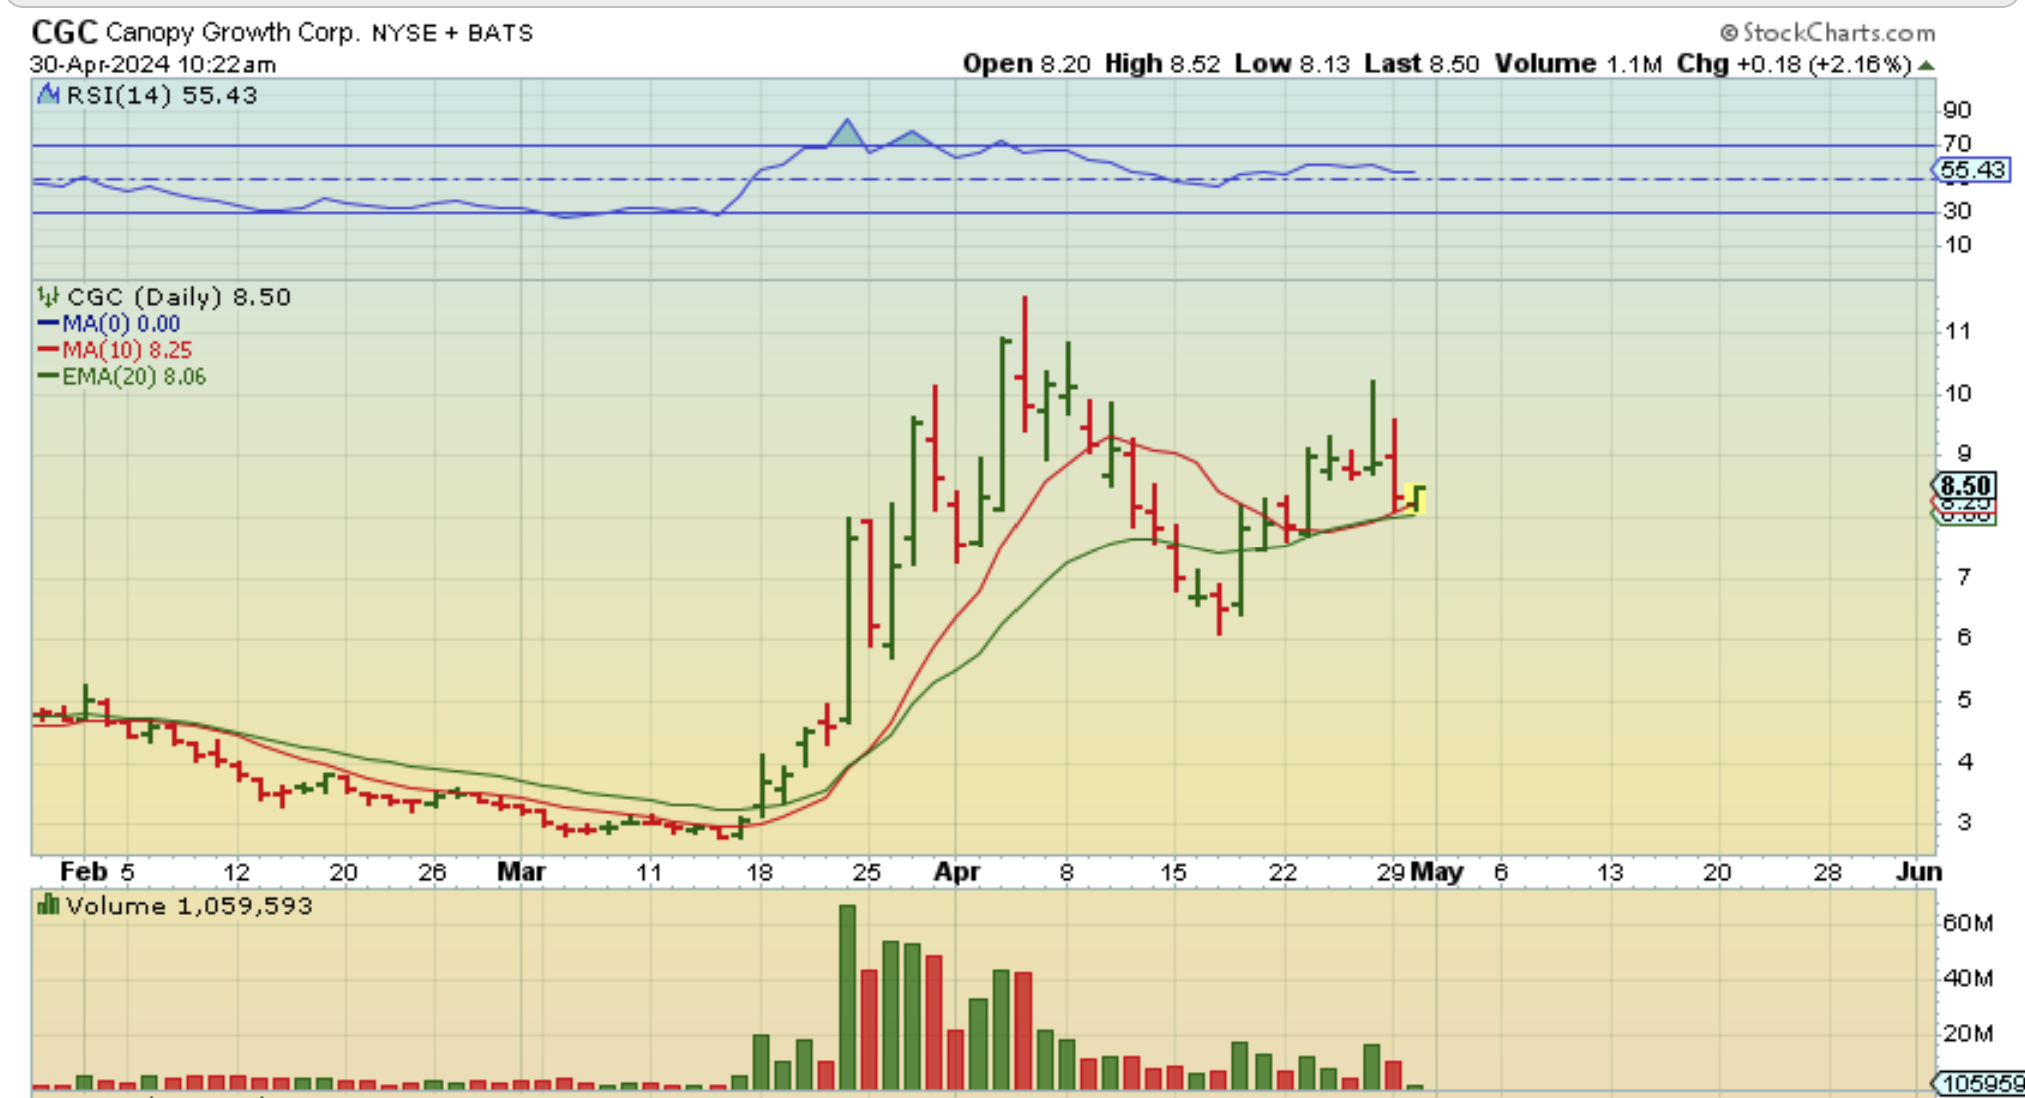
CGC – I want to use CGC to show 2 things:
1. The last rally had a strong day, then a dip, a strong day, then a dip. Those dips are big, but they usually follow the 1o sma, so that may be what we see today with the recent POP. We’ll see.
2. I also wanted to point out the recent dip in April. This was the buy at the 34 sma and the 20 ema.
3. After a strong rally, we often see multi week consolidations and with CGC and ACB, those dipped to support and reversed higher as ‘buy’ entries. Watch for that going forward.