May 15th – CPI
.
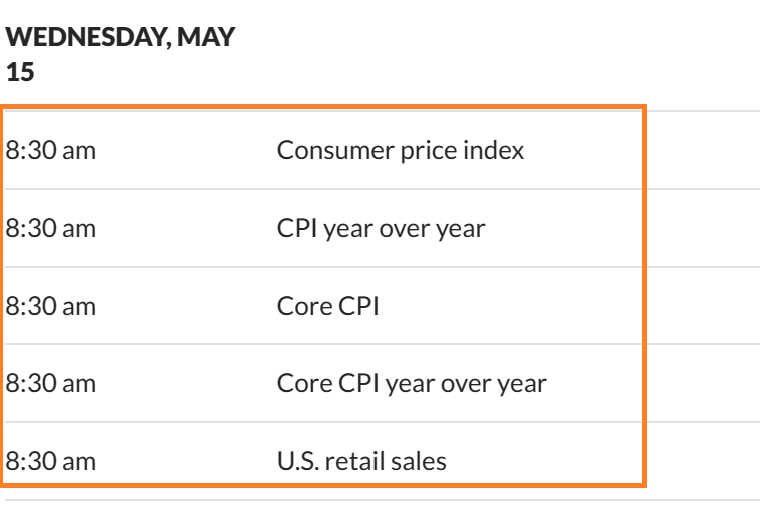
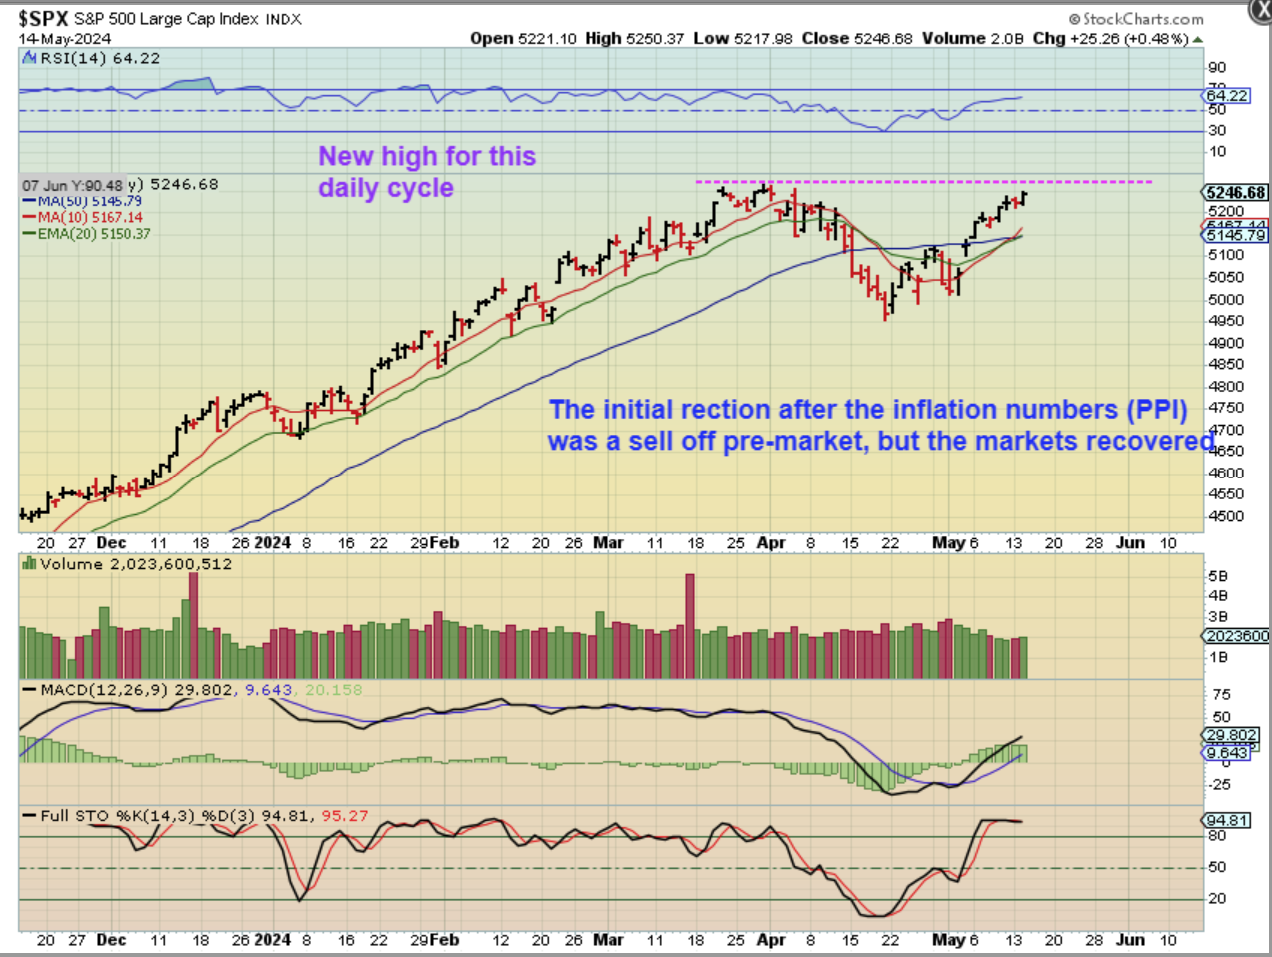
DATA – If you watched the markets yesterday at 8:30, we saw the release of the PPI Numbers (inflation moved higher again). Everything sold off, and then recovered. Today, we have the CPI Numbers, and THAT also moves the markets, but it was good to see the resilience of the general Markets and Precious metals, so we’ll see if they can do that again with the CPI Numbers.
.
SPX – You would never know it but the markets did sell off quickly pre-market and then came back to give us the highs of this daily cycle. please read the chart.
.
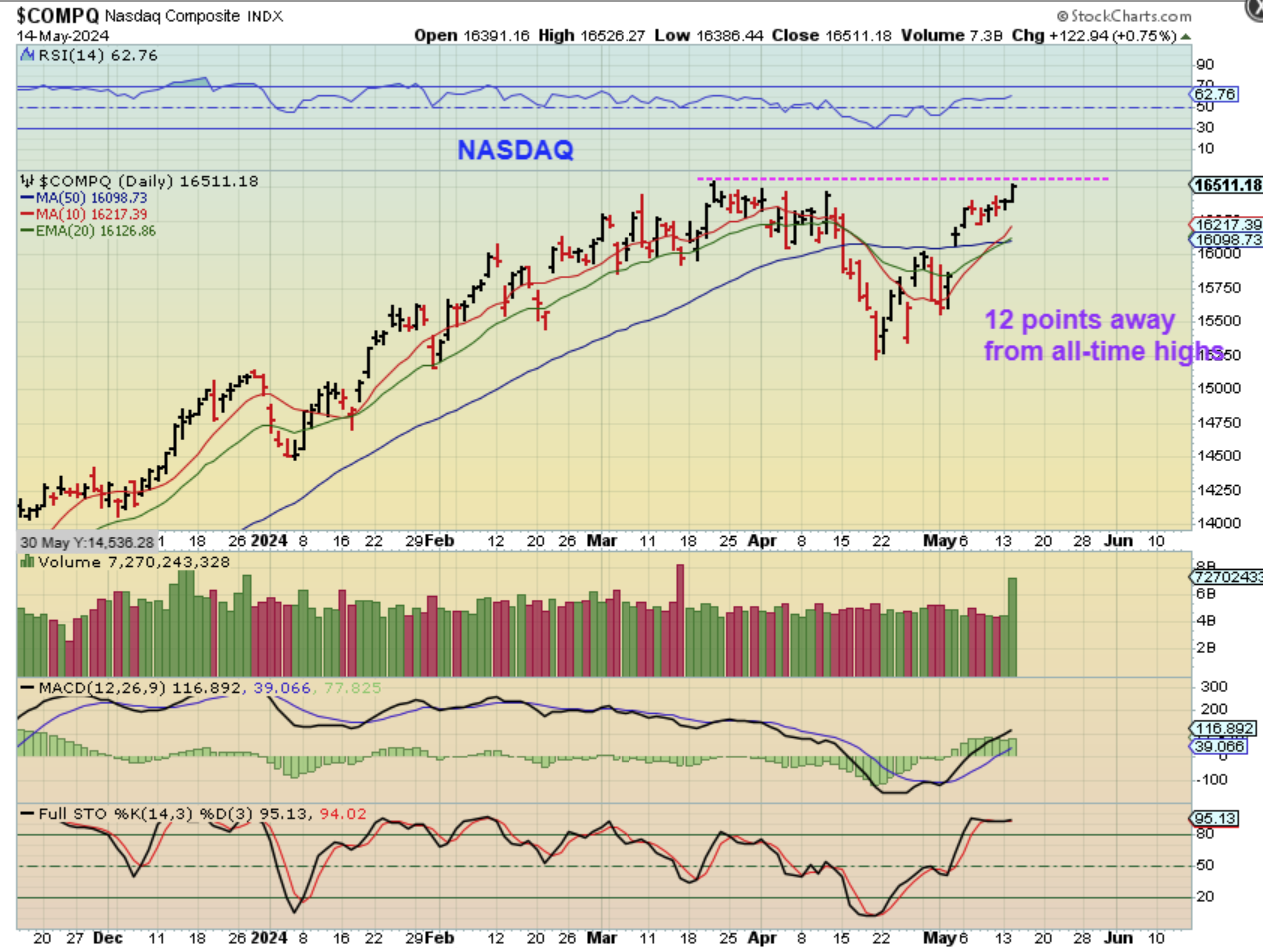
The NASDAQ is almost at all-time highs. We are coming out of an ICL, so I knew the markets should be strong, but I did wonder if we’d see a half cycle dip here or not. We’ll see what the CPI Numbers do, but the PPI Numbers showed that inflation has not been tamed. Rate CUTS may not be in the picture for 2024.
.
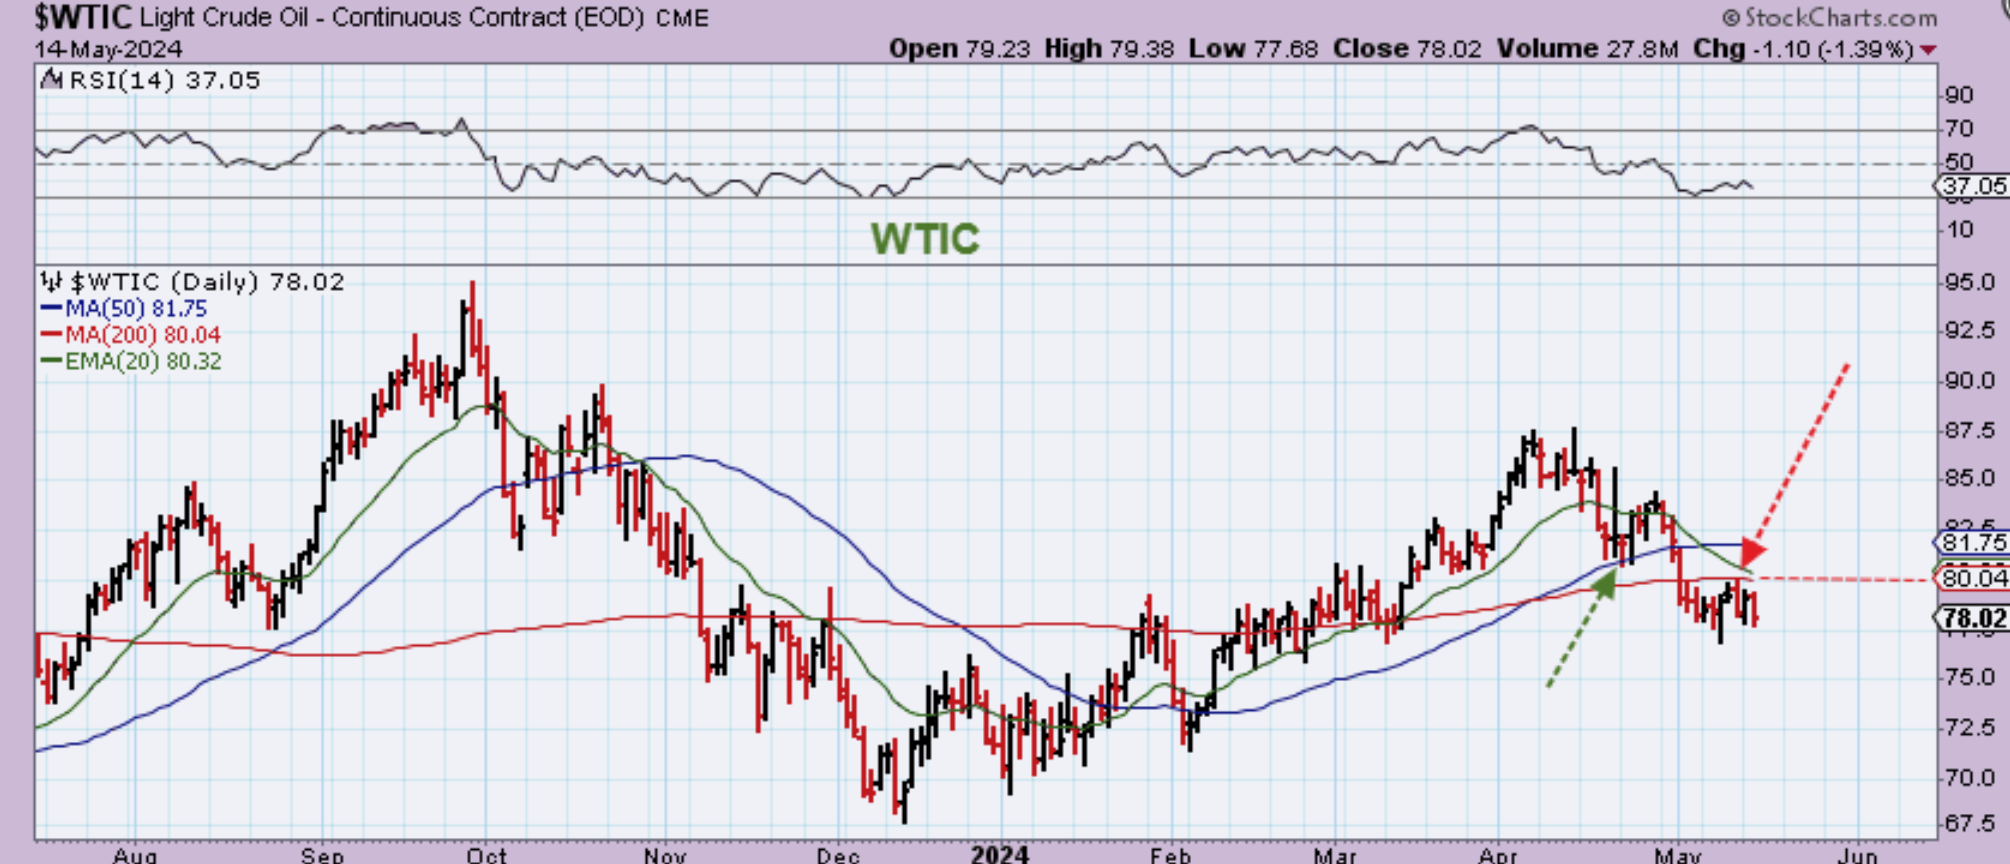
WTIC – Oil dropped again, stuck under that 200sma. As time goes by it does look more & more like we saw a dcl with the reversal at the 50 sma, and that ‘timing’ was perfect for a dcl. The problem was that it peaked VERY quickly and just fell apart from there, giving this 3rd daily cycle plenty of time to chop & drop lower.
.
.
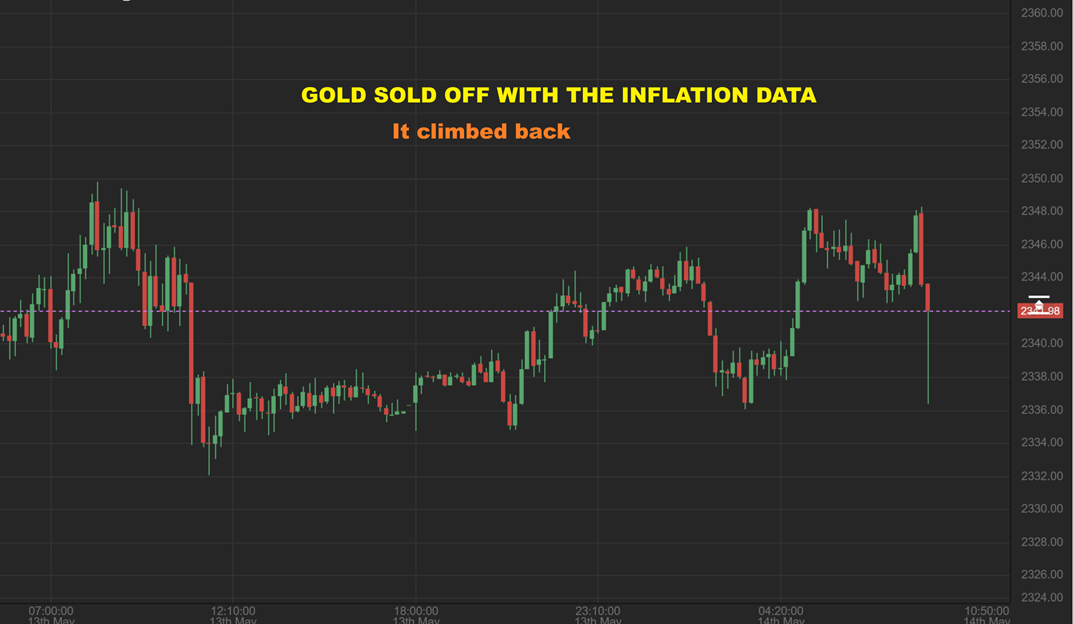
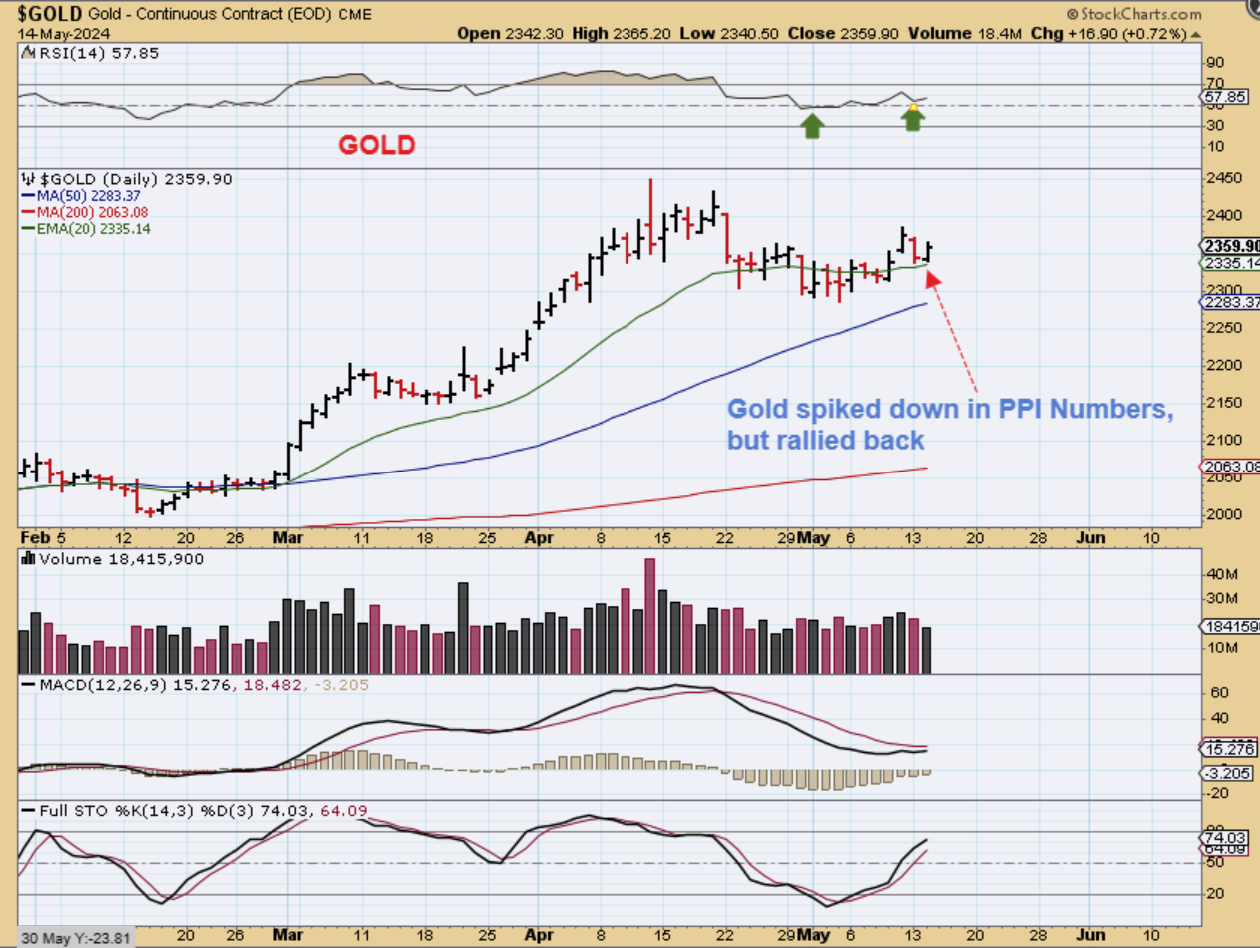
GOLD spiked down at 8:30 with the PPI Numbers being released. I captured this chart snap shot when I saw it quickly started recovering too. Let me show you how Gold ended the day…
.
GOLD – That spike was the low of the day and Gold continued higher from there. You could call it a pre-market shake out.
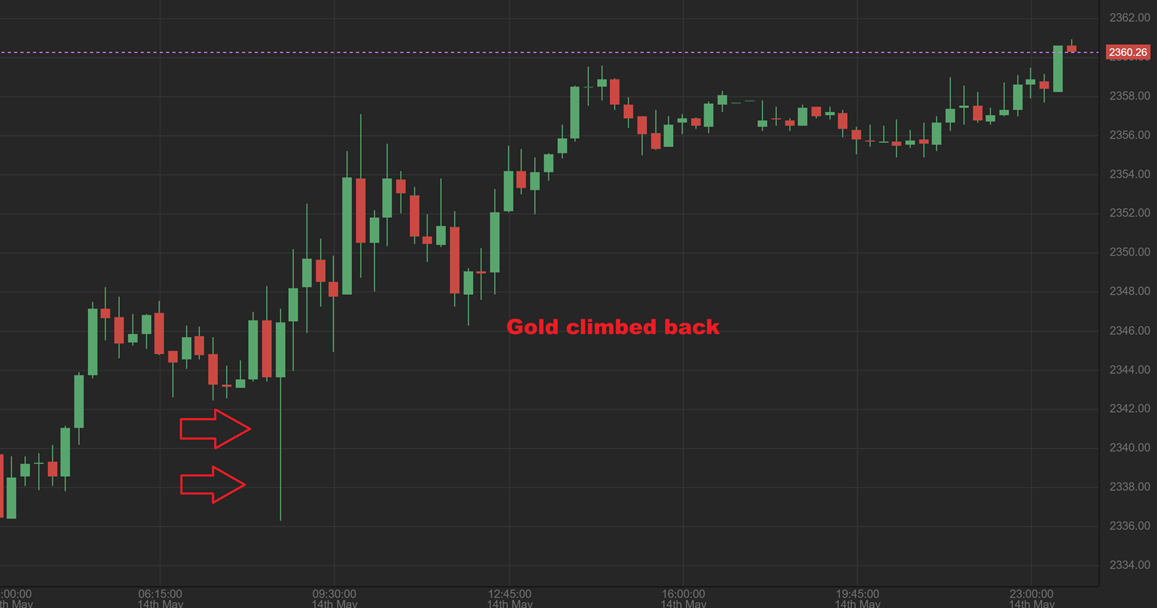
GOLD was on day 7 and it opened slightly lower and tagged that 20 ema, reversed higher and closed up $17. We’ll see what we get with the CPI Numbers.
.
.
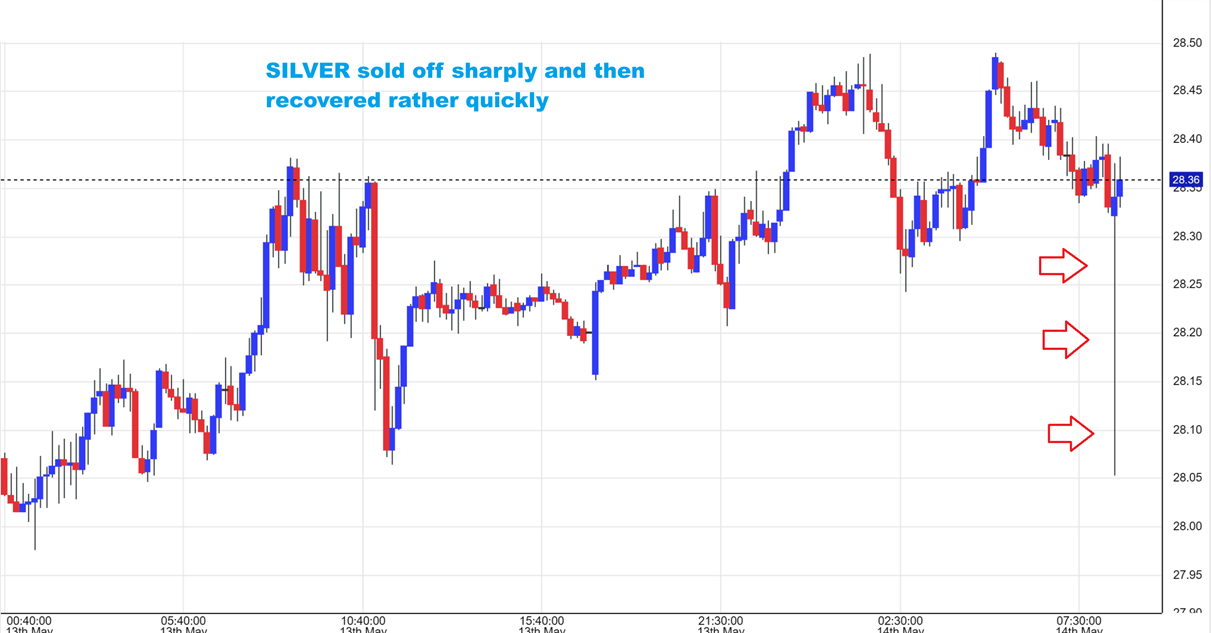
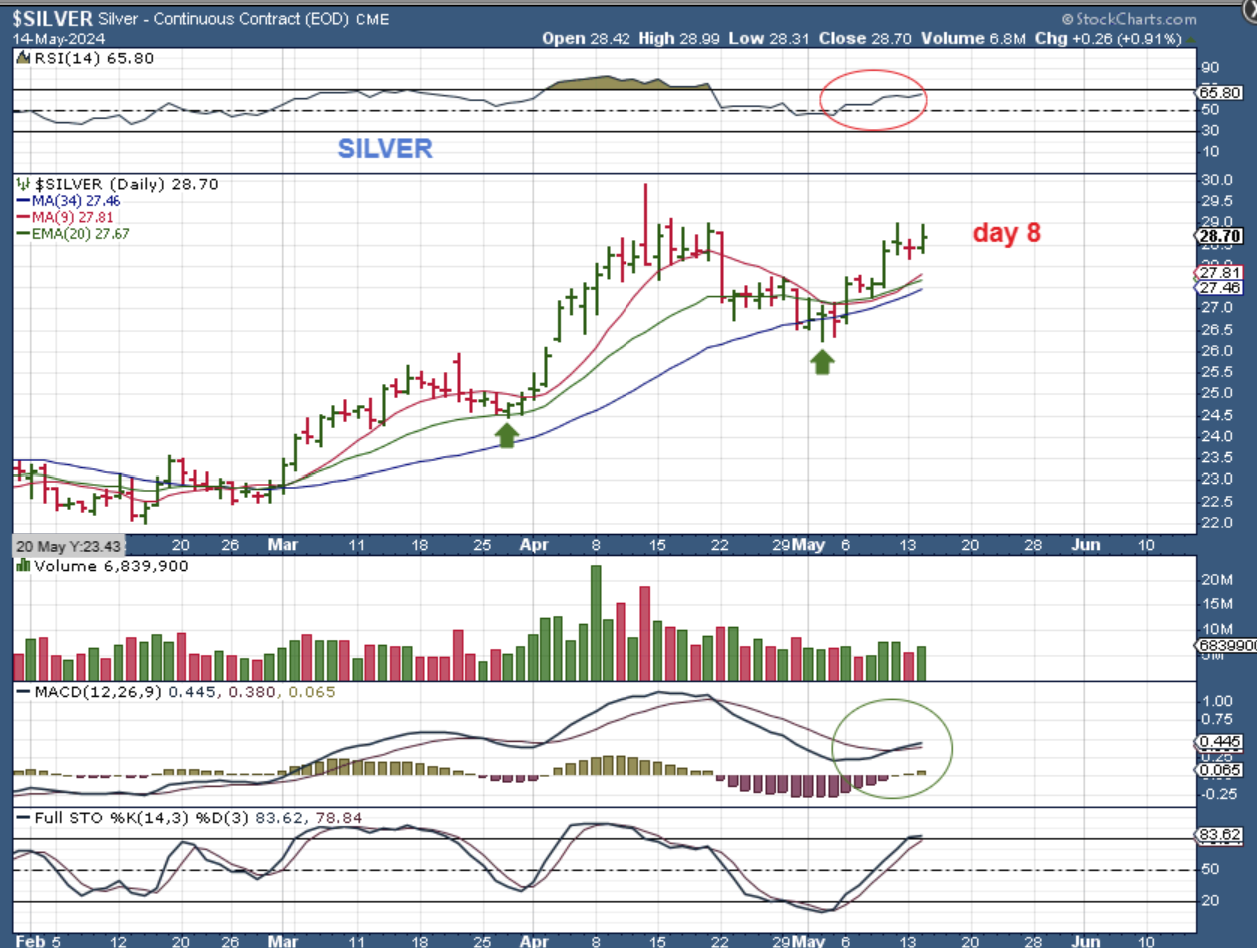
SILVER – Take a look at the spike down at the release of the PPI Numbers. Silver also climbed higher from there and…
.
SILVER – The daily chart just looks like a normal day when all was said and done.
.
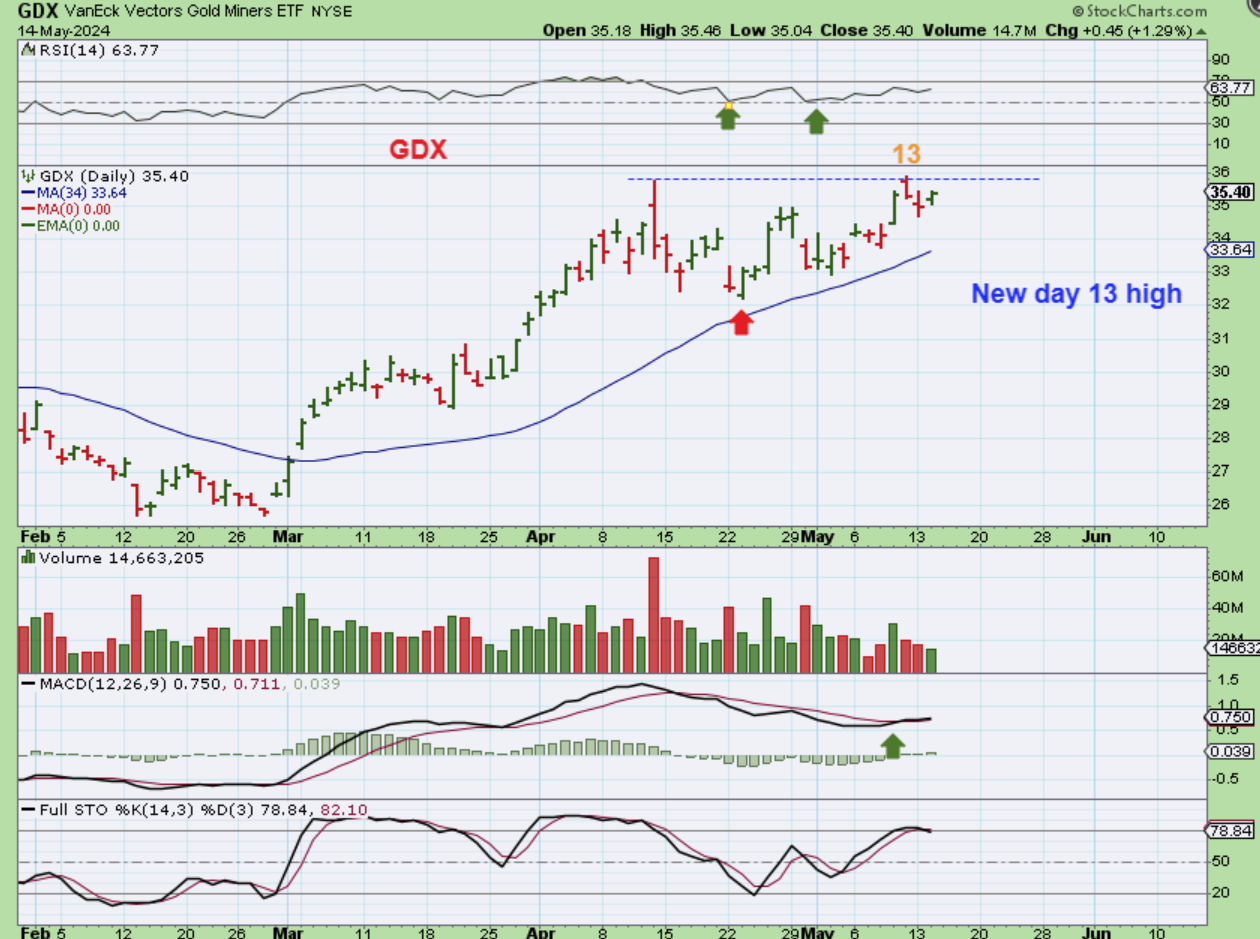
GDX – The Gold & Silver spike down happened pre-amrket, so by the time the Markets opened, GDX gapped open higher, dropped down a little during the day and closed near the highs of the day, which was only a 1.29% rise, but much better than an all day sell off due to the PPI release.
.
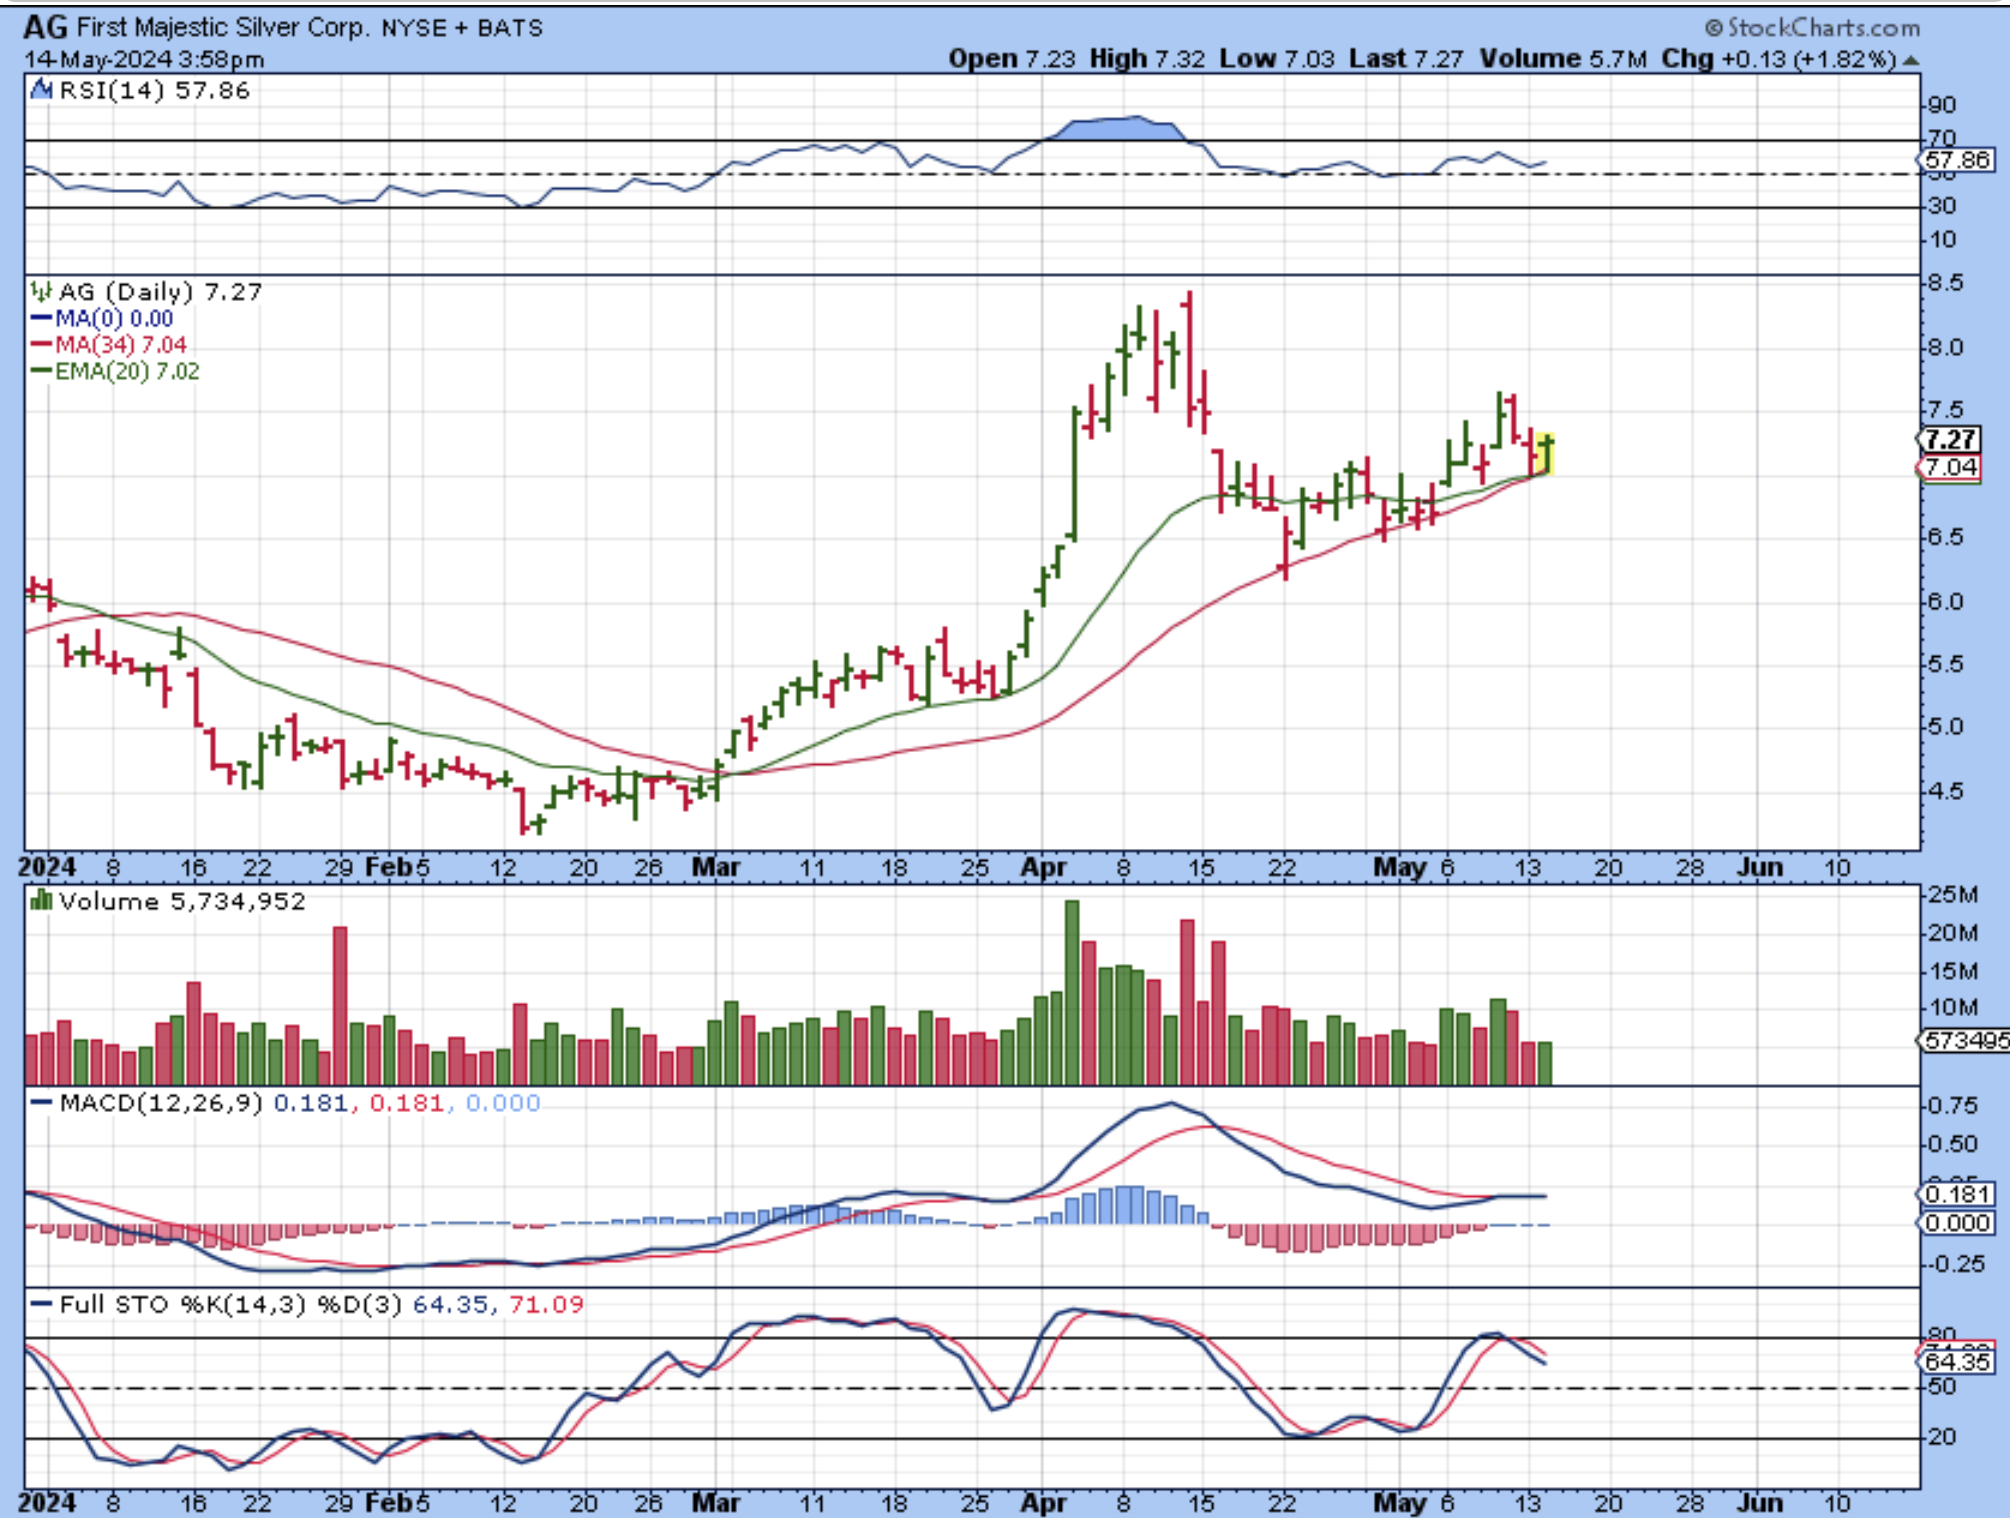
Many of the stocks, like AG here, dipped lower and reversed at support and closed green. I like this chart, but we really need a good solid reaction higher for Gold & Silver with the CPI report to give us the follow through higher in this 3rd daily cycle.
.
By request: If you haven’t heard about GME, AMC ( I also traded KOSS & BB intraday), then you may be better off just passing this chart by. It is by request that I will just quickly discuss that the squeeze is on again, similar to what we saw a few years ago when these were heavily shorted and people piled in to cause a short squeeze rally. The ‘BY REQUEST” part is that I was asked to give some price projections and my answer was that these do not work that way.
.
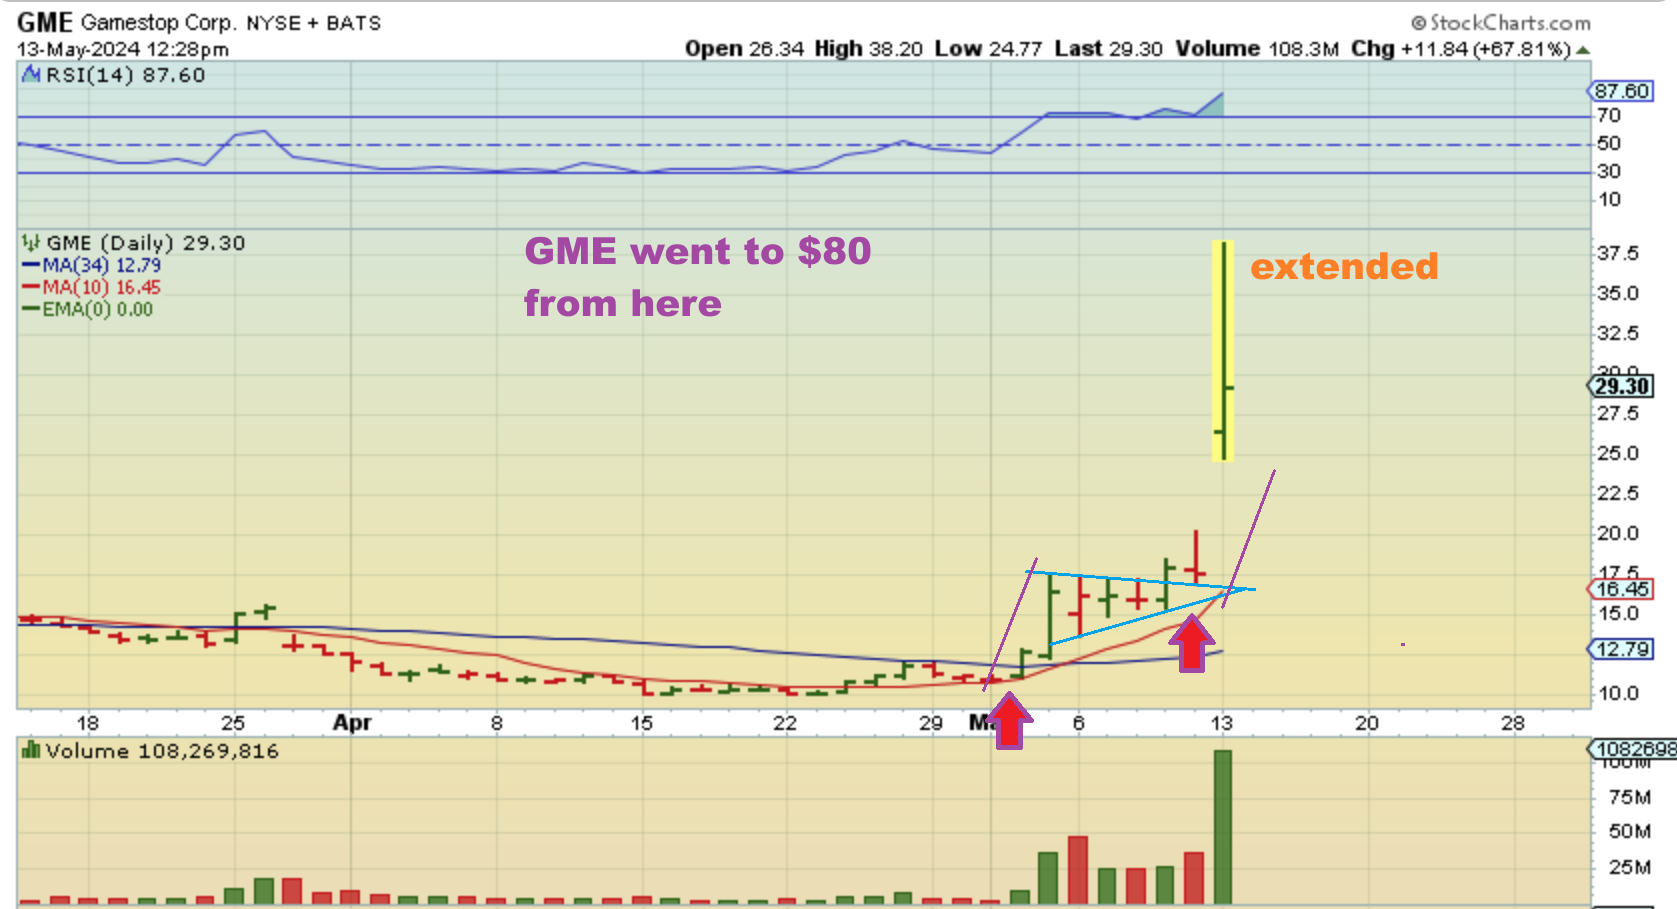
GME: I was actually trading GME a week ago, because it Popped in early May and travelled sideways with a very bullish triangle. The basic price projection would have been the purple lines. That’s huge, like roughly $10 to $17 -triangle, and then to roughly $25, but with that SHORT SQUEEZE TRIGGER, it gapped up to $26 and ran to $38, and then pulled back to $29. That should be more than what you’d get in a normal measured move already, but then this shot up to $80 in after hrs! Next Chart…
.
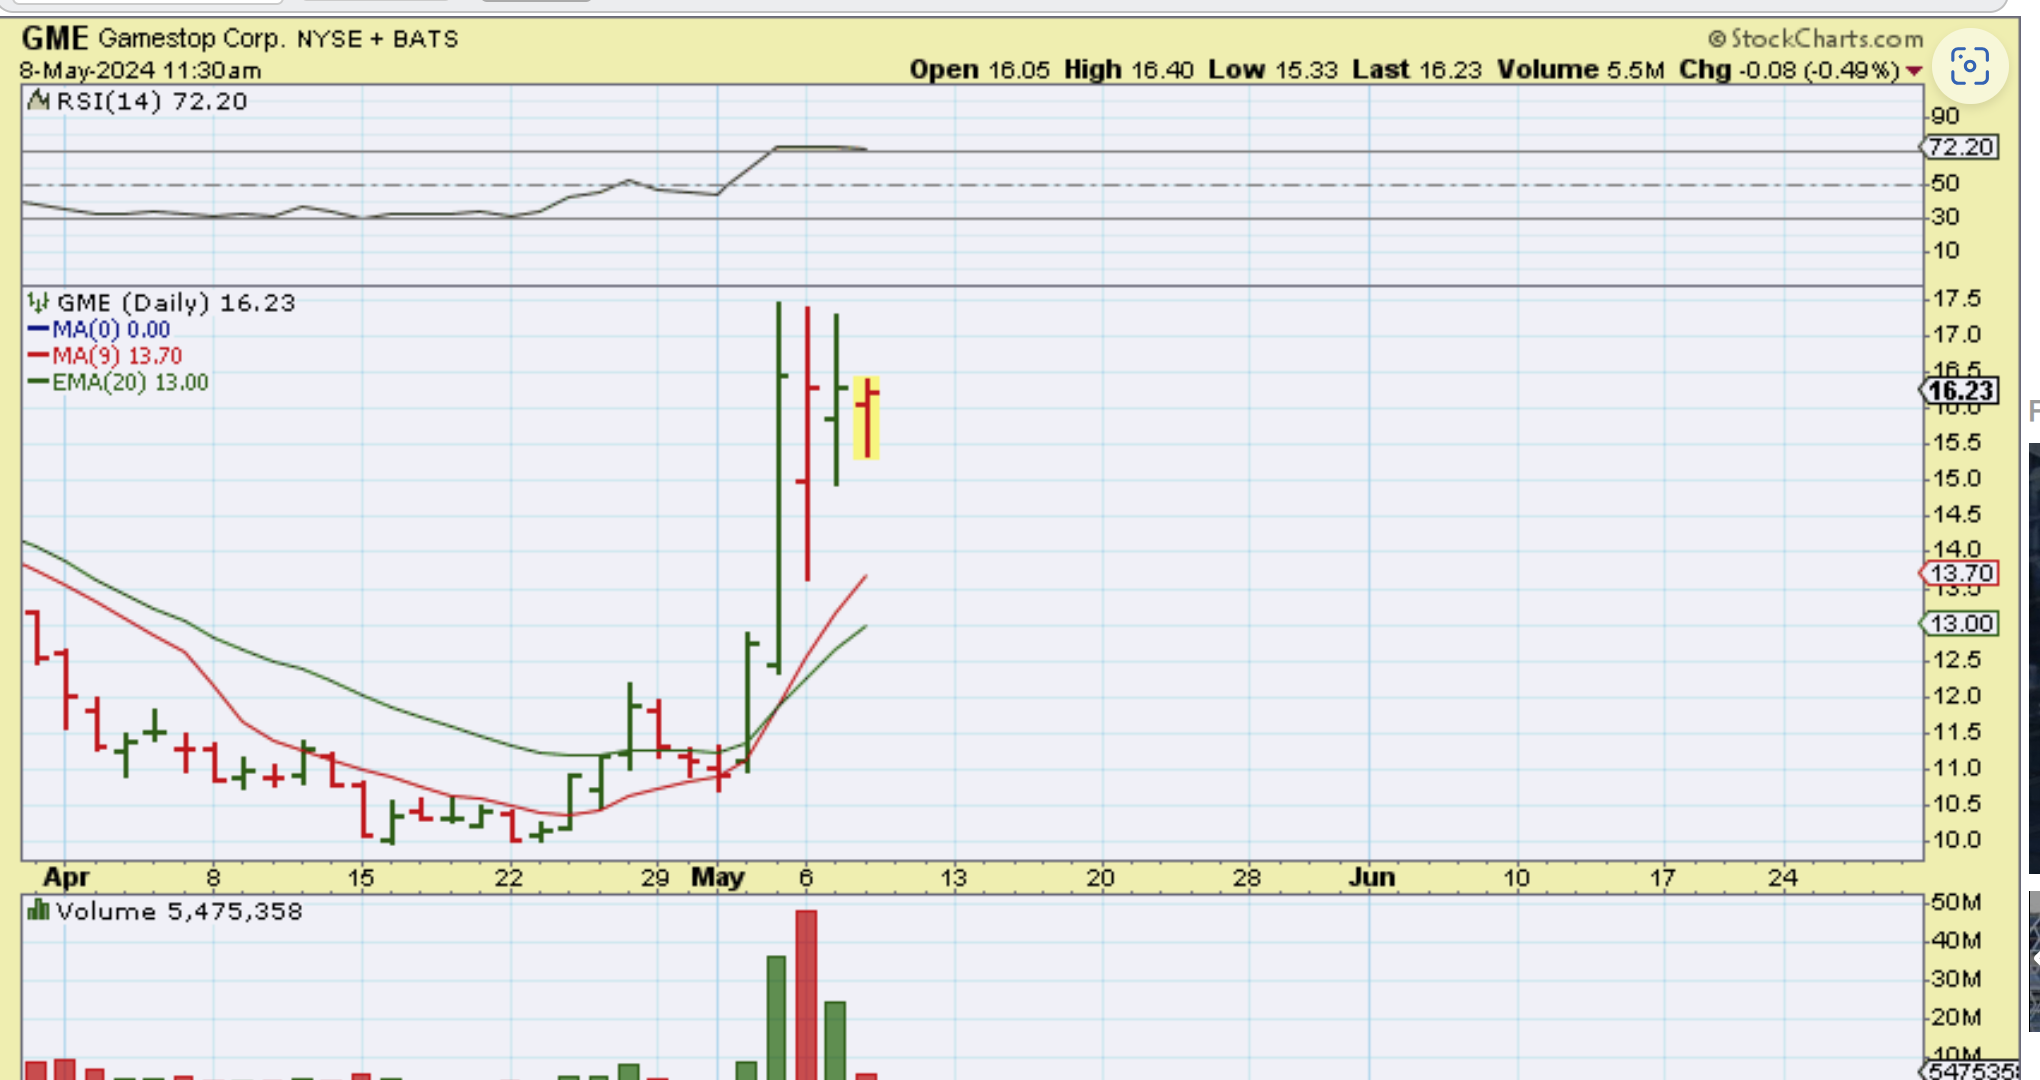
So this is actually a chart of GME that I captured and posted last week when I was trading the set up. I was not recommending it, but just pointing out how it was forming a solid triangle (This was May 8). I traded it, but sadly I sold before the weekend. My point is that THIS MOVE WAS ALREDY EXTENDED AT $17, but now the flag could push it to $25 ish. Remember that it ran to $80! So…
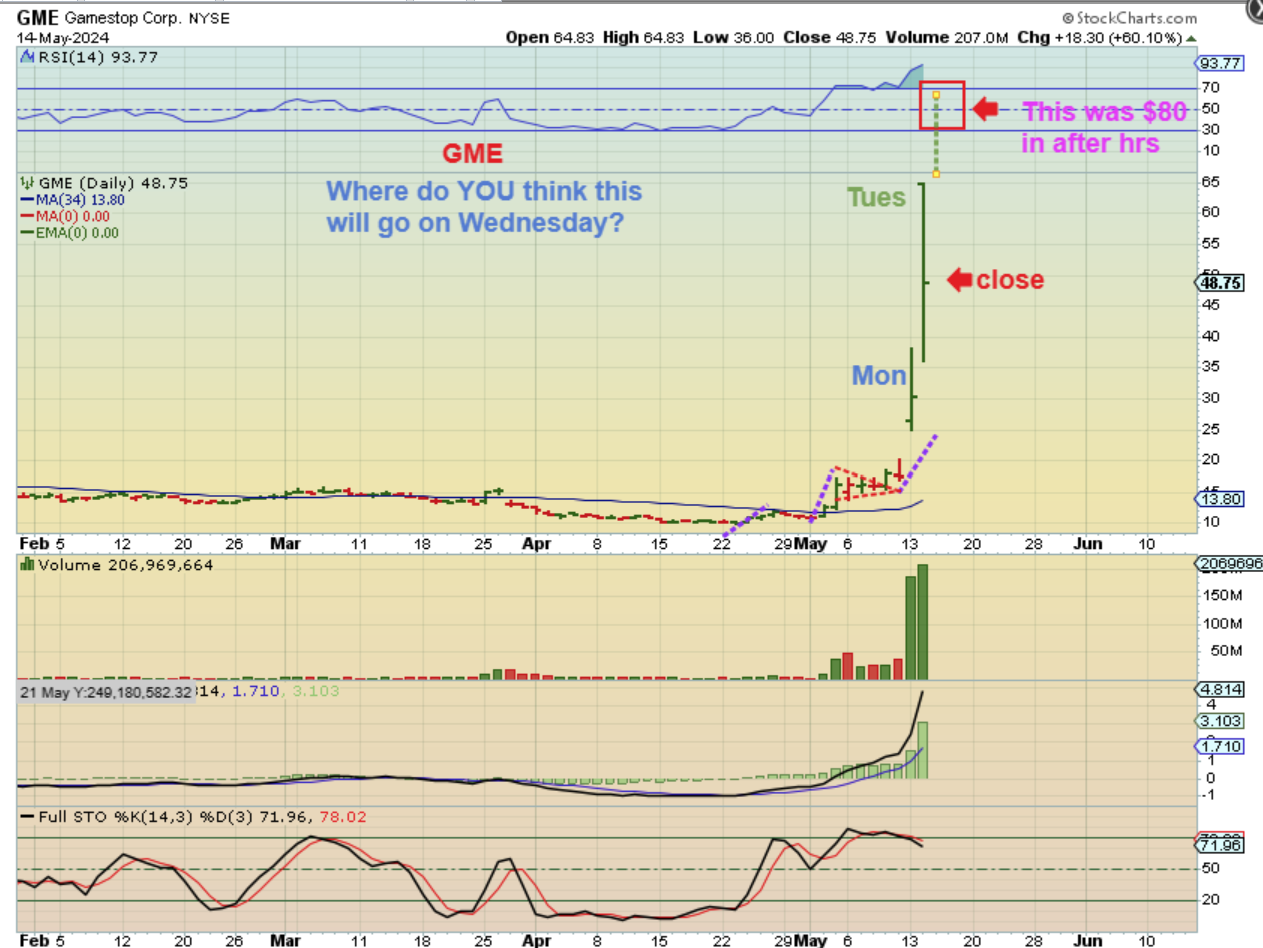
GME: That tiny little triangle is the above charts follow through. So really it went from $10 to $80 and closed at $48. Where will this go next? Up or down? Up another $40? Down $40. We do not know for sure, because this is an epic battle of the bulls and bears. The shorts covering when buying floods in, and massive profit taking when it got so extended. So I was asked to give measured moves and they have already played out and now we go to extreme fibs numbers , etc….and there is no real good reason to do that, because this can Pop back to $80, and it can drop back to $10.
.
So we have the CPI Numbers at 8:30, and yesterdays numbers showed another increase in inflation and reduced the possibility of a Fed Rate Cut by quite a bit. Some commentary actually said that we now lean toward a rate hike, as though the Fed stopped hiking too soon. Well, Fed Chairman Powell was actually speaking yesterday in the morning and he did address what he saw by playing it down. I had CNBC on at 8:30 and a bit later the Fed said that it was not overly concerning, because these things take time and inflation could fluxuate up and down. That calmed things down and we saw a rally into the days close. WILL THAT HAPPEN AGAIN if the CPI is hot too? That’s a tough call, so stay tuned.
.
NOTE:
1. I DO still own a basket of Miners, but at the ICL I was over 100% invested with Miners and leverage and rode that for a while & traded too.
2. In the 2nd daily cycle I was still holding a large basket and then I was also trading some individual set ups (and traded GDXU as leverage too).
3. Right now in the 3rd daily cycle, my basket is smaller and I may trade GDXU using intraday charts.
For example, if I had 5000 shares of AG, 5000 shares of HL, 5000 shares of KGC, 5000 shares of IAG, 5000 shares of HMY, etc…I might now have 2000 shares of all of those. What is that strategy? I am an active trader and we have an ICL in the General Markets, so I lock in a lot of my precious metals profits and trade that money in SOXL, TQQQ, and stocks. I also want to tackle a good trade in Crypto and I have been discussing that plan for weeks. That said, a 3rd daily cycle in Gold CAN make new highs, but it also CAN be either L.T. or R.T., so while I still want to be invested in precious metals, it may be getting late and that sector could get choppy. For some traders here, they will ride a basket from the ICL to now, while others may trade in & out at an ICL /DCL, and they sell as it rises up near day 20, ready to buy the next dip.
.
I just wanted you to know that I trade other areas and my basket of Miners is NOT what it is at a Gold ICL. Enjoy your Wednesday trading!
.
~ALEX
.
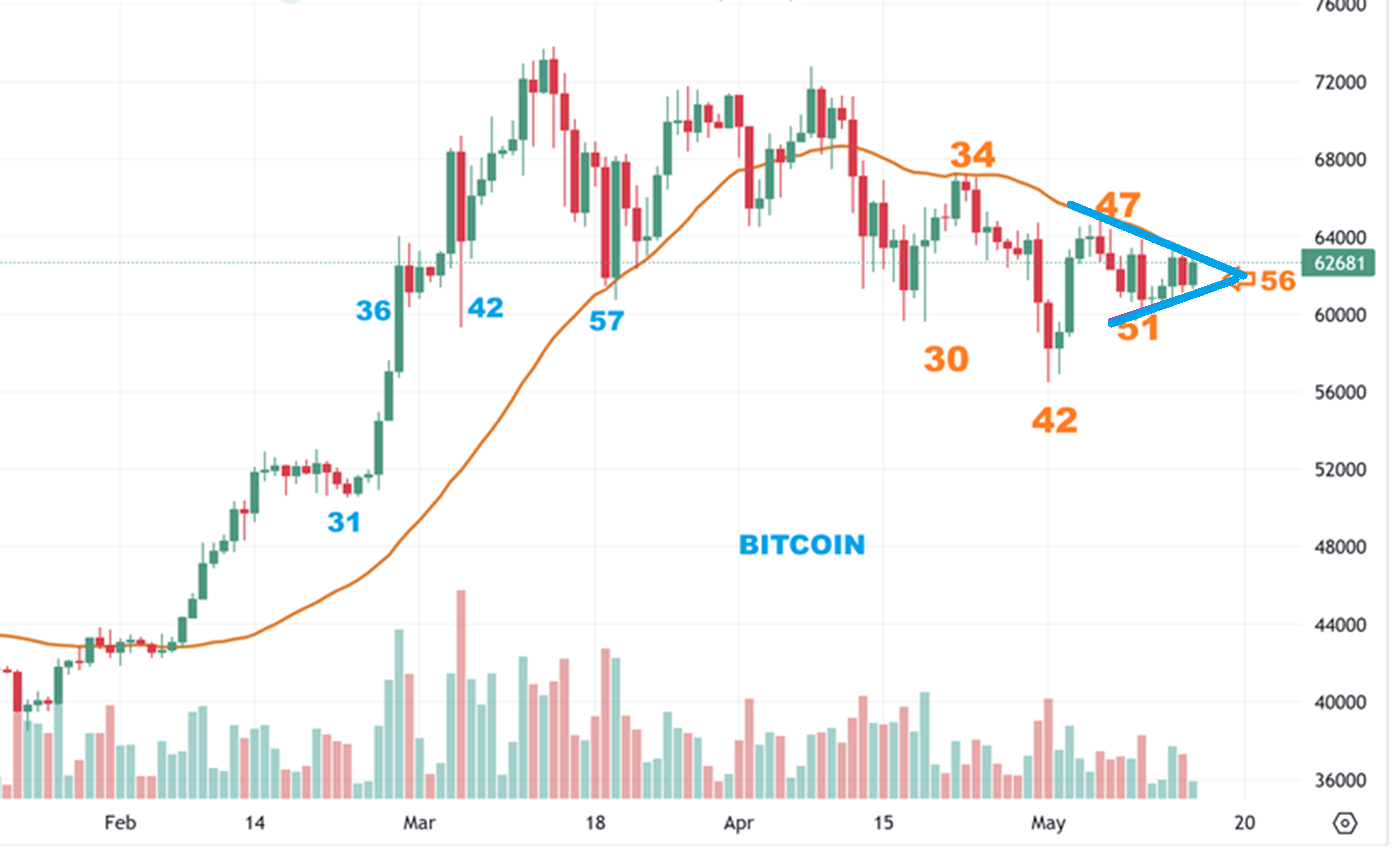
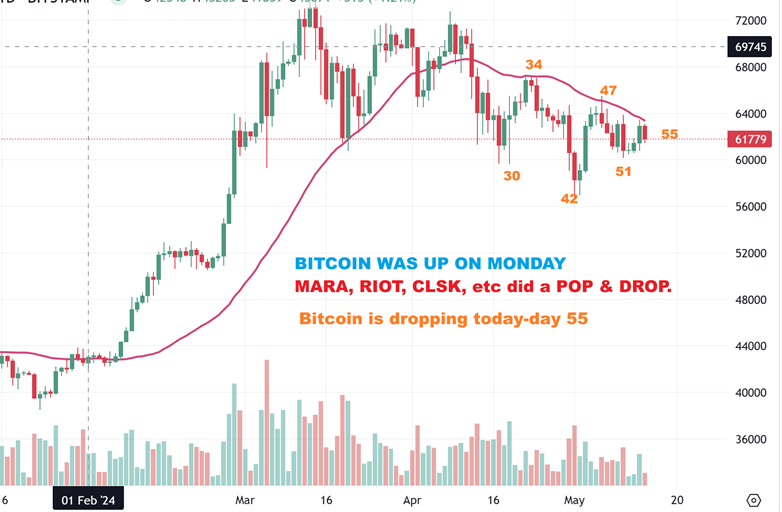
BITCOIN FROM YESTERDAY: Bitcoin was dropping on Day 55. I said that I feel that a break below day 42 and a reversal will be the next buy. We have been very patient while waiting for this trade, so I really hope that the Crypto stocks drop and quickly recover and rally with Bitcoin.
.
BITCOIN – This is day 56 and normally I would expect a drop into day 60ish to a new low. THAT would be a final drop leading to my buy. I do want to mention 1 thing that I thought of yesterday.
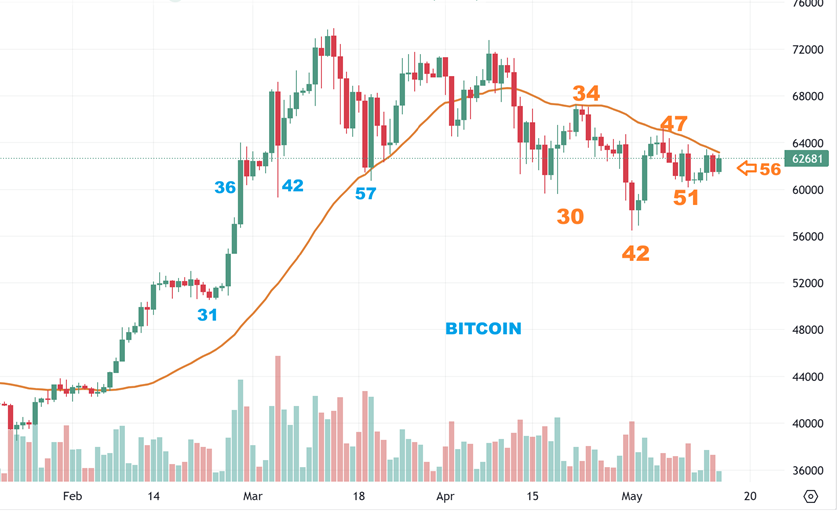
IF THIS FORMS A SMALL TRIANGLE HERE AND BREAKS ABOVE THAT UPPER LINE (All you have to see is a new high above the day 54 or 55 area), THAT may be signaling that it is a breakout and ready to run.
I have mentioned many times in past reports that at times I see a triangle form and then break higher and THAT marks the dcl, even though the low can be slightly higher. Buying pressure keeps the low from breaking below the triangle. I AM NOT SAYING that this will happen, I am simply alerting you to it, just in case it happens in ‘real time’ midday today or tomorrow.