April 20 Weekend Report – Time To Relax, Less Trading?
Hi All, I wanted to release this report before leaving for the evening, so please excuse any typos, I don’t have time to proofread. Thanks!
.
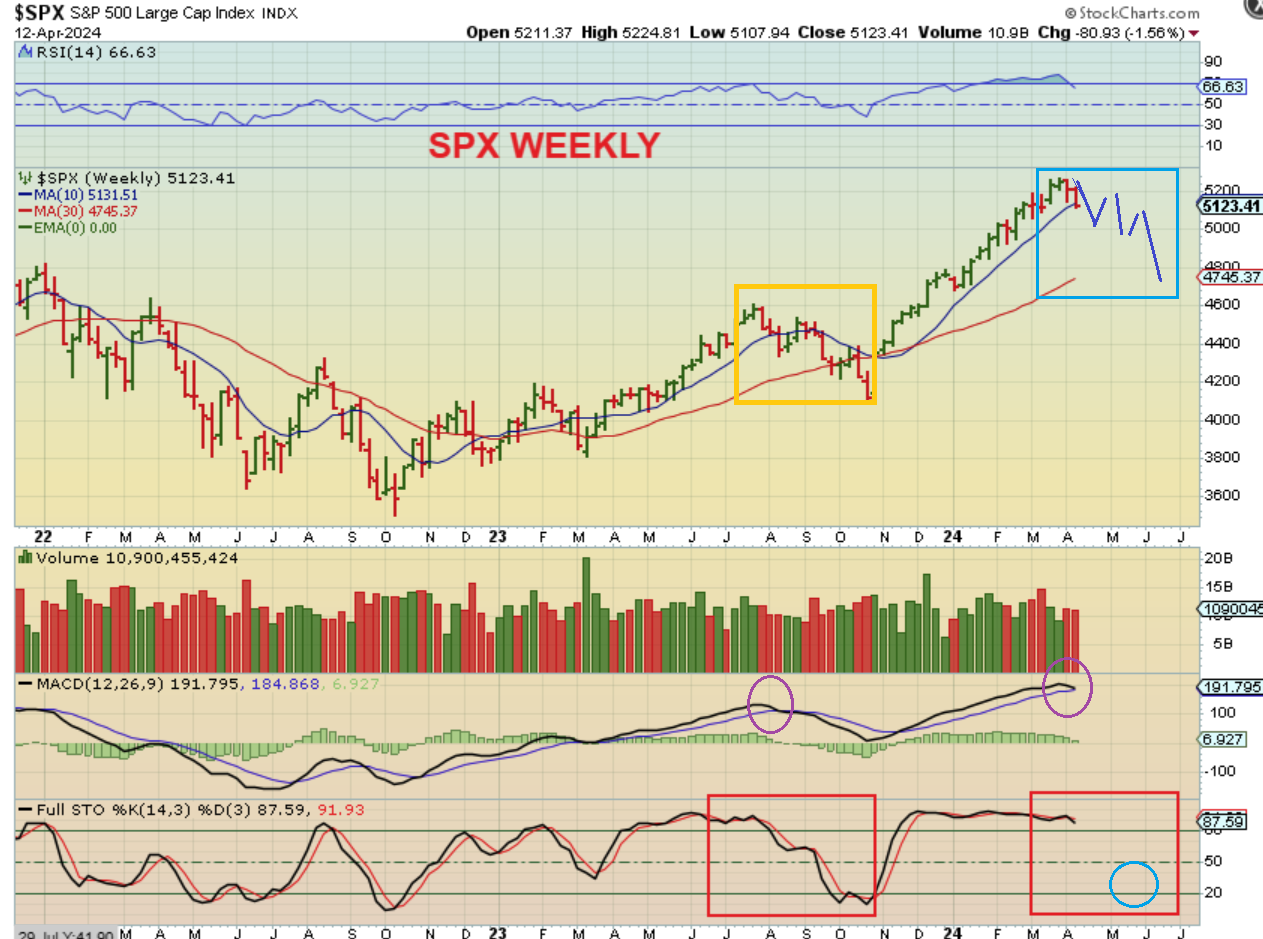
SPX WEEKLY APRIL 12 – Last week the SPX slightly broke below the 10 week ma. I said that we would probably see more downside then a bounce and more downside, etc, as drawn on last weekends chart.
.
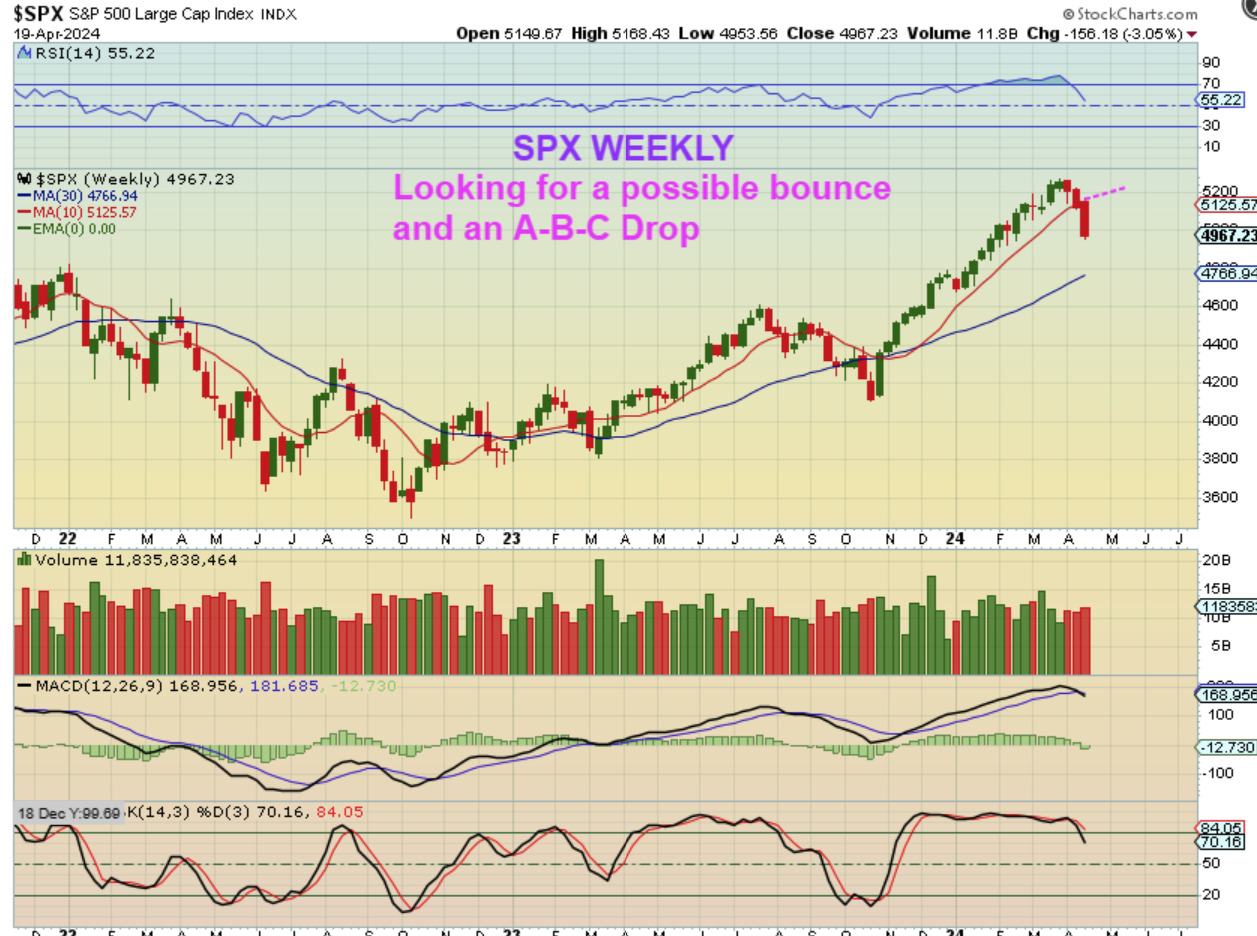
SPX WEEKLY – Well we sure did get some more downside, didn’t we! In the daily chart we are just about midway through a daily cycle, so we could still get a half cycle low, a bounce, and then another drop. Let me draw that idea for you…
.
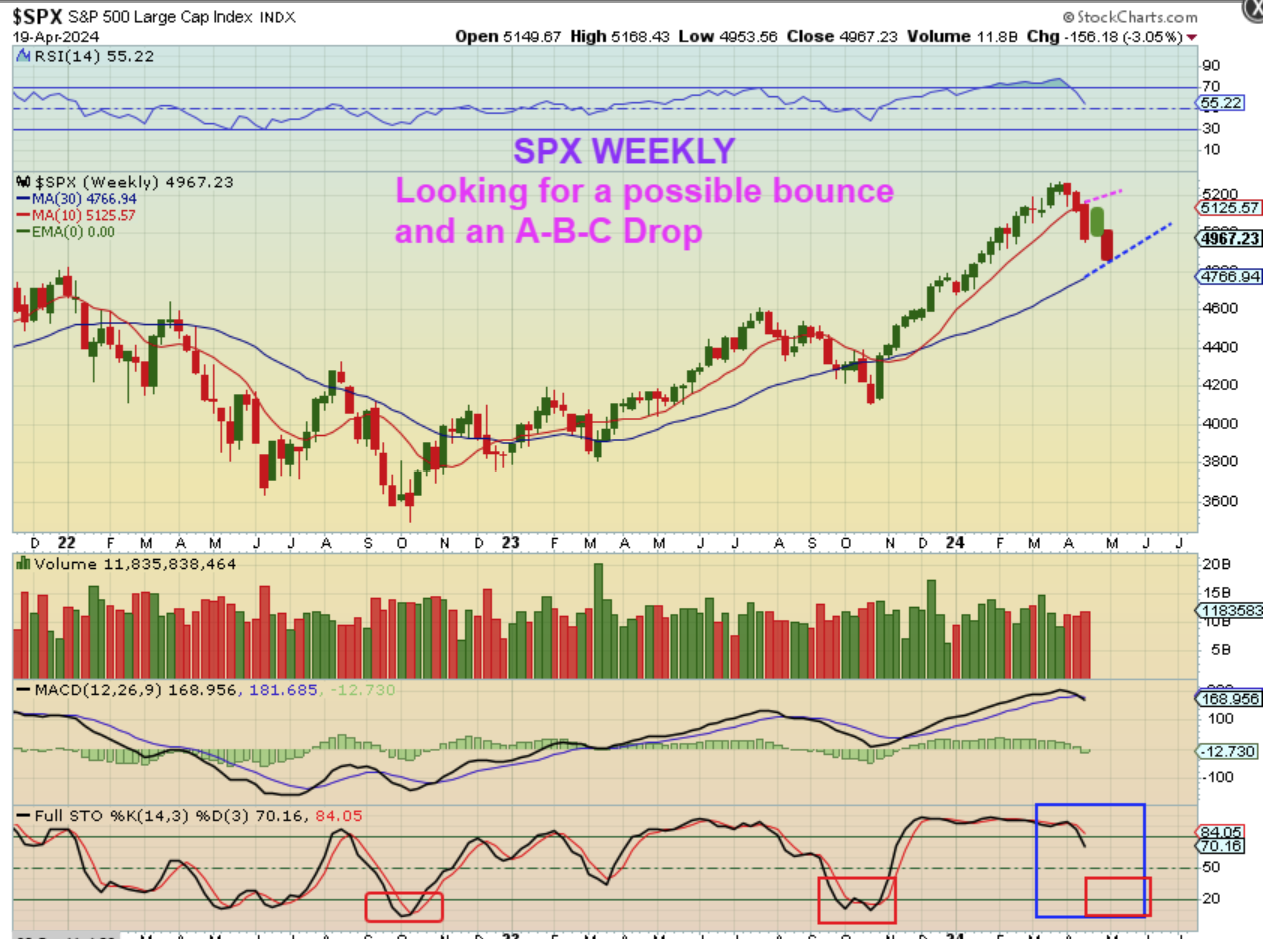
SPX WEEKLY – That could lead us to the 30 week ma. I want to show you the Nasdaq, however, because the drop on the tech sector was actually quite a drop, and that MIGHT be hinting at something more than a mild pullback.
.
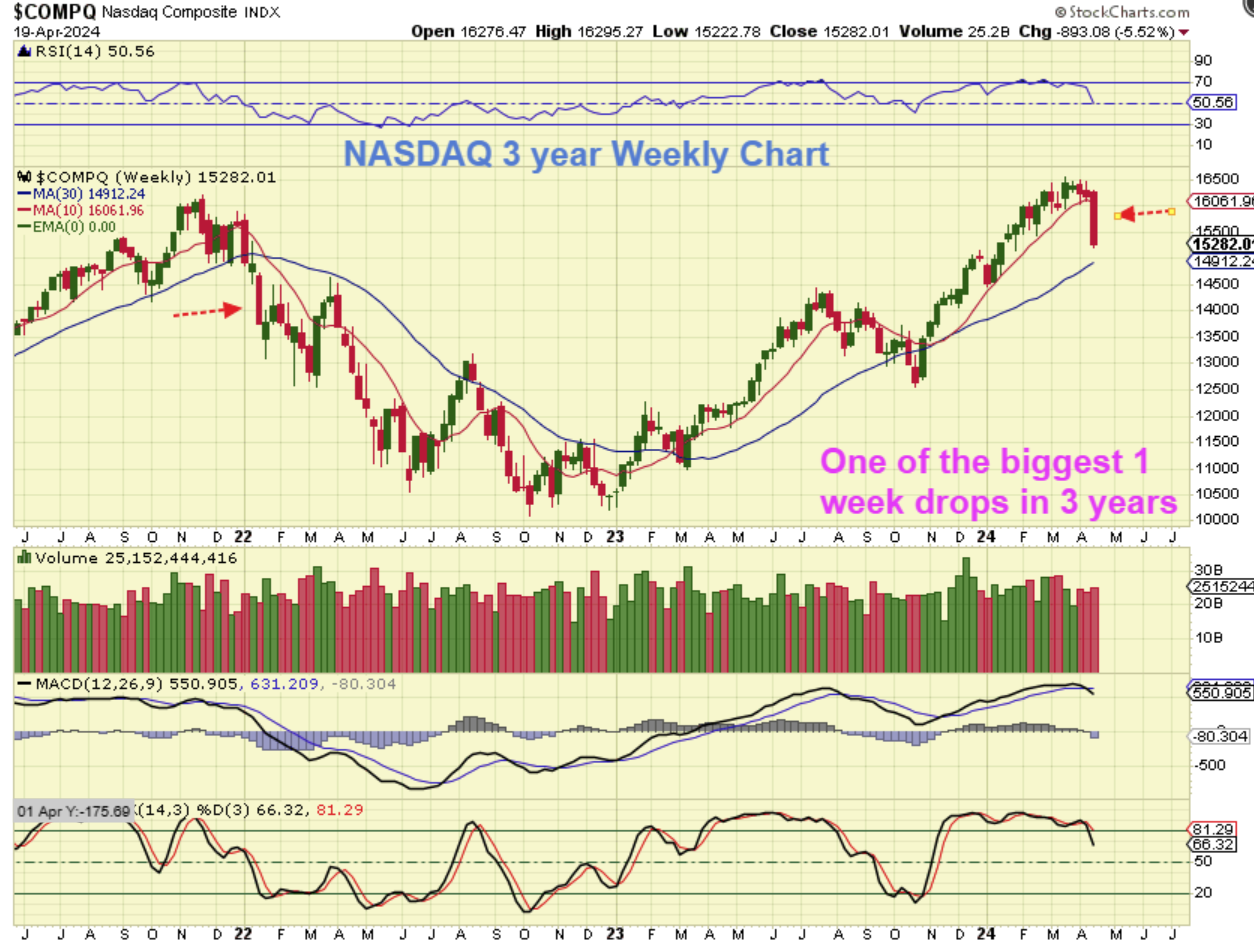
NASDAQ WEEKLY – So you can see that the drop on the tech sector was actually quite a drop! It was one of the biggest down weeks in the last 3 year, if you search through this chart. I am wondering if that MIGHT be hinting at something more than a mild pullback, since this is the 3rd daily cycle and we should still have a fourth one until we reach the ICL.
.
Is the size of these drops due to Tensions with the ongoing wars? Well, we were due for a dip into a DCL and an ICL soon anyway, but that definitely may be playing into the size of these drops. The markets do not like uncertainty.
.
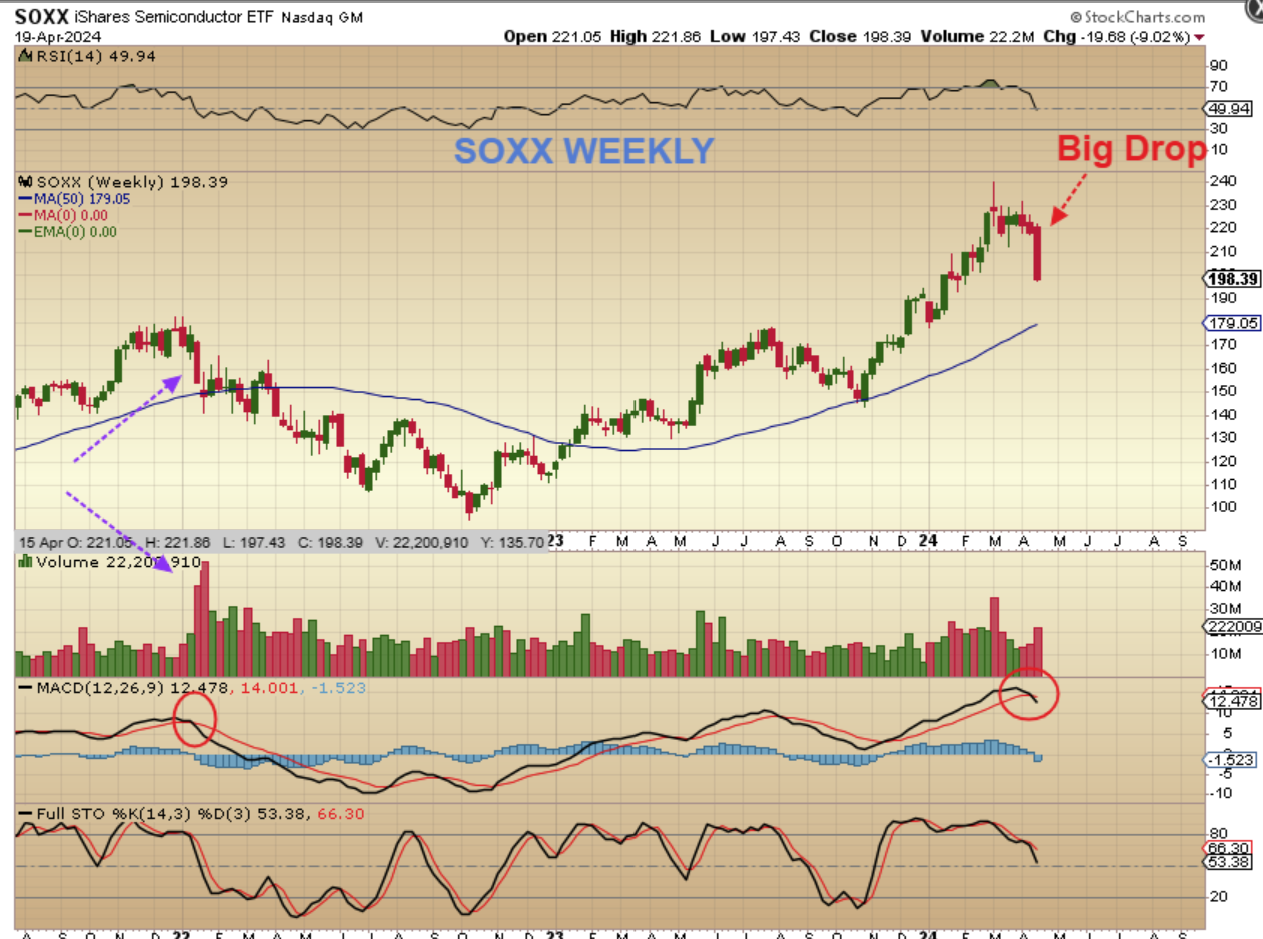
SOXX WEEKLY – We also had a large down week for the semiconductors, so again, this may be the start of a prolonged sell off into the ICL (with bounces along the way at half cycle lows and a dcl). I normally would expect a bounce as the half cycle low, but if the selling simply escalates, we could see a continuation, or another drop next week.
.
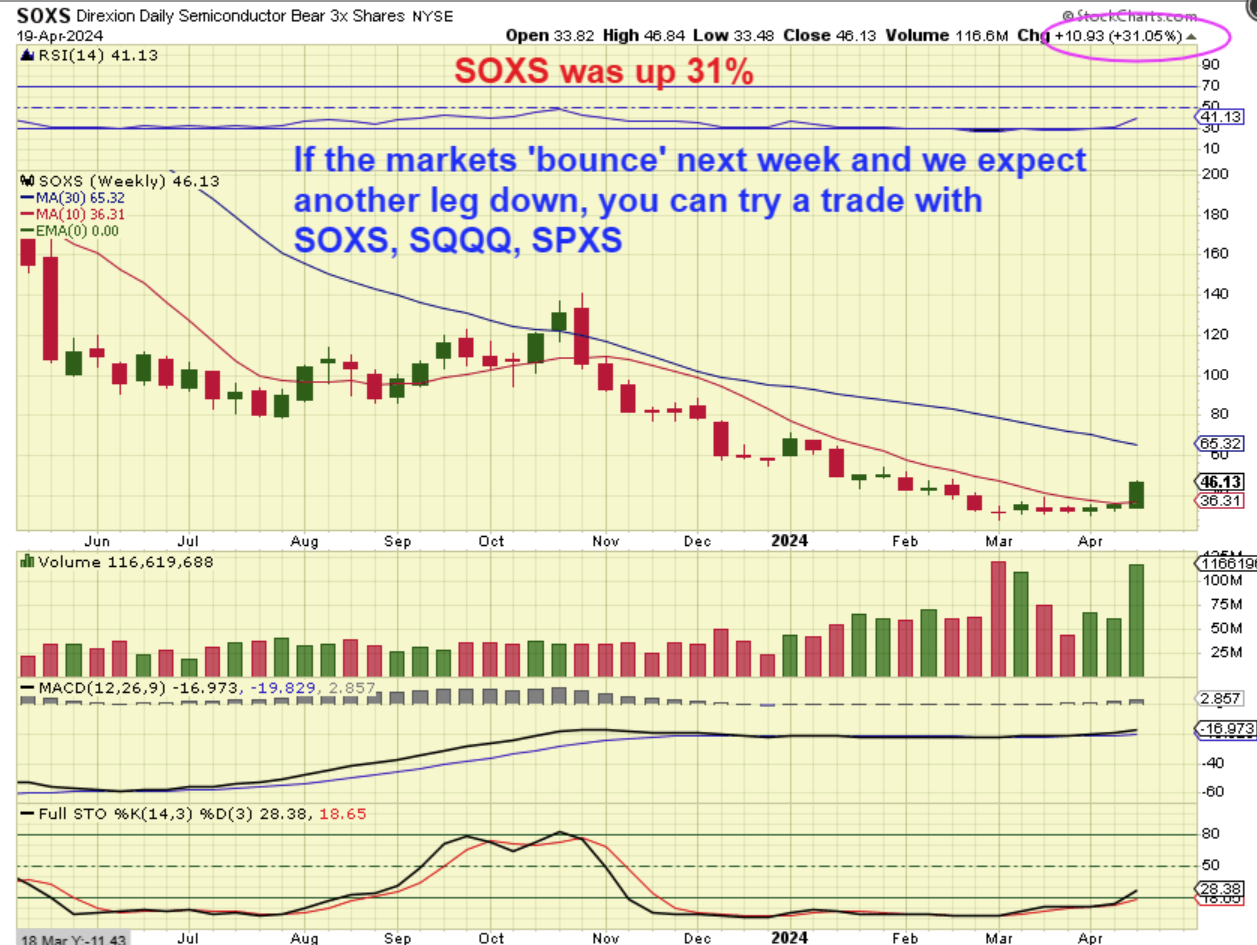
SOXS WEEKLY – Last week I also mentioned the short trade with the SOXS, SQQQ, or SPXS. I took a small trade there and jumped out so early that I regret it! I’m just not good at riding a short position, especially in a bull market, and I thought that we were due for a half cycle low bounce. Well, THAT said, the SOXS was up 31% for the week alone. I think I caught maybe 6% of that with a small position. If the markets bounce at a half cycle low, I may take that trade again when the bounce ends and we dip down into the dcl. I will discuss it in the weekday reports if it lines up that way.
.
LAST WEEKEND I MENTIONED THAT I’D LOOK FOR A PULLBACK TO AROUND $80 FOR A DCL: I said…
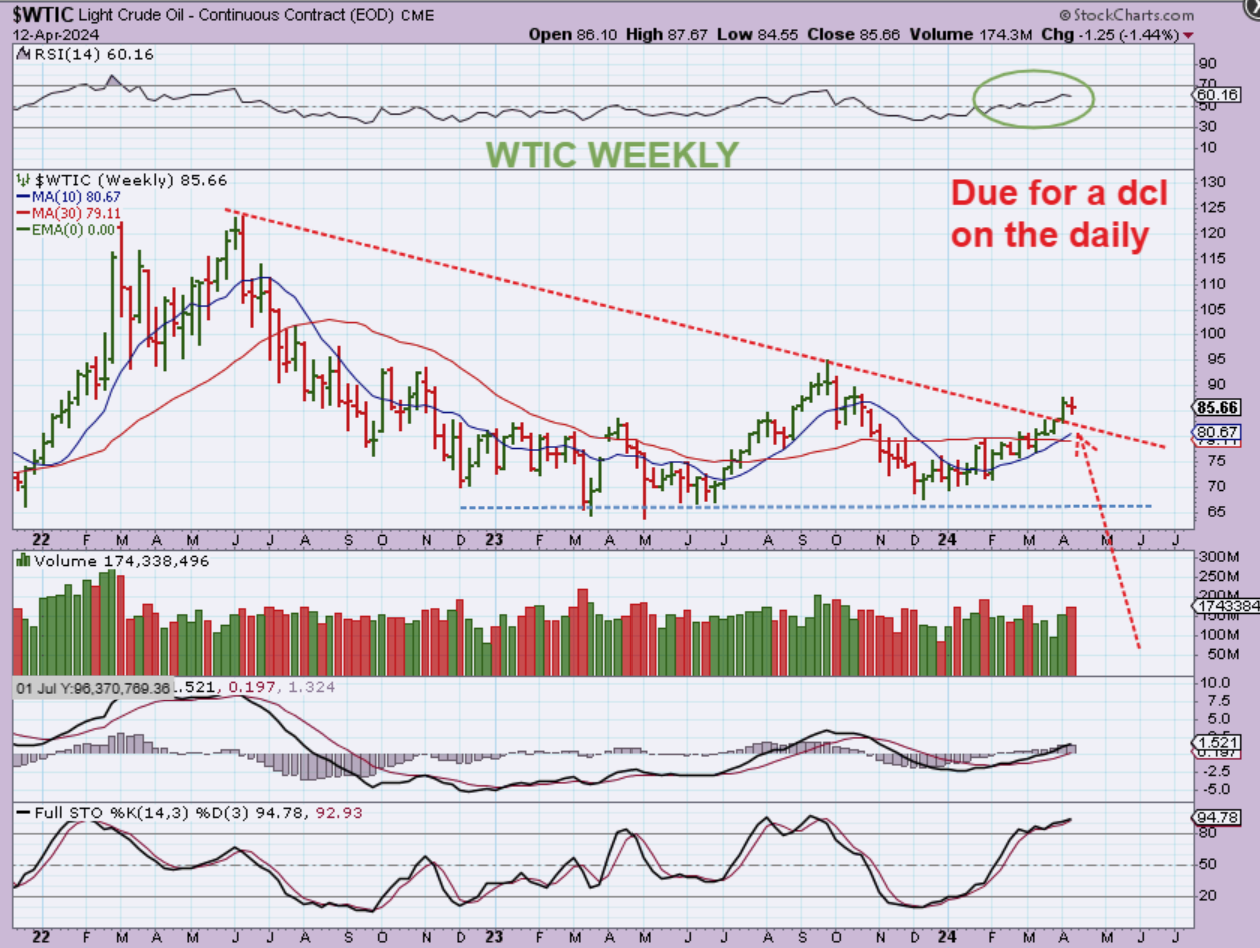
WTIC WEEKLY – We caught the lows in Dec/January, but it was too choppy for me, so I (we) traded Crypto stocks, Mj Stocks, Biotech, etc. Oil was on now day 47 on Friday, so even though it has been bullish, its due for a dip into a dcl. That dip often lasts around 50 days, so a back test of this breakout may be all that we get. We are at $85, the 10 week ma is at $80, so a dcl could come anywhere in that area. I have mentioned MRO, VLO, NOG, ERF, APA, OKE, XOP & GUSH, etc as trades here over the past few months.
.
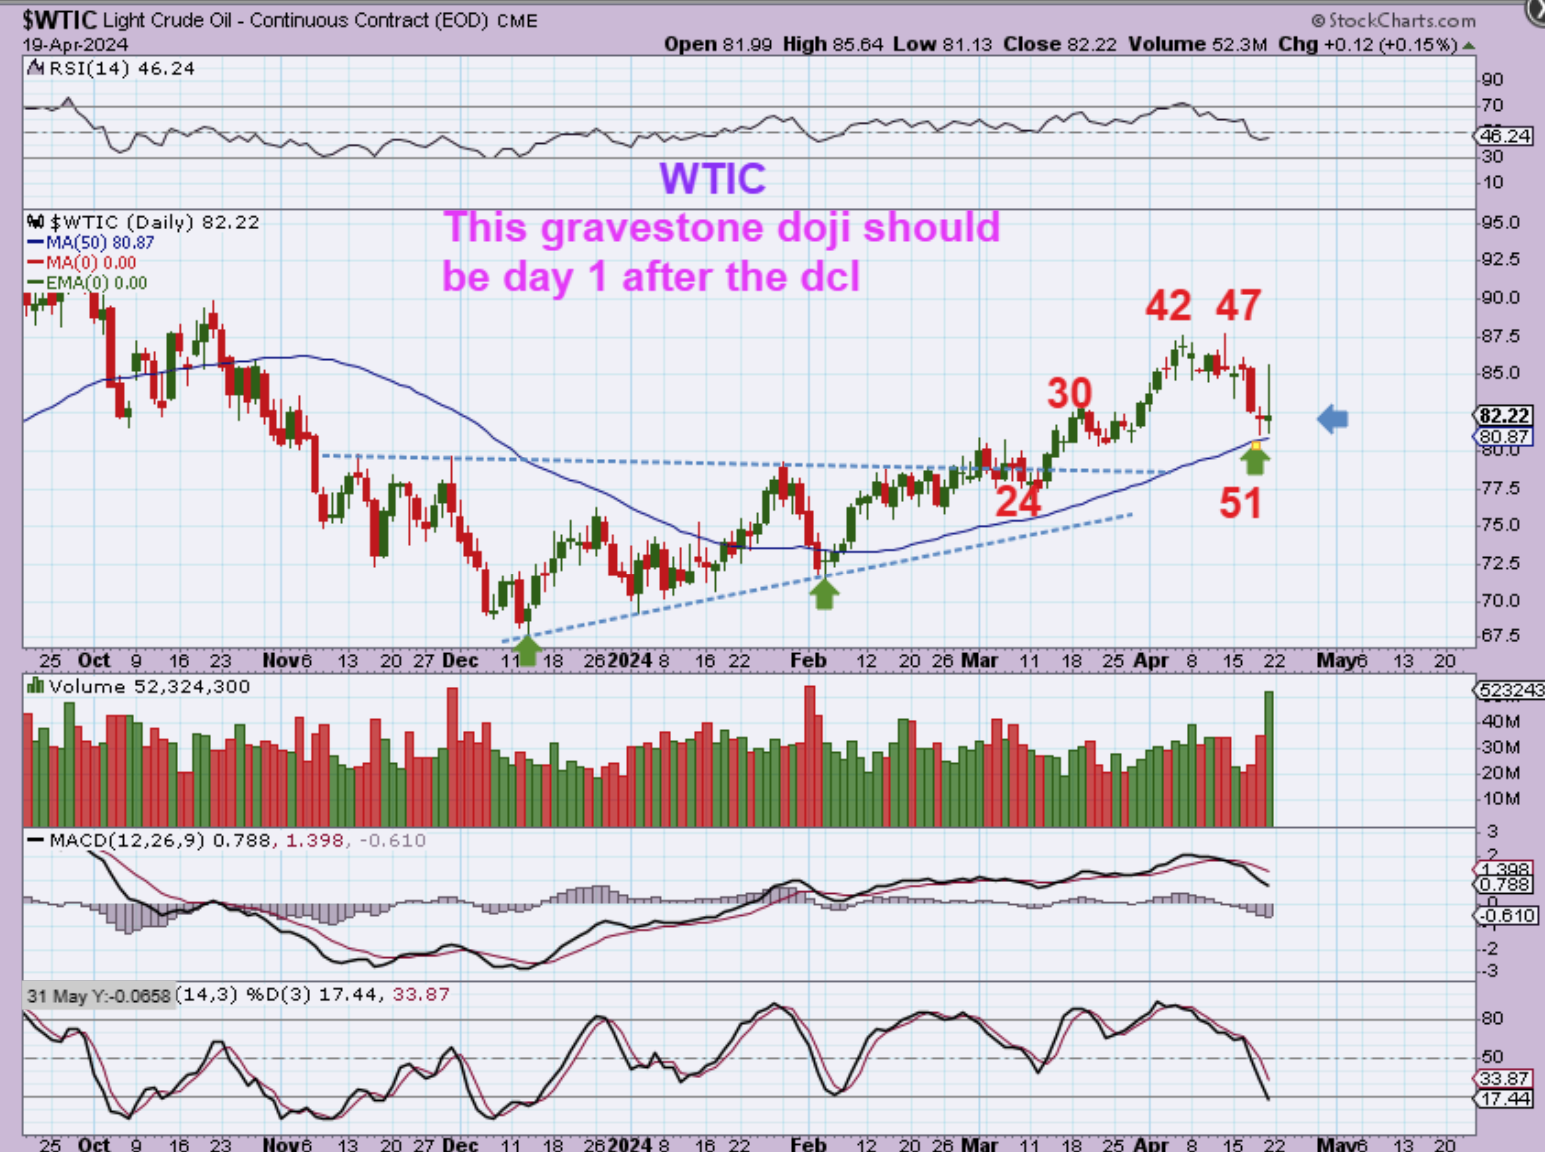
WTIC DAILY – Oil dropped to $81.06 on Thursday at the 50 sma and I mentioned in Fridays report that I think that is the dcl. Oil shot up and sold off on Friday, leaving us a very high-volume gravestone doji, and I still think that this is now day 1 of the 3rd daily cycle.
.
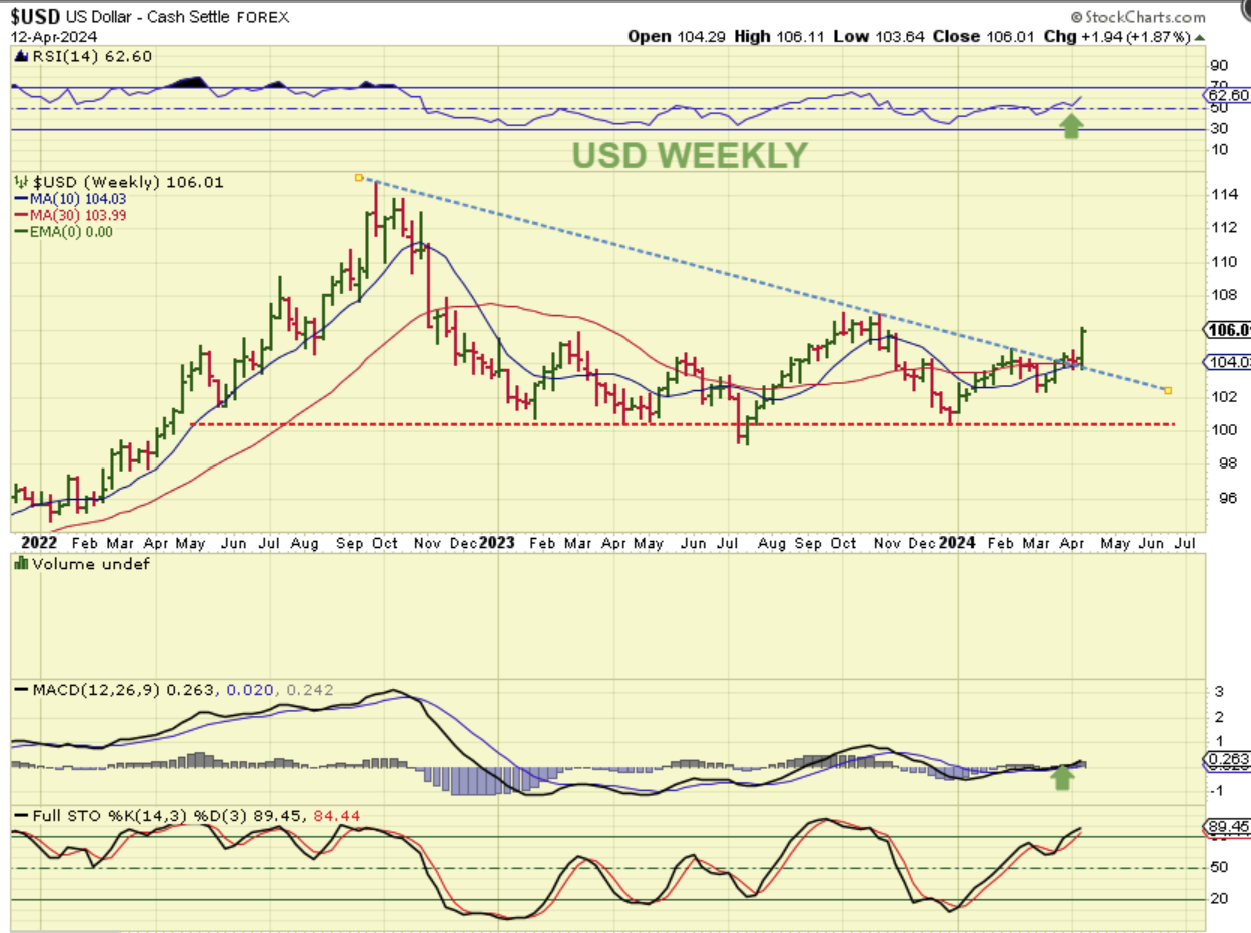
LAST WEEK THE USD WAS AT $106 AND I SHOWED THIS BULLISH BREAKOUT.
This is very bullish for the USD can might be attributed to the higher CPI Numbers (no rate cuts for the foreseeable future).
.
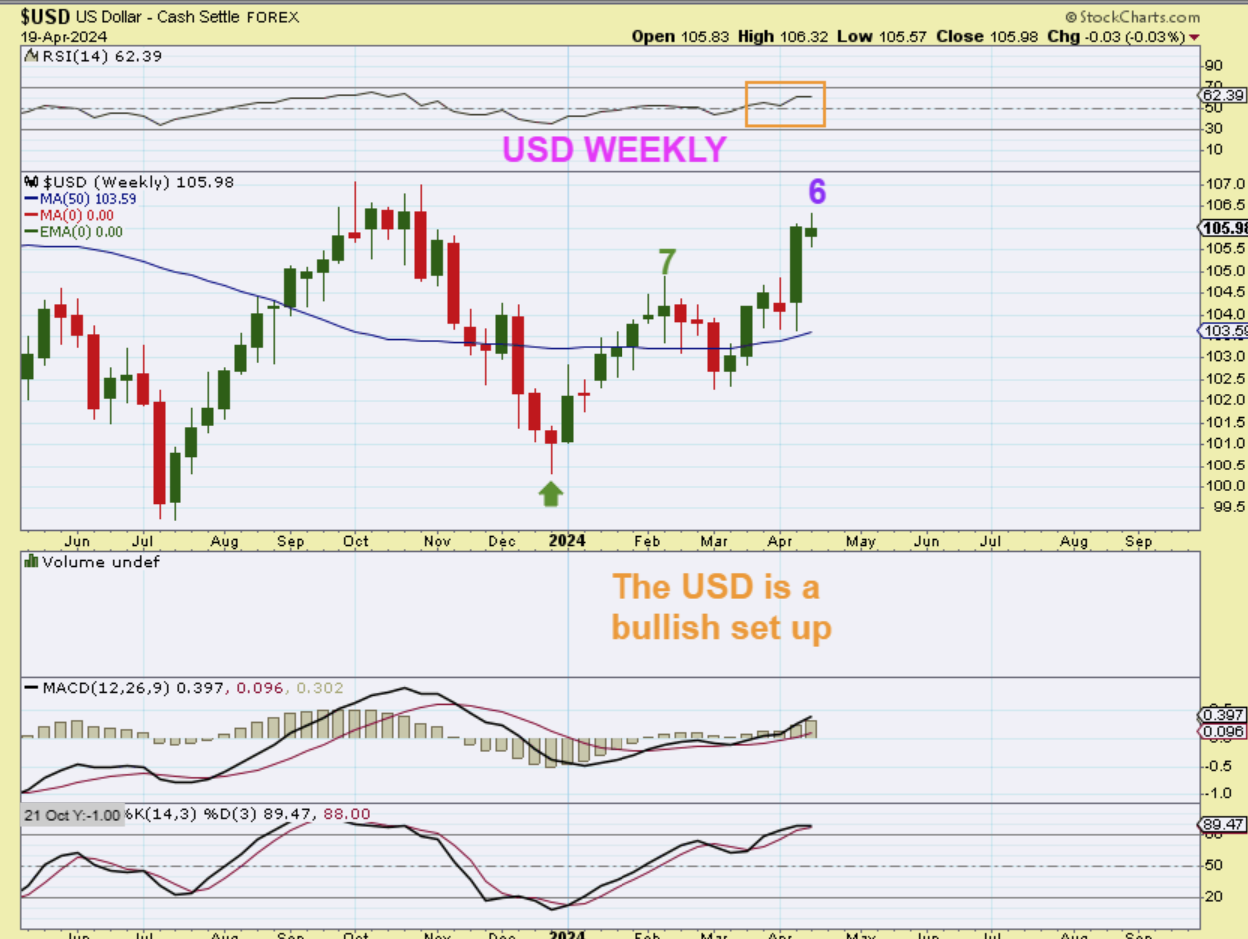
USD WEEKLY APRIL 19 – The USD stalled a little this week, but it was still a green week, and this chart is bullish because it gave the USD a higher low and a higher high, plus a MACD cross upward and a back-test ‘kiss’ to confirm the upward momentum. The USD has been bullish, but Gold has been bullish too. I pointed out in last weeks report that they can run together at times, and they have moved higher in the past. I will show that again…
.
People get concerned about Gold when the USD is rising, but I pointed out in last weeks report that they can run together at times, and they have moved higher in the past. I’m showing that here again…
.
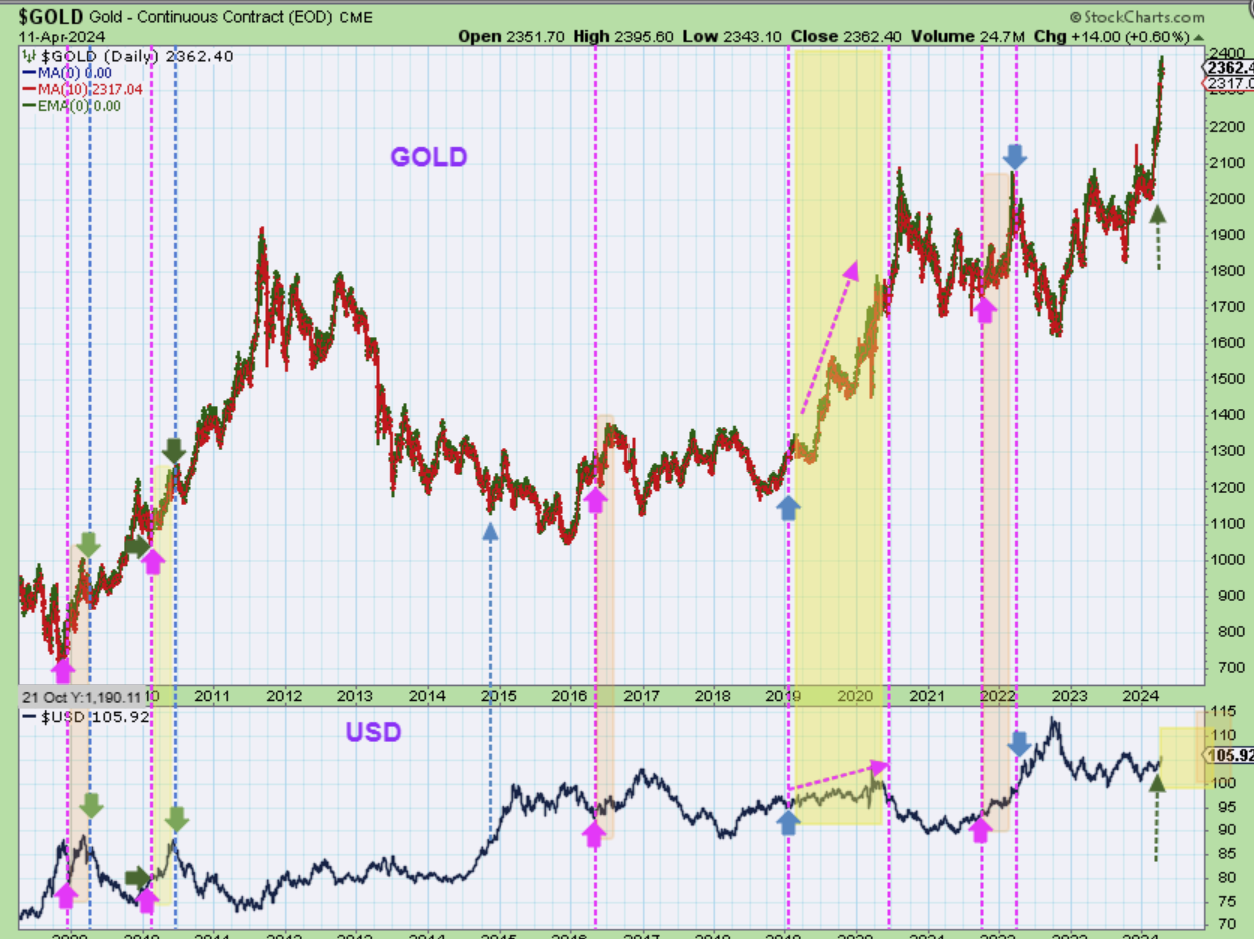
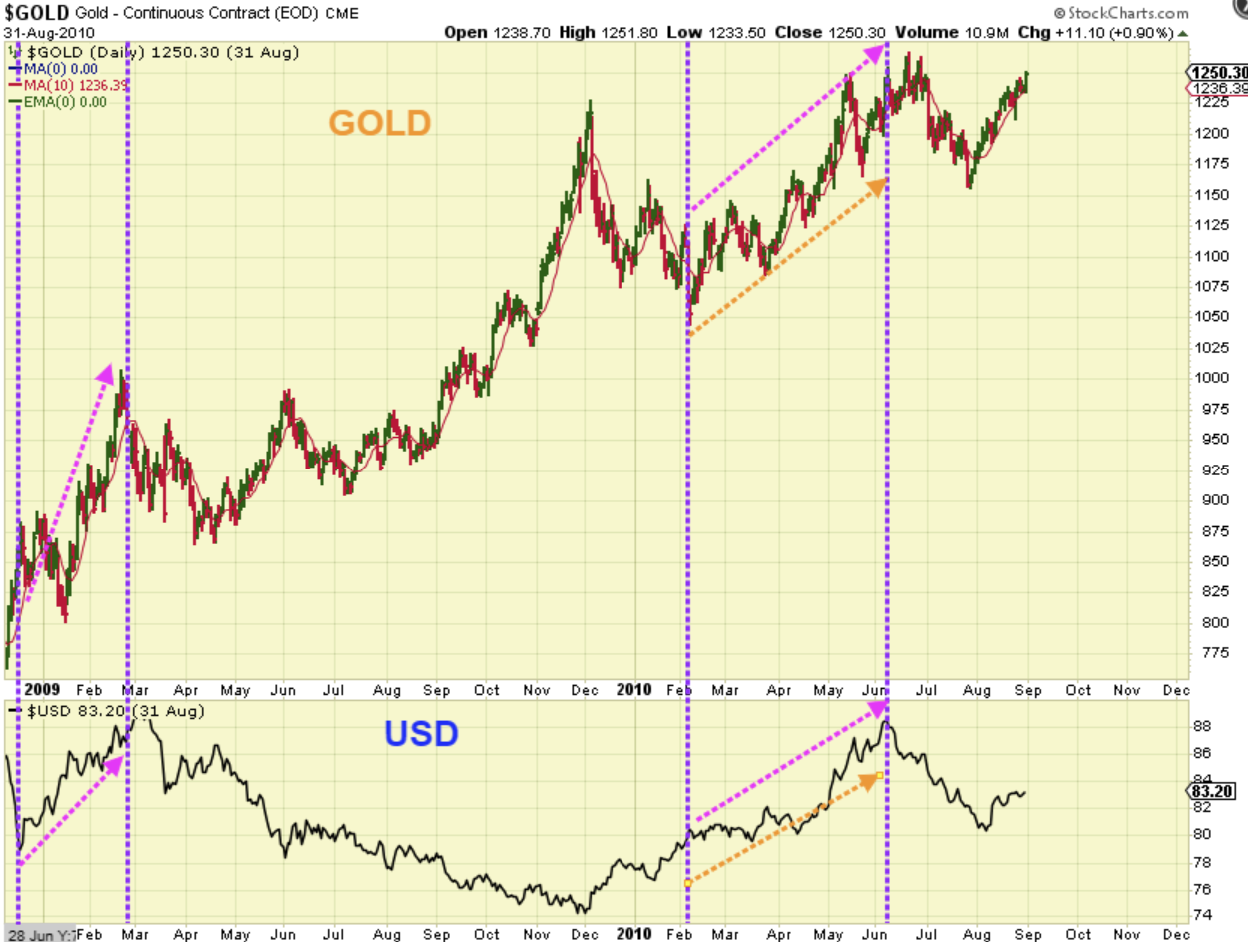
This chart shows The USD and GOLD rising together. Here we saw it in 2009, 2010, 2016, 2019-2020, and 2022, so it can happen and it has happened. Let’s zoom in on those smaller 2009 & 2010 area…
.
LAST WEEK I SAID:
Here we’ll zoom in on 2 of the times when the USD ran higher with Gold. In each case it lasted for few months and I think that we’ll see that happen again. The only thing that may be different is that as the USD rises, Gold may dip, and then when the USD dips, Gold may rise (alternating or taking turns). We’ll see, but both Gold & The USD are bullish as of right now.
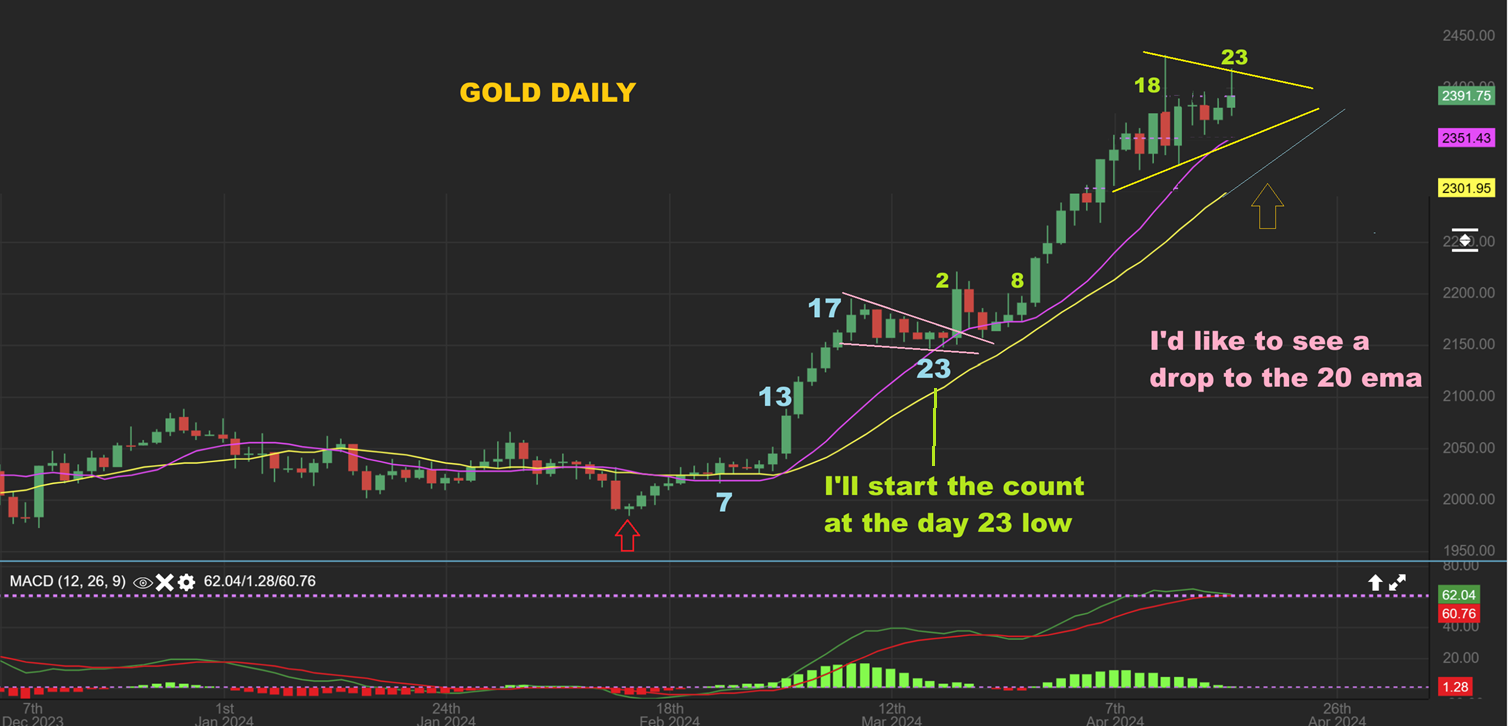
GOLD DAILY – It doesn’t really matter whether I count Golds dcl from the Spike out of the triangle or from the low that came right before that (a 2 day difference), because either way, we should be near the timing for a pullback into a dcl. Gold has been very strong and even with that Spike candle that often becomes a peak, Gold ran higher last week.
.
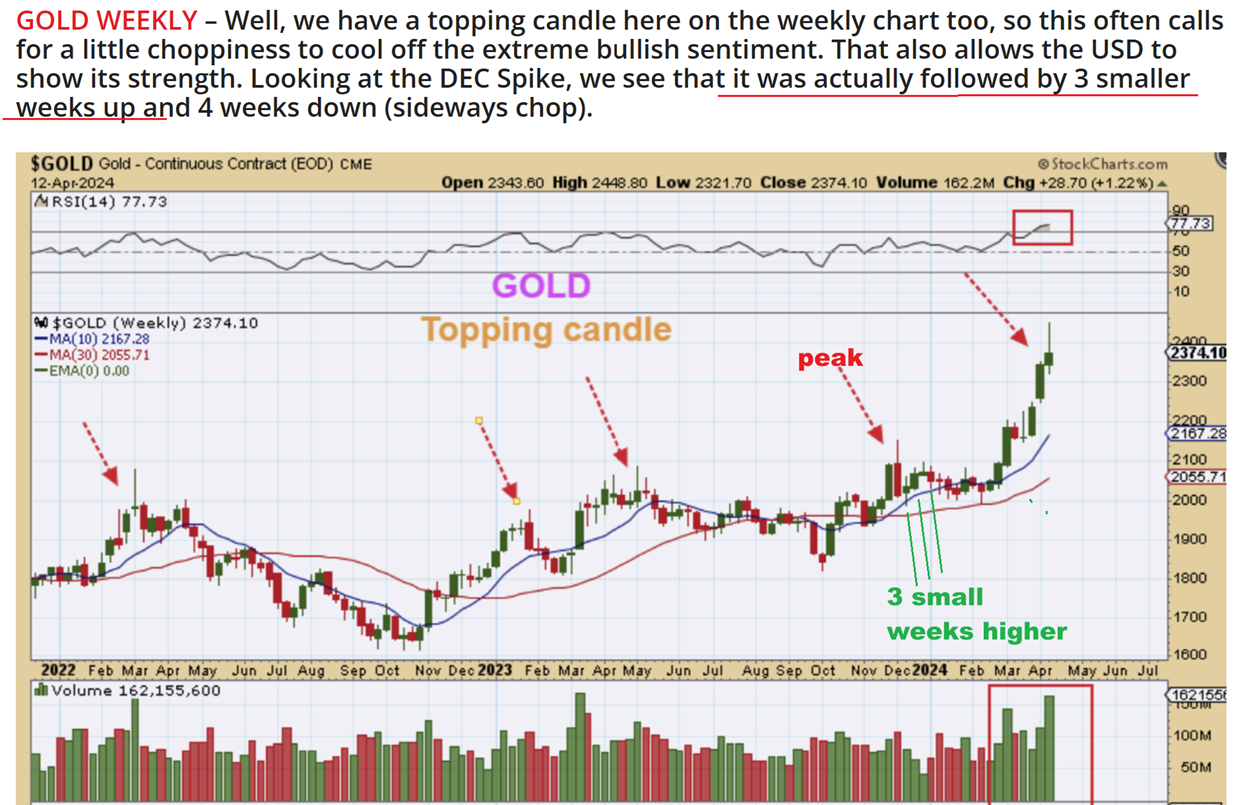
GOLD WEEKLY – Last week I mentioned that these ‘Spikes’ are usually a peak, but we could see a little more upside first, like we saw with that December spike. I said this because it was still early in the daily cycle and I figured that Gold would drift higher. So I drew this last week…
.
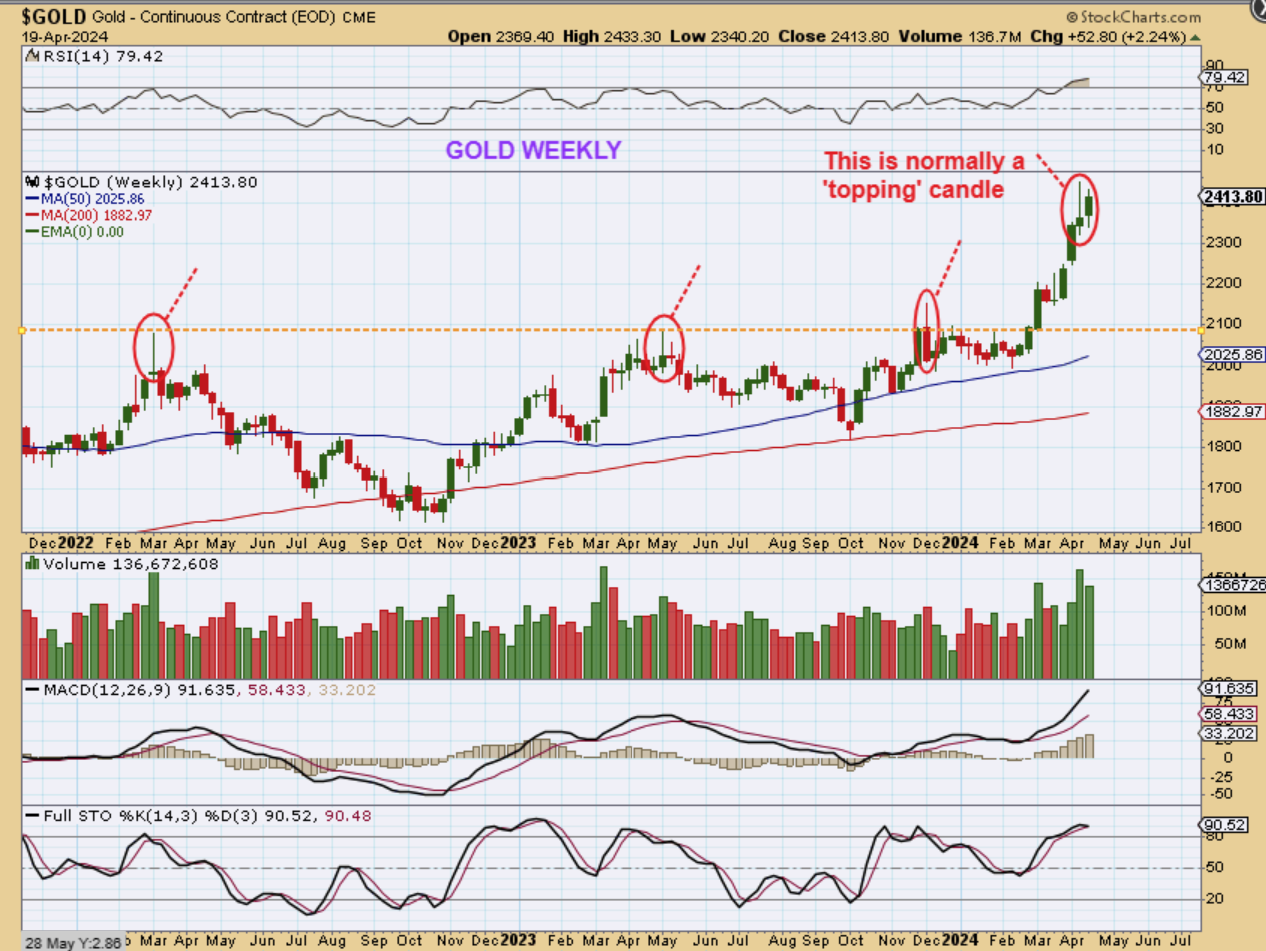
GOLD WEEKLY – I must admit that I didn’t expect Gold to move $52 higher, but it did! It was actually $72 higher, before it pulled back a bit. This may be due to the tensions in the Middle East. As you saw in the daily chart though, we are getting into the timing for a dcl, so that Spike candle may still remain as the peak. Another thing to take note of is that Gold moved up $72 last week and Miners did not, as you will see.
.
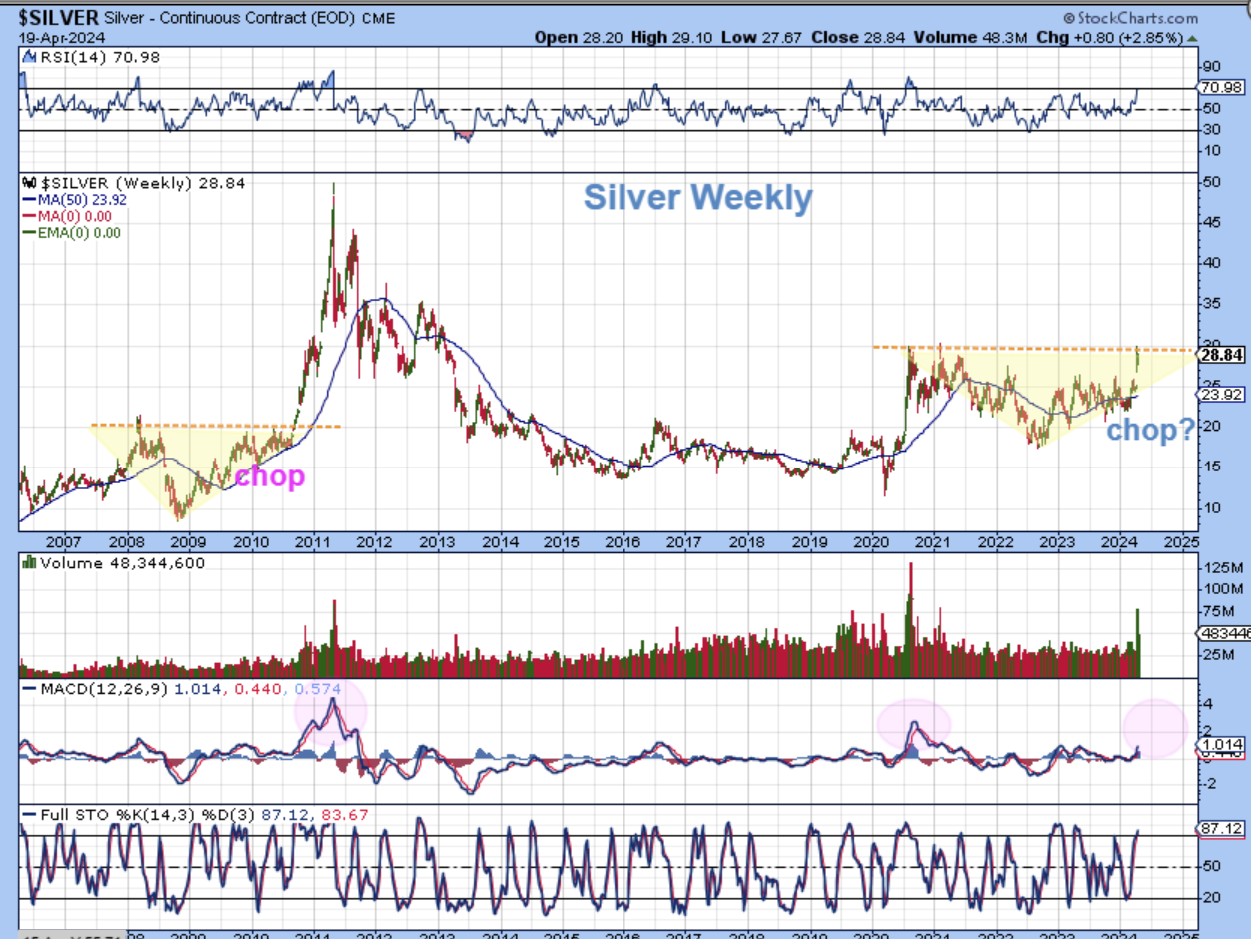
SILVER WEEKLY– Silver had reached my $30 target and I expect a little chop sideways before it breaks out, but when it breaks out from here, YOU WANT TO OWN SOME SILVER MINERS 🙂
.
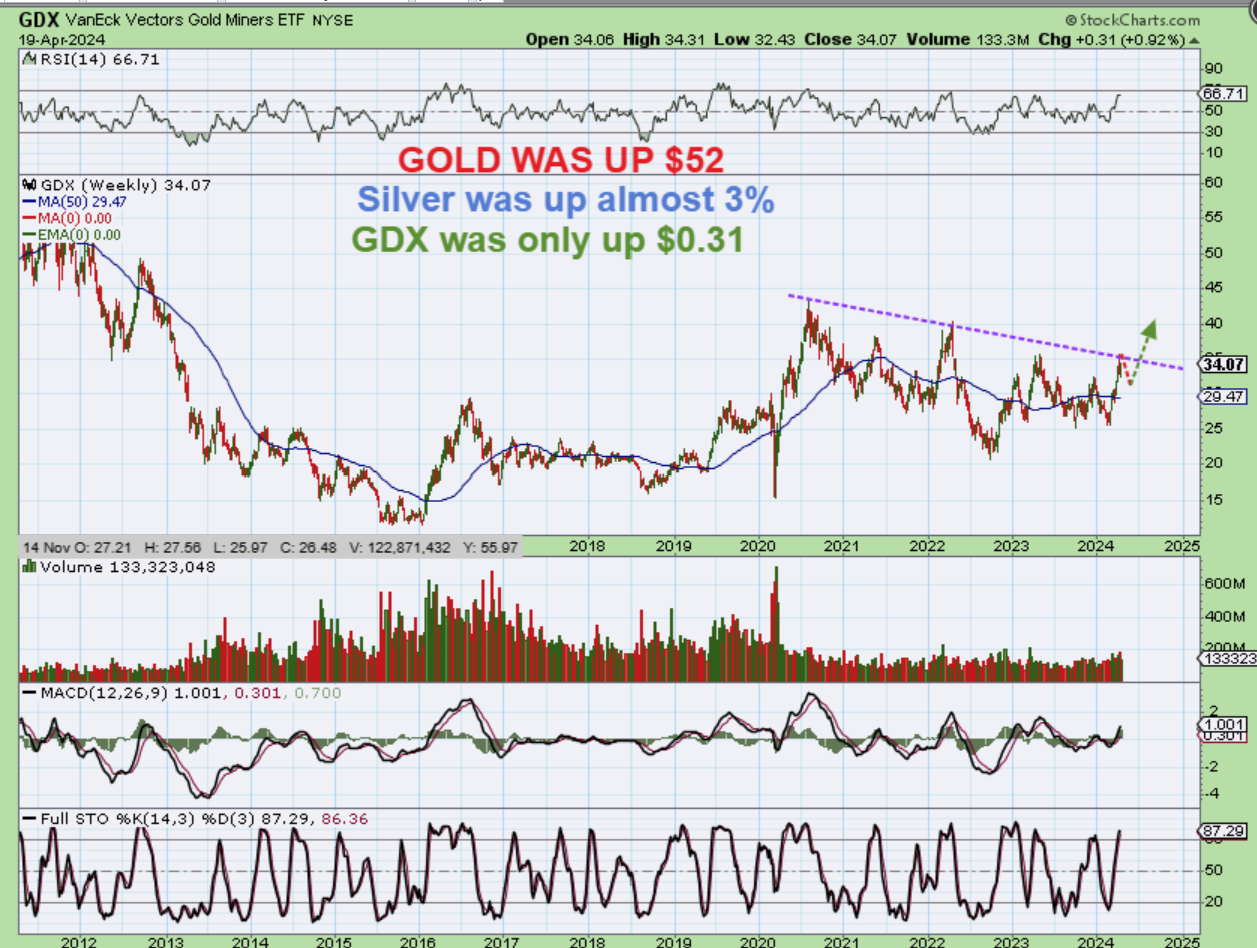
GDX WEEKLY – So
1. Gold rallied up $72 and closed up $52,
2. Silver was 3% higher, and yet…
3. The Miners couldn’t even gain 1%? This is likely telling us that Golds dip into a dcl is due to start next week.
.
It was probably a little more boring for traders this week, with the sharp pullback in the General Markets, unless you did go short. Like I mentioned, I went short, but just didn’t hold onto that position for long, since I was anticipating a half cycle bounce. When Iran and Israel started to exchange physical attacks, the General Markets seemed to lack buyers with the uncertainty, and the Gold Market saw some buying and strength. I do expect a dip in the Precious Metals Sector this week though, and that dcl will be a strong buying opportunity for miners. I will cover that in the daily reports.
,
At this point we still have bull markets, but they are experiencing normal corrections and pullbacks into their dcls at different times. Oil has or is very close to finishing its pullback into a dcl, so a long trade there may be profitable. A bounce in the General Markets may be ‘short-able’, if we get that bounce. I am expecting Gold, Silver, and The Miners to pull back into their dcl, so let’s pay close attention to that one. The Miners have been strong and they could perform nicely out of the next dcl too, even though it will be a 3rd daily cycle and we want to pay attention to that too. I’ll discuss Bitcoin below.
.
Enjoy your Weekend and thanks for being here at Chartfreak!
.
~ALEX
.
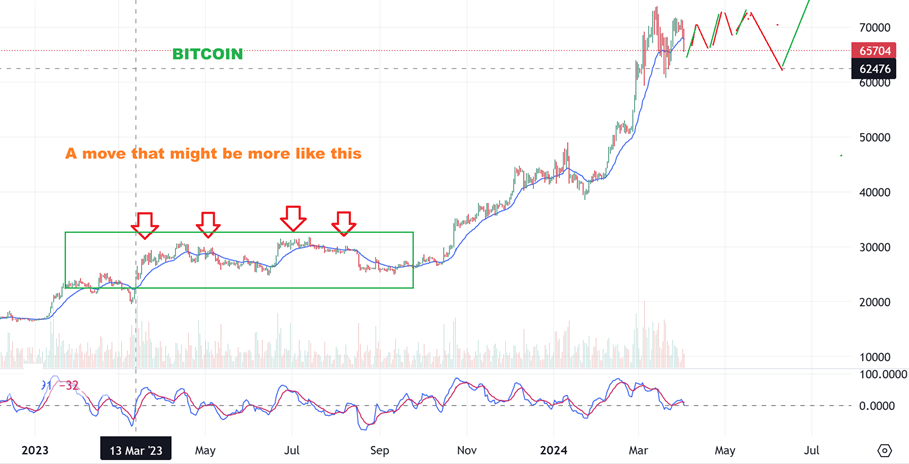
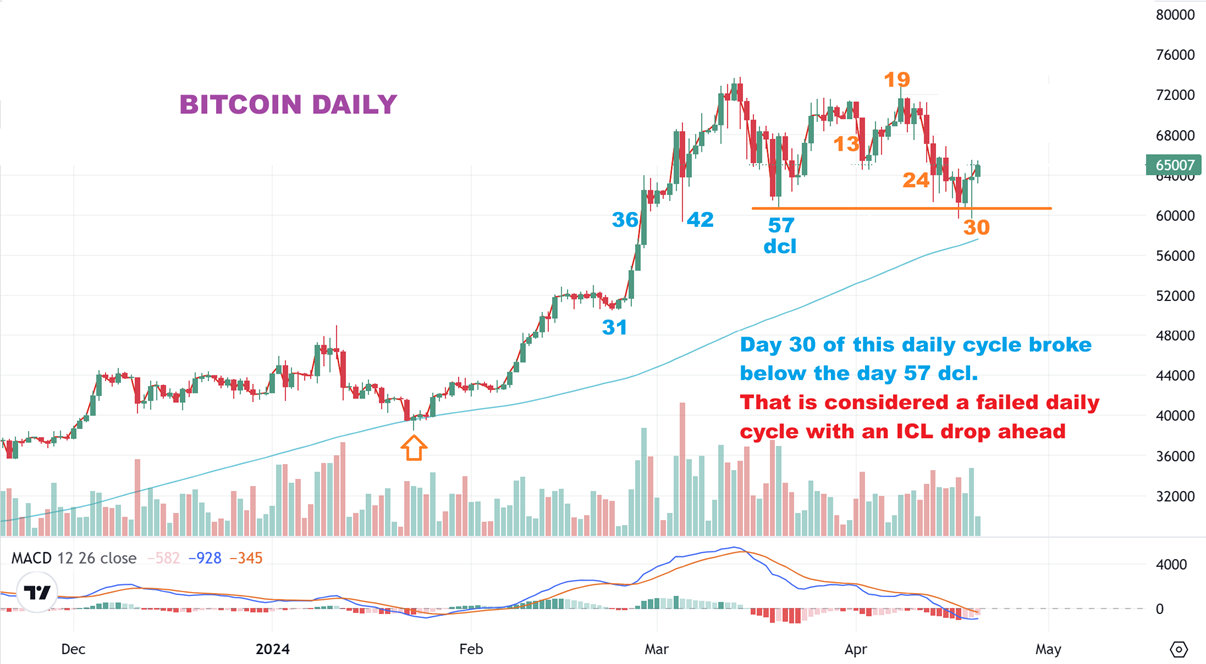
BITCOIN – I have discussed this a few times already, but it is worth repeating.
1. I was looking for a dcl around day 60, and we had a dcl right on time, at day 57.
2. I was then expecting a half cycle dip around day 30, but we did NOT want it to break that day 57 low.
3. We got a Half Cycle Low right on day 30, but day 28 & 30 broke below that last dcl, and this indicates a failure. What do I expect next?
.
I know that it seems like ‘institutional buying’ could save the day as they buy dips, but I have to stick with my ‘cycle analysis’ expectations as is. Since we got a Half Cycle Low on day 30, I expect a bounce, but day 28 & 30 broke below that last dcl, it indicates a failure. Here I have drawn what I would ‘Roughly’ expect next. It may be that the initial reaction to halving will give us that downside dip into an ICL, and that could lead to the $48,000 to $52,000 area. That should be a strong buy area too, at that time, and it’s really only 30 days away. 🙂
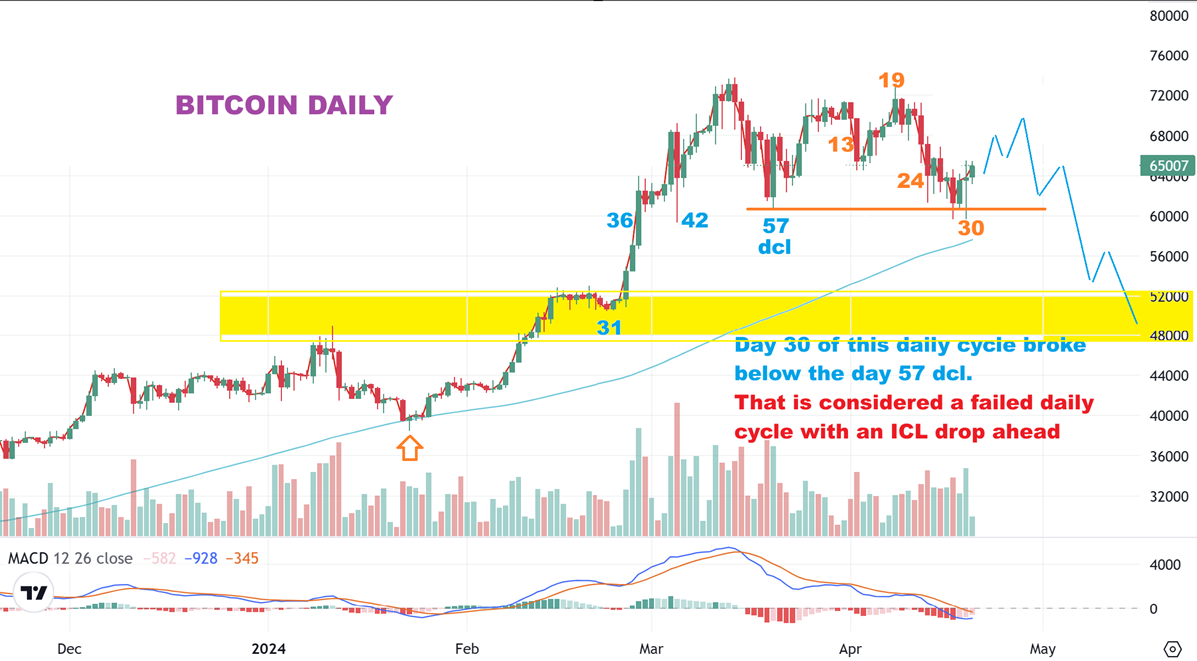
And honestly, this idea is not new to us, it is not a surprise. I have been saying this for quite a while, even before the lows were taken out, by showing this long choppy consolidation in previous reports as a possibility after halving. So this isn’t something surprising to us, but with a broken dcl, it indicates a lower low next as an ICL. That may be a little disappointing for those wanting to go long Crypto, but 30 days from now we could see some really nice entry prices.