Thursday March 14th
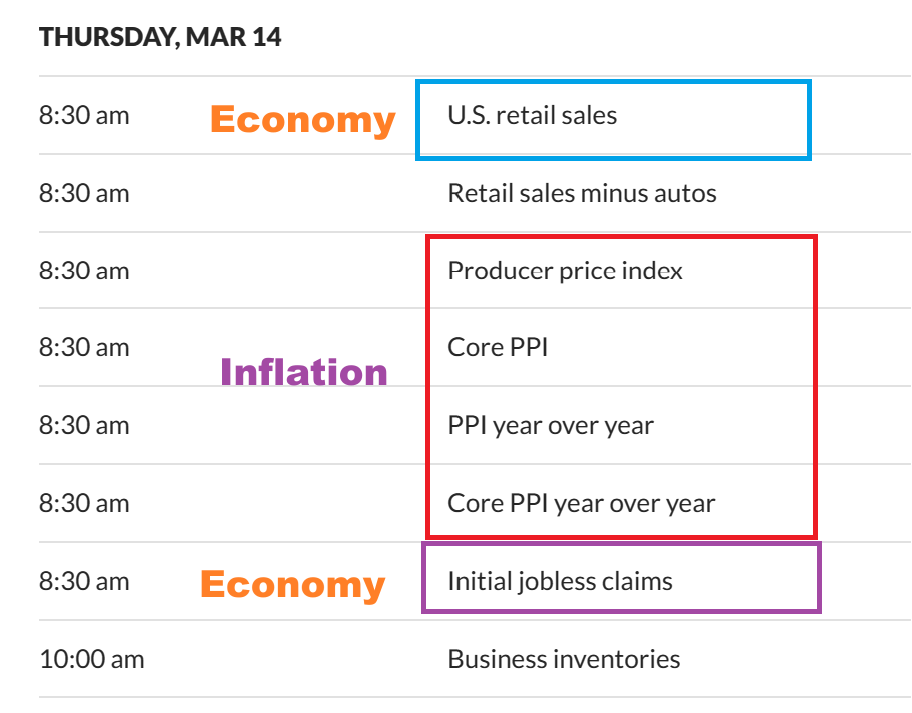
DATA seems a bit heavy today. On Tuesday we had the CPI (inflation Numbers) and the General Markets rallied while the Precious Metals dropped. Today we have the PPI (Inflation numbers), so we MIGHT get the same reaction, but with Jobless Claims and US Retail Sales added, the General Markets could dip. The ONLY reason that I say that is because we are so very due for a dcl 🙂
.
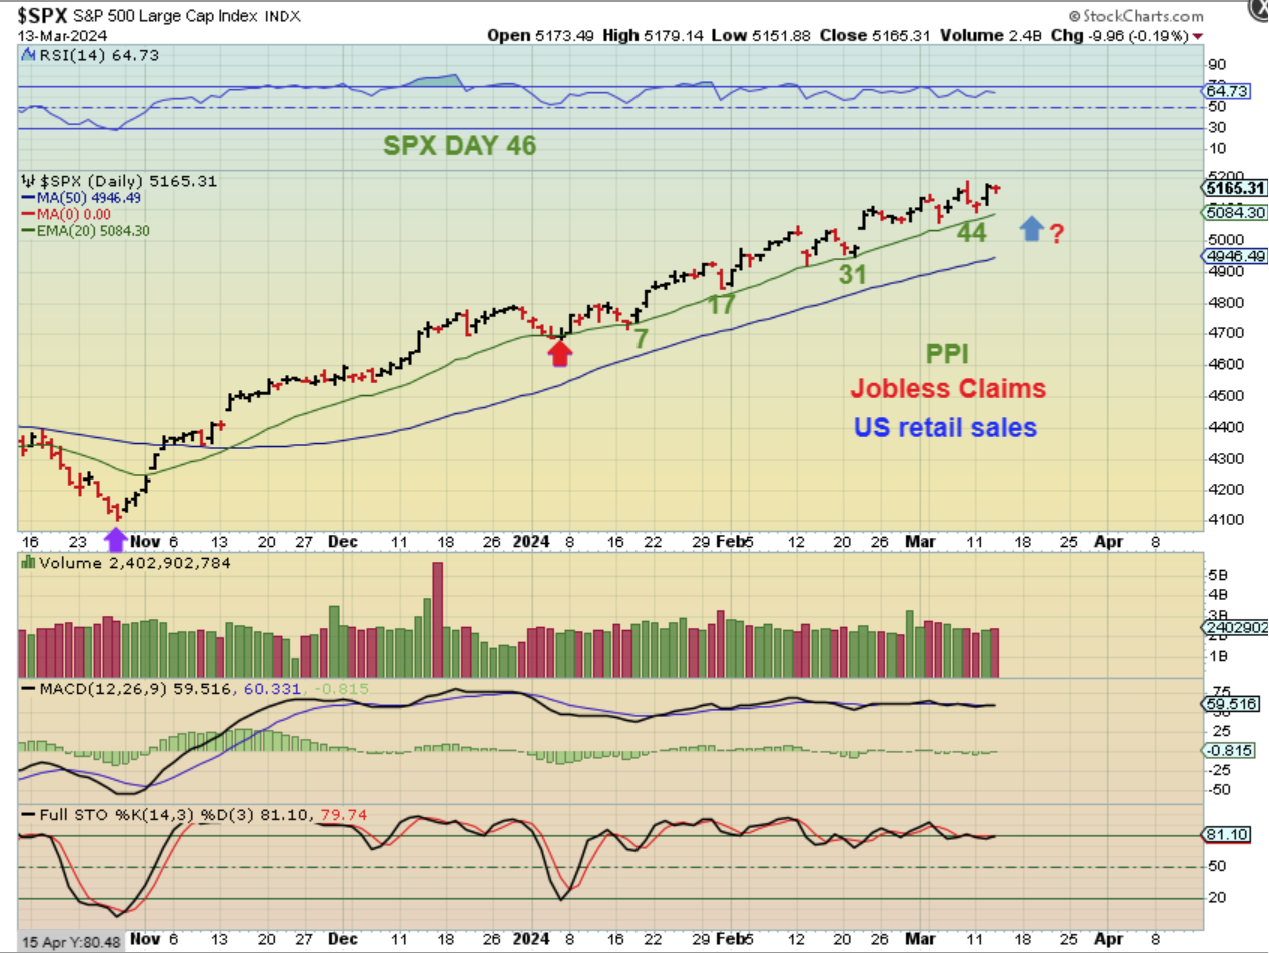
SPX – What can I say? Wednesday was day 46 and we are still near the highs. We do have a lot of data to be released at 8:30 a.m., so we’ll keep an eye on the futures Thursday morning.
.
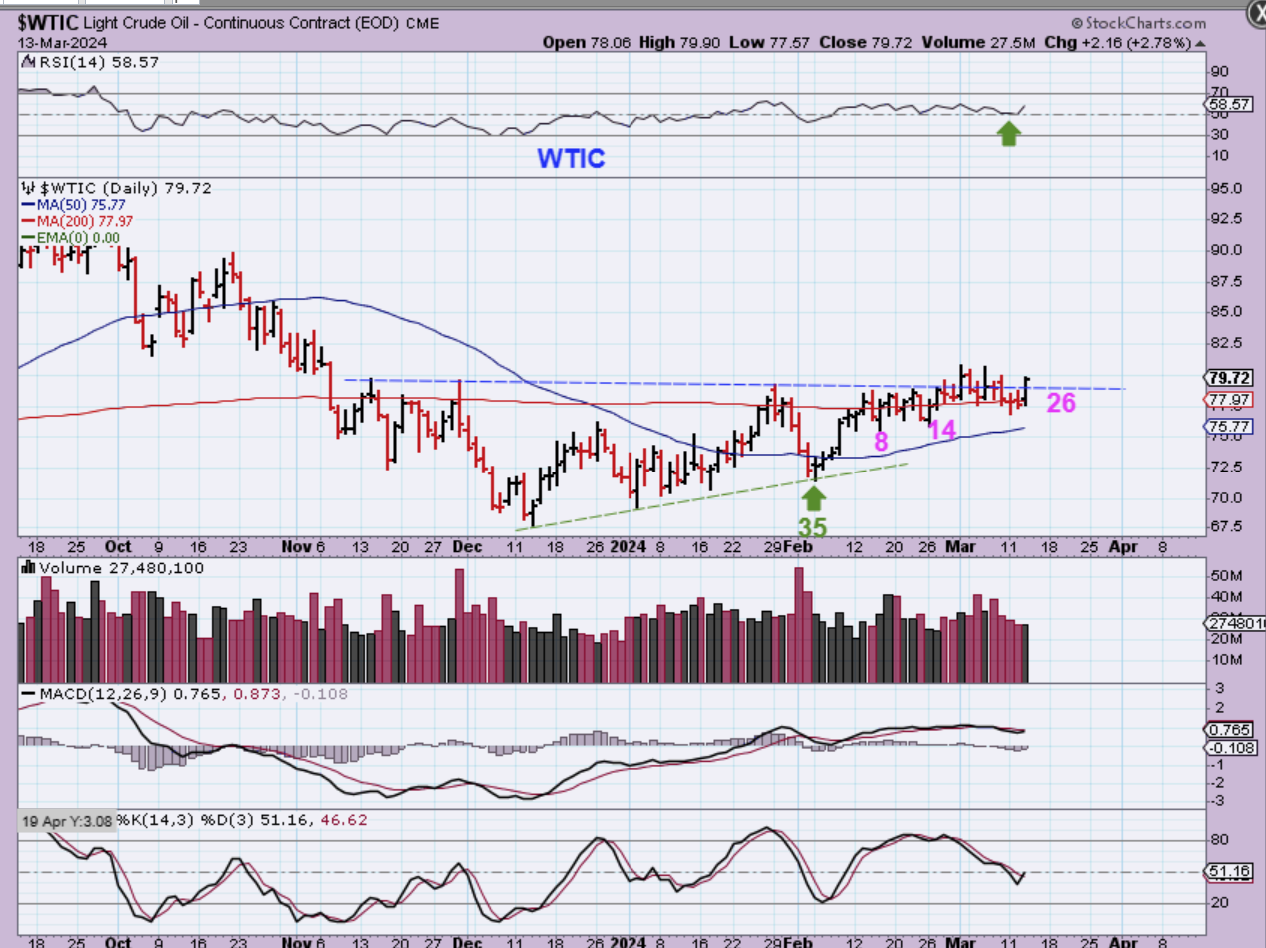
WTIC – Well look at that! Oil Popped almost 3% on day 26, now let’s see if it can finally get some follow through higher.
.
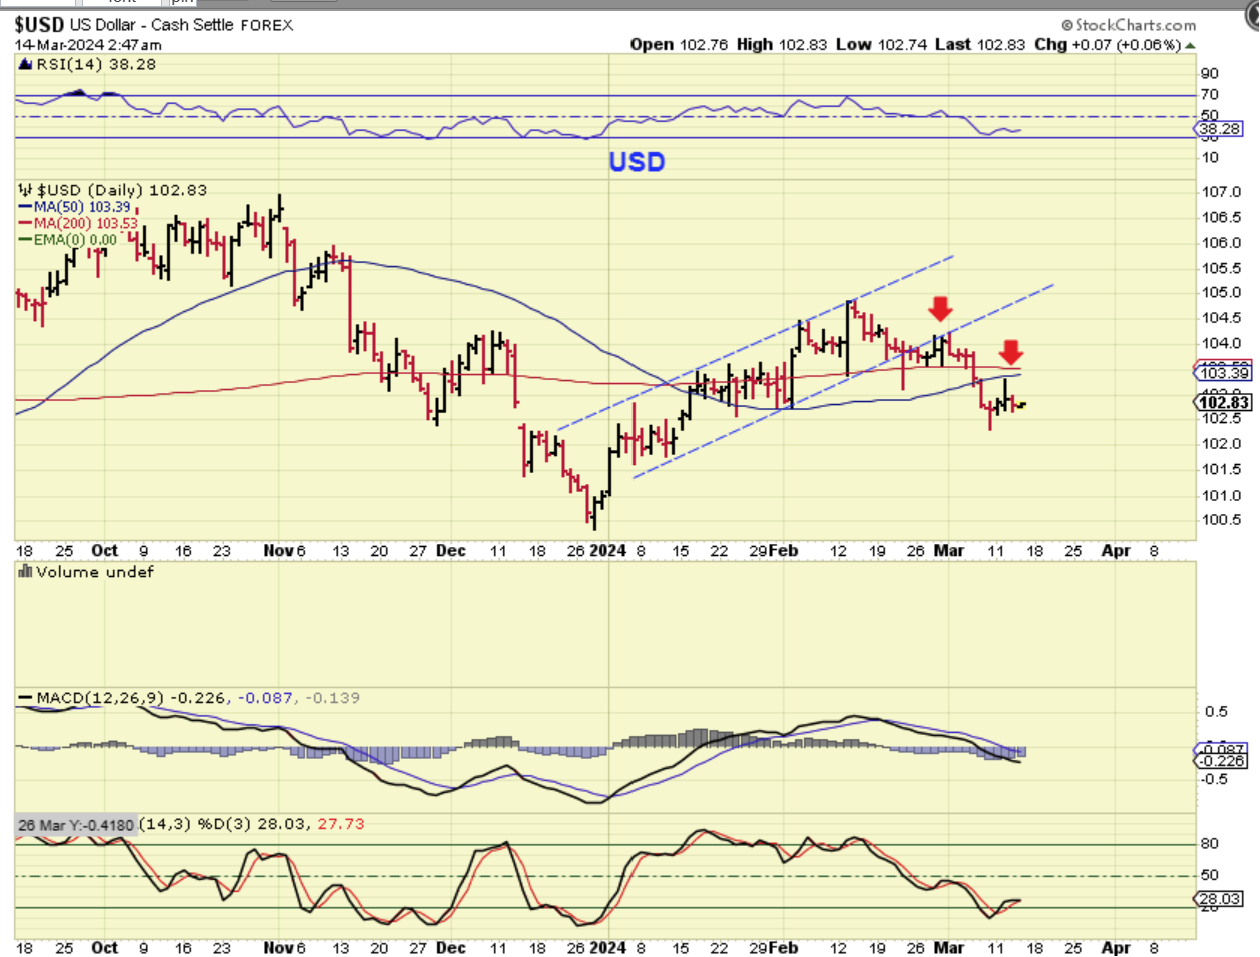
On Tuesday, THE USD tagged the 50sma with the CPI Numbers and then dropped back down. This could be a dcl in place, but the USD has stalled for now.
.
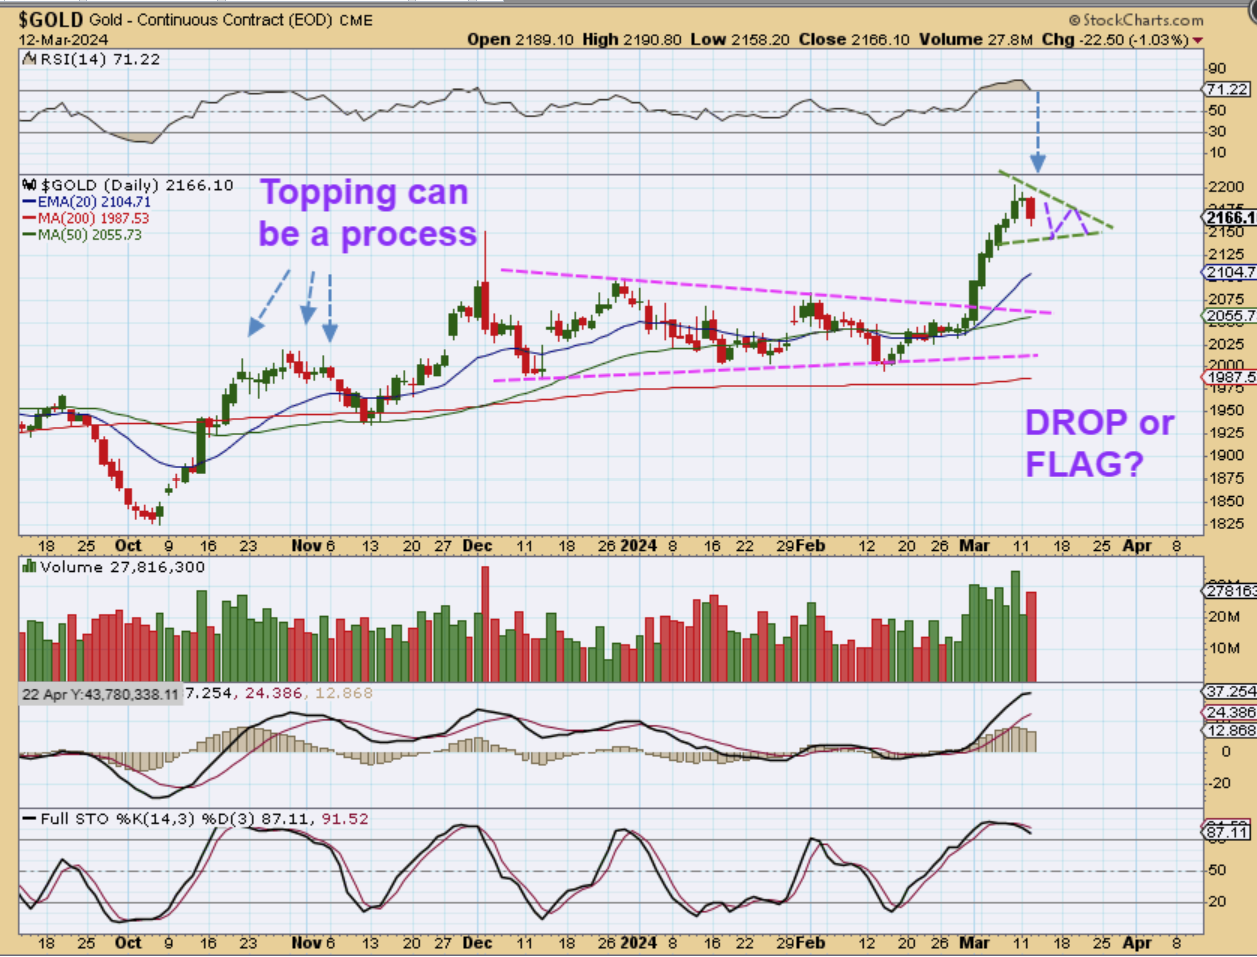
In Yesterday’s report when Gold dropped from the CPI Numbers, I mentioned that… “GOLD could even form a bullish pattern like a pennant as a higher dcl, so we’ll keep an eye on things daily.”
.
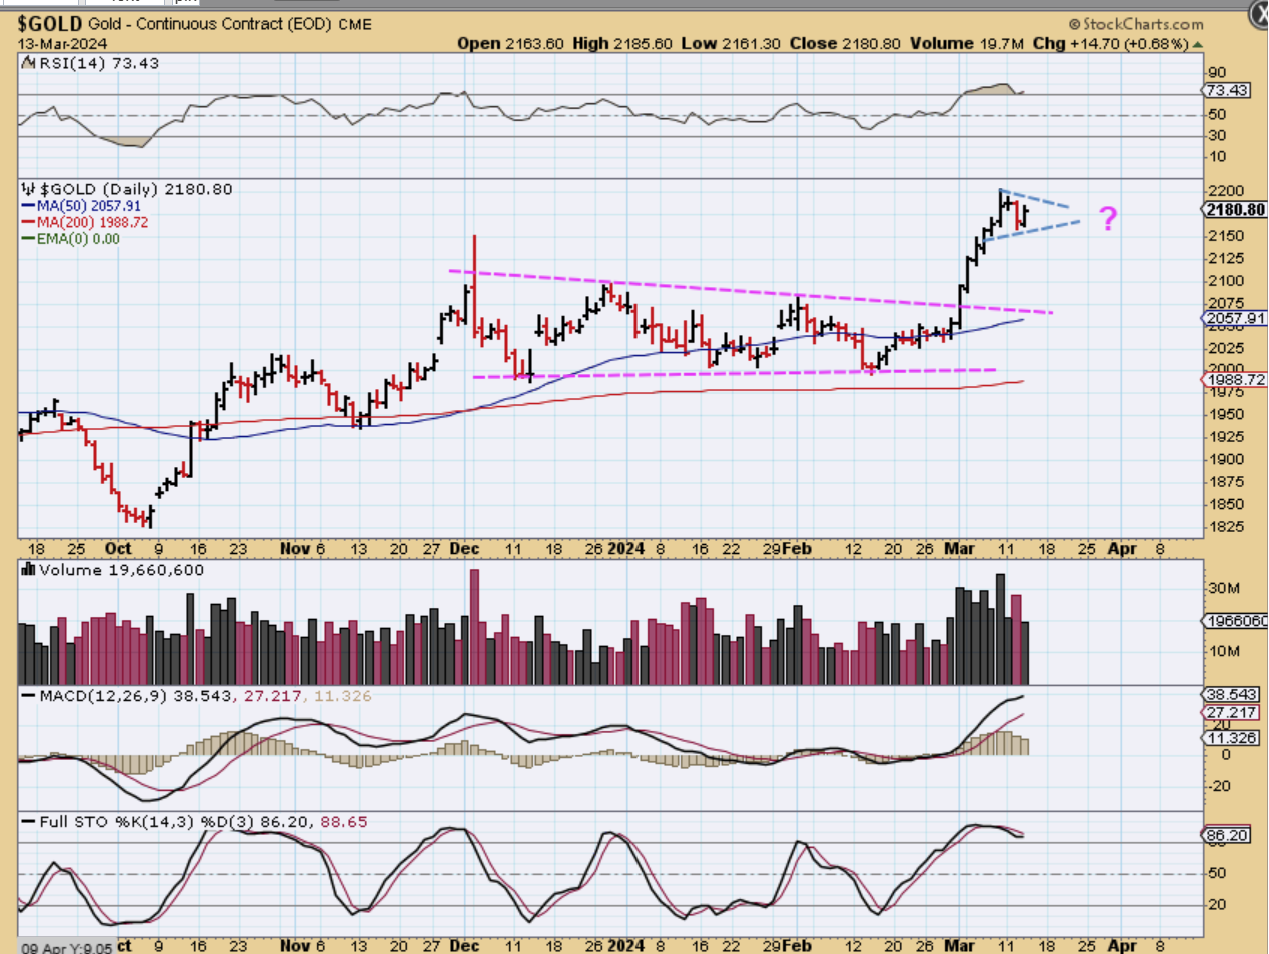
GOLD pushed higher on Wednesday and it still looks like it could form a pennant. That said, I will mention again that on Tuesday Gold dropped with the CPI Numbers. It might do the same with the PPI numbers (?), but it is also a bullish move out of an ICL, so price can also continue higher here at day 19.
.
NOTE: THIS IS ONLY DAY 19, so there is still time for this to run higher. We’ll see what the PPI Numbers do for Gold.
.
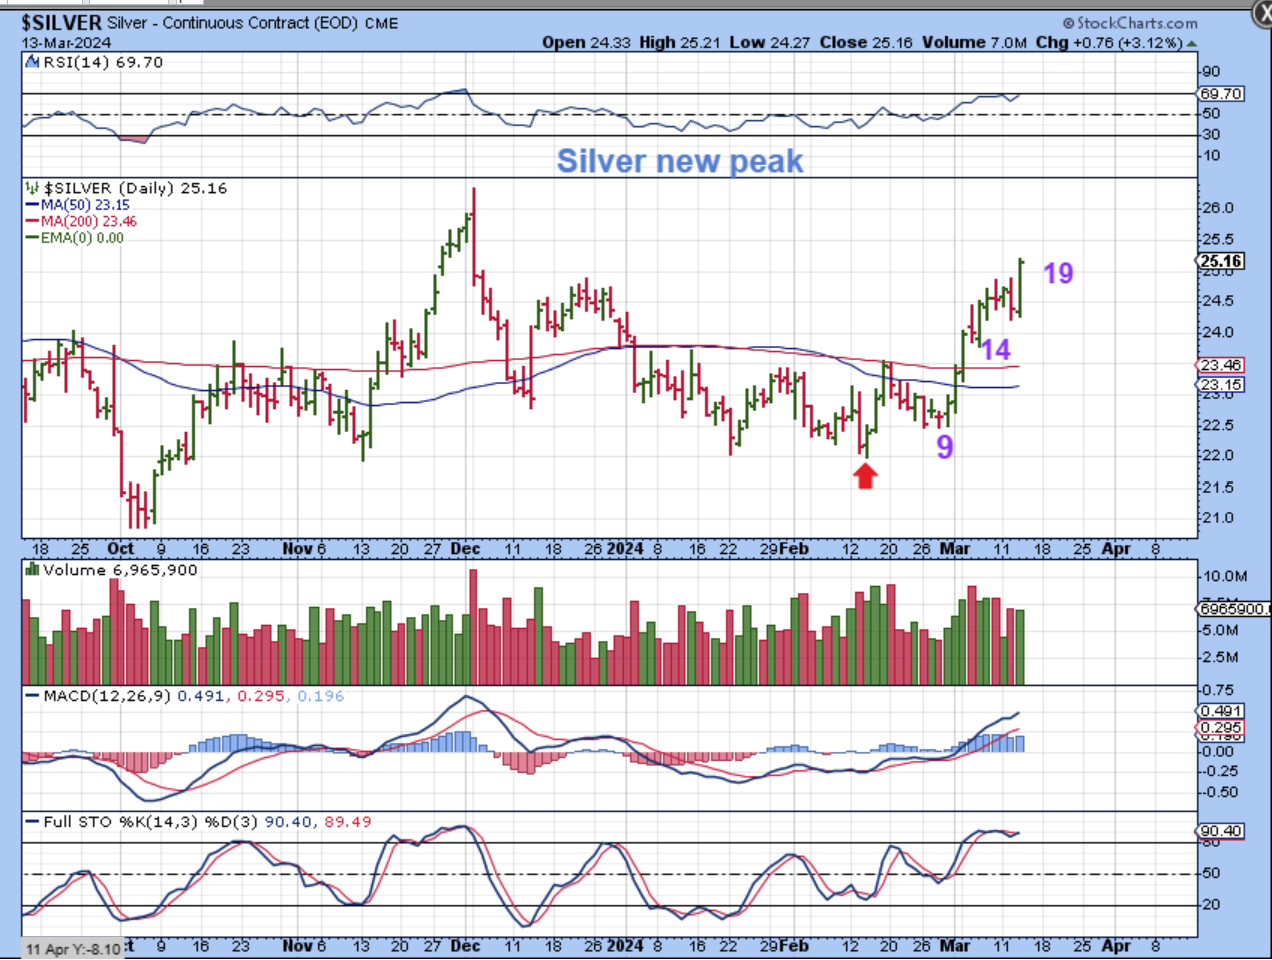
SILVER actually burst higher with a nice 3% move. This gives the daily cycle a new peak and makes it likely a R.T. Daily Cycle. I want to reiterate what I mentioned in a prior report…
,
I mentioned in a prior report that Gold is past that December ‘spike peak’, but Silver was not. Why? Gold did not sell off as much as Silver did, do Silver had a deeper sell off and hasn’t reached that peak yet. It would make sense for Silver to at least get back up to the Dec Peak, with Gold well above its’ peak.
.
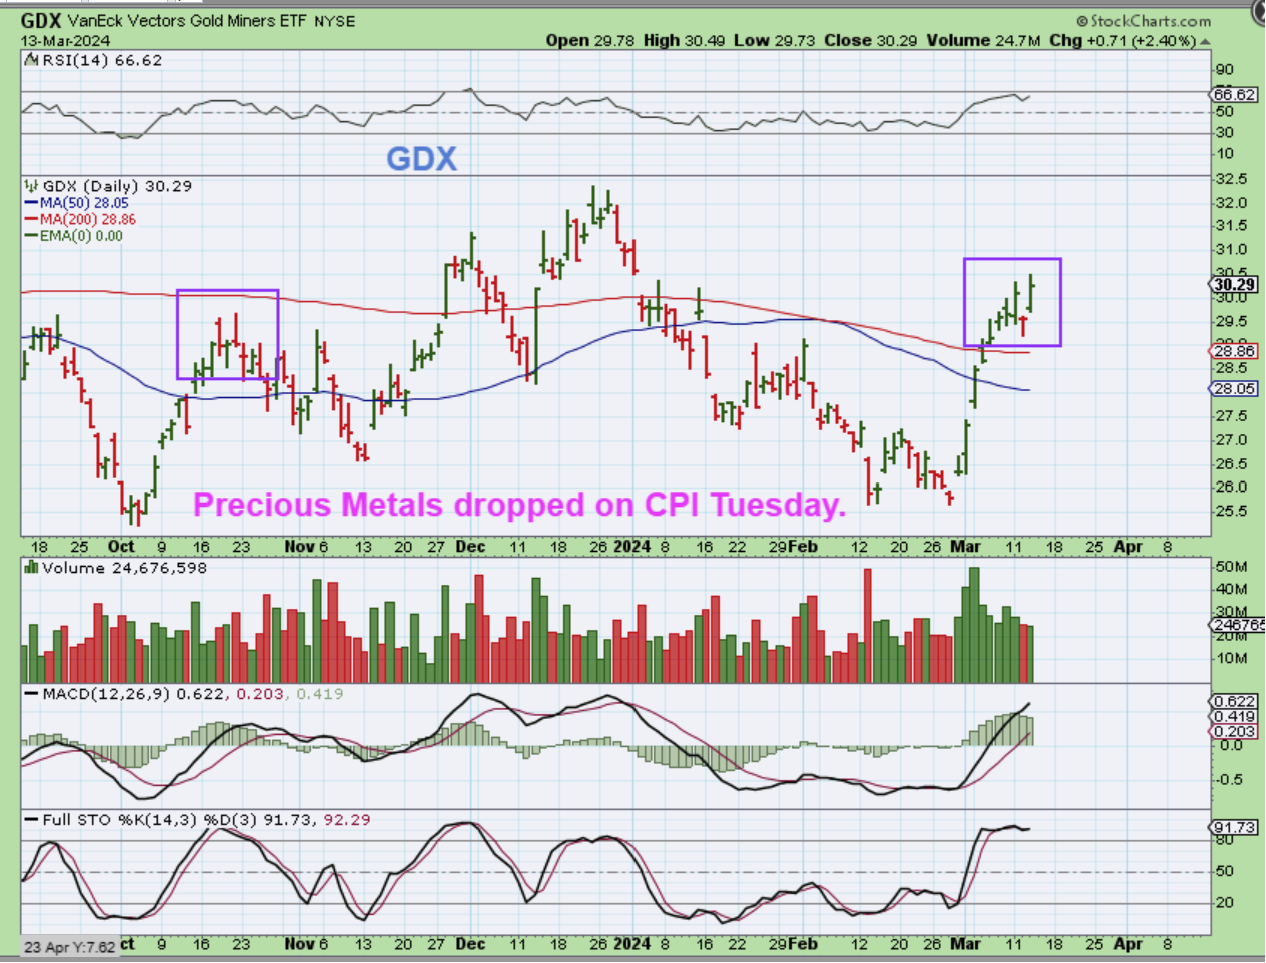
GDX could continue on to the prior highs too, especially of the PPI Numbers give this sector a push. This also could be a topping process, as mentioned yesterday, and as seen with the 2 purple boxes. The CPI Numbers on Tuesday caused GDX to drop. That could repeat.
.
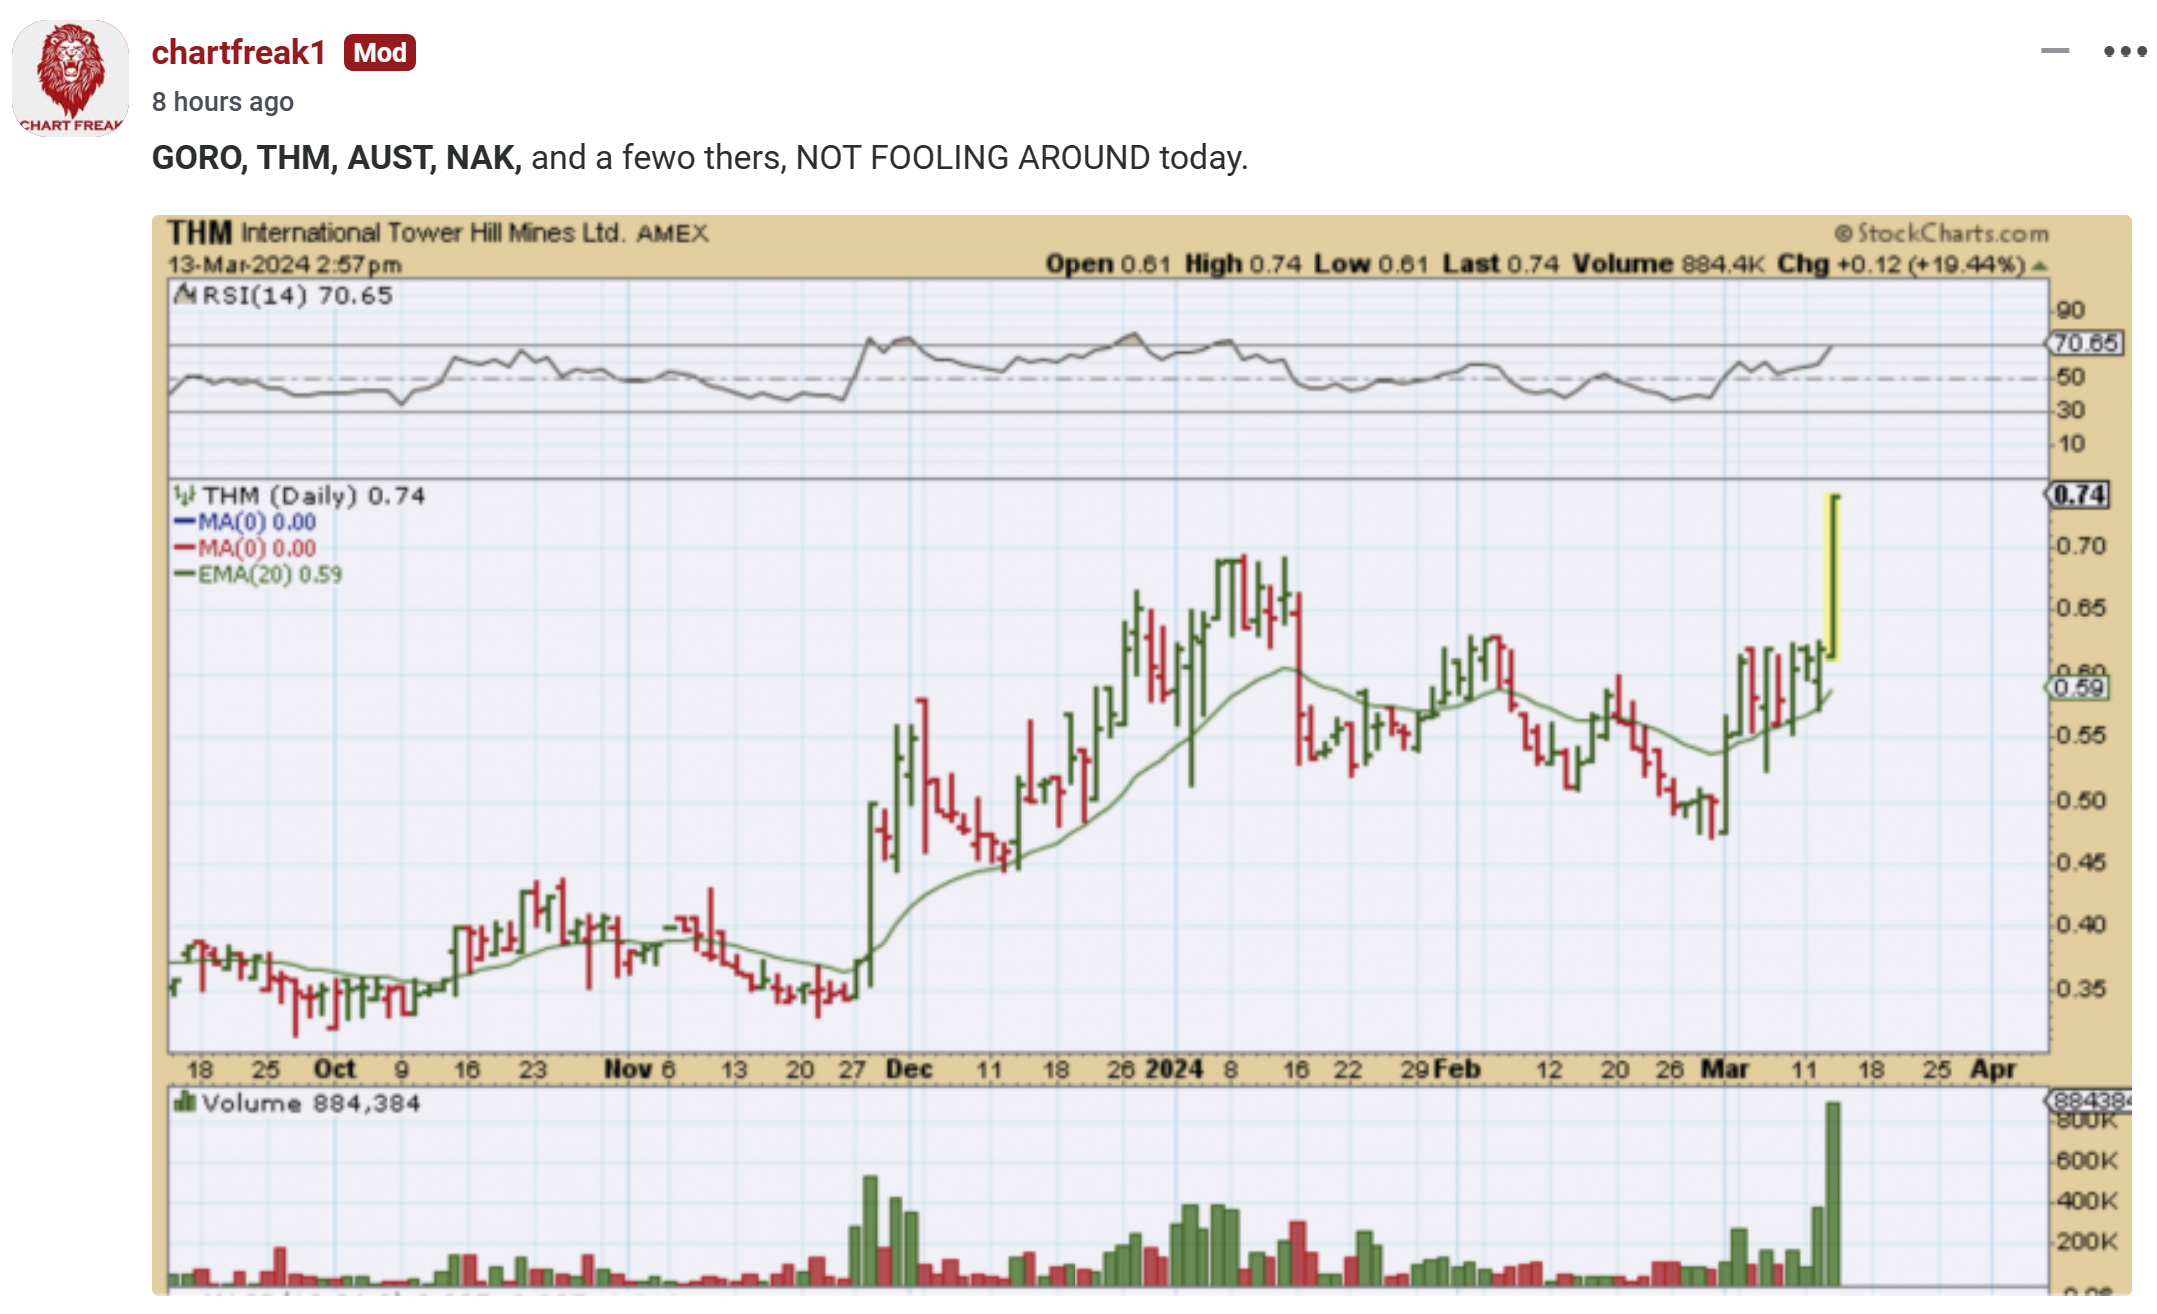
With Wednesdays push higher, many Miners ran up and then quite a few sold off a bit into the final hour. I did notice some big moves too, such as GORO, NAK, THM, etc, so I mentioned that with this post.
.
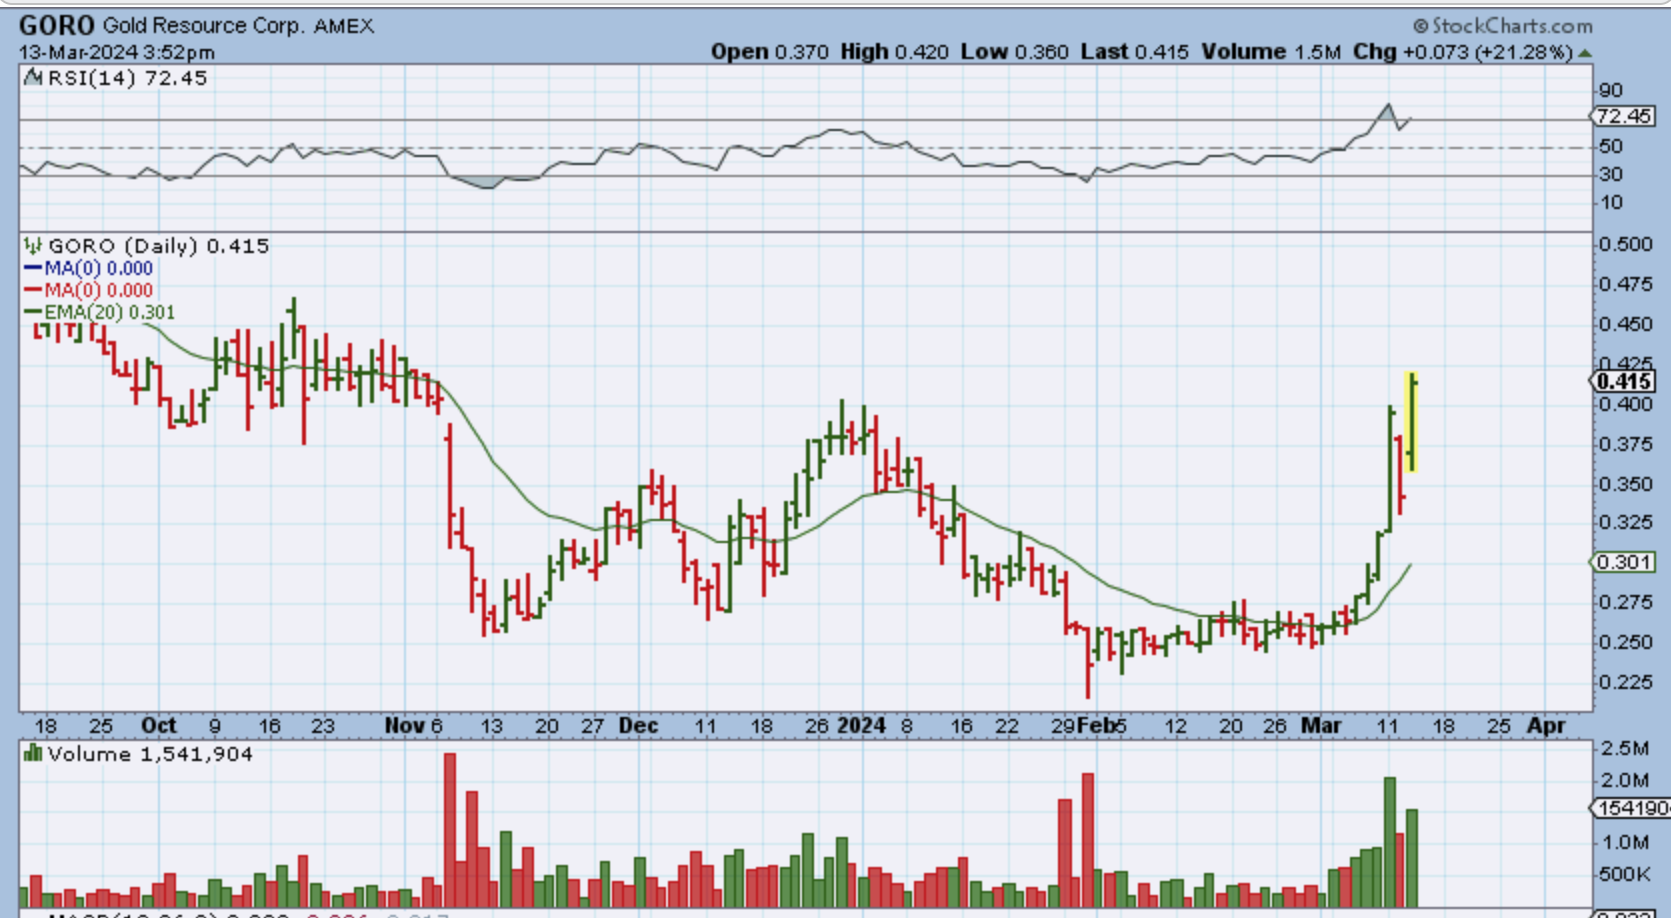
GORO dropped 14% on Tuesday and I wouldn’t blame anyone that sold it thinking that it could drop right back to the lows, but surprises to the upside came in. GORO was up over 21% yesterday.
.
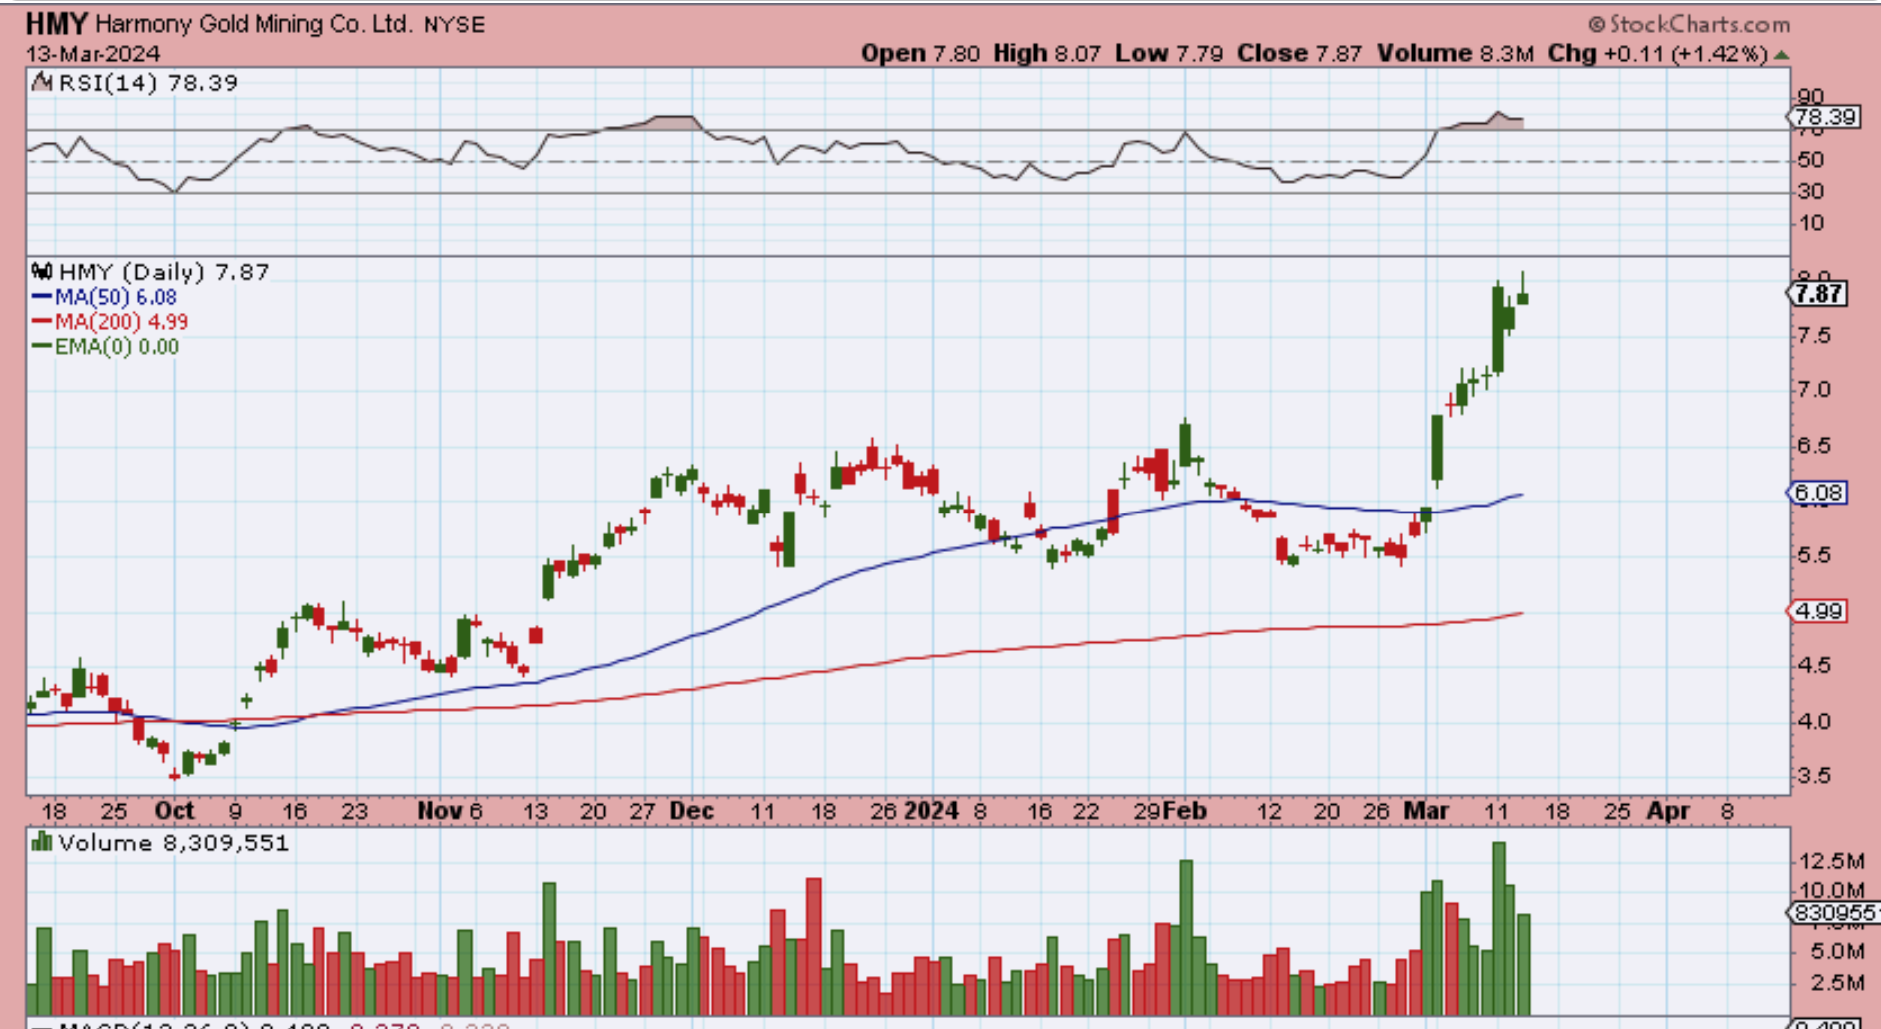
HMY has been very strong, but notice that it popped and dropped yesterday, only up 11 cents by the close. I saw others do this too. We really had a mixed reaction yesterday, and this seems to indicate that a pull back is near.
.
AU had a 3% pop yesterday, but I couldn’t help but to notice that this looks very similar to the top in December.
1. It ran up steadily,
2. Then it did a dip into a reversal candle,
3. And then we saw it pop for 1 day in December but then sold off, so again, we don’t know what we’ll get here on day 20 for Gold. 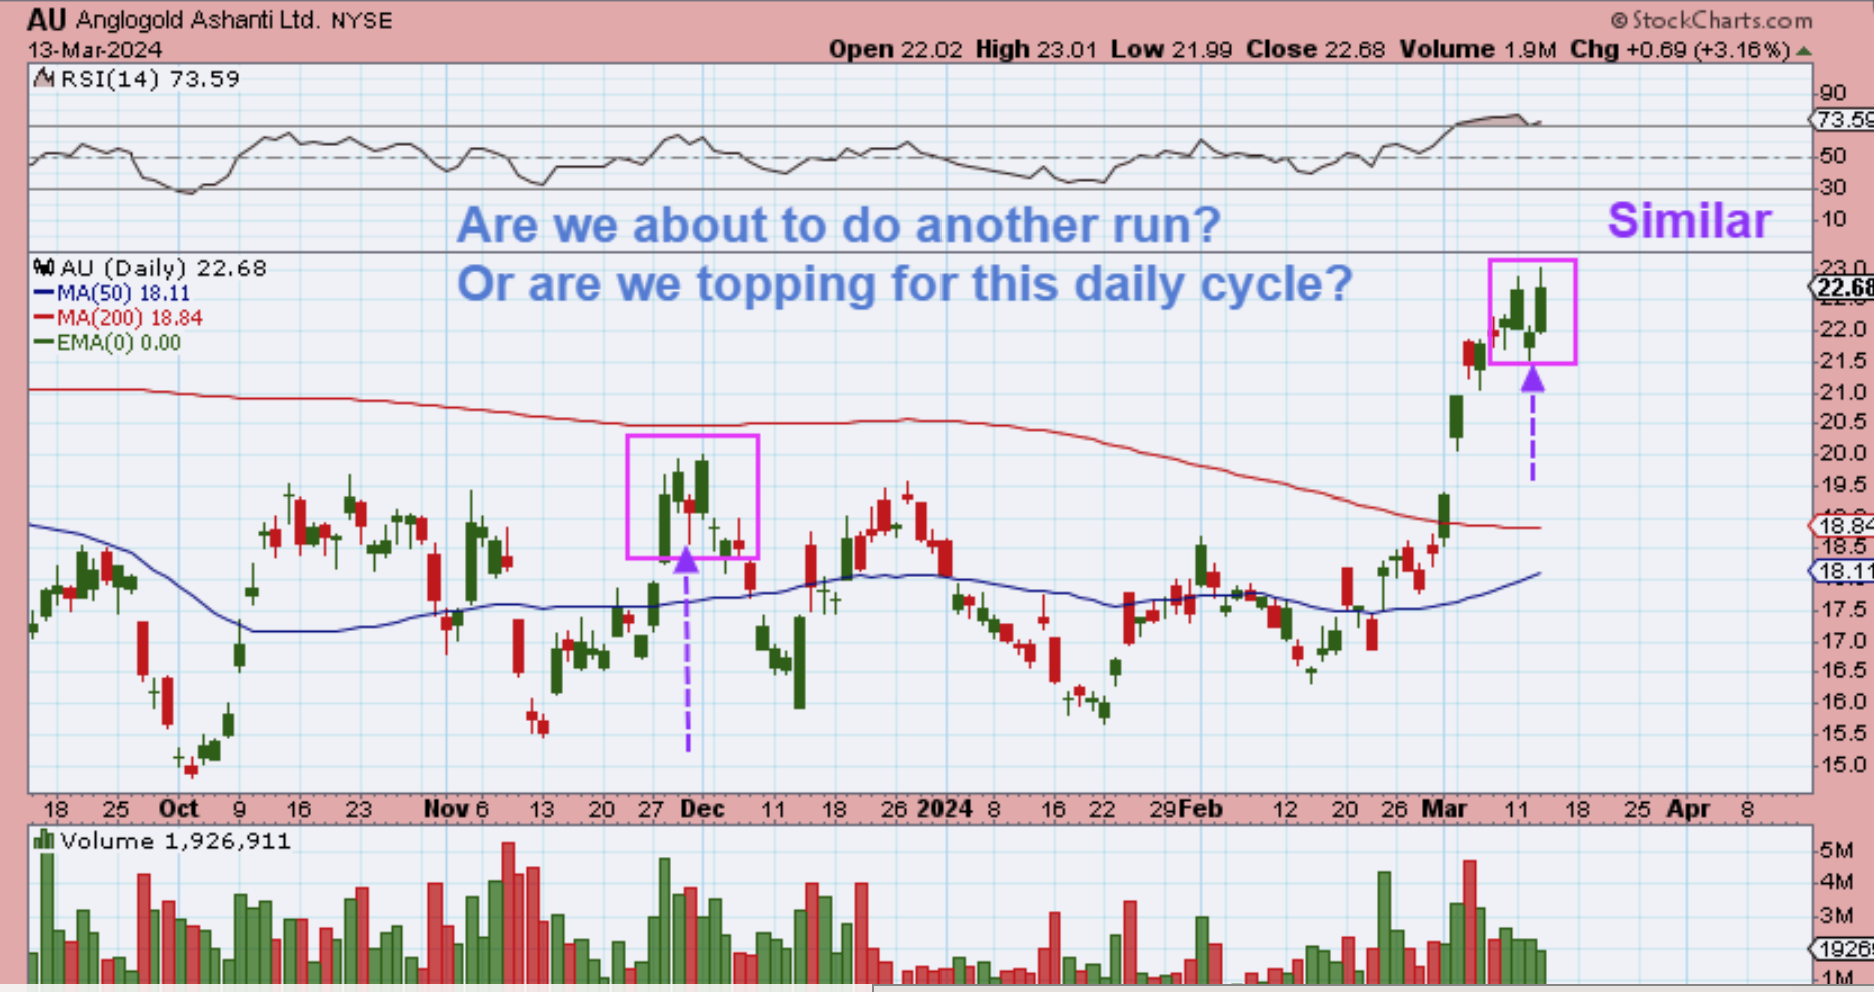
.
The General Markets are due for a dcl dip, but they have been very bullish and the ‘data’ reports just seem to just pull in more buyers.
.
Another question that I have mentioned that will not be answered until after the first daily cycle plays out is:
Will these continue to be short (25 day) Daily cycles for Gold, like the last intermediate cycle had? Or will we see the longer daily cycles (closer to 33+ days), like we used to have in the past? I have been thinking about that and this is what I am thinking…
I feel that the shorter ones were the result of the more bullish set up and buyers stepping in earlier, not allowing it to sell off for 33 days. I would have to say that this really should continue now that Gold has broken out, right? It is much like what we are seeing with the General Markets dips. They do not allow it to pull back very deeply (20 ema) before buying pressure continues to push these markets higher. I feel that we see Bitcoin now doing that too. We saw Minimal dips at day 30 for Bitcoin. These milder dips MIGHT be the new norm for Precious Metals going forward too, meaning we may continue to see daily cycles that only last 25-28 days.
.
So with all of these thoughts, Let’s see what Thursdays Data brings to our futures at 8:30 a.m. ET, and then on to the markets! Enjoy your Thursday trading!
.
~ALEX
.
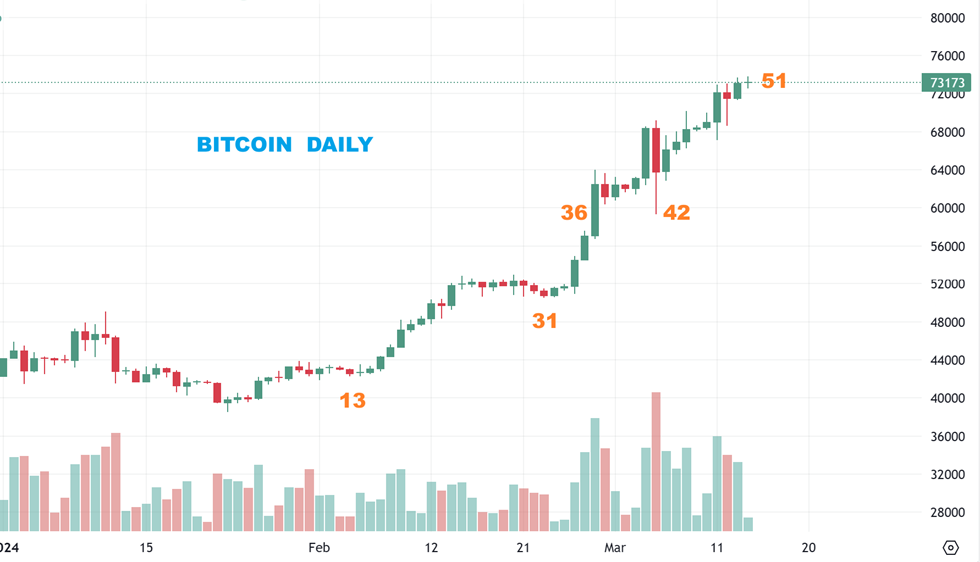
BITCOIN:
This is a live shot of Bitcoin at 6 a.m. ET. and it is a strong bull run on day 51 of roughly 60!
Yesterday I mentioned that I would love to see one of those Bitcoin slam downs that leads to an ICL. At the same time that it is dropping, I’d like to see Crypto related stocks start to resist the selling and put in a choppy bottom while Bitcoin is still selling off lower. We have seen that with Gold and Gold Miners in the past, and THAT would possibly indicate that they both are consolidating gains, and that because crypto stocks started the sell off first, maybe they would be stabilizing while Bitcoin drops. I want to show you something…
I want to show you something:
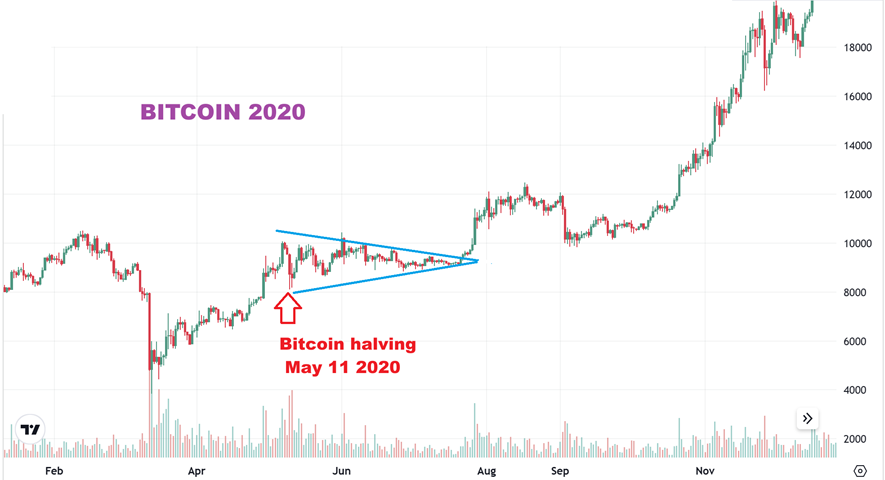
This arrow is Bitcoin at May 11, 2020. THAT is the date of the last halving. I just want to post this chart, because I have had people tell me that Bitcoin crashed with the halving, I have had others say that it immediately rallied after the halving. So why not look at a chart and see what really happened?
.
The crash (or ICL) was actually well before that halving date, and it was a normal ICL drop back then. Bitcoin then rallied and eventually sold off a little into that day May 11 halving, but guess what? That was day 58 of the daily cycle anyway. Then Bitcoin went sideways for 3 months and rallied into the end of the year. The next halving is scheduled in March or April of this year, from what I could see.