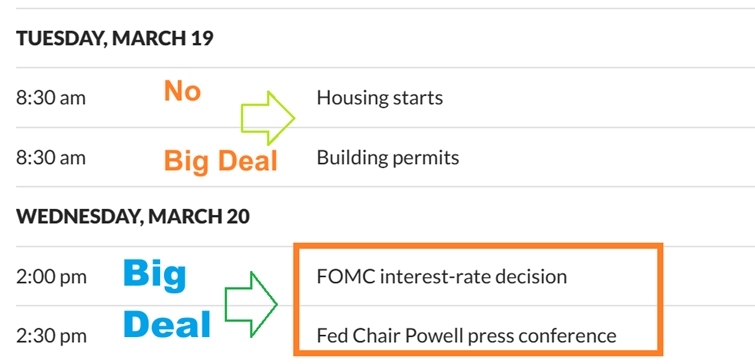
Tuesday March 19th – Fed Ahead
DATA – I really don’t believe that the data for Tuesday is a market mover, but no surprise to anyone here, Wednesdays Fed Decision and especially his press conference speech that follows could do a lot of shaking and market moving. I will discuss that more on Wednesdays report, but for now let’s take a look at the charts…
.
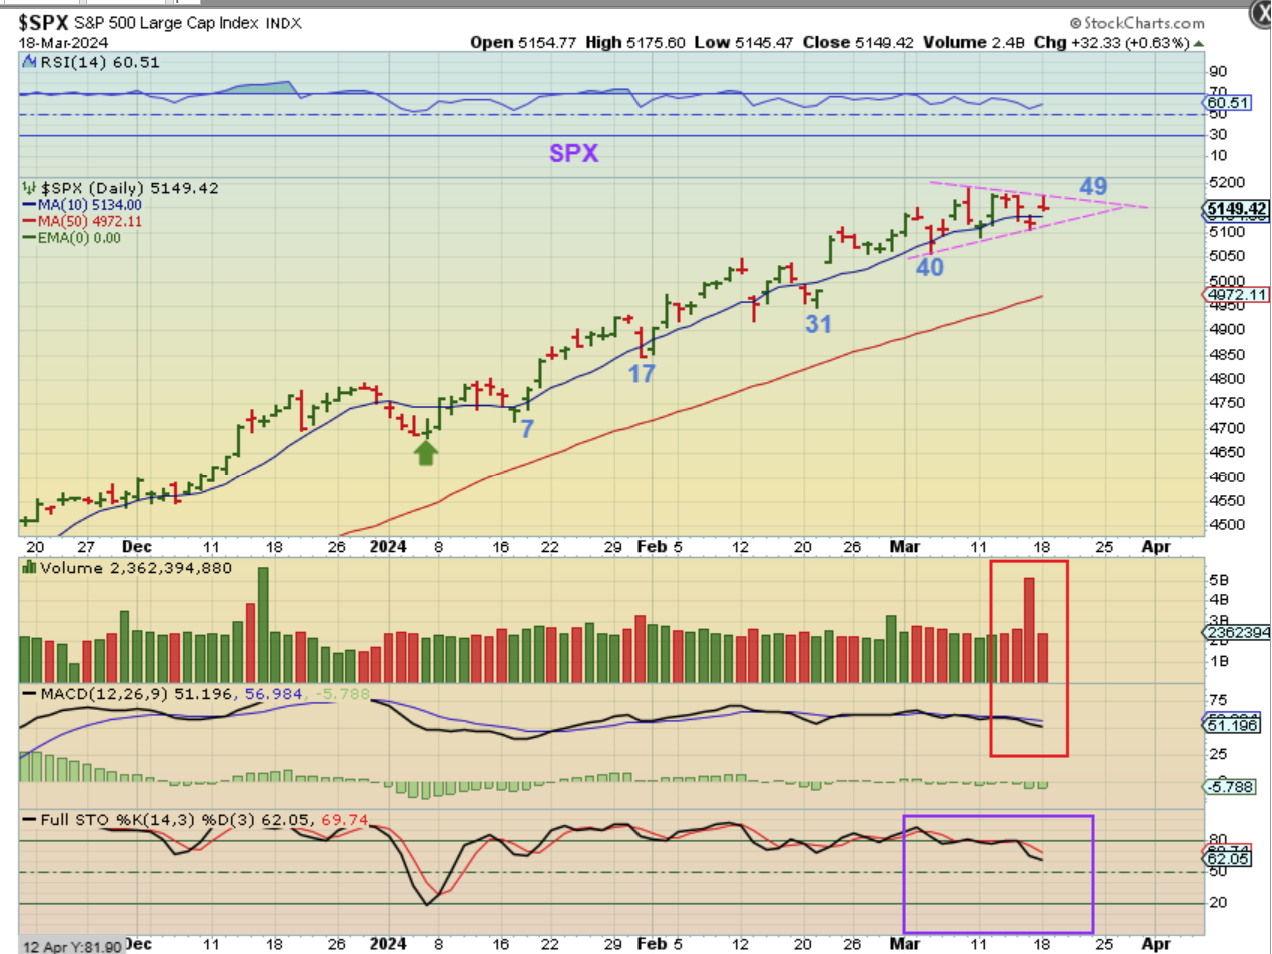
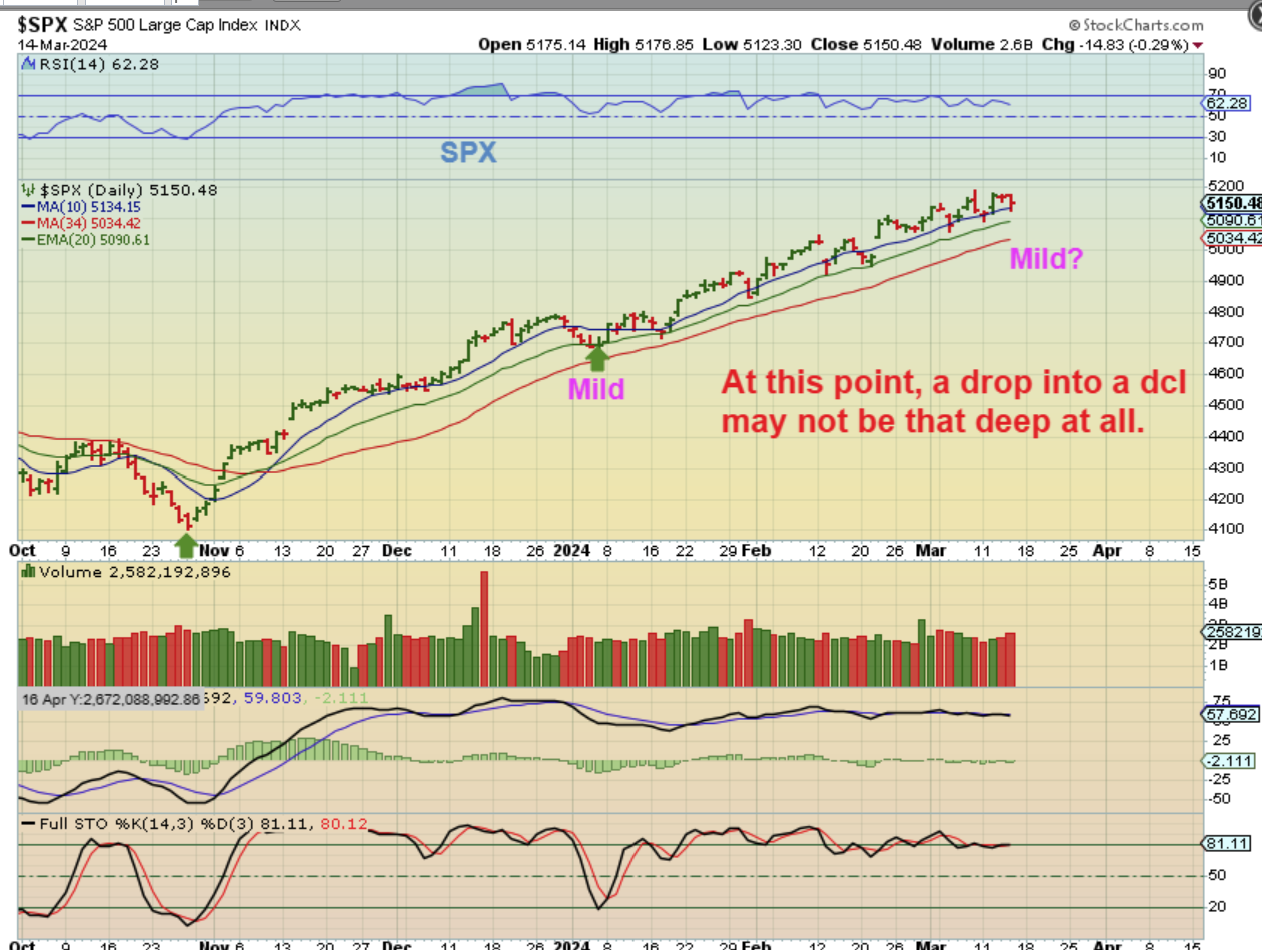
So on Monday we saw The SPX do a pop and drop. I am expecting a dip into a dcl and we are getting late in the daily cycle. Looking at the volume, the MACD, and the Stochastics, we do see signs of the decay with this topping process.
So…
.
1. Will the Markets now sell off on Tuesday and Wednesday, and then reverse on Thursday post-Fed? Or…
2. Will the Fed mention rate cuts as less likely with recent inflation numbers showing gains, and drop the markets for a few days?
We cannot know, so we need to Stay Frosty and look for the signs of dcl. ( I see a triangle, and stealth dcls form there too).
,
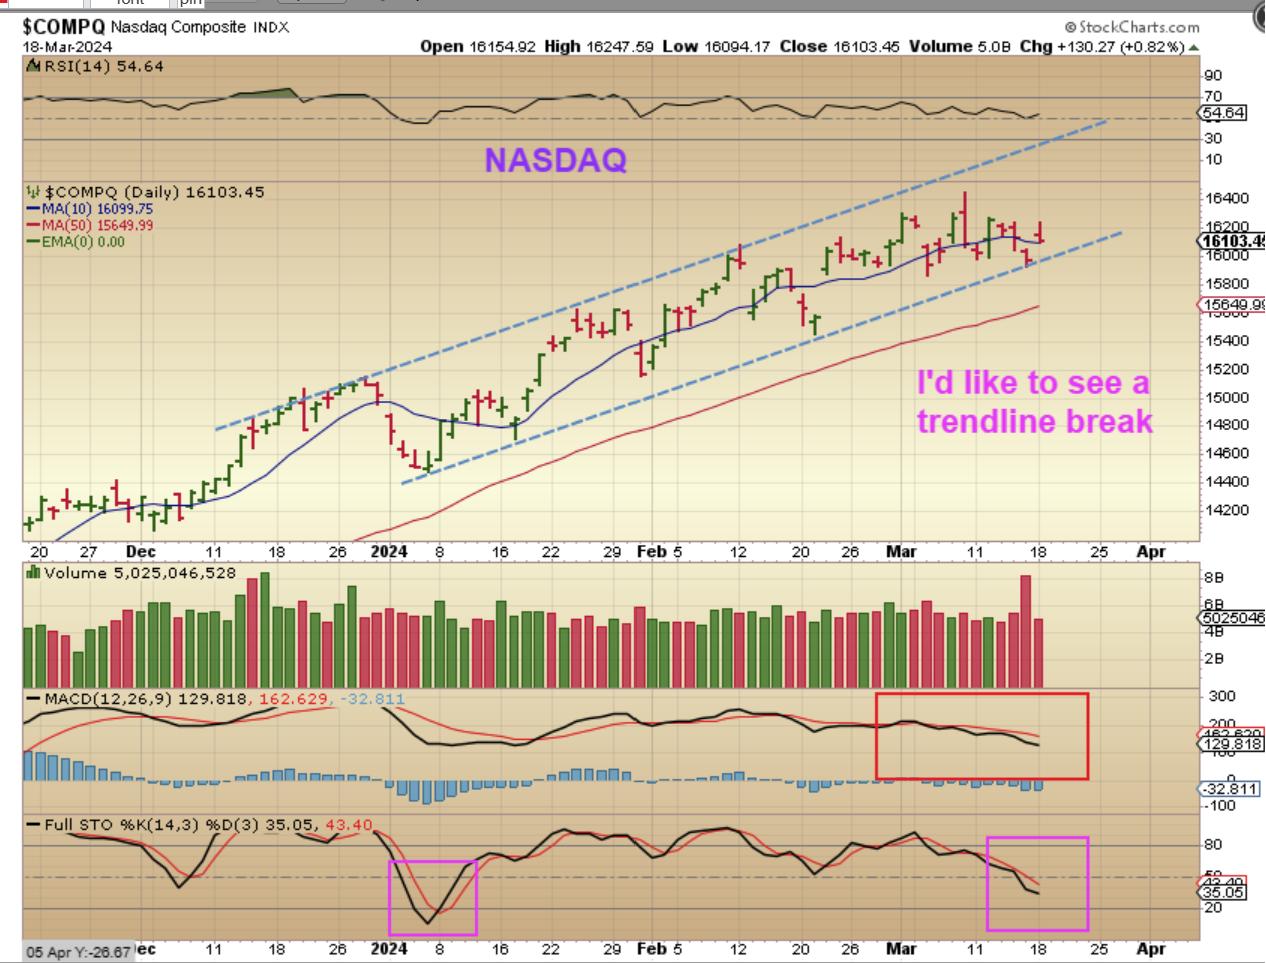
THE NASDAQ looks slightly different from the SPX. I do not see an obvious triangle, and we aren’t right at the highs. THIS looks more like we could drop to the 50sma, hopefully stabilize, and then move higher. READ THE CHART.
.
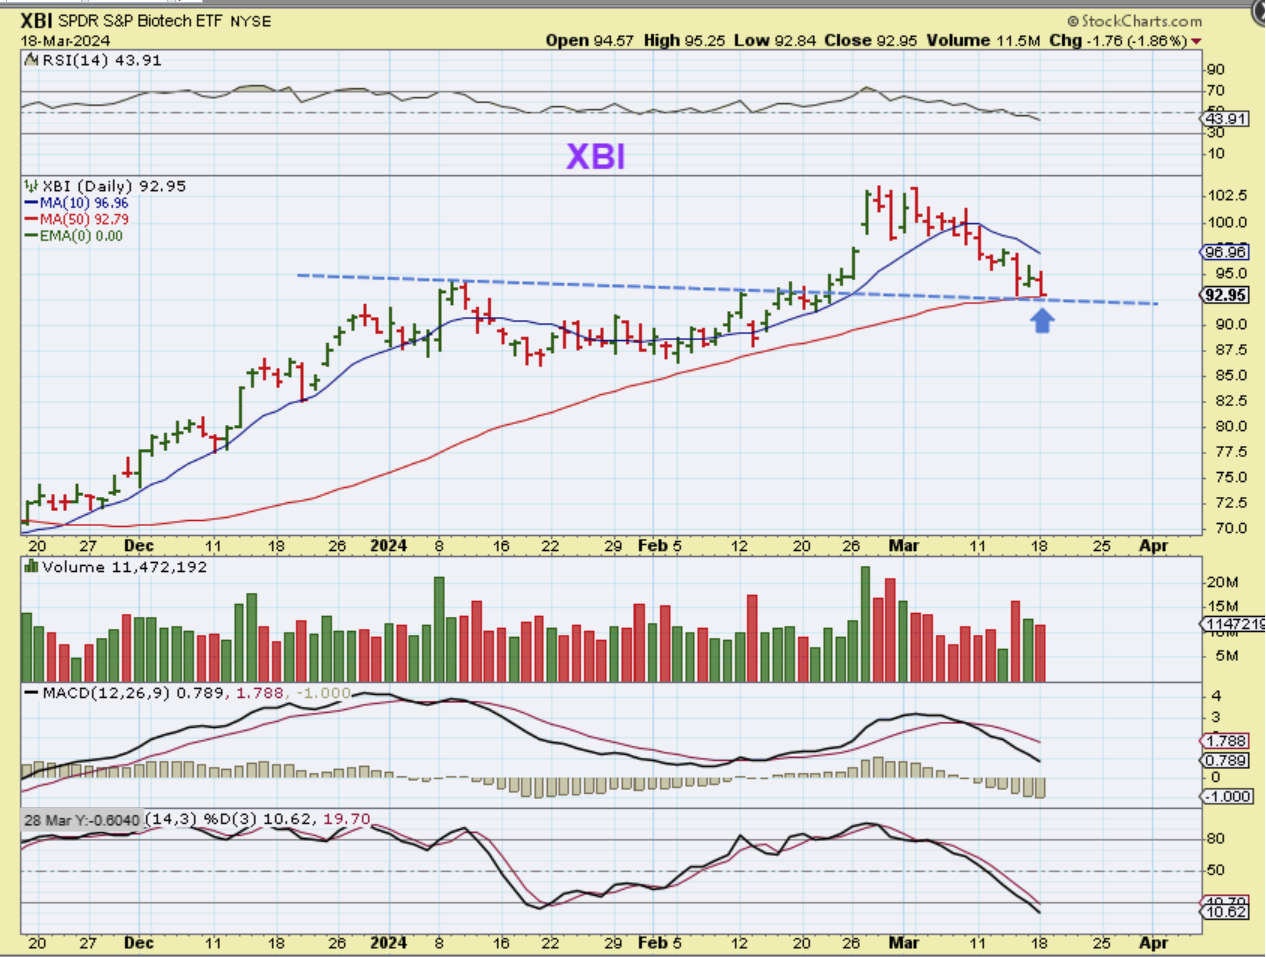
I was a bit surprised to see this deep of a dip for the XBI, but a tag of the 50sma is normal. I didn’t expect it because we had that high volume gap higher in February, and I still see MANY individual biotech stocks rallying and looking good. The XBI may do a shake out at the 50sma, or it may bottom here. Let’s keep an eye on it for a possible buy with LABU or bigger biotech stocks.
.
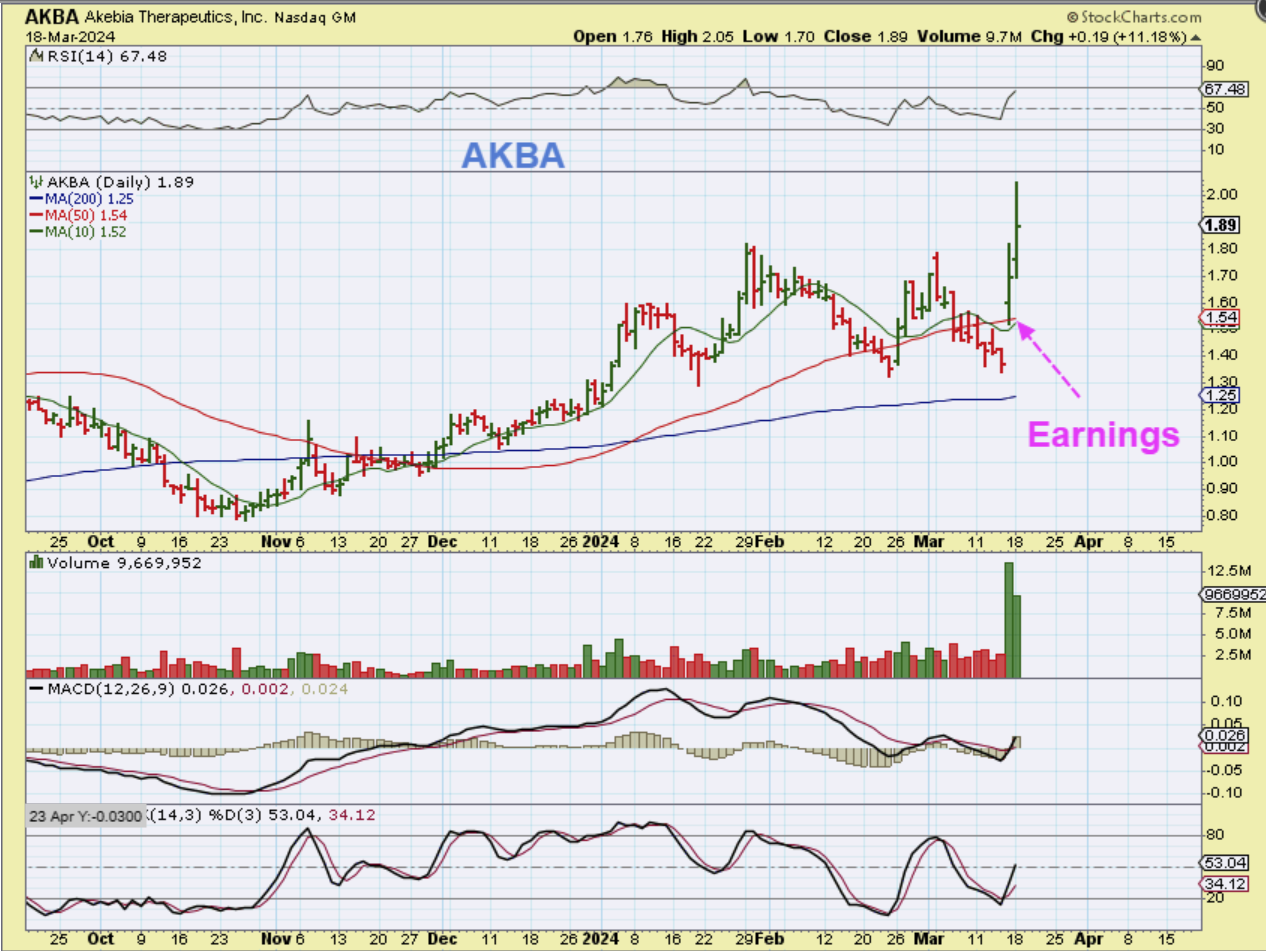
Take a look at AKBA, AEON, VXRT, BDTX, ENLV, etc , and you’ll see bullish Biotech/health/pharma charts that haven’t really pulled back very much. I have been trading AEON and AKBA, despite the XBI pullback.
.
REMINDER: ON FRIDAY I STATED THAT I AM EXPECTING A MILDER DIP INTO THE DAILY CYCLES LOW.
.
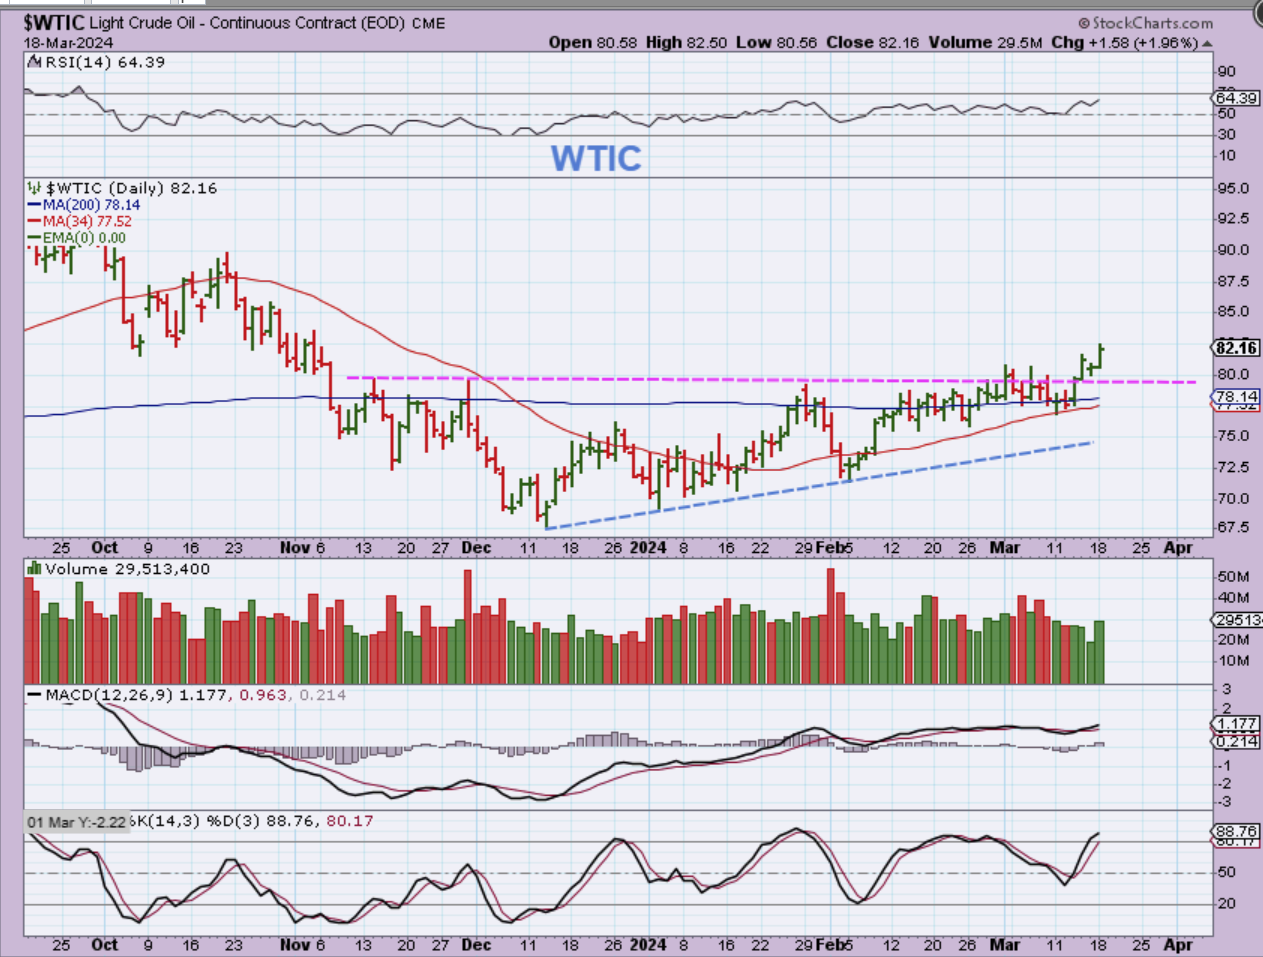
WTIC – We are finally getting the follow through with Oil, after a breakout above the 200sma and a resistance line that I have been highlighting.
;
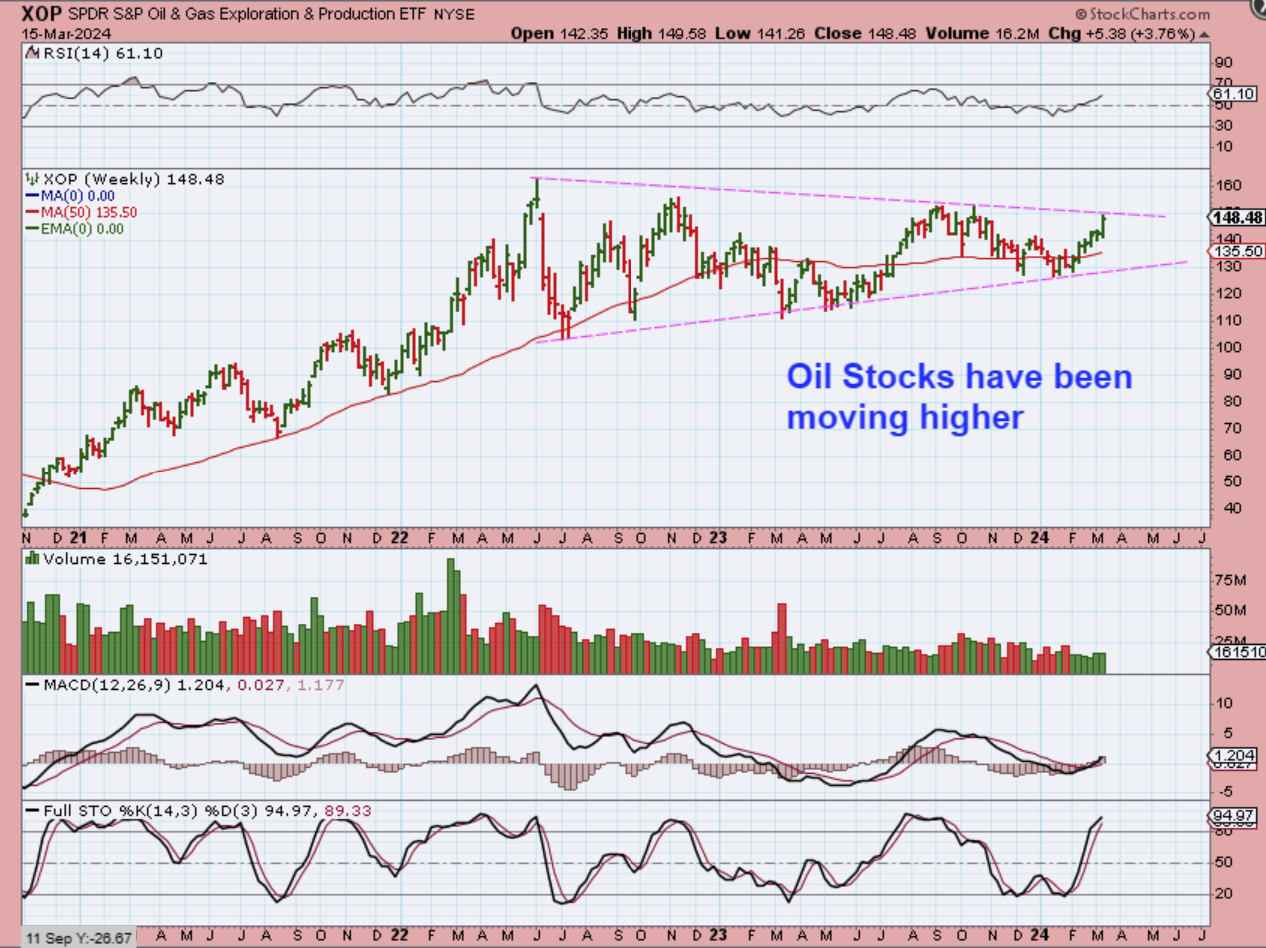
FROM THE WEEKEND REPORT: THE XOP WAS AT $148. Note: Oil was up but the XOP was at $147 on Monday. No breakout.
.
XOP WEEKLY – The XOP went from that January low of $128 to the top of the pattern at $148. This will either stall or break out. A breakout would be a continuation of that long run up into the triangle. A rejection could cause a drop to the lows and a continuation of this consolidation. We DO still have room at the apex for further consolidation.
.
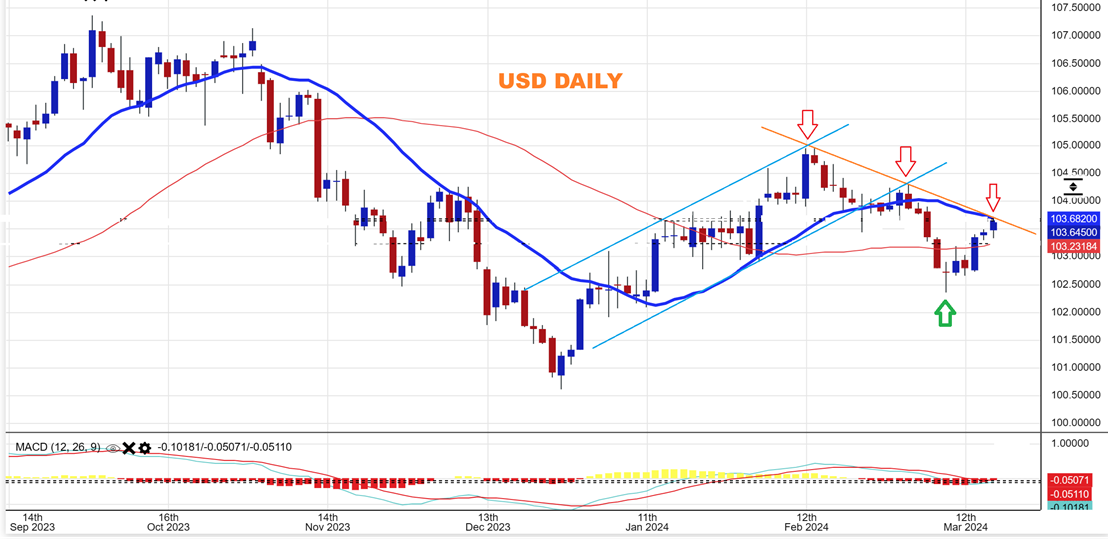
THE USD did have a nice pop on Thursday and continued higher on Monday. It is now at a resistance area of the 50sma and a downtrend line. This looks strong on day 5, but the Fed decision or speech could cause a sell down or even a false break out and then a sell down.
.
I just want to mention that GOLD and The Miners are holding up quite well, and if we are going to have a bullish reaction to the FOMC MTG & a short daily cycle (day 25 or so), we may not see a big dip. If we have those 33 day daily cycles, then we could see this sector sell down after the Fed. Right now, things look strong. Let’s take a look…
.
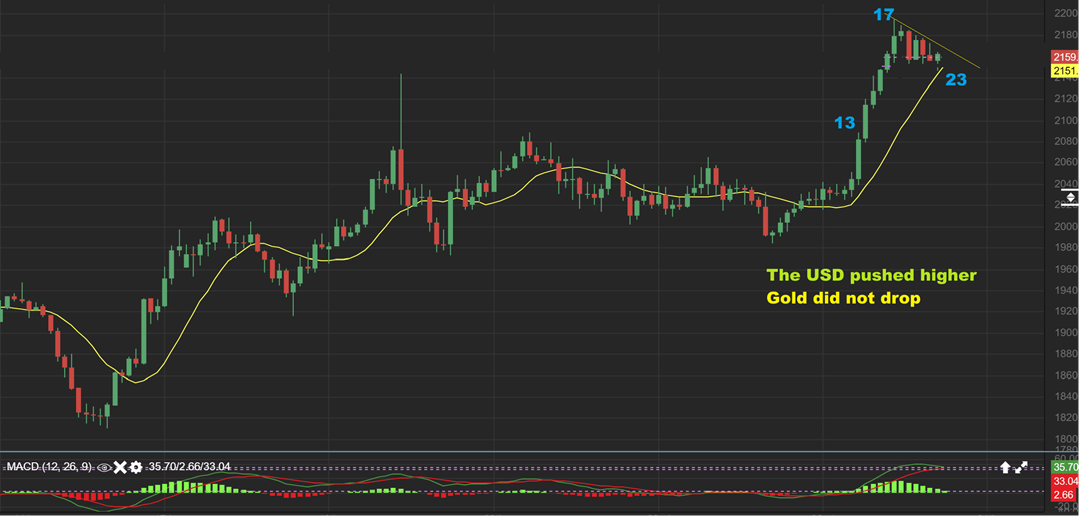
GOLD did not sell off with the USD pop on Monday, and that is encouraging. This was day 23, so Fed Wednesday would be day 25 and Thursday will be day 26. We COULD get a decline into a dcl in this area if the shorter daily cycles are going to be the norm now. This could be a bull pennant. STAY FROSTY! 🙂
.
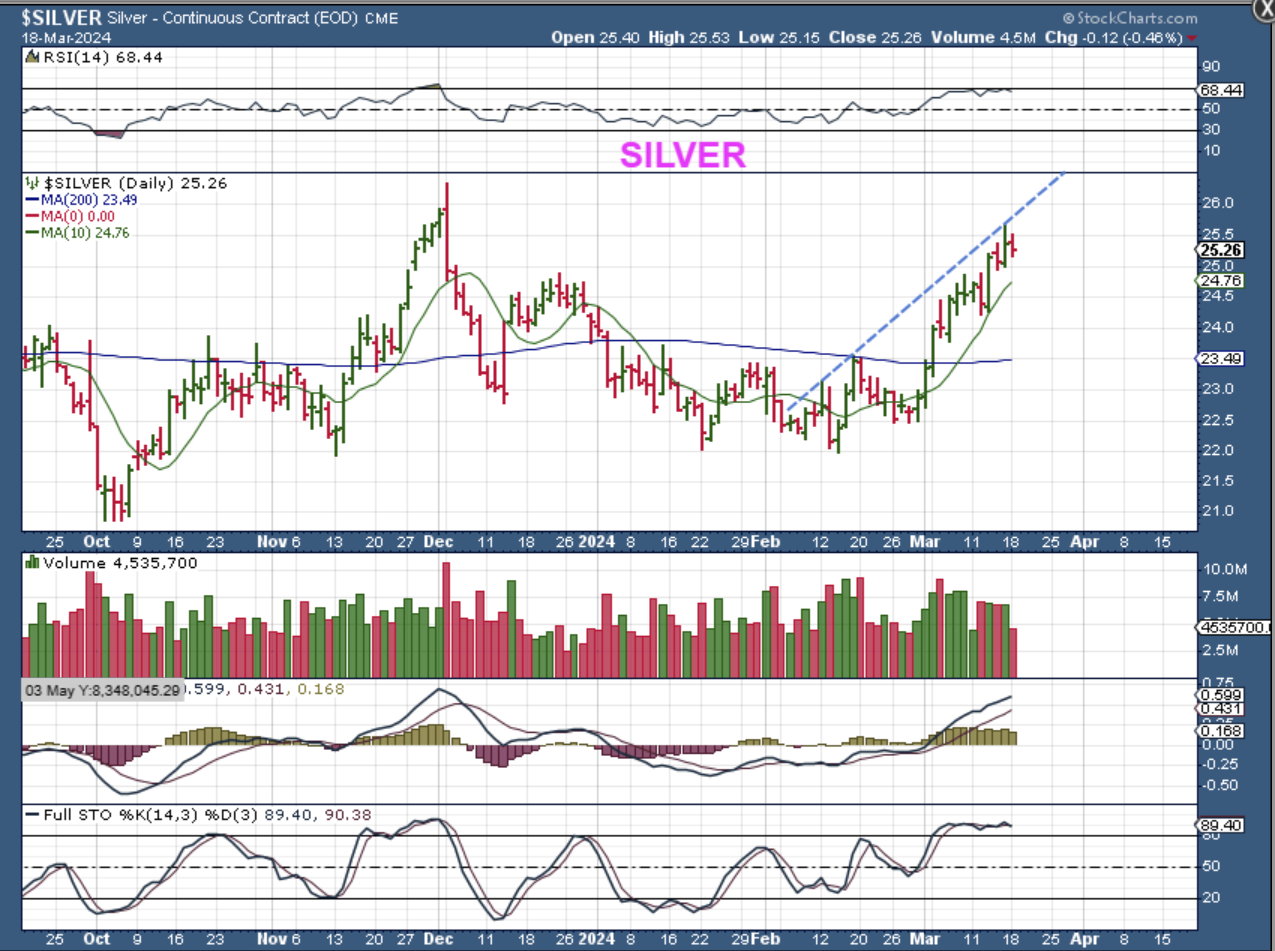
SILVER has chopped higher.
.
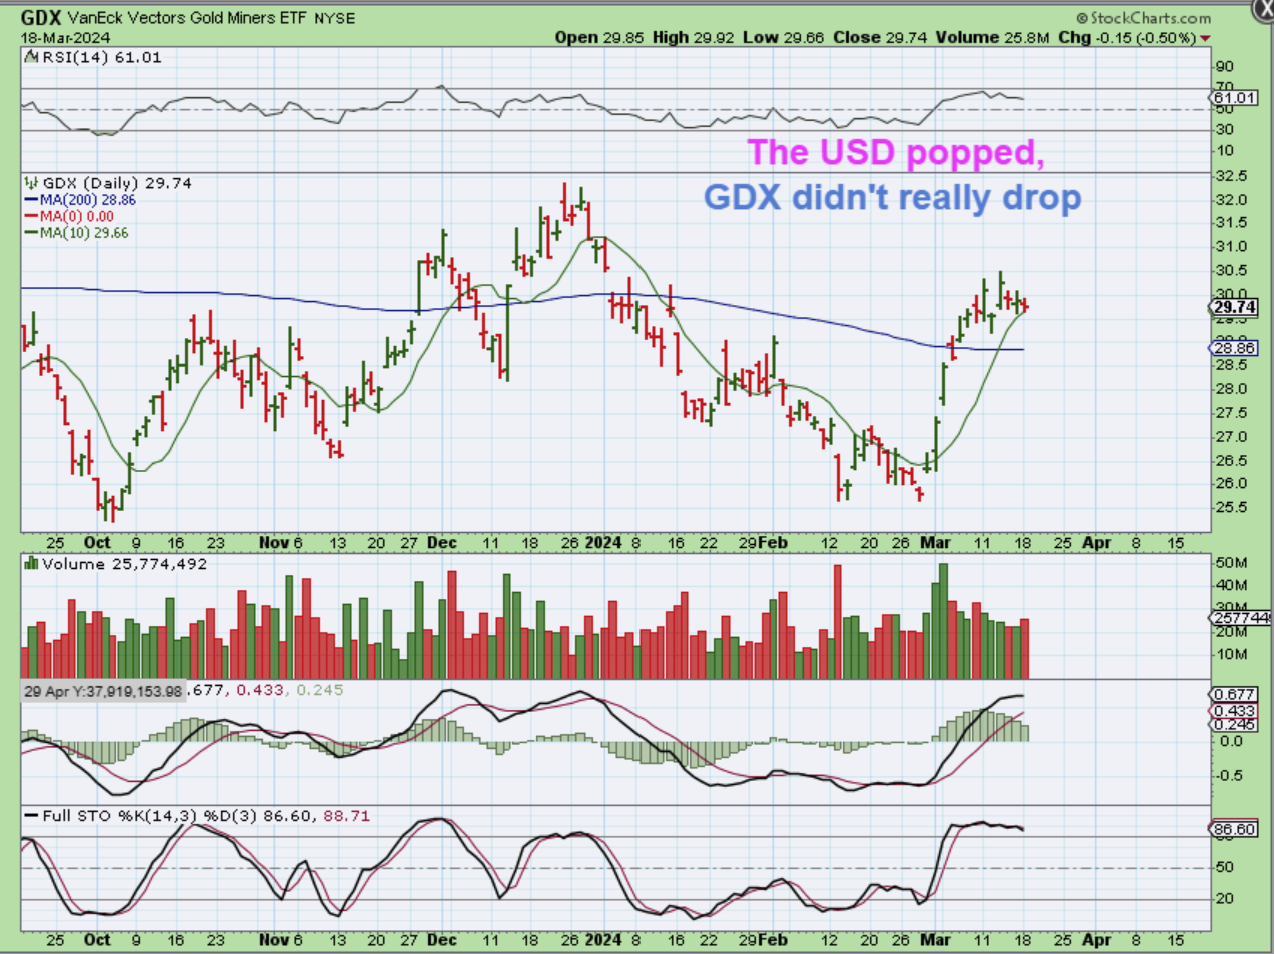
THE GDX ETF also didn’t really drop as the USD moved higher. That is interesting and raises the question: Will the Fed Speech push the GDX ETF down to the 50sma or give us a quick shake out? Part of the reason that GDX didn’t drop?…
.
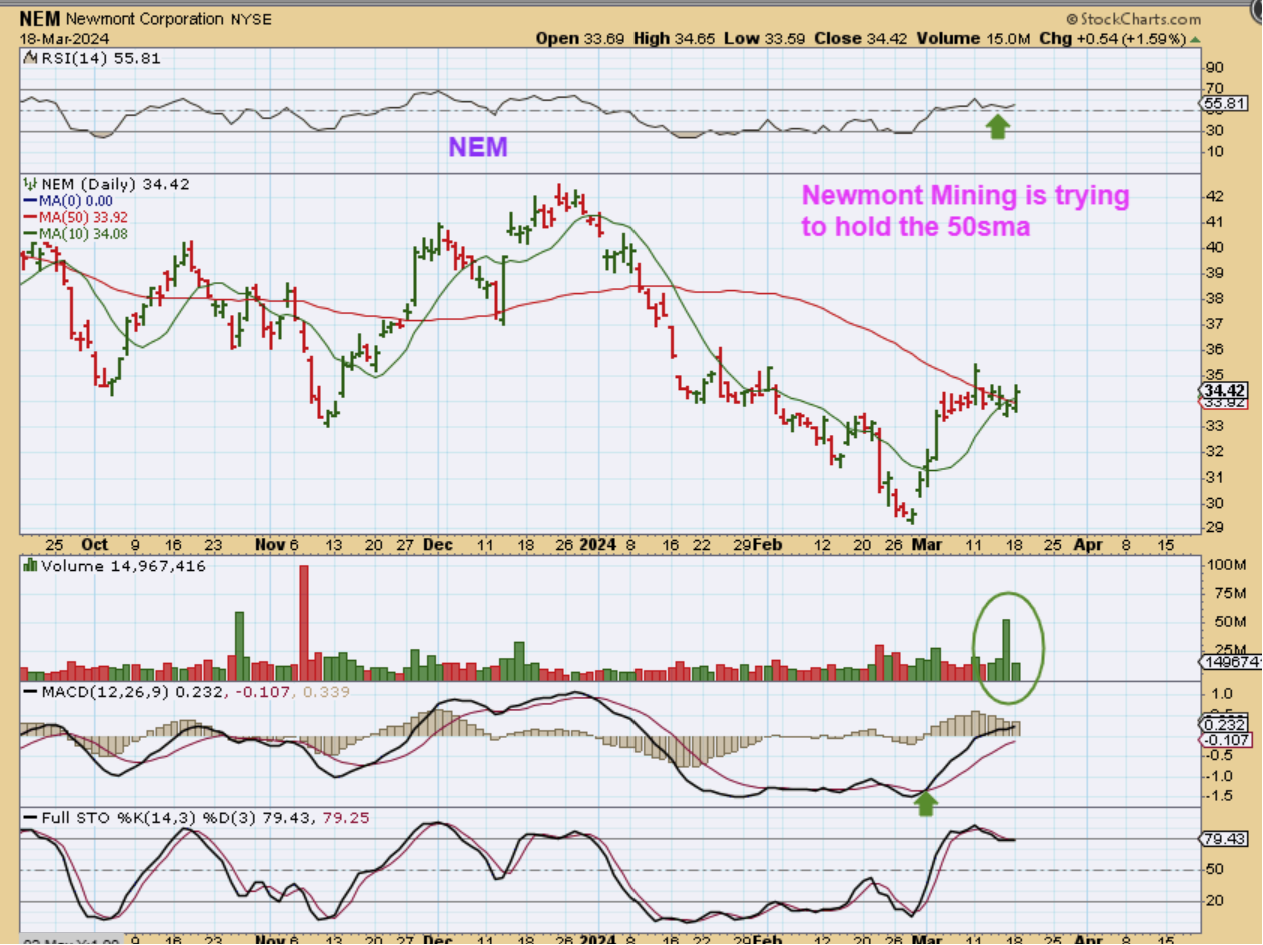
NEM –Newmont Mining & Barrick are a big part of the GDX ETF, and it was trying to stay strong on Monday by holding above the 50sma. See the chart.
.
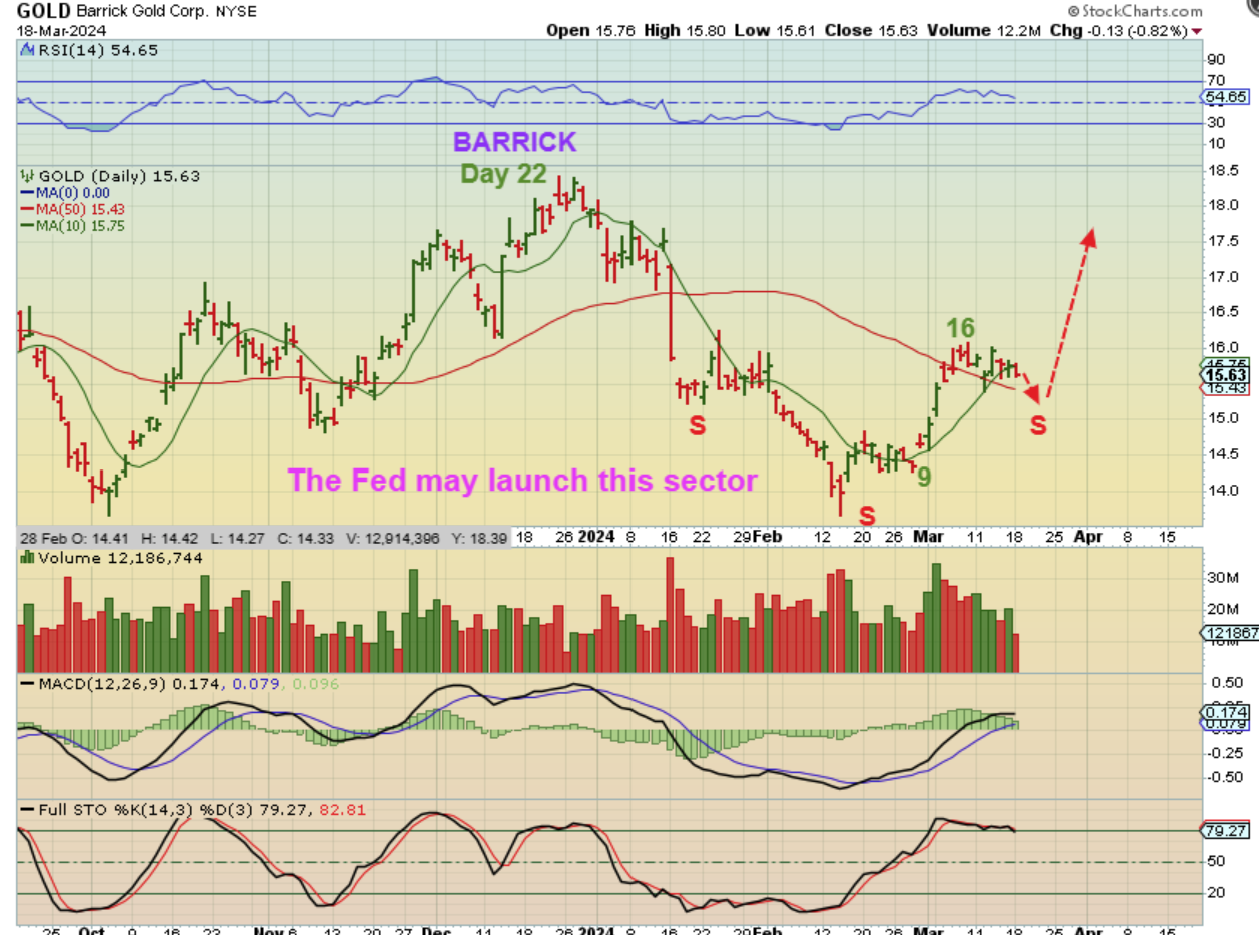
BARRICK –This is actually acting quite bullish too. Barrick is above the 50sma and looks like an inverse H&S, even it drops down a bit further. Barrick also looks like 4 waves of a 5 wave move higher. This was Day 22 for Barrick on Monday, so that gives us day 23 Wednesday and 24 Thursday for Barrick.
.
The timing for dcls is here, and the Fed Decision & Speech are also here on Wednesday, so the ‘timing’ is interesting. The Fed Mtg is always a tricky time, but it really doesn’t have to be. If we get a dip in the General Markets or the Precious Metals sectors, I don’t expect it to last very long. We currently have strong daily cycles holding up and so we would expect a push higher to new highs soon after a dcl is in place. We know that at times we get a false move lower on a Fed Day and then a reversal higher with the lows on Thursday, so we may see that. We’ll just have to be patient and wait and see what the Fed says. Enjoy your Tuesday trading!
.
~ALEX
.
LAST WEEK & IN THE WEEKEND REPORT, I thought that we should see a bounce and then a drop into a dcl here too.
.
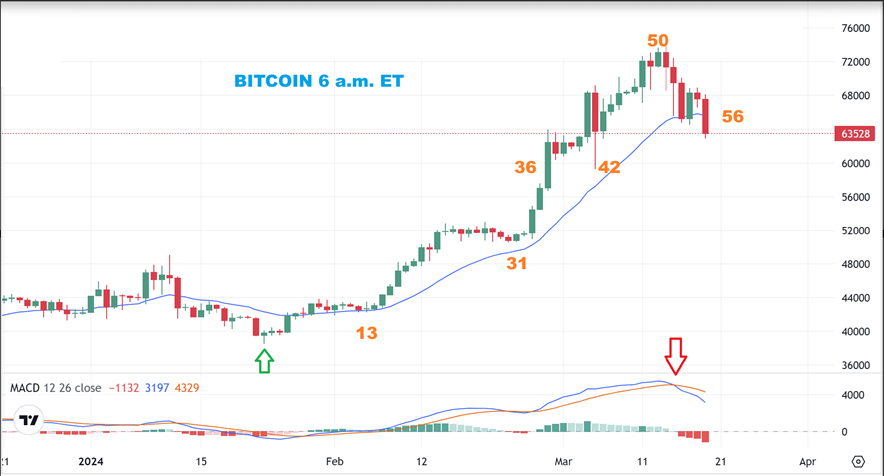
BITCOIN had a reversal at day 52, but I discussed that it is too early to be a dcl so I would expect possibly a bounce and then a deeper dip into a dcl (maybe an a-b-c down).
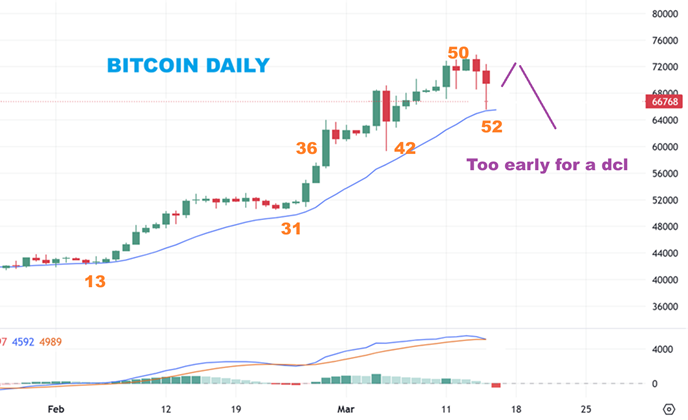
BITCOIN bounced and started to stall on Monday and this is Bitcoin this morning at 6 a.m. We do have that bounce & a drop and this is day 56. I expect the lows somewhere around day 60…
.
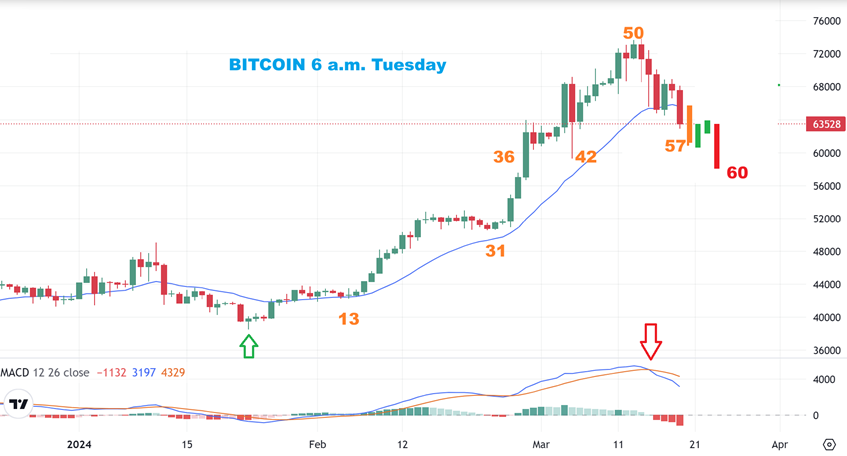
BITCOIN – So we may see another bounce and final drop, something like this. Why do I say that?…
.
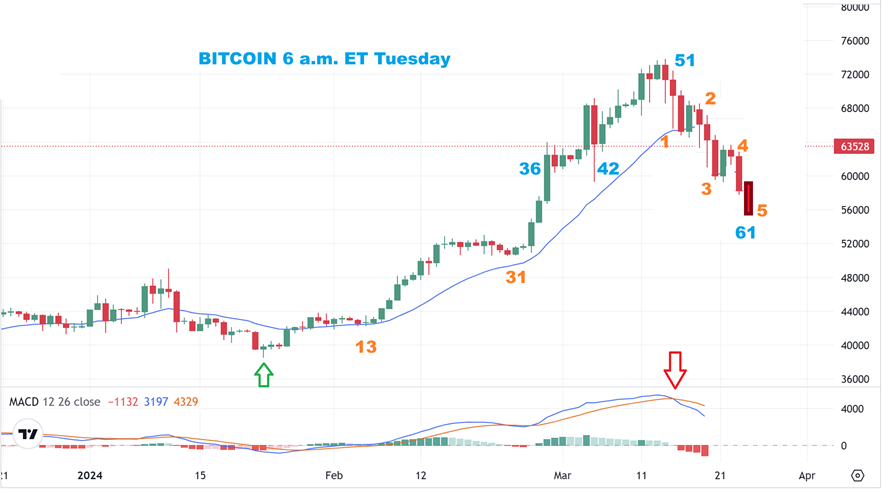
BITCOIN – I obviously can’t say that another bounce & drop will take place, but it would give us 5 small waves into the low. Today would be the #3 on this drawing, so we’d see a small bounce into the fed and then a final dip.
.
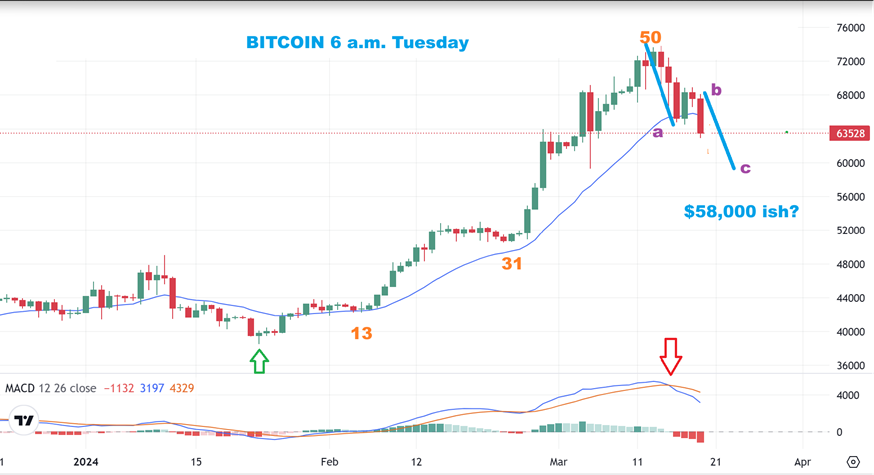
BITCOIN – Another view is simply an a-b-c down and this is just a live capture of Bitcoin and where it is now. This view is simply calling for a couple more days of selling to get us closer to day 60. It seems to only bring us around $59,000 as a 1 to 1 measured move, unless it extends.
.
.
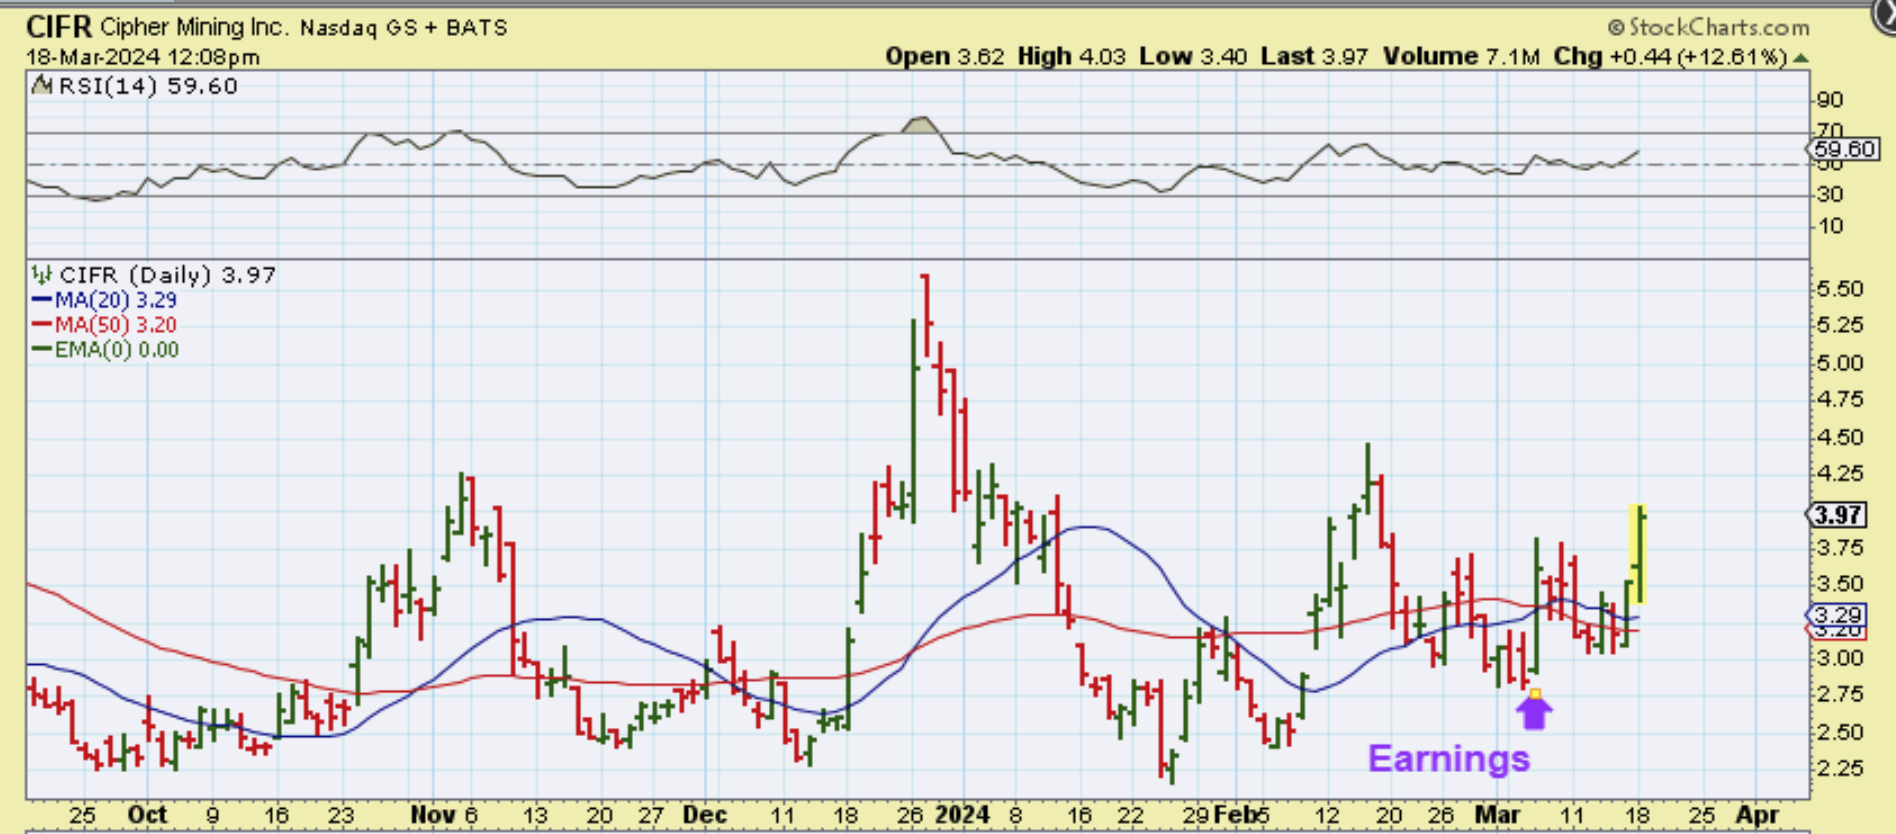
I have mentioned that as we dip into this dcl, I want to see if some of the Crypto related stocks ‘stabilize’ or base out, since they started dropping well ahead of Bitcoin. IF THEY DO, they could start another run higher when Bitcoin puts in a dcl. I am seeing a little of that with CIFR, CLSK, MARA< RIOT, WULF, and others. It just needs to continue with this final dip lower, so…
.
CIFR, as an example, released earnings and shot up 27% where that arrow is. It then started to sell with Bitcoins selling, but you can see that no damage was done. It moved up 12% yesterday and if this ‘basing’ continues with Bitcoin selling, we may have a bottom forming. I am eager to see what todays Bitcoin drop does to these Crypto stocks.
.
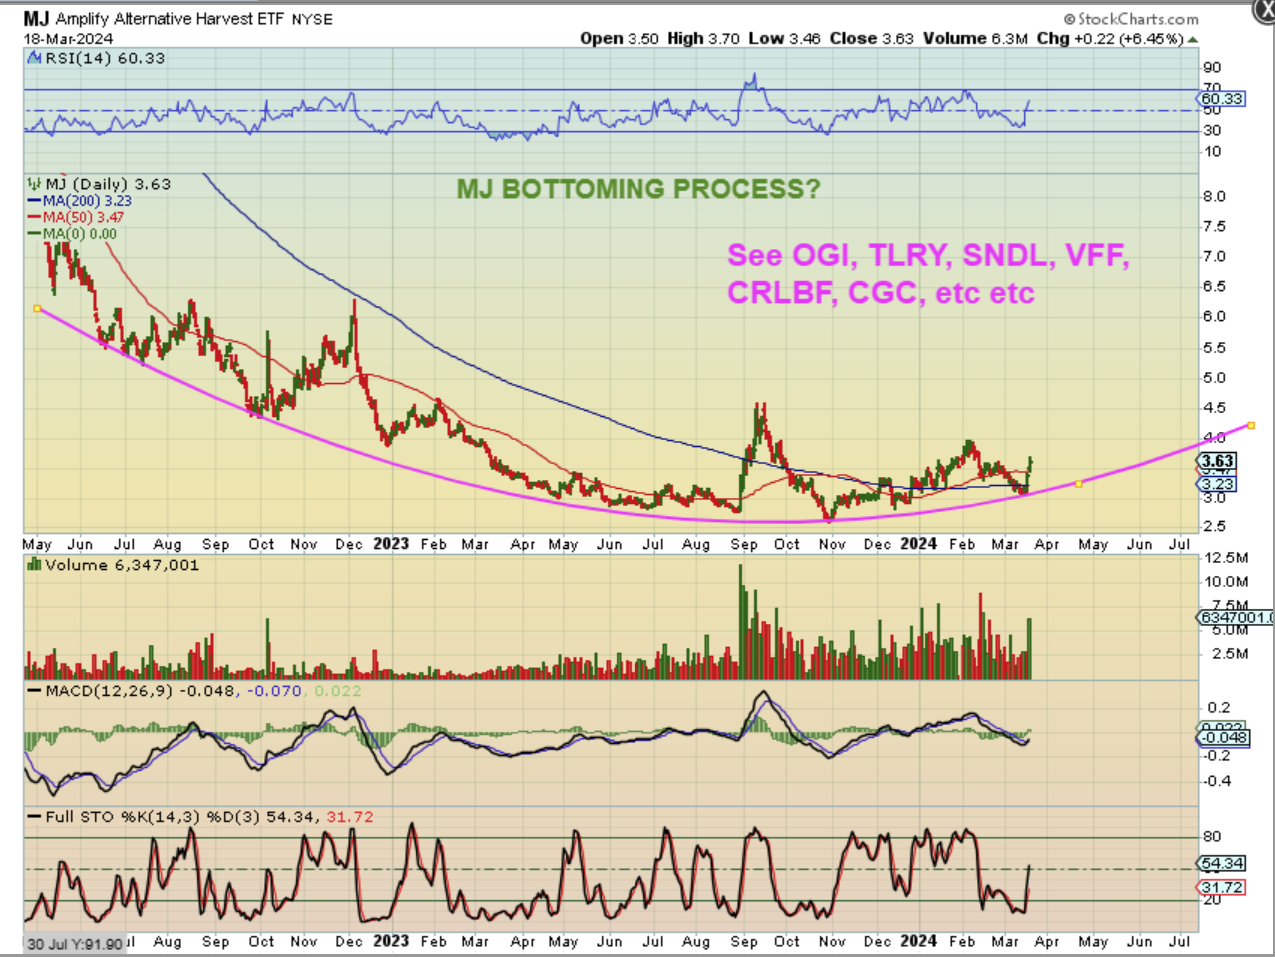
UPDATE: I mentioned months ago that The MJ Sector may be bottoming. I even traded it a little, but it really started to get choppy, so I stopped covering it for that reason. It can be a very choppy bottoming process, but ‘Littletimeleft’ mentioned it first in the comments yesterday, and Ed commented on TLRY & ACB, so I took another look. Things do look to be improving. We now have a higher low and several of the stocks look bullish too. This could be starting the better stage of a cycle – when it leaves the base behind and makes good gains. Check out the charts mentioned on this chart and I may have another sector to cover in the reports going forward.
.
MJ ETF – It looks like a huge base or round bottom, now with higher lows. This is such a choppy indecisive sector, but hopefully that changes as these begin to run higher. OGI is actually a very bullish looking chart.