March 3 Weekend Report
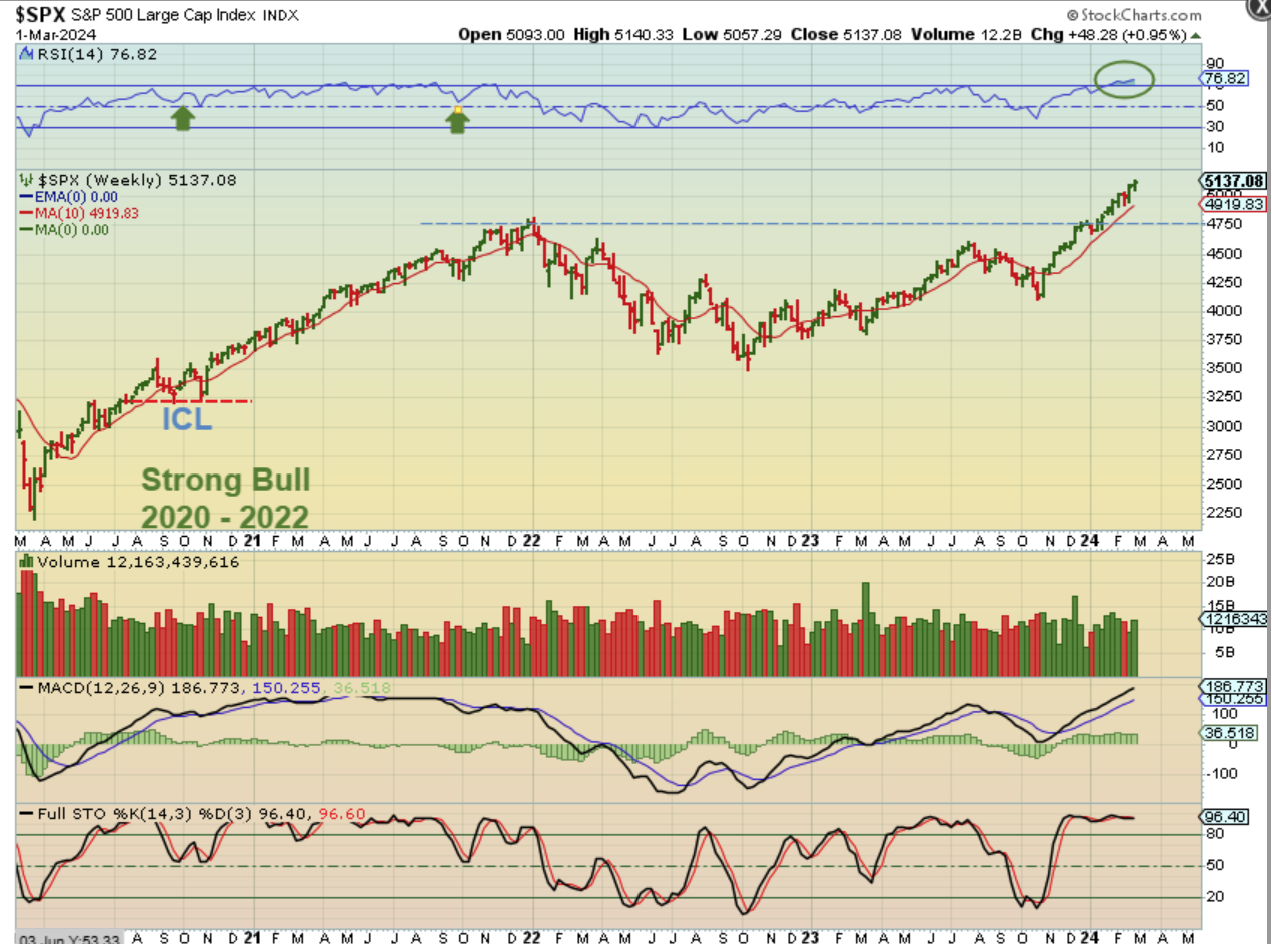
SPX WEEKLY – The markets closed at the highs again this week, and this is a very strong bull market. That said, even strong bull runs will eventually get too frothy and need a change in sentiment. When that happens they begin to pull back into a dcl and then an ICL over time. I’m pointing to the ICL drop in the strong bull run from 2020-2022 as an example. When I looked at 2020-2022, I noticed something interesting though…
SPX 2020 – 2022 WEEKLY – We usually see the timing for an ICL as roughly 6 months apart, but when I looked at 2020-2022 I noticed that we had a deeper Oct ICL, and then the next visible deeper ICL was the following Oct of 2021. We only seemed to have a very mild sideways chop 3 or 4 months after Oct 2020 and again in May, but the next deeper visible ICL was Oct 2021. That gave it the appearance that an ICL was in Oct 2020 and then 1 year later in Oct 2021. I mentioned this because…
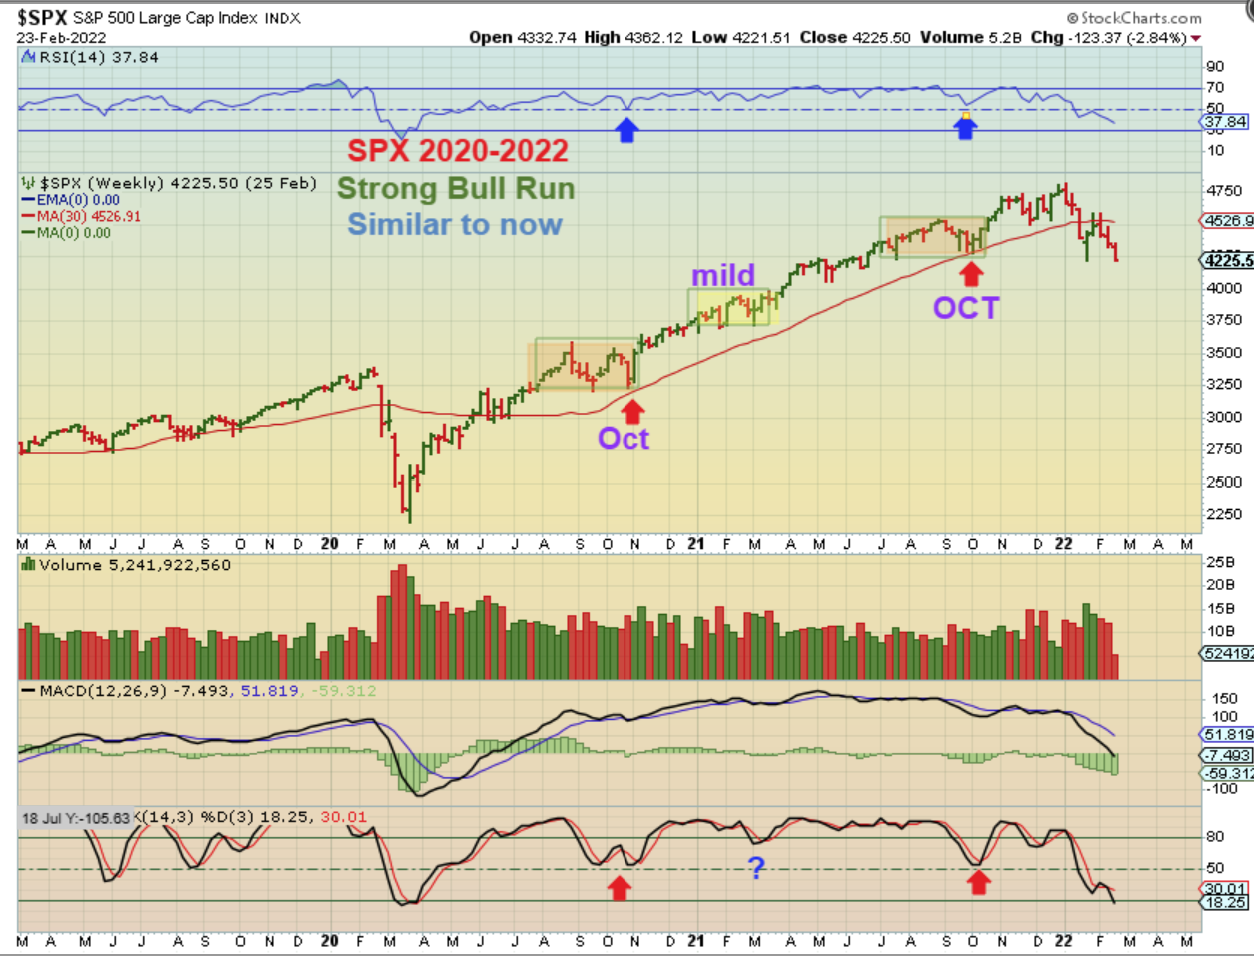
I mentioned this because our last ICL was in October too. Can you imagine a strong run like this from Oct last year to Oct this year?
.
Could this rally also run strong all year long? Maybe. If it mimics that 2020 run, we’d just get some mild chop coming up soon with mild dcls, and then give us a deeper ICL drop in October? MAYBE, however take a look at the current RSI reading 4 months into this intermediate cycle. We are already overheating more than it did anywhere on that last run, so we may need to cool off this summer with an ICL.
This is a strong run and Right now we have a very R.T. Daily Cycle, and the start of the 3rd daily cycle is a buy at the next dcl.
.
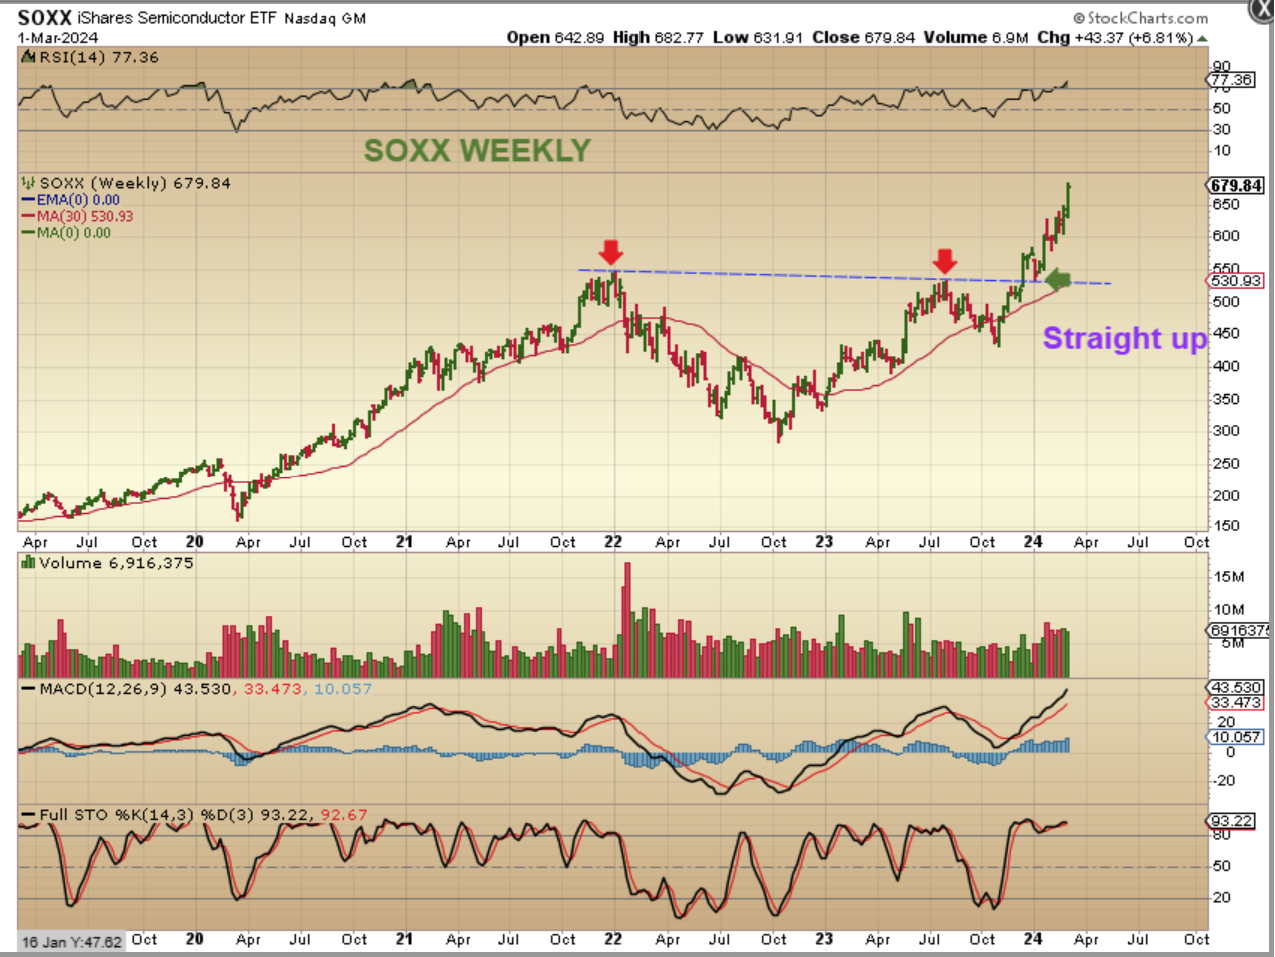
SOXX WEEKLY – The SOXX has been going practically straight up after a breakout from a cup and handle and a quick back test.
.
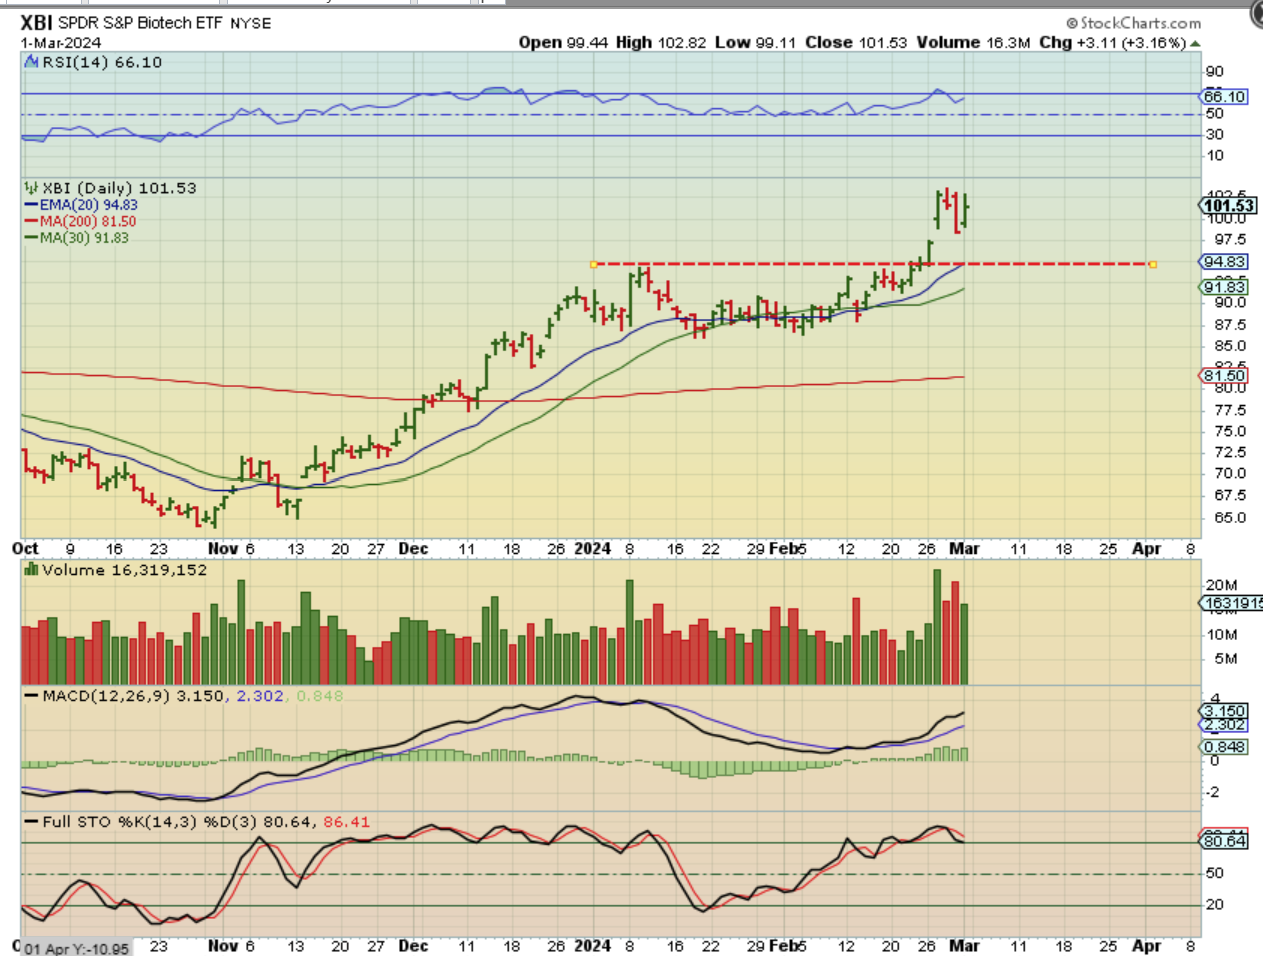
THE BIOTECH SECTOR BROKE OUT AND REMAINS BULLISH TOO.
.
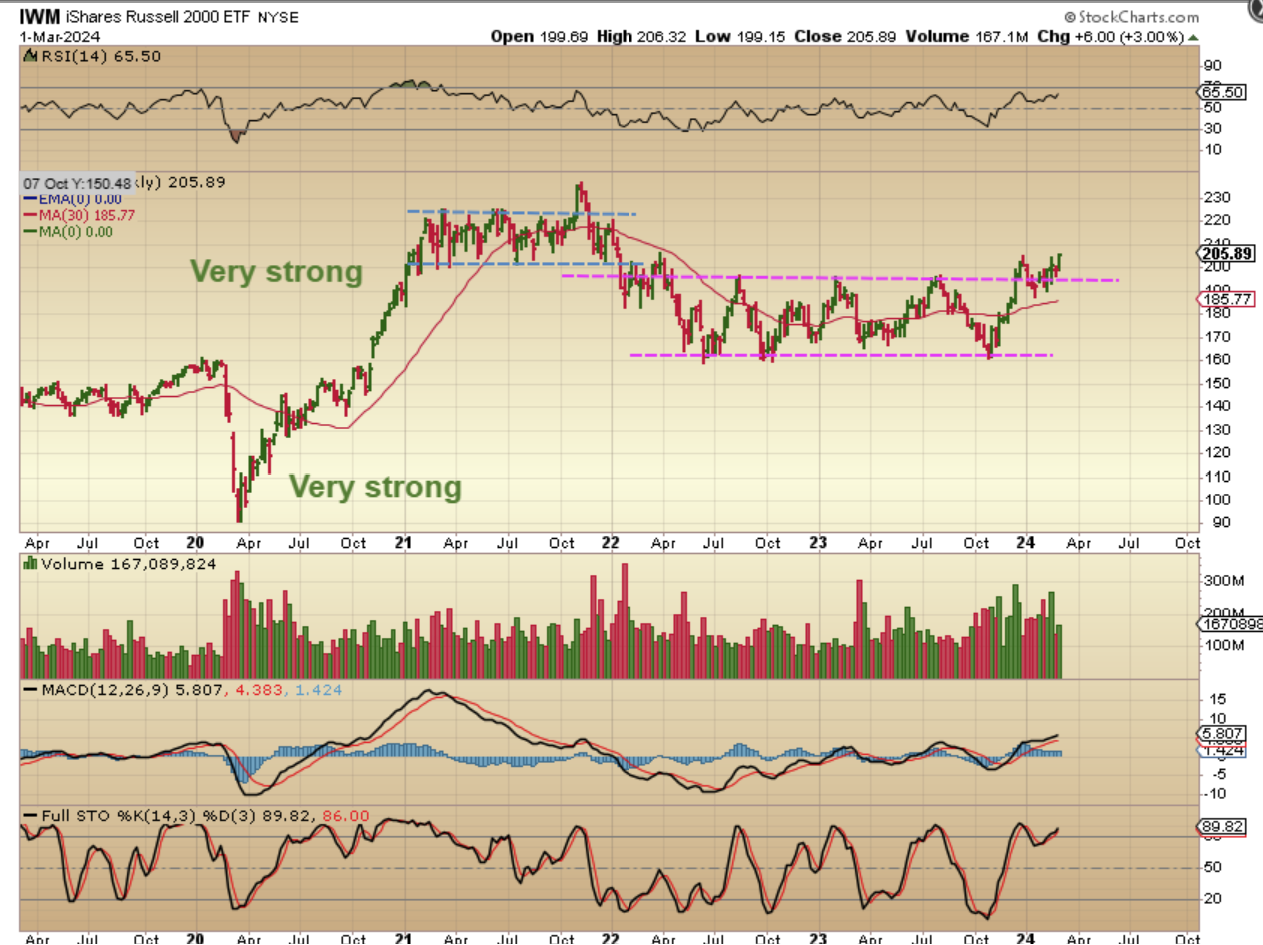
And then we have the lagger, The IWM WEEKLY.
It is at the highs after a breakout and a sloppy back test. This does not resemble the 2020 run when EV, MJ, Solars, Clean Energy, etc all rallied VERY strongly.
.
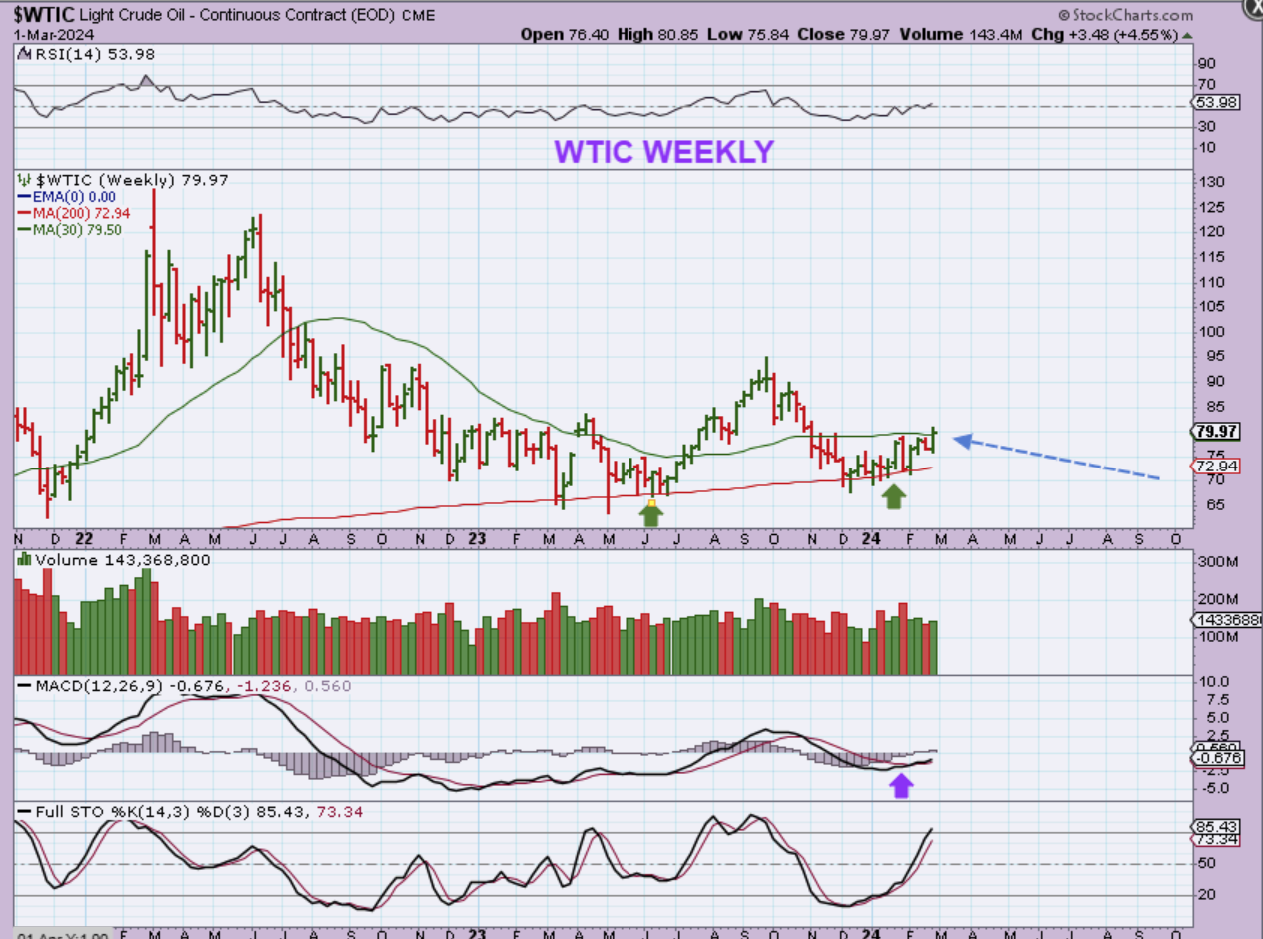
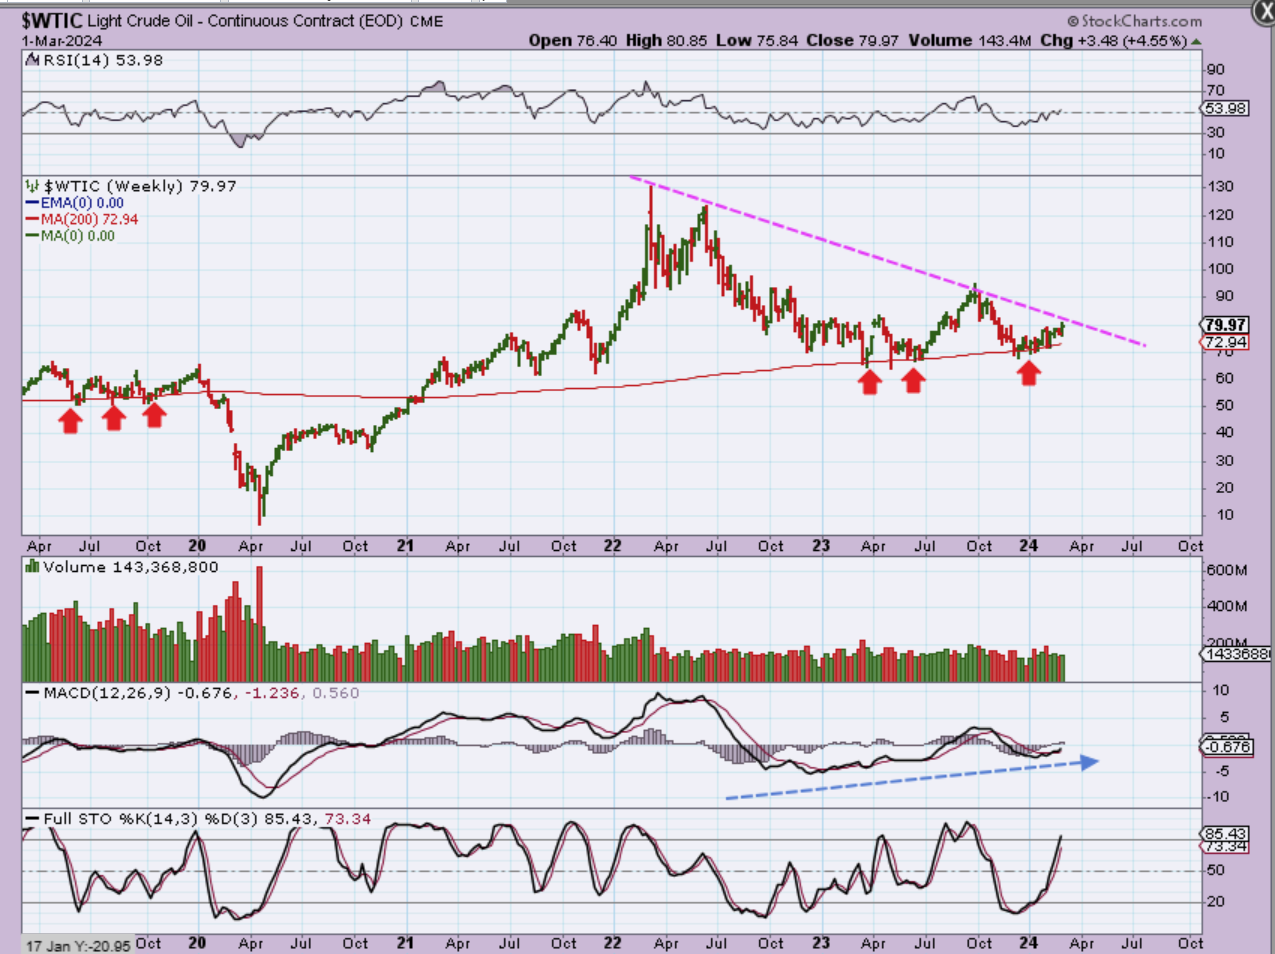
WTIC WEEKLY – Last week I said that I was watching for this Oil Chop to finally stop and possibly break out above the 30 week ma. We seem to have that breakout (barely). Oil & Oil stocks look ready to possibly trend higher now, but…
.
WTIC WEEKLY – We do have another major hurdle, but Oil may take this out this week too.
.
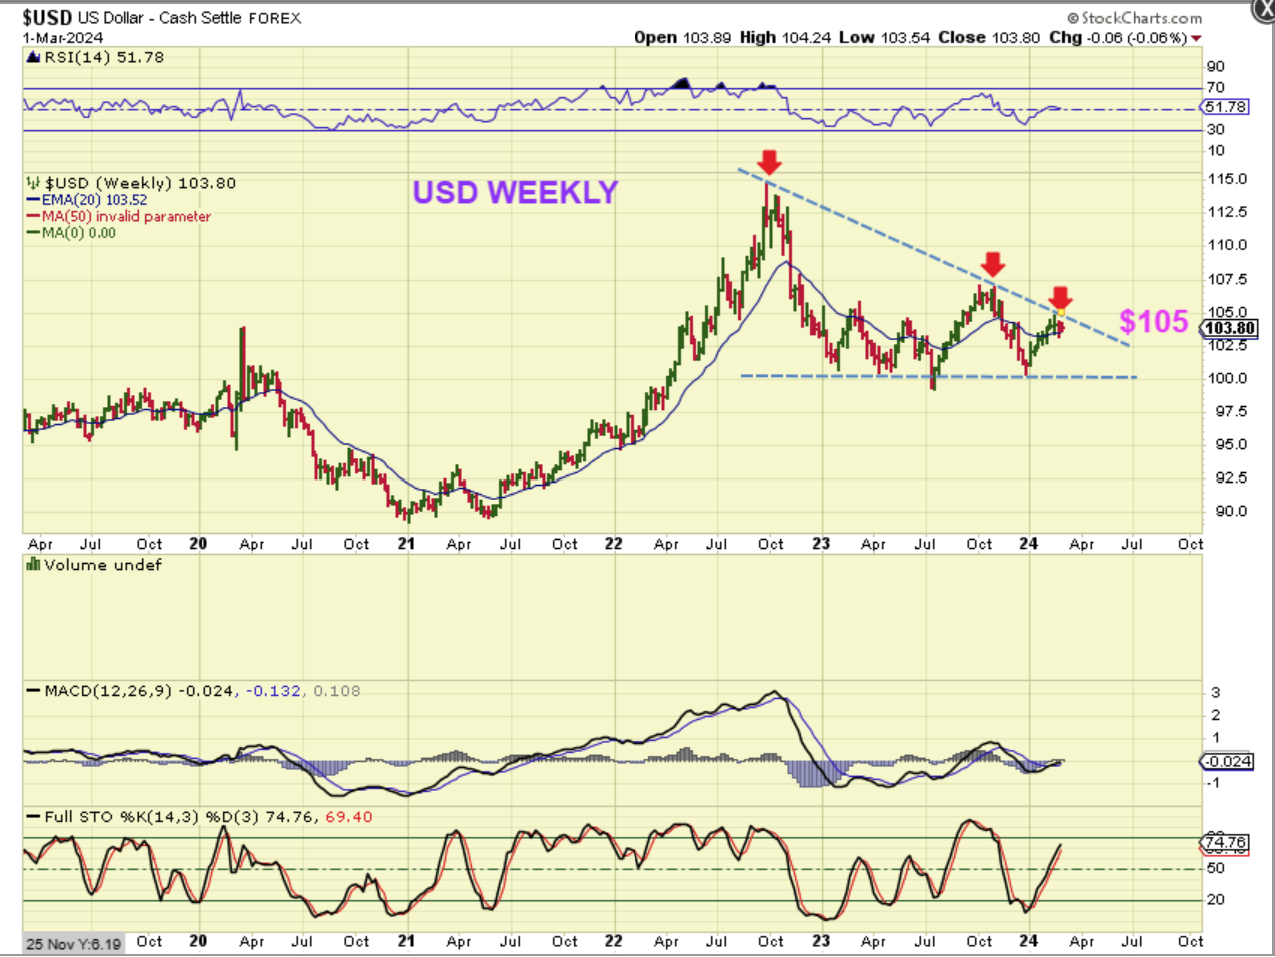
USD WEEKLY – I had been calling for a tag of that $105 area, and then HOPEFULLY a pull back, to indicate that the 3 year cycle low is still ahead. So far, we are right on track, but even better than that is that Gold Popped this week with the USD up, and now Gold SURGED on Friday!
.
LET ME PUT IT ANOTHER WAY: USD was down 6 cents for the week, and Gold was up $46 this week!
WHAT I WROTE ABOUT GOLD IN FRIDAYS REPORT:
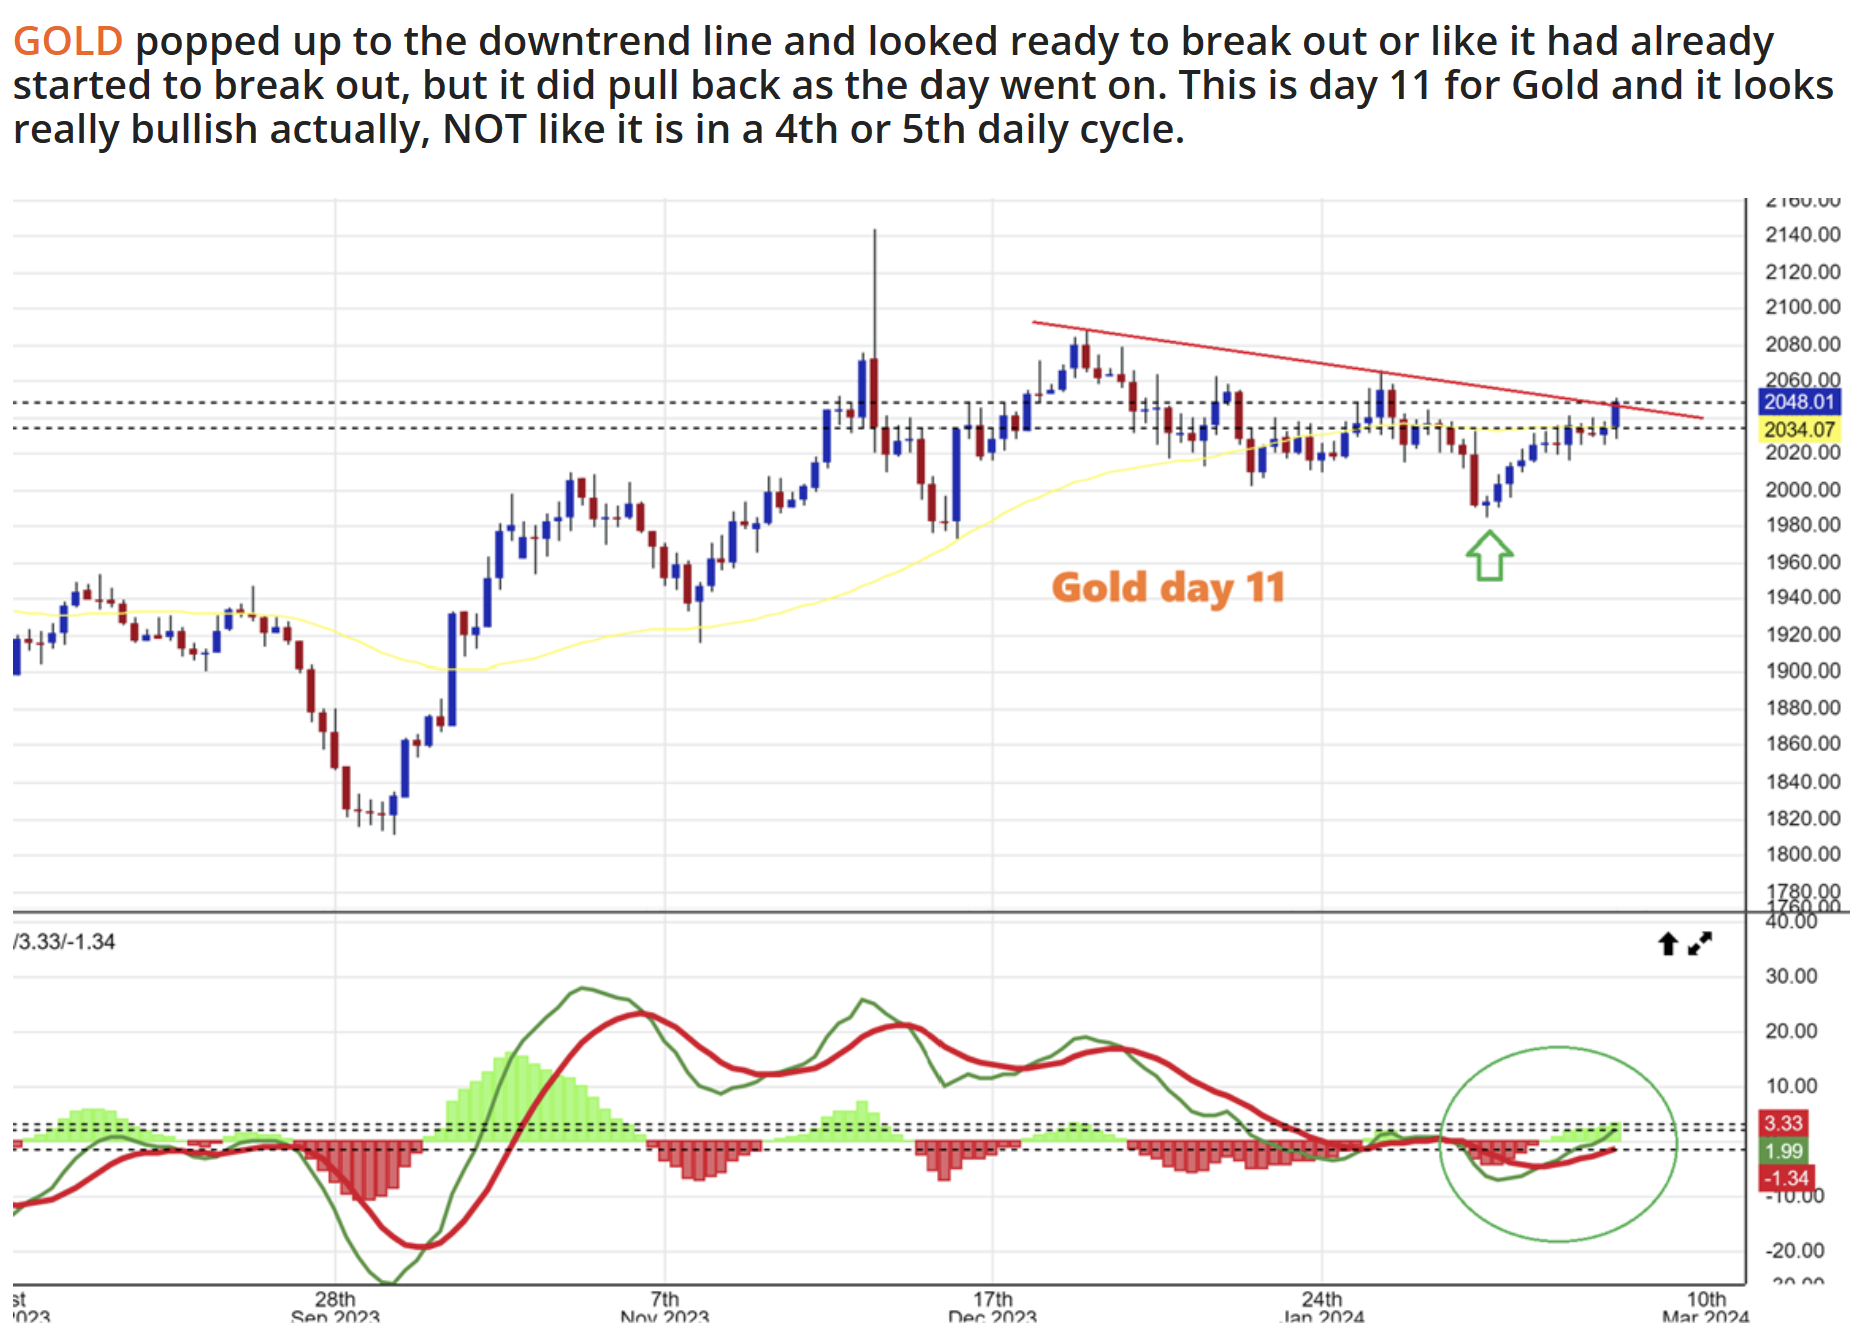
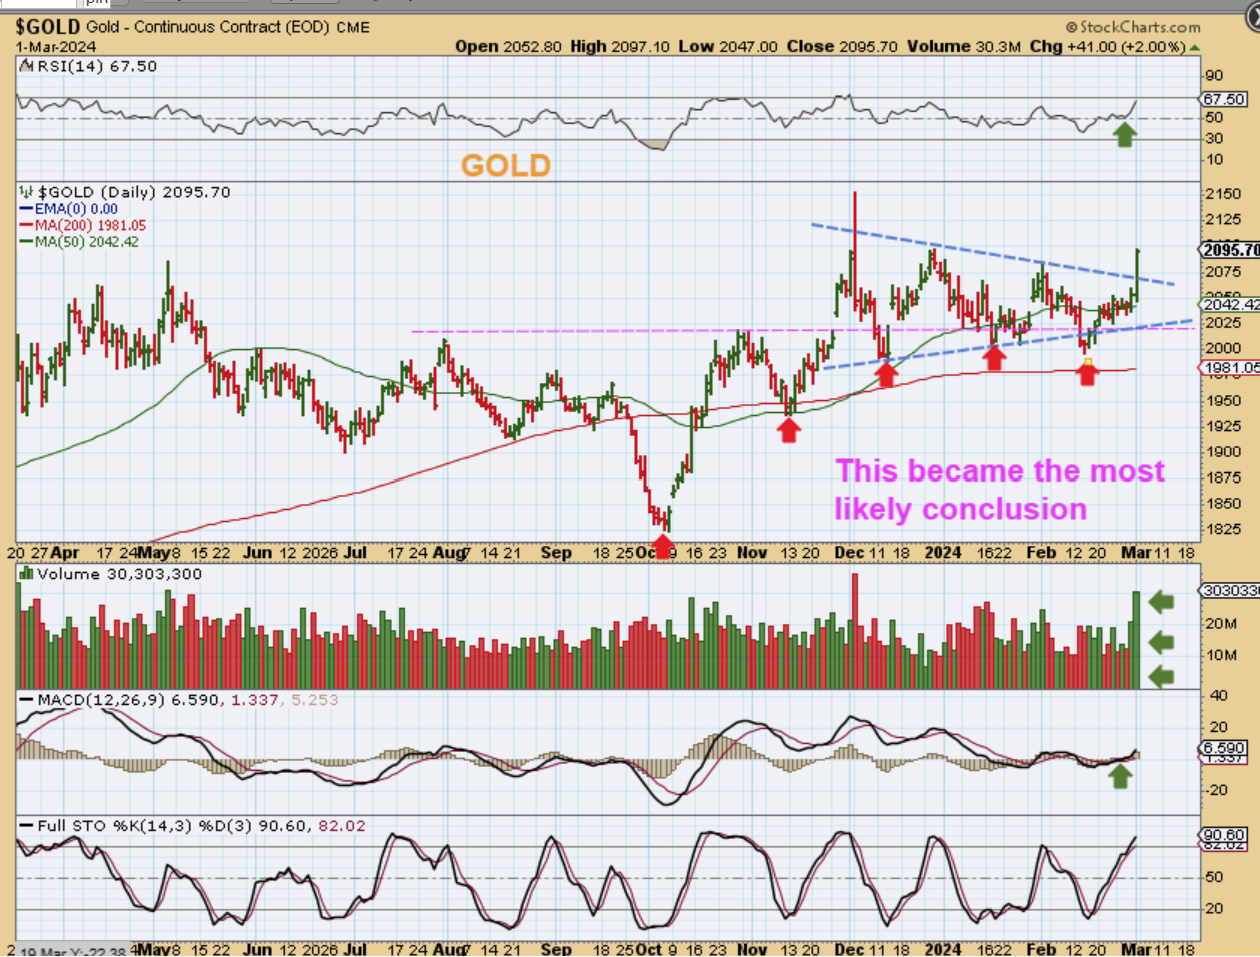
GOLD DAILY – Gold exploded this week and was up $41 on Friday alone! This is a breakout from the bullish triangle that I have been pointing out in my reports, indicating a possible stealth ICL( I say this, or repeat this, because some have told me that they skip reading the reports for a day or 2, and often have missed out on our most up-to-date expectations). We expected that Gold could break out and leave many behind. Look at that volume!
.
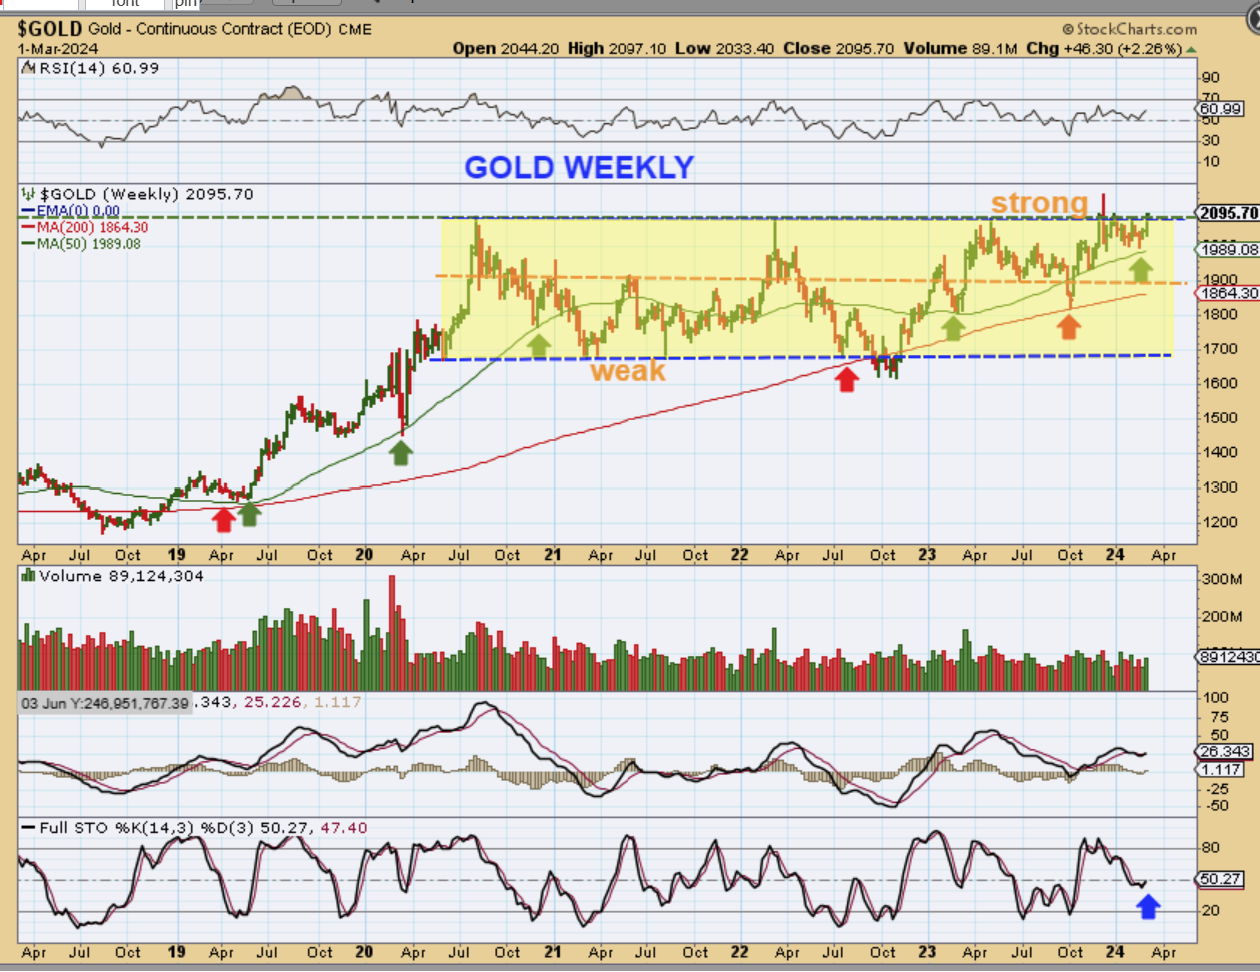
GOLD WEEKLY – I also have been pointing out that in my opinion, this is a very bullish consolidation because…
1. It was weak and hanging around at the lower range of $1700 to $1900 area for a couple of years, but lately?
2. We have only traded in the $1900 – 2100 area. I also pointed out that recently Gold is only dropping and popping in a $100 range, and THAT is not normal for a 4th or 5th daily cycle. Gold was strong and needed to be respected for that.
3. This looks ready to break out and run past new all-time highs, and with Miners at the lows, they could really play catch up quickly. Let’s watch for that and I mentioned that I was buying on Friday premarket. 🙂 The Stochastics is also just fine for a bull market rally.
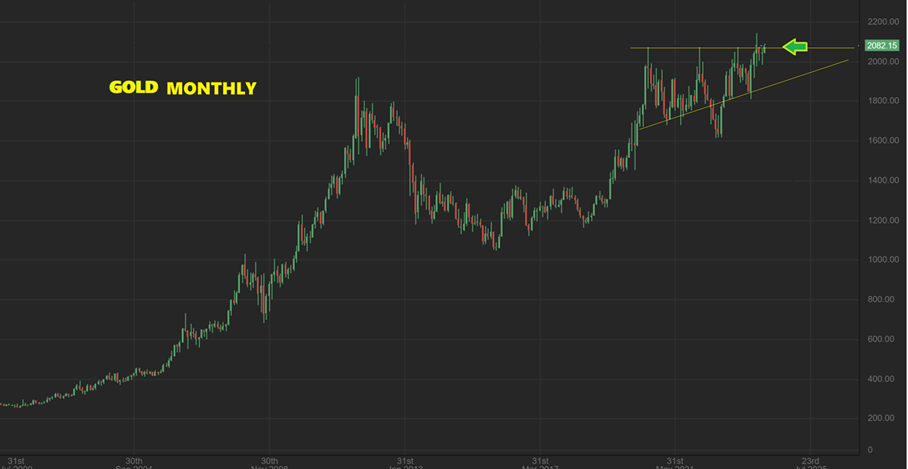
GOLD MONTHLY -This is a bullish Monthly view. Price has been hanging around right at the HIGHS, in what should be a 4th daily cycle. That is very abnormal.
.
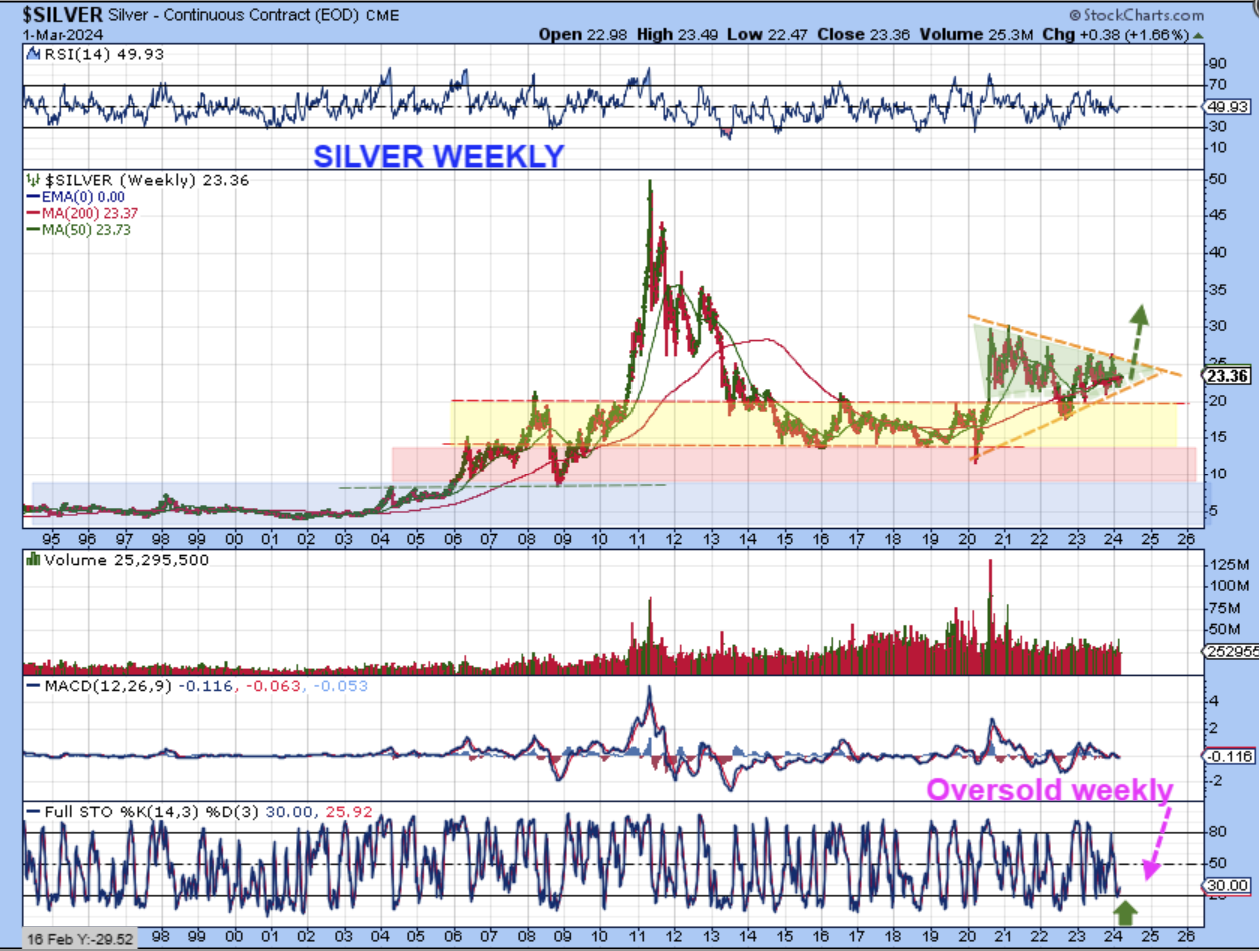
SILVER WEEKLY – Silver has been ‘coiling’ or ‘churning’ sideways for years, and when it breaks out there should be a lot of energy built up for a run higher. I can even see a triangle consolidation forming. We are at THE LOWS, and the stochastics is now OVERSOLD on the weekly charts.
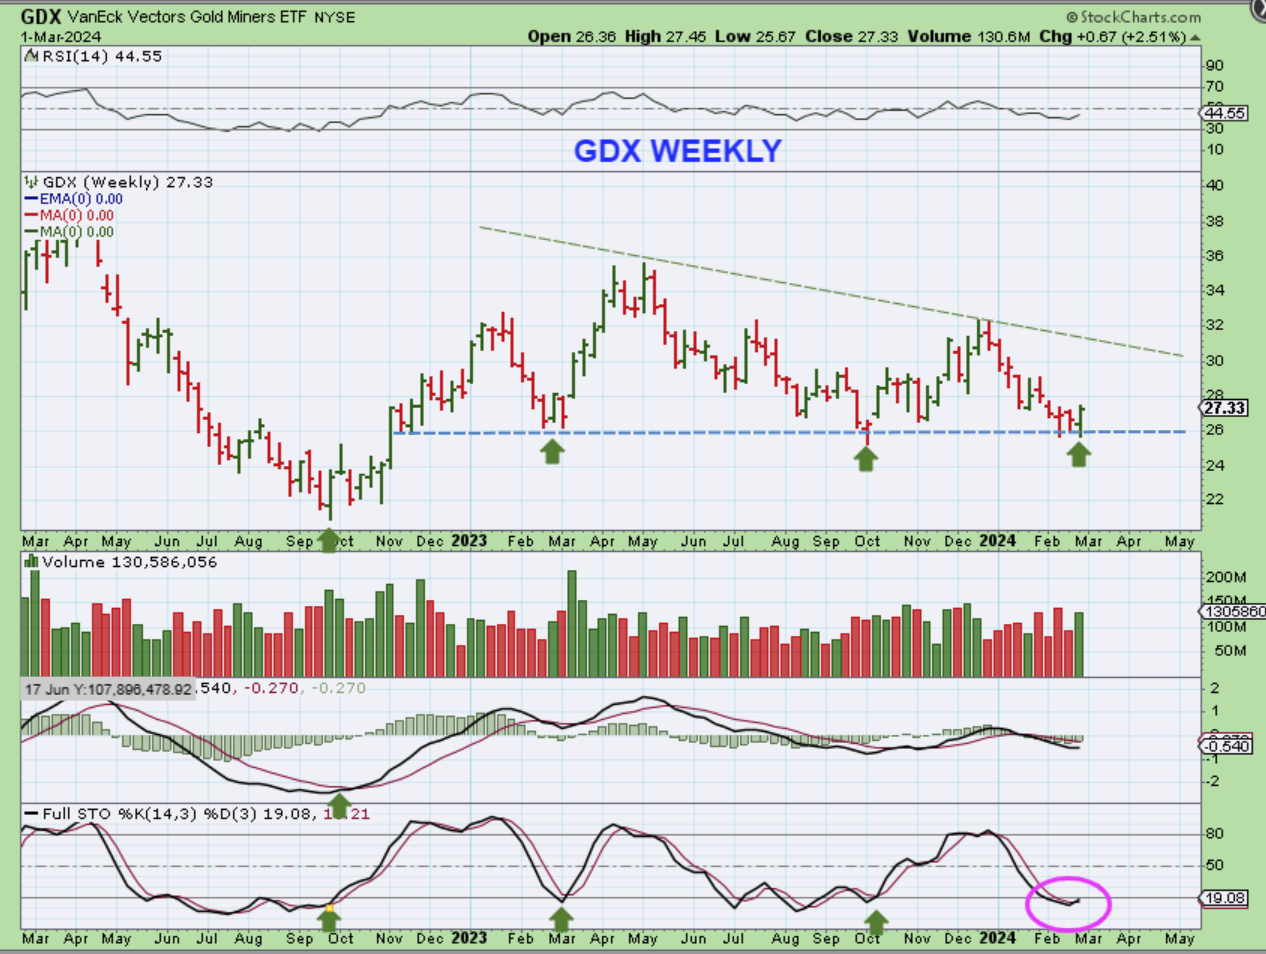
TAKE A LOOK AT THE GDX WEEKLY CHART: We have a reversal at the common lows. The weekly stochastics is oversold & curled up. This looks like an ICL formed on
1. September 2022, and
2. Feb/ March 2023, and
3. Oct 2023,
4. And now it looks like an ICL developed here too, with an a-b-c drop.
5. Also, Volume was good this week as the Miners reversed higher.
.
ON FRIDAY MORNING, I CONCLUDED MY REPORT BY SAYING THAT THIS SECTOR LOOKED SO BULLISH TO ME, I WAS GOING TO BUY IN PRE-MARKET, BECAUSE I HAD TO LEAVE FOR THE DAY. I WILL CAPTURE WHAT I WROTE HERE:
AND YES, I BOUGHT PREMARKET BEFORE I LEFT FOR THE DAY.
.
.
The Bullish Sectors like the General Markets, Biotech, and Oil remained bullish, but now we can add the Precious Metals to the group as likely starting to make a bull run of its own. With Golds surge higher on Friday, we really should be starting the next phase of attempting a breakout and trend to new all-time highs. I will cover Bitcoin briefly below with a couple of Crypto stock charts. Enjoy the rest of your weekend!
.
~ALEX
.
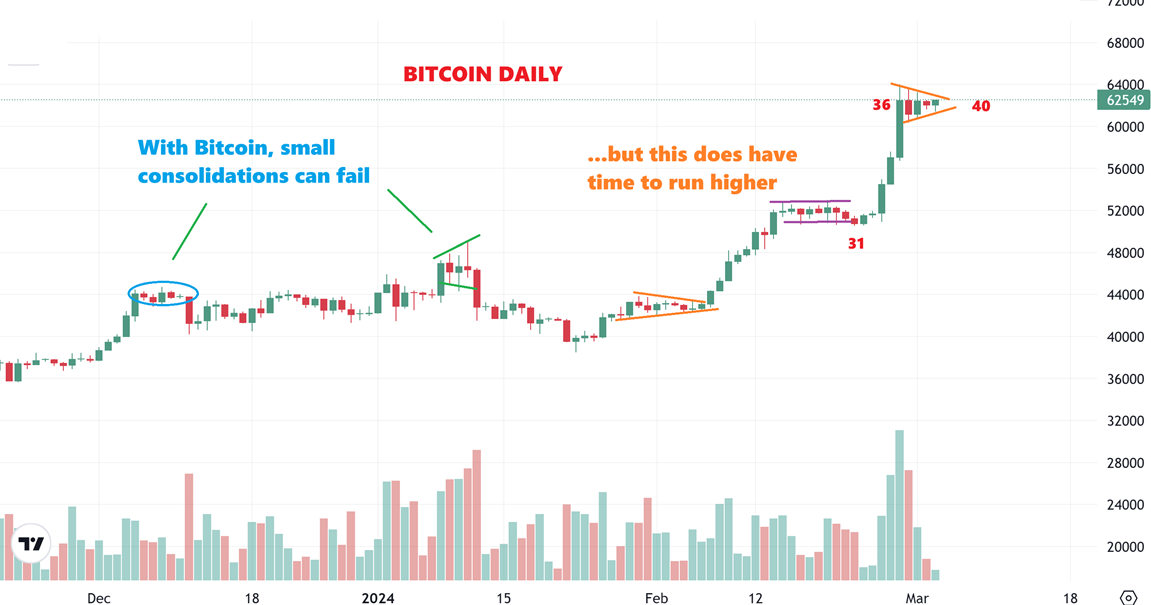
BITCOIN #1– This could be forming a bullish triangle or pennant, and it certainly has enough time to make another run. Crypto stocks also put in a reversal at support on Friday, so they also could run up to the highs again and give us a large consolidation. We’ll just have to wait and see.
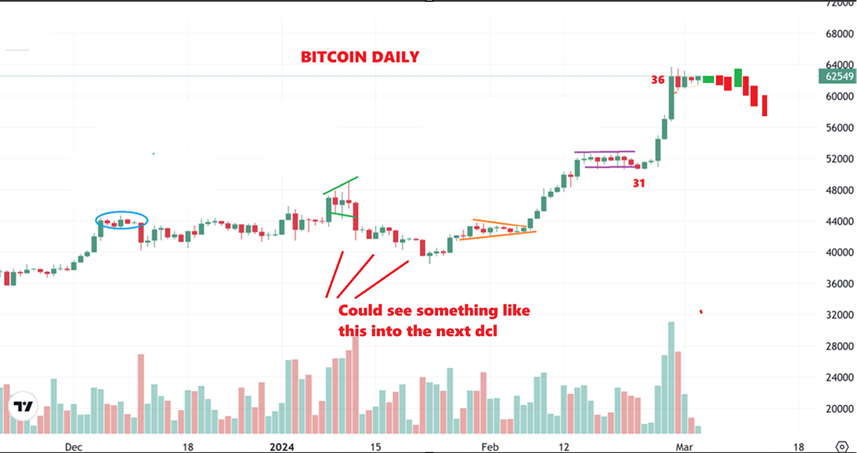
BITCOIN #2 – We also could get a slow sell off into the next dcl around day 60. We have had a 5-wave run higher, so this is not an unreasonable idea either. The drop could look a bit like the one in January, where it dropped, bounced, dropped, bounced and then bottomed.
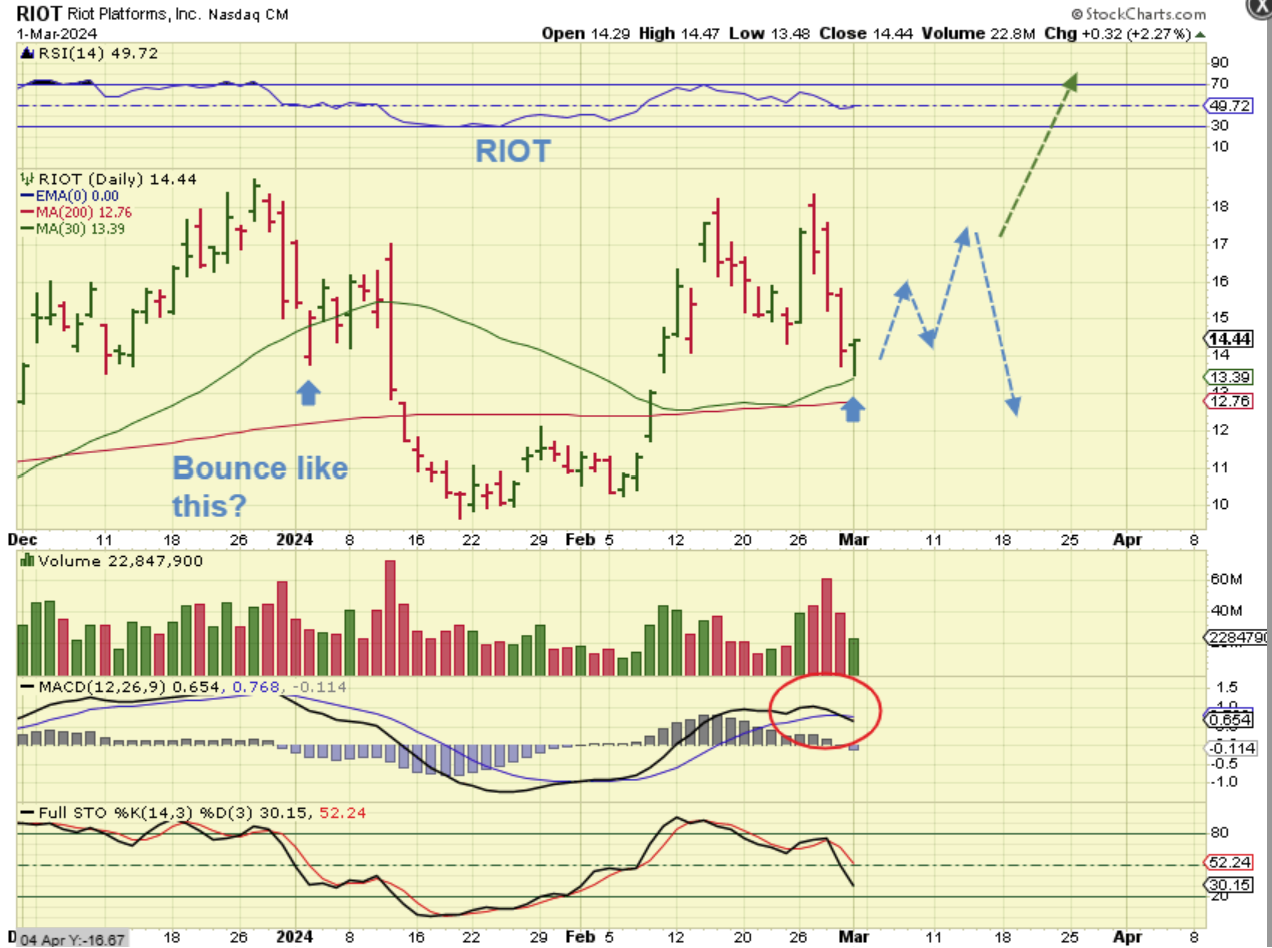
RIOT: So with some of the Crypto stocks, we got a reversal on Friday. It may just be a bounce. With RIOT, the MACD crossed down.
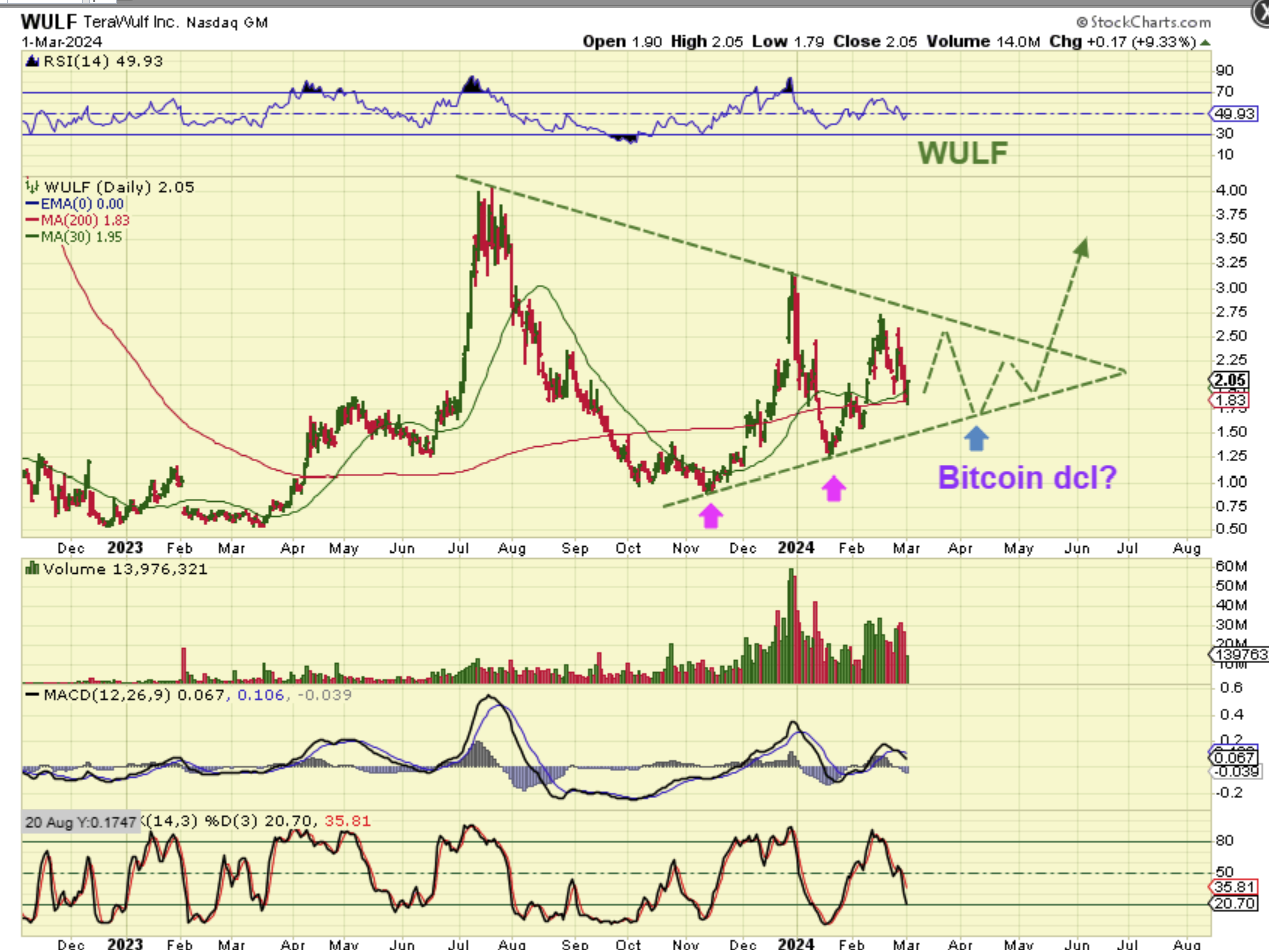
WULF– Wulf reversed right at the 200sma, so it could bounce if Bitcoin breaks higher, but these may just become choppy for a while too.