February 3rd Post-Fed Weekend Review
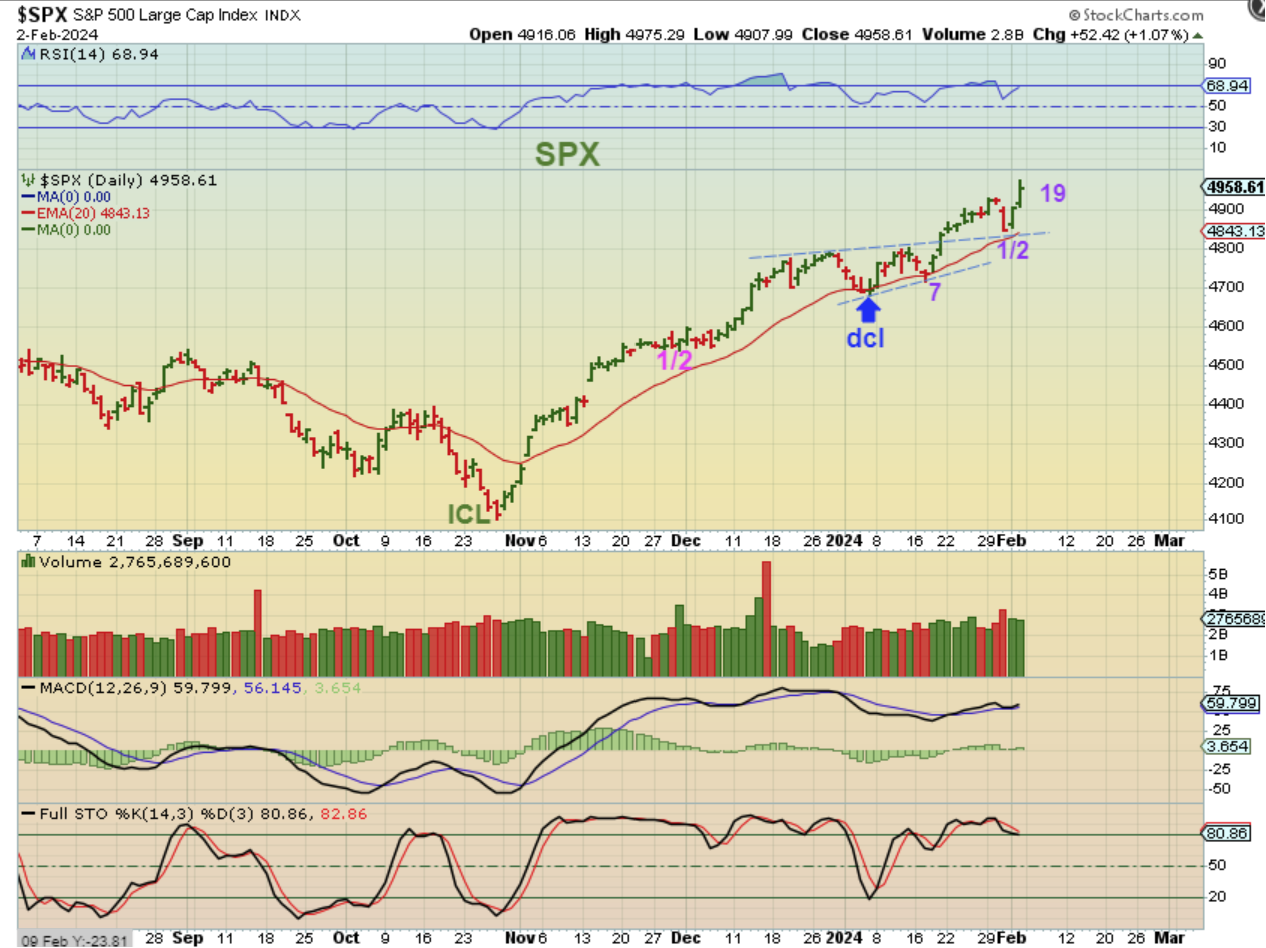
SPX DAILY – The general markets dropped sharply into the close of Wednesday, which was the day of The FOMC Mtg. That didn’t really make sense, since the Fed discussed rate cuts as likely in 2024 (but hinted at a delay and not in March as many expected). Well, that was a 1 day dip and the markets are now at new highs with the Thursday and Friday ramp up. I mark that as a 1/2 cycle low and a dip into a dcl isn’t really due until we get closer to day 30.
,
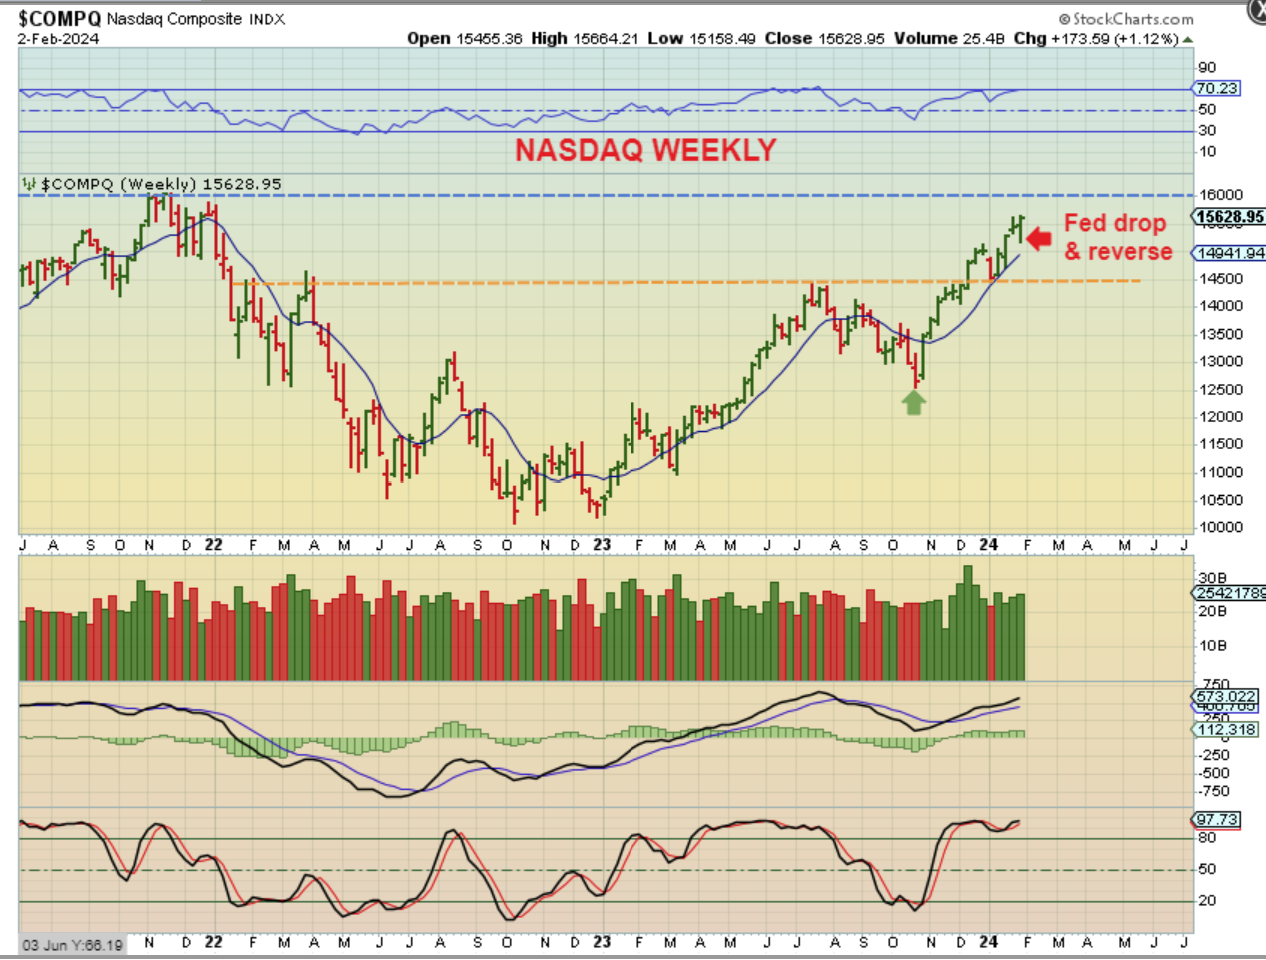
NASDAQ WEEKLY – So the General Markets remain Post-Fed Bullish.
.
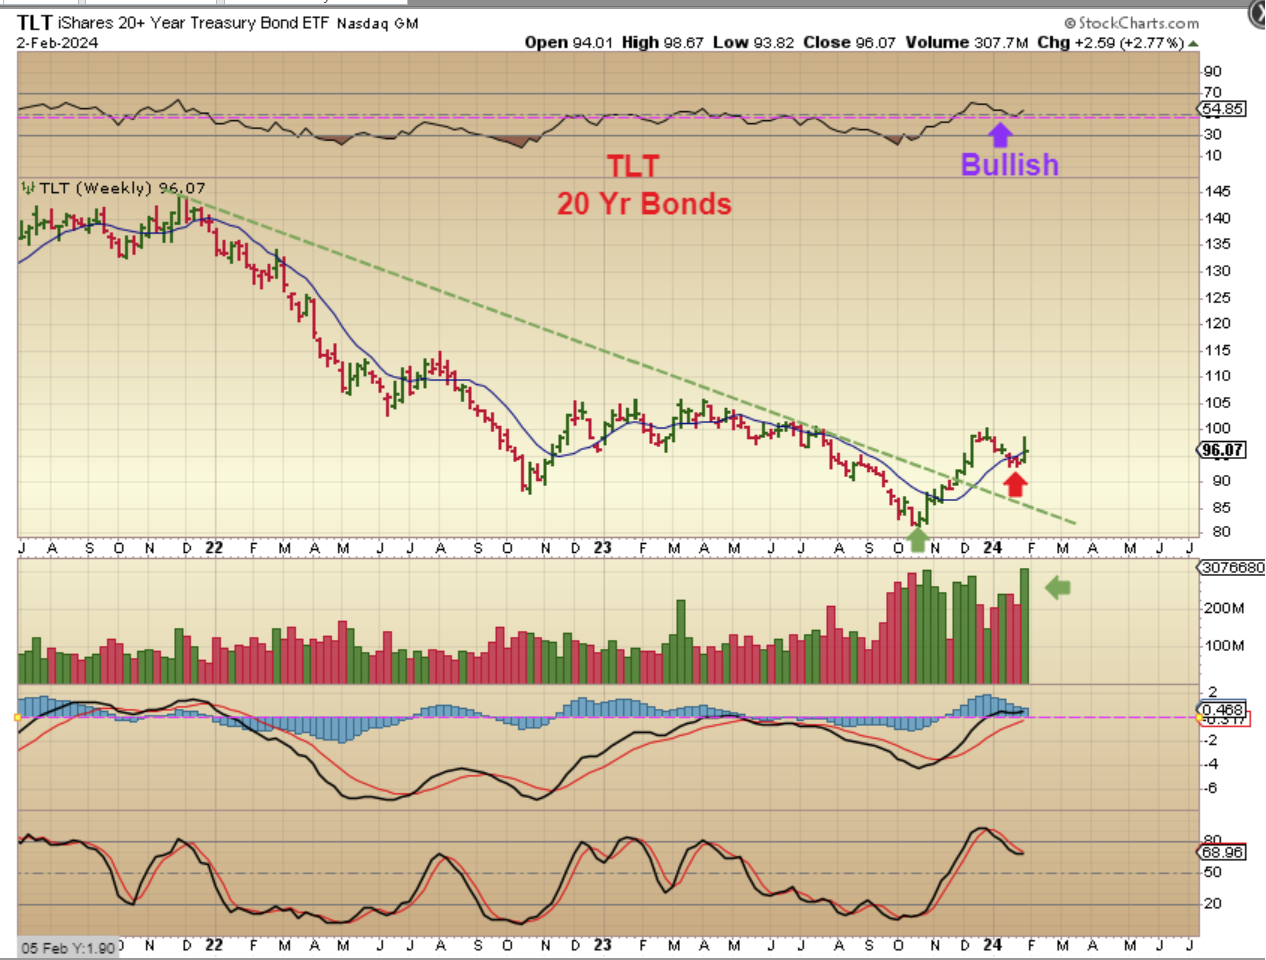
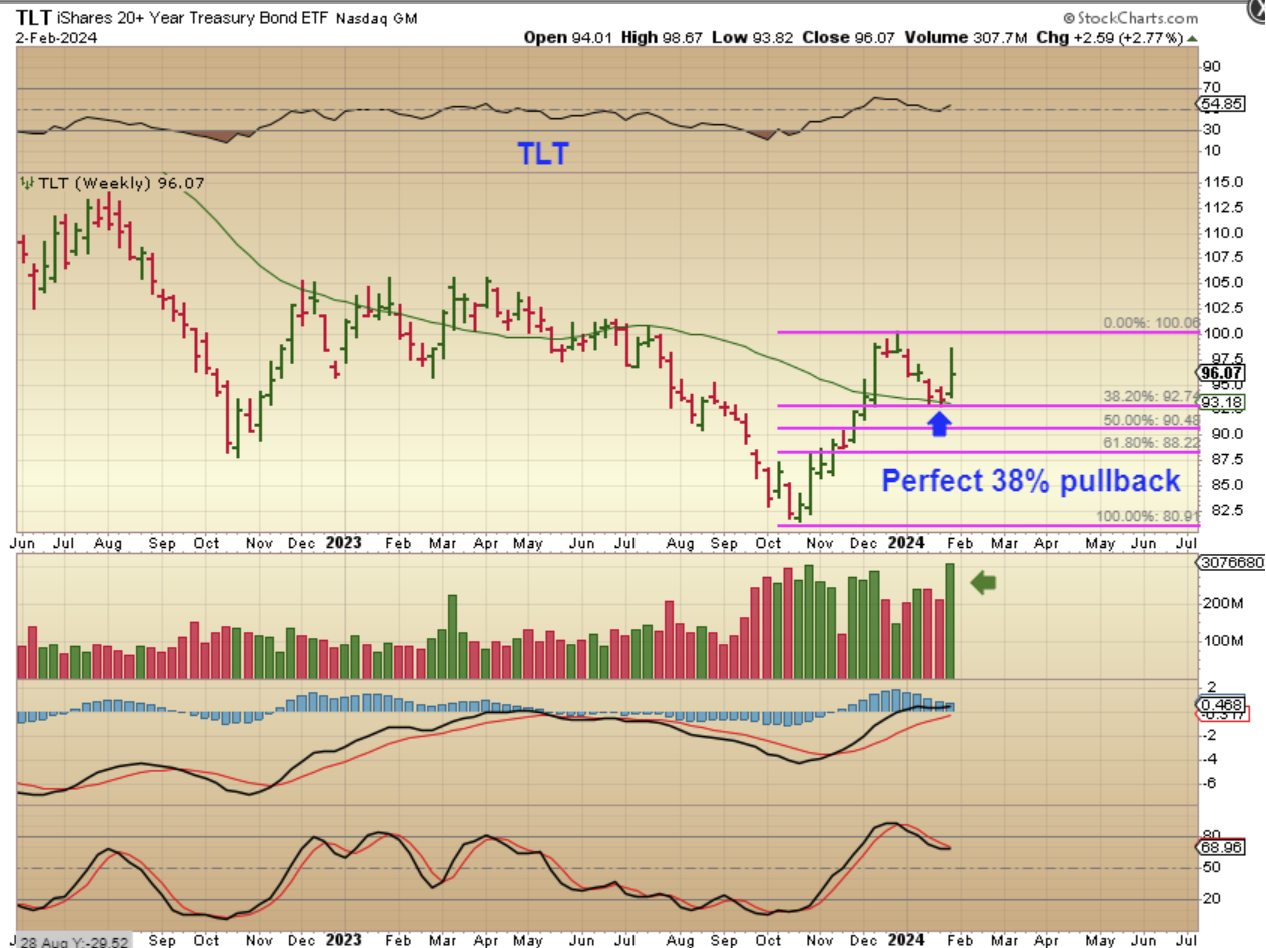
TLT WEEKLY – The TLT reversed higher this week too. The RSI bullishly curled up at the 50% line, and another bullish marker is …
.
THE TLT also reversed right at the 38.2 Fib level for a perfect retracement. So even though the TLT ran up last week and then gave some back (not at the highs), this still may be the lows for the next push higher again.
.
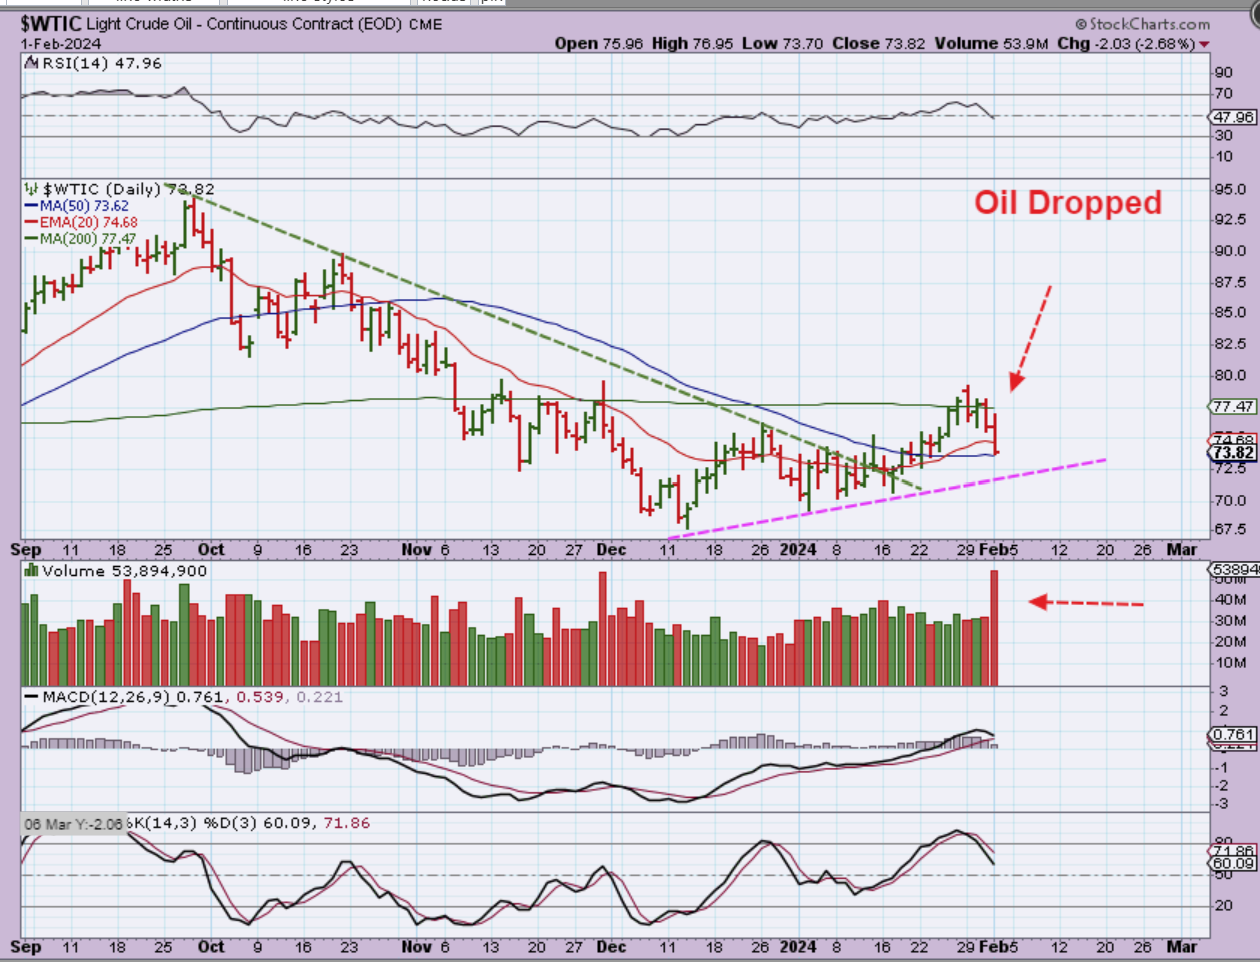
IN FRIDAYS REPORT, I POINTED OUT THE TIMING IN OILS DIP WHEN I SAID…
.
WTIC has been very choppy and yesterday it dropped after crawling along the 200sma. Oil has been choppy and is now on day 33, so I wouldn’t really think that it will rally from here, this is likely the start of the drop into the dcl.
.
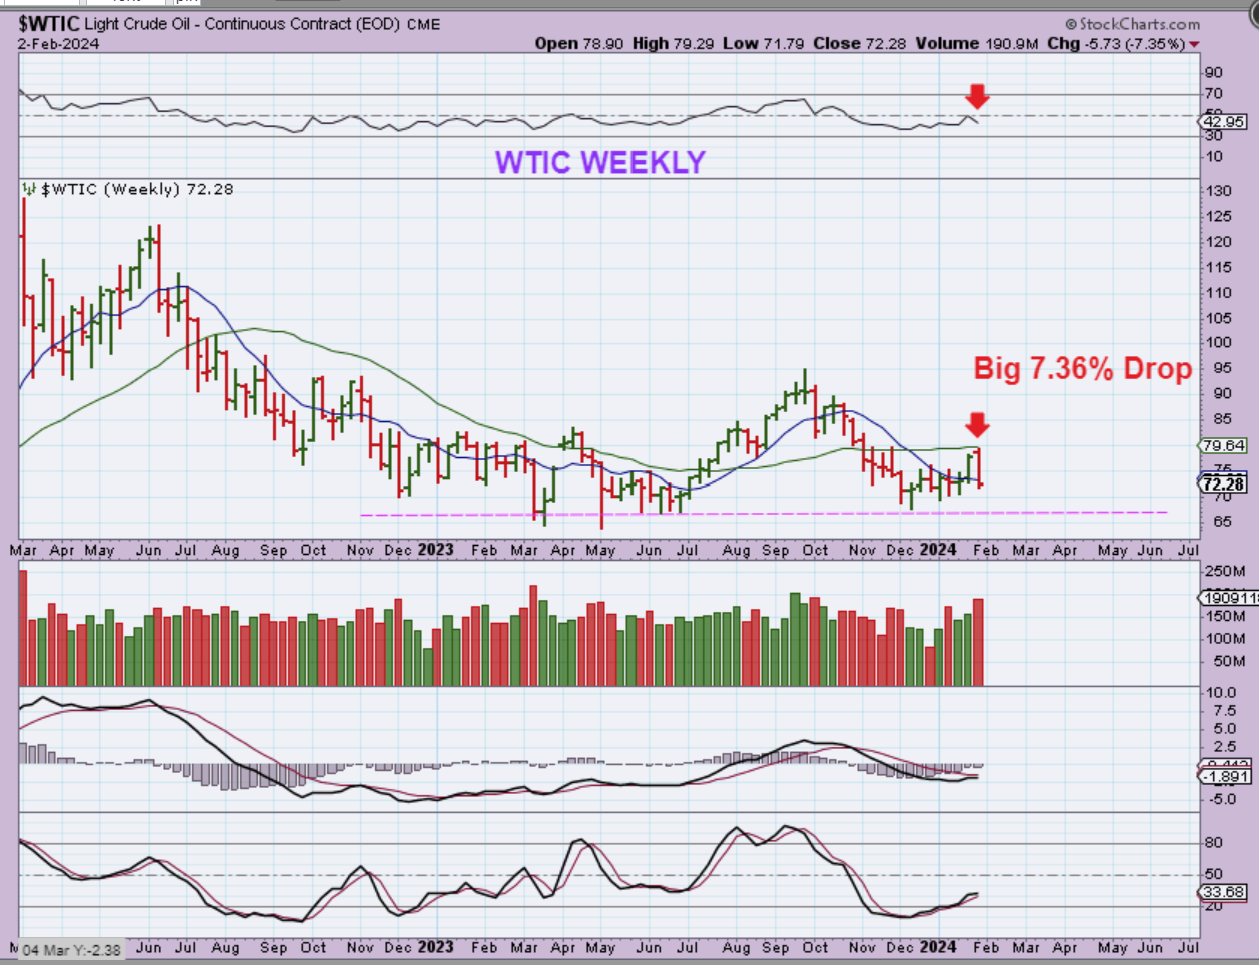
WTIC WEEKLY – Oil lost another $1.54 on Friday day 34, and closed at the lows for the week near $72. This first daily cycle may do a complete round trip, where it rallies out of the lows and then back tests them for the next dcl too. That is very frustrating, but that is how Oil has been lately. You can see that here with the choppiness at the $65-$70 area all throughout early 2023.
,
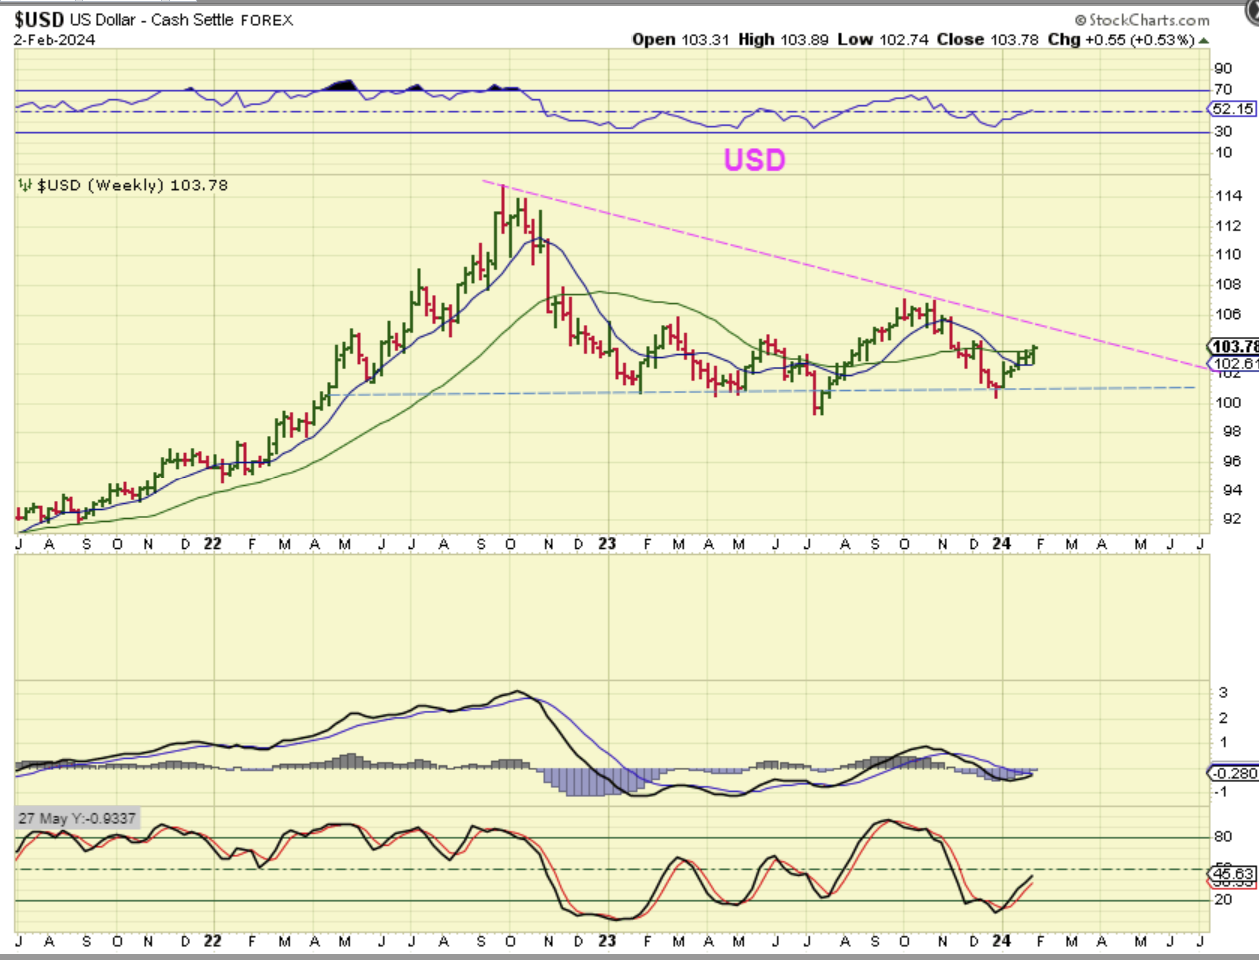
USD WEEKLY – The USD dropped and then closed higher this week. I have been saying that I think it can run to the upper trend line near $105, as Gold dips into an ICL. With that idea, I will mention that Gold has been holding up well…
,
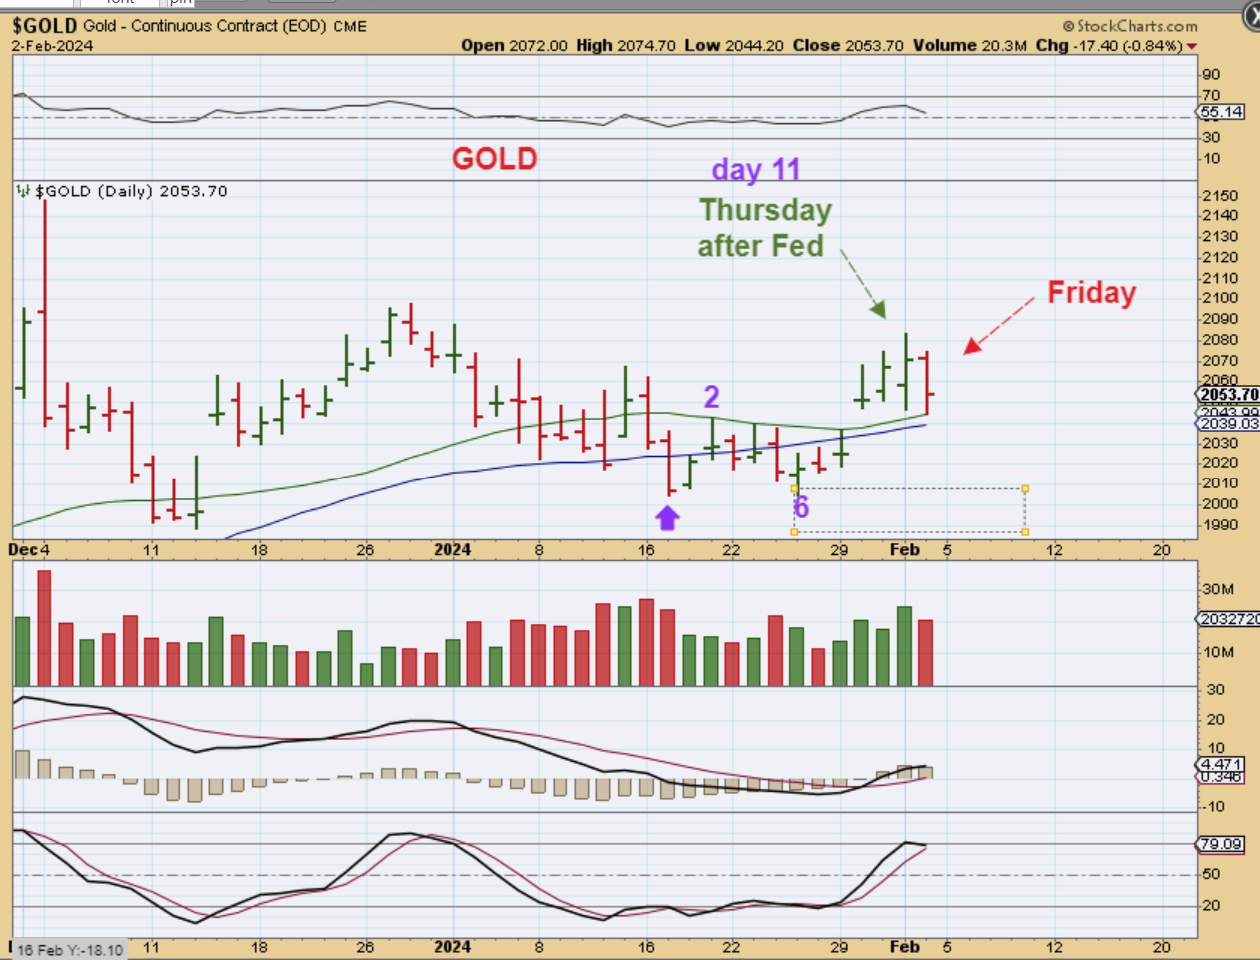
GOLD DAILY– I just wanted to show on the daily chart that on Wednesday and Thursday ( FOMC and the next day), Gold liked the rate cut or ‘change in monetary policy’ chatter than Chairman Powell made. Gold surged on Thursday, day 11, the day after the FOMC MTG, but then on Friday Gold sold off as the USD surged higher.
,
SAME CHART: So what is Gold indicating to me here on day 12?
1. To me, day 10 & 11 are saying that Rate Cuts or talk of Rate Cuts will send Gold higher later this year, but
2. Right now it is getting late time-wise. We are coming due for a daily cycle ‘peak’ to make it a Left Translated daily cycle, and then a gradual drop into a dcl soon. Gold could become choppy above these moving averages.
.
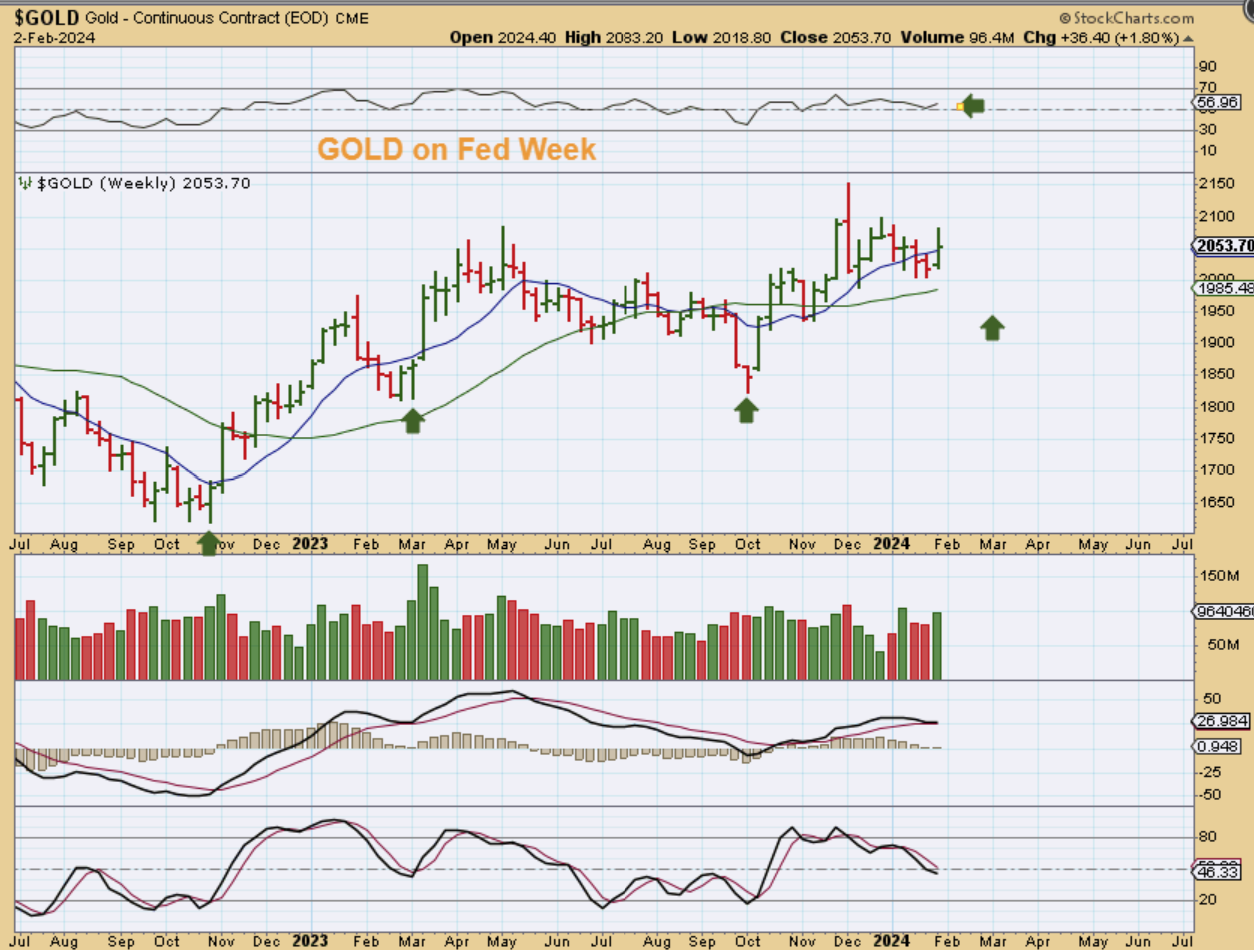
GOLD WEEKLY – So for the ‘Fed Week’, we see that Gold was higher and even though ‘timing-wise’ Gold should be getting heavier and need to drop lower into the next dcl (possible ICL), this was a good reaction to what the Fed was saying about future monetary policy. We can still view Gold as big picture bullish, but we will see it fall into an ICL over the short term.
,
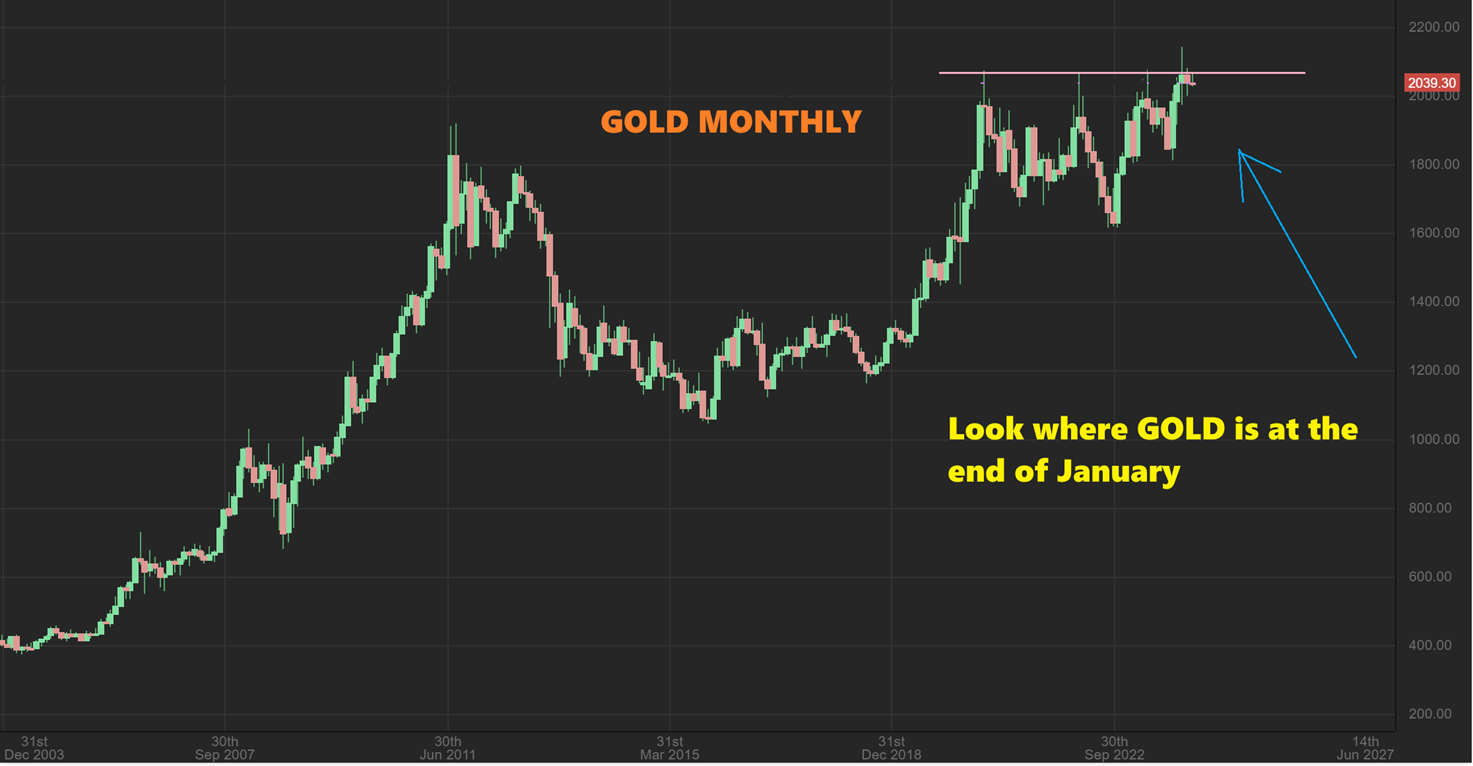
GOLD MONTHLY – I am impressed. Gold remains right up at the highs and even with a dip into an ICL not too far away. We should get a higher low and then a breakout to all-time highs. Some Miners are reflecting this strength in Gold (HMY, IAG, KGC, EGO, etc are doing dine), some are not.
.
In my humble opinion, and despite a lot of choppiness with the miners at times, I think that at the next ICL, Gold should run to new all-time highs and Silver and The Miners should see it and fly too.
.
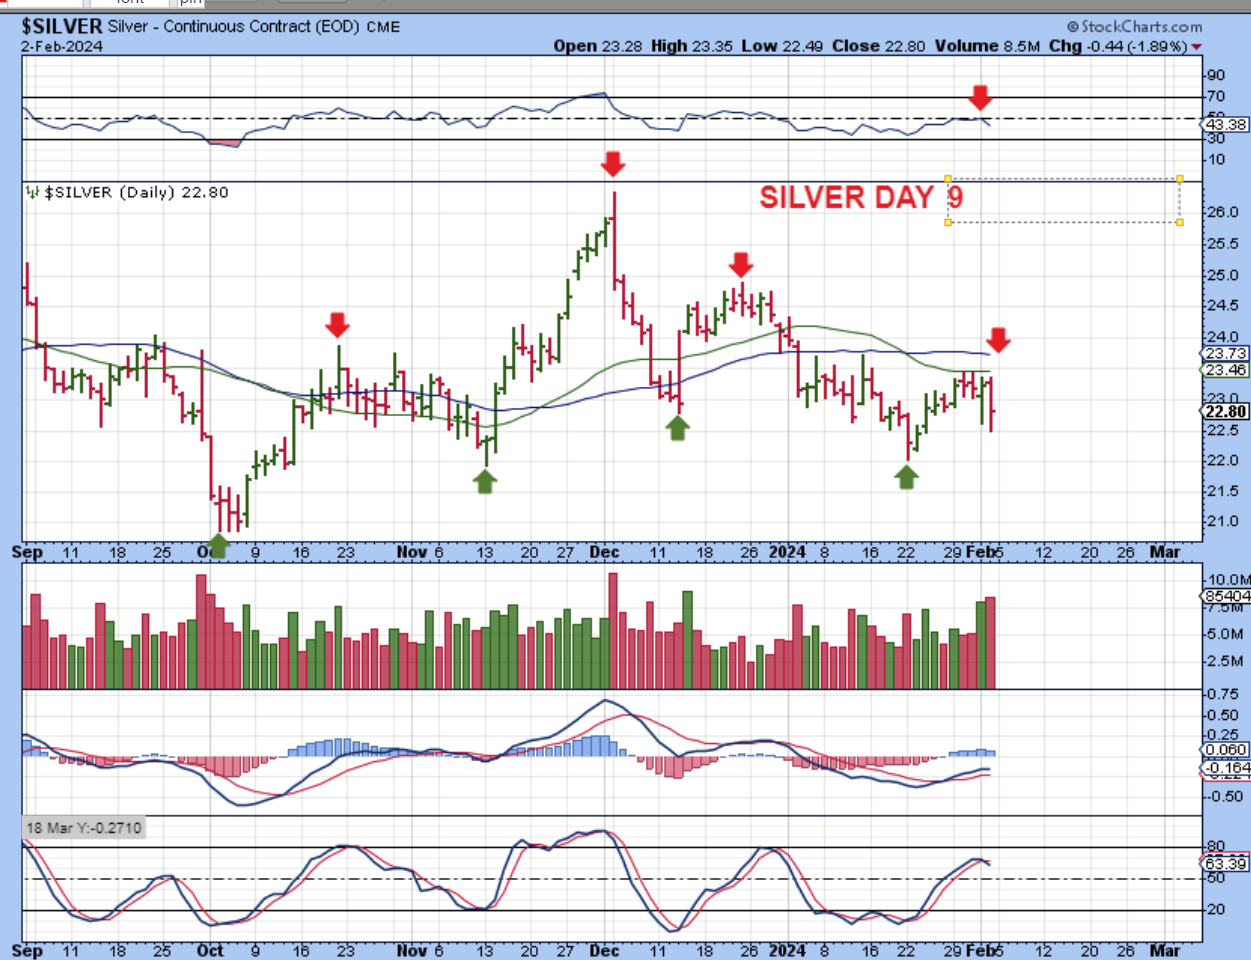
SILVER gave us a bullish looking reversal on Thursday, post Fed, but it lost it on Friday, day 9, when the USD rallied higher. Silver is choppy and should remain that way, and it is unlikely that it will get above the overhead 50 & 200sma.
.
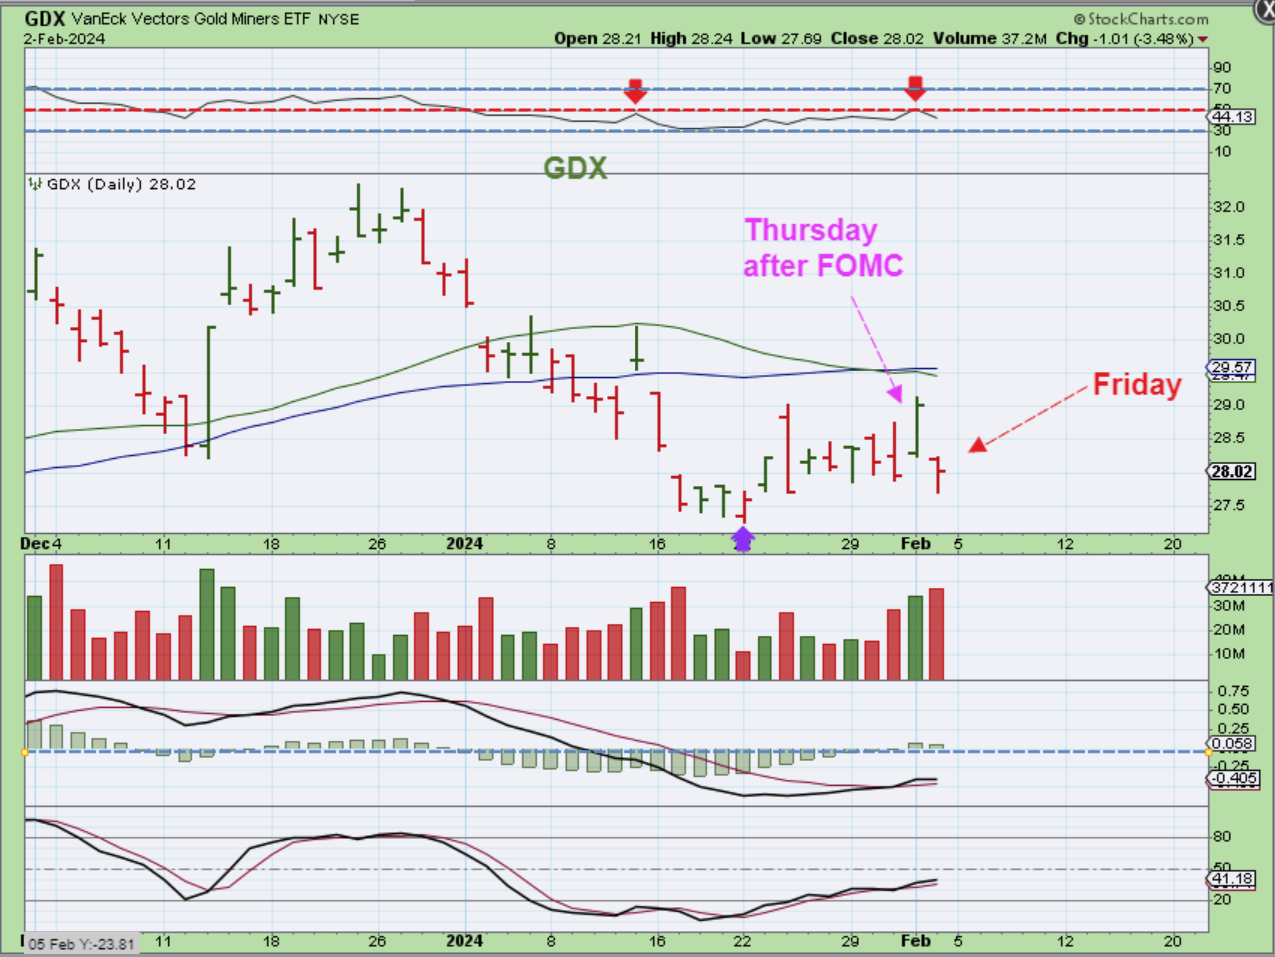
We saw the same reaction with the Miners after the FOMC Meeting. The GDX really ramped up, even gaining 4% on Thursday, but when the USD took off higher on Friday, the Miners gave the gains back. The GDX closed only slightly higher than where it was on Wednesdays close.
.
That is our weekend review on the week of the newest FOMC Meeting. So let me make mention again of 2 things that I saw on the week of the FOMC Meeting that was encouraging to me.
#1. We got nice follow through in the General Markets, and that is because they are only on daily cycle #2. They’re bullishly pushing higher out of a strong first daily cycle (ICL). So the General Markets remain Bullish.
#2. I feel that we also got a glimpse of how the USD & Precious Metals will react when we get closer to the time for actual rate cuts, but since we are already in what looks to be the 4th daily Cycle for Gold, it was too heavy to take off higher right now. Gold will have to drop down into an ICL before it reacts with real sustained strength. The next Fed meeting is on March 19-20, and by then the Fed may really see a significant fall in inflation and do a surprise cut or at least talk very strongly about the need to make those cuts sooner than later in the year. Either of those scenarios could put the ICL in place and send Gold quickly higher. Let me also add an observation #3.
#3. We will get several inflation reports before that March FOMC, so if the reports are Obviously showing a continual drop in inflation, closer to the Fed target rate of 2%, then Gold can bottom BEFORE that FOMC Meeting. The FOMC Meeting could be the catalyst that breaks Gold out to new highs. So I wanted to be clear that I am NOT saying in item #2 that the March 20 Fed meeting is the ICL (though it could be). I am saying that the March meeting should be very interesting when I consider the ‘timing’ for where Gold will be at that time, verses now in the 4th daily cycle. The reaction in March could be very bullish and more sustainable at that time. 🙂
.
Enjoy your weekend and thank you for being here at Chartfreak!
.
~ALEX
.
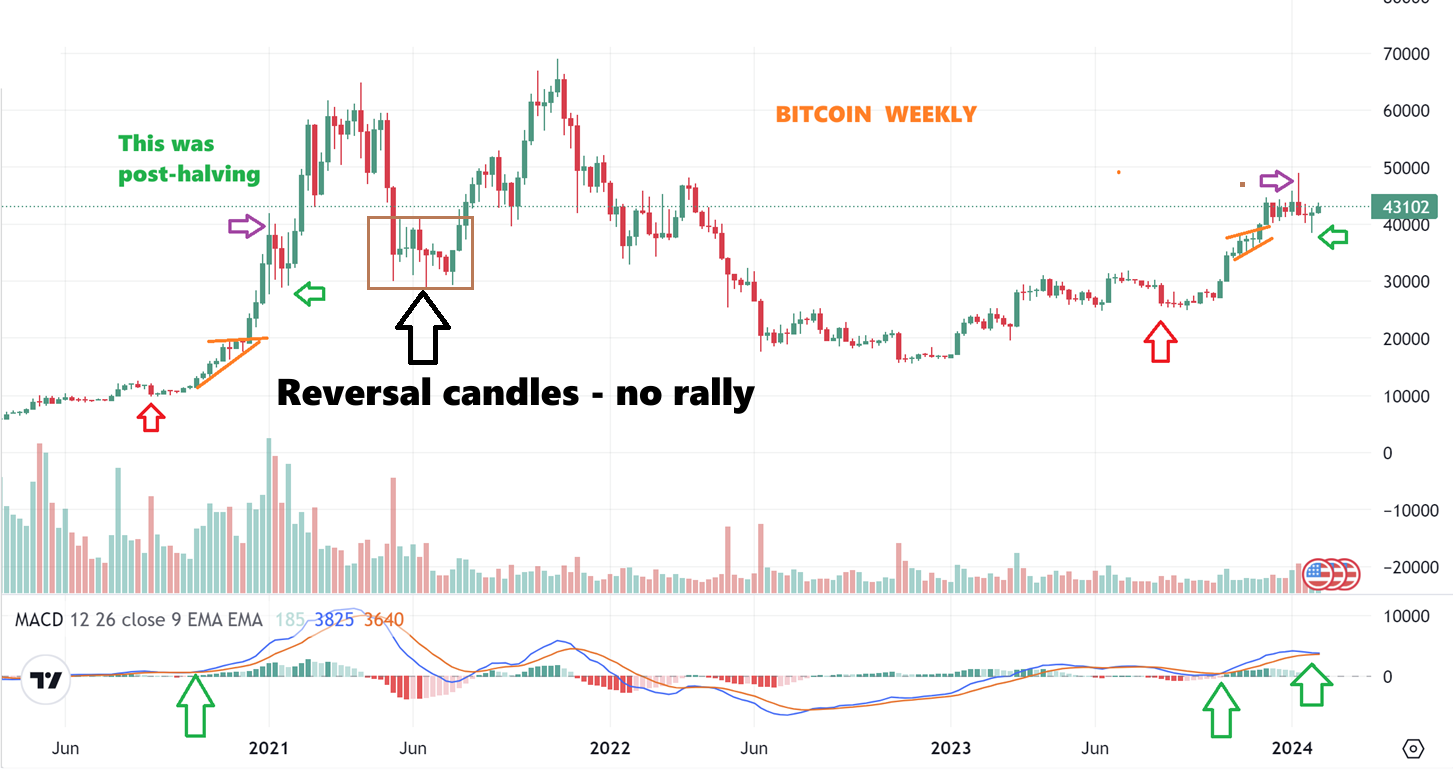
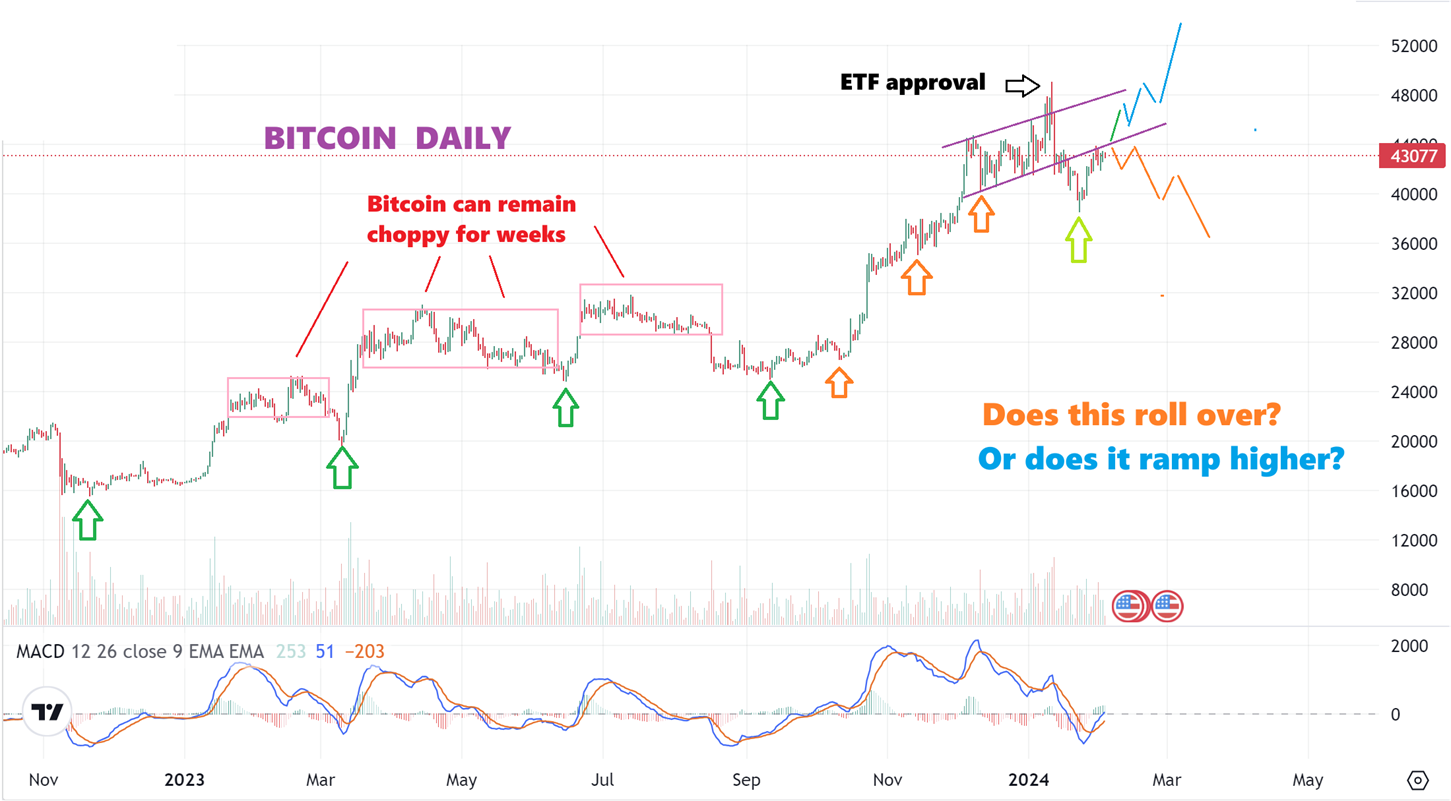
BITCOIN DAILY – I drew in an Orange and a Blue line, because Bitcoin remains quite unclear. As seen on this chart, Bitcoin has been known to chop sideways for many, many weeks too. Last September to December was a gift- a ramp up steadily higher (Orange arrows), and I do expect that again sometime around the time of Bitcoins halving, but what is taking place now is more of that choppiness since the ETF Approval time period. We got a lower low and the uptrend was broken, so will it chop around now(?), or is that a shakeout that allows it to continue higher? Only time will tell, but we are due for an ICL, and that would follow the orange path lower.
.
SAME CHART: We are due for an ICL, and that would follow the orange path lower. I do have to expect a sell off lower into an ICL, but I don’t want to be caught flat footed if Bitcoin just takes off higher due to all of the change that it is experiencing in 2024 with the ETF approval and halving coming up.
So the way I view Bitcoin: I expect lower prices, but those changes could move it higher.
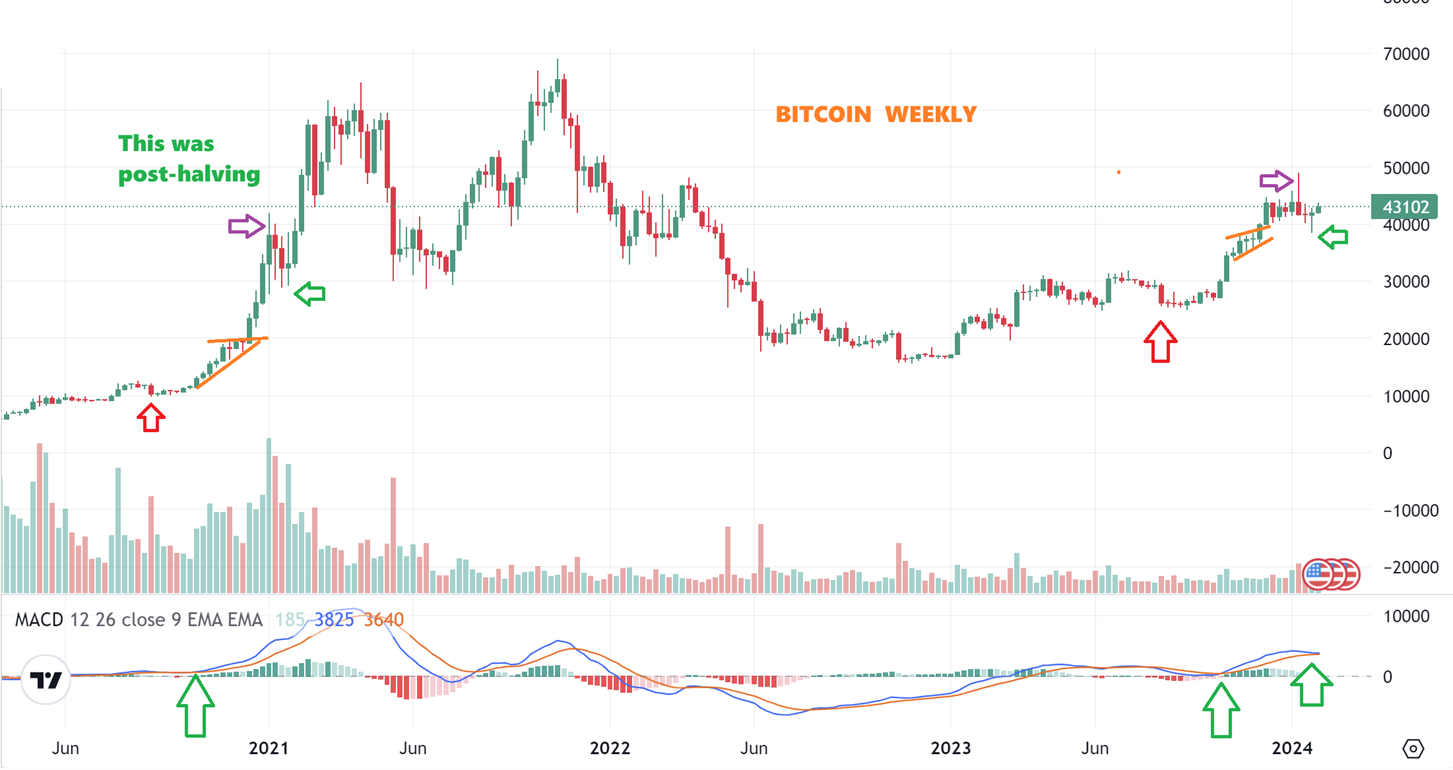
BITCOIN WEEKLY – A slight change:
I was pointing out similarities of the recent ‘ETF Approval’ ramp up with the ‘halving of 2020’ ramp up. They have been very similar, but now we see a slight change. During that ‘halving’ time period Bitcoin had a quick drop for 3 weeks after ‘peaking’ with the purple arrow. Then it took off higher. Right now we have been chopping sideways for about 10 weeks, and that included the ‘peak’ (purple arrow). At this point, the weekly does look like it dipped and put in a weekly reversal candle, but now we just have to see if it will proceed higher or chop around more. This is not an easy read because…
.
This is not an easy read because I have also seen other times when it was trying to put in the lows and it had reversal candles on a weekly basis, but no rally higher followed. That square shows weeks of ‘bottoming’ with reversal candles followed by more sideways chop, so again, this isn’t an easy read as to where we are right now. BIG PICTURE though, I expect Bitcoin to rally MUCH higher sometime in 2024.