January 20 Weekend Report
.
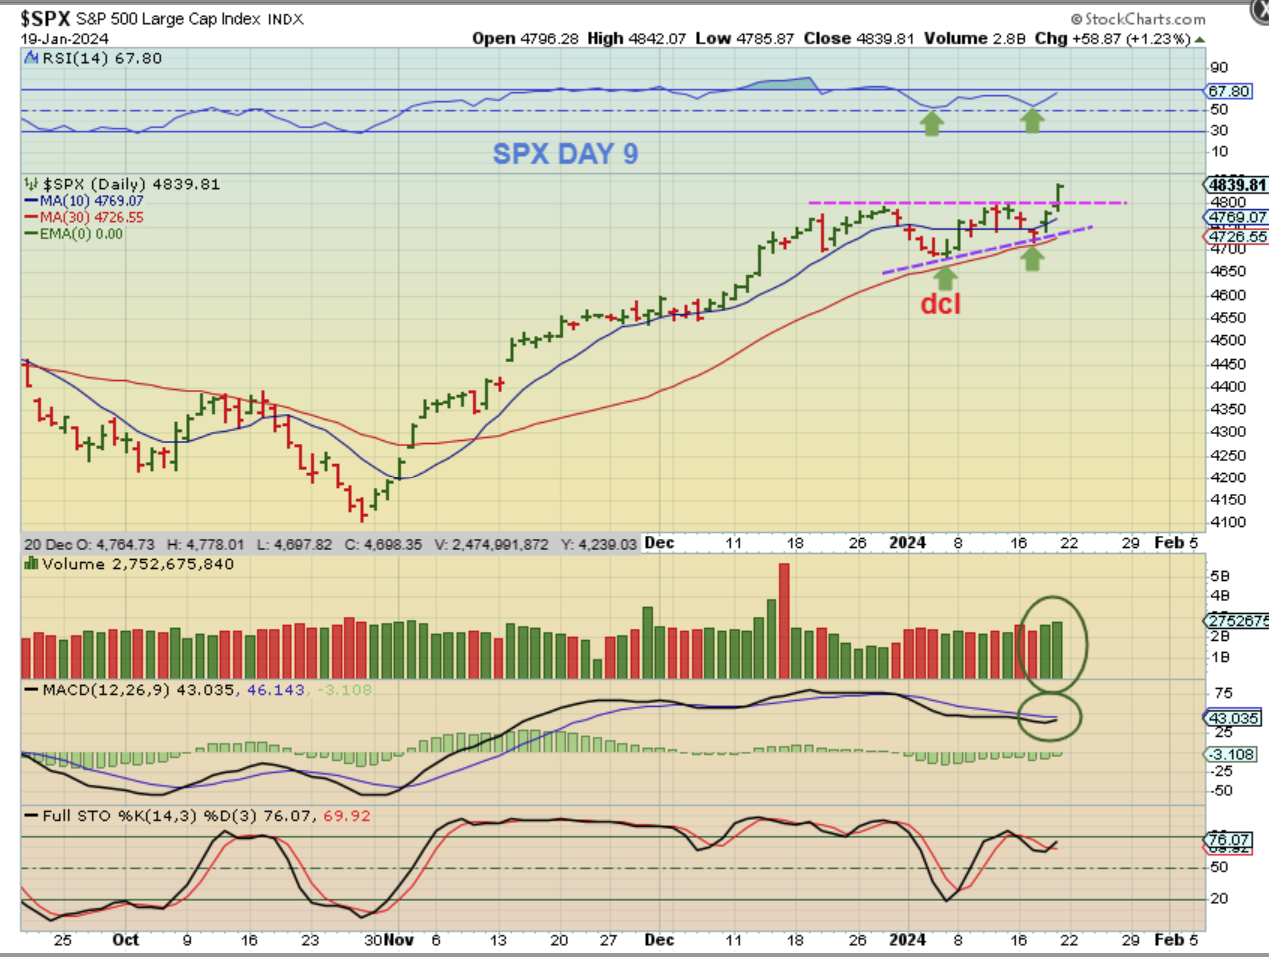
SPX DAILY – The DCL is a buy & hold, but the recent choppiness raised a few questions:
Would we breakout and do a continuation run(?), or would the current choppiness become a long sideways consolidation for the 2nd daily cycle?
Well, Fridays break higher looks to be a very bullish answer to that question. This looks like a breakout from the recent consolidation on day 9 of 40+. In technical analysis …
.
In technical analysis this is a bullish flat-topped wedge and it should run higher over time.
.
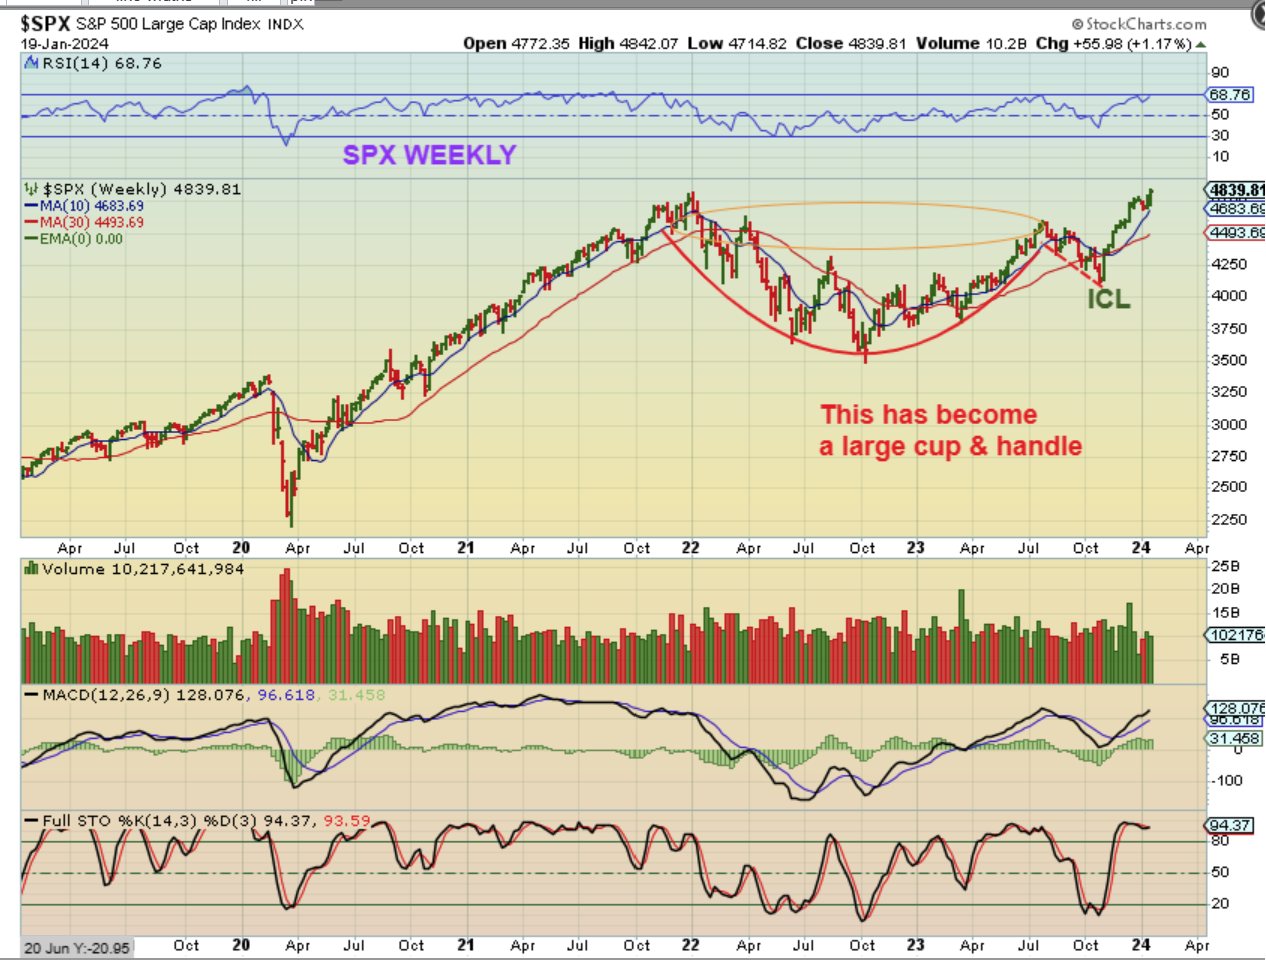
SPX WEEKLY – The SPX has bullishly broken out to new all-time highs on Friday. I drew blue lines to show what we could see if this is now in an A-B-C up move. The next move could match the first move out of the ICL.
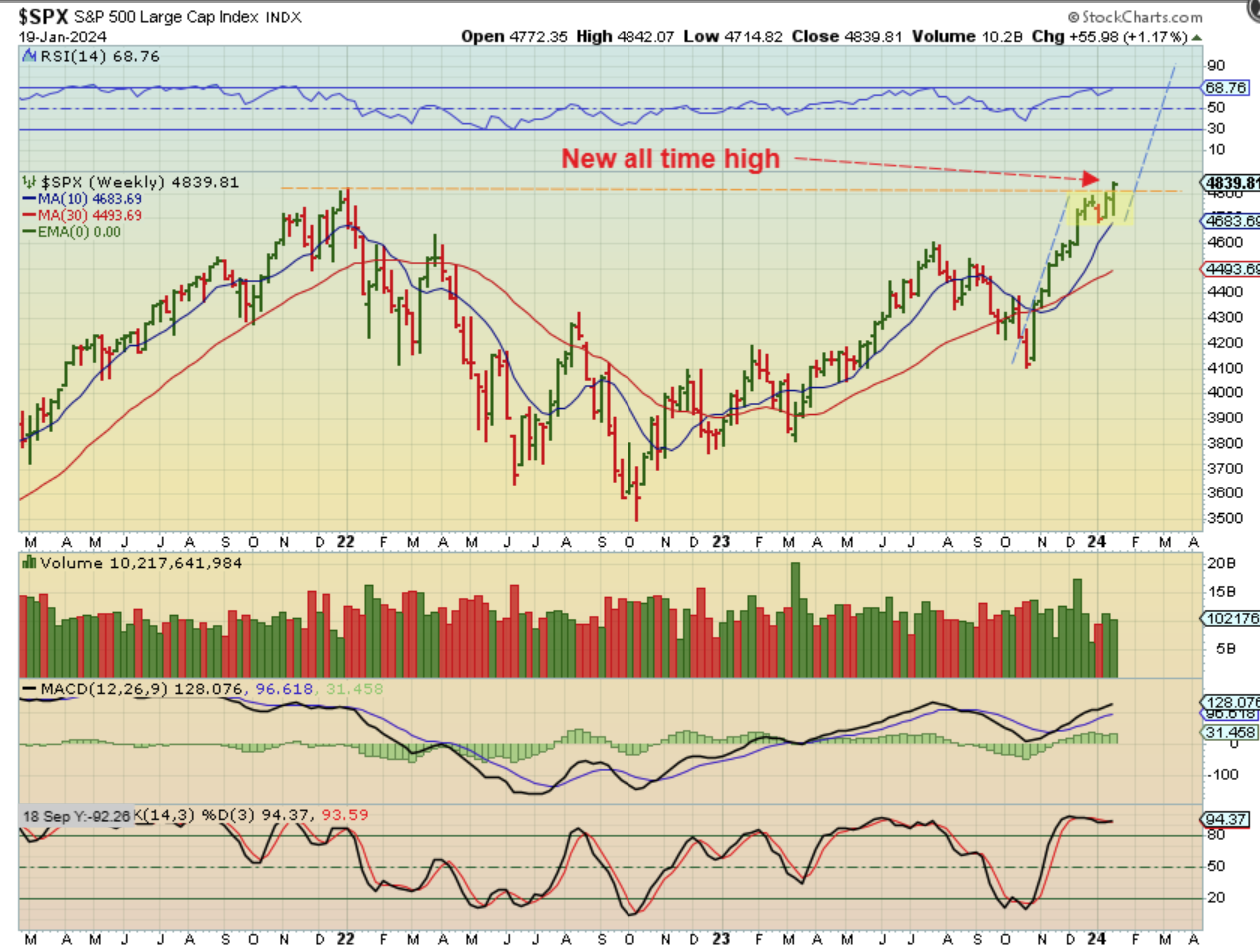
SPX WEEKLY – And the bigger picture looks like a very nice Cup & Handle Pattern.
NASDAQ WEEKLY – The NASDAQ did NOT break out to new all time highs yet, but This set up is bullish and it should break the highs soon enough.

.
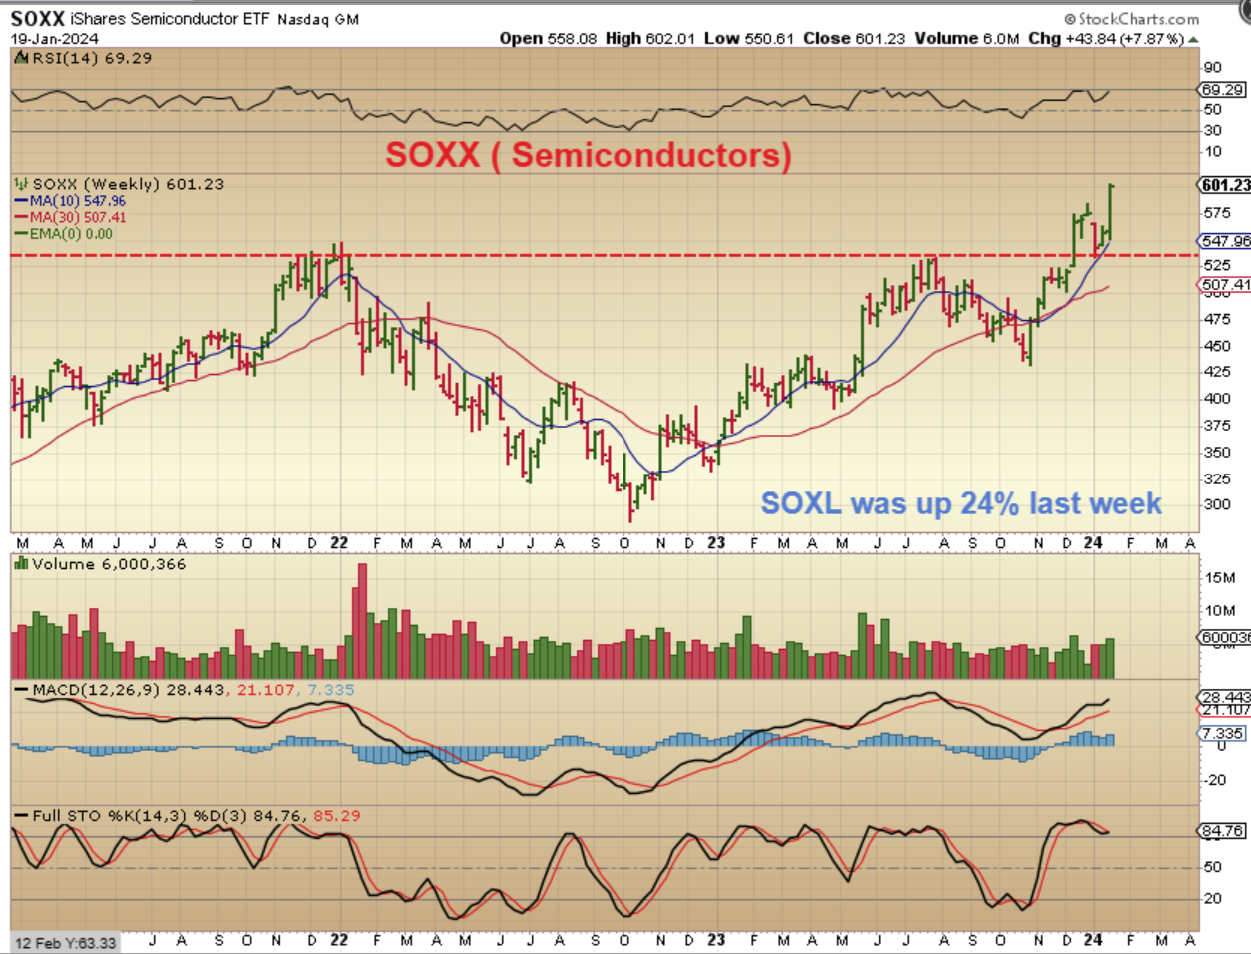
SOXX WEEKLY – With the SOXX almost up 8% last week, SOXL (3X leverage) was up about 24%. For the SOXX, this was a weekly breakout, back test, and now continuation. I have been pointing out NVDA, AMD, MU, etc. as Semiconductor stocks that are acting bullishly too. Let me just point something out…
.
Let me just point something out…
.
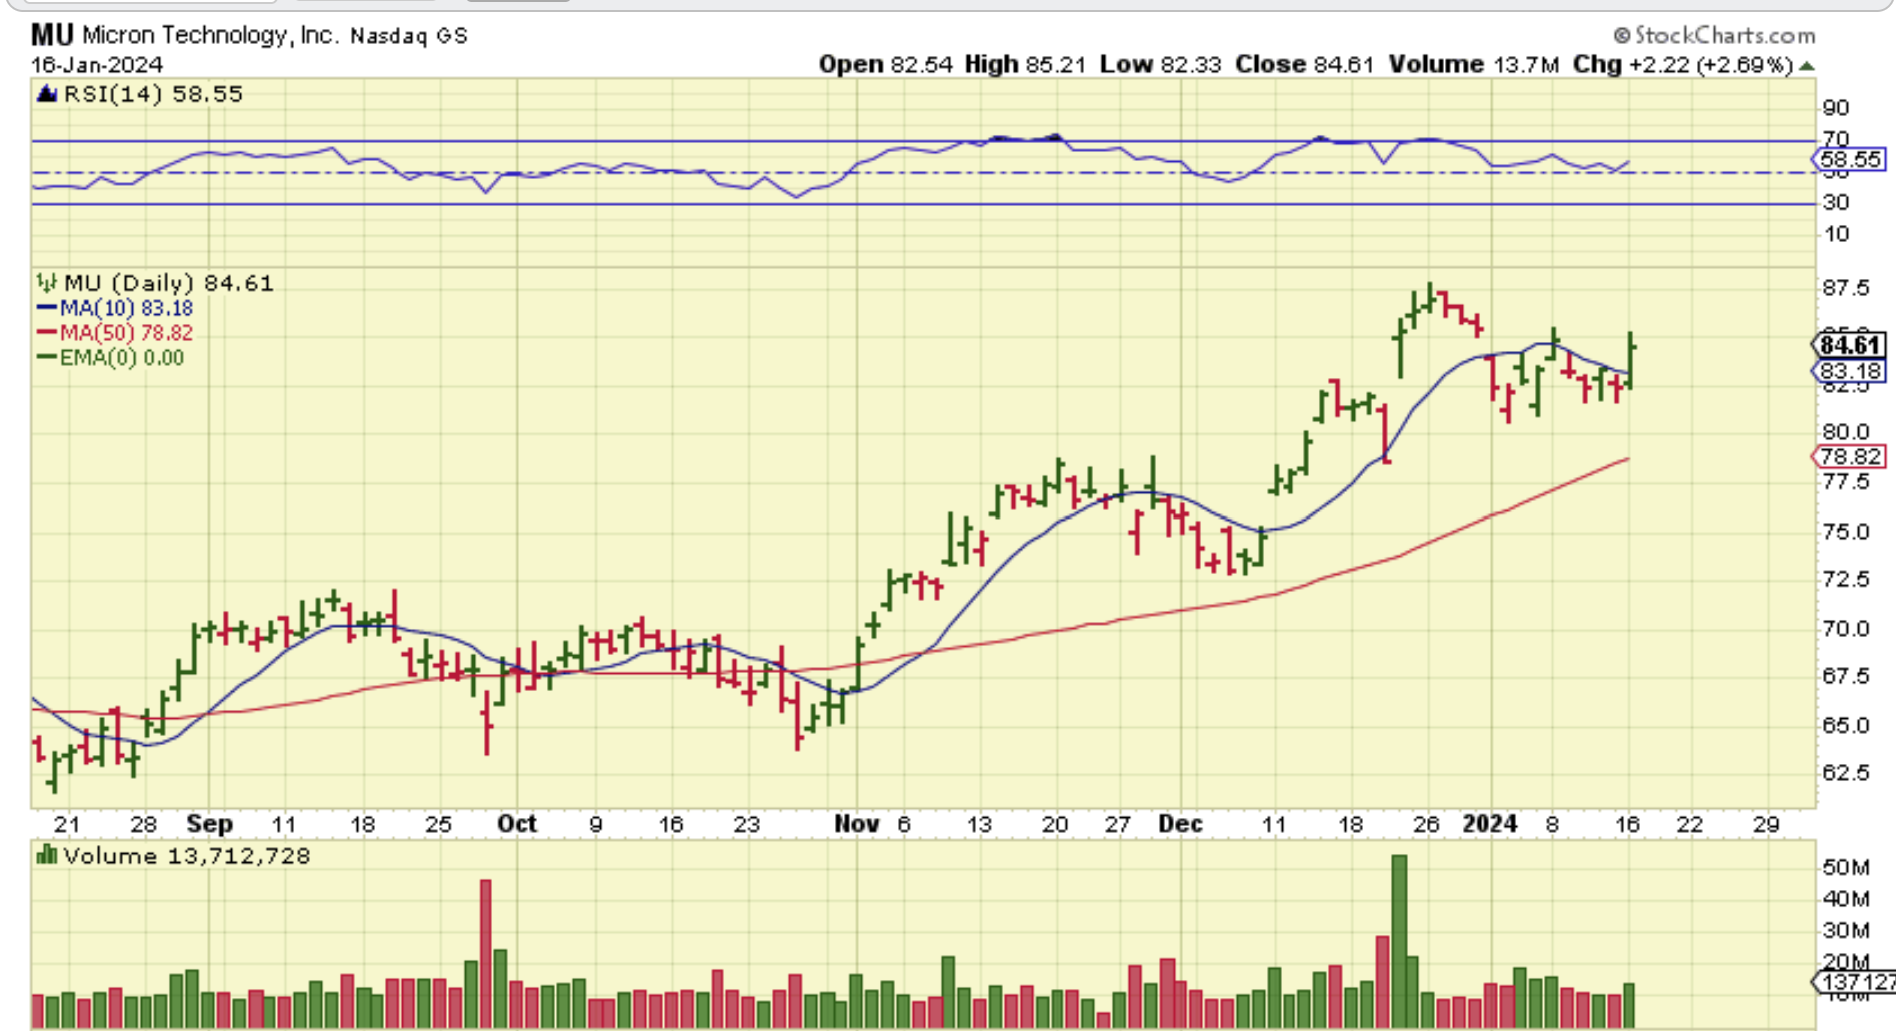
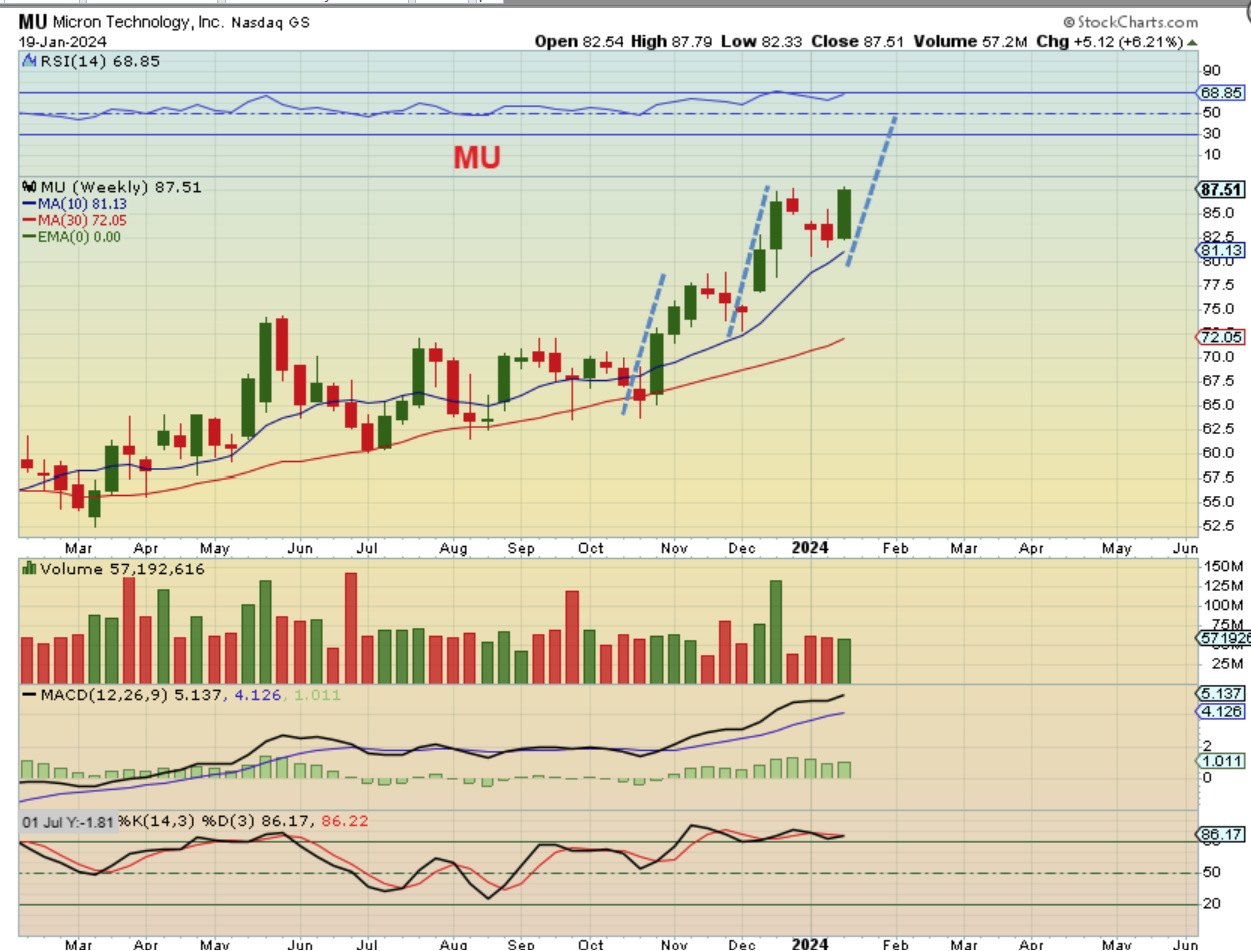
On Jan 16 I mentioned that MU was a lagger that looked bullish, but by the end of the week it made it up to the December Highs. So what? Well…
.
MU moved up to the highs and looks ready to continue higher, but possibly even better than this is…
.
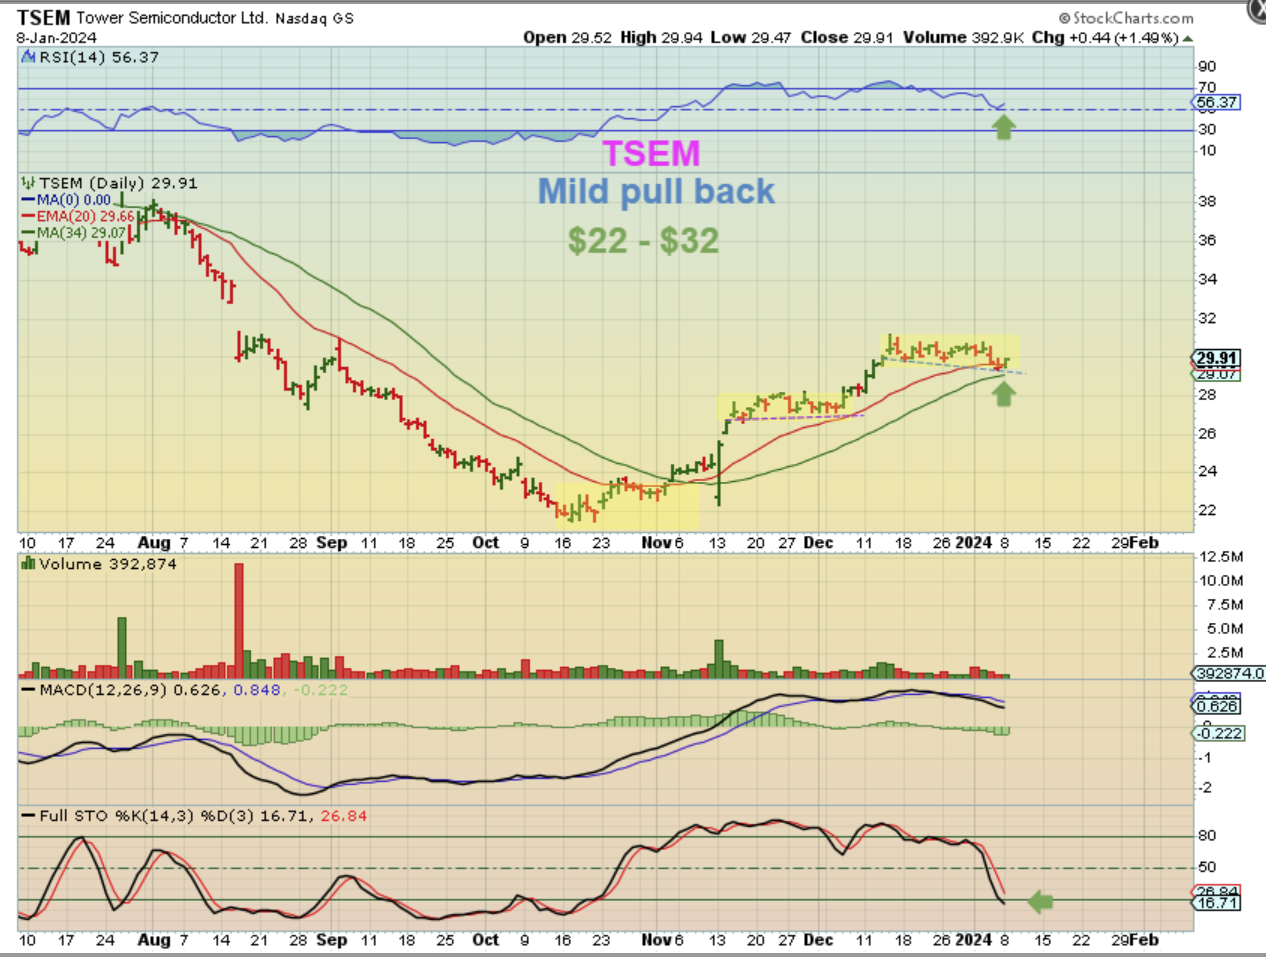
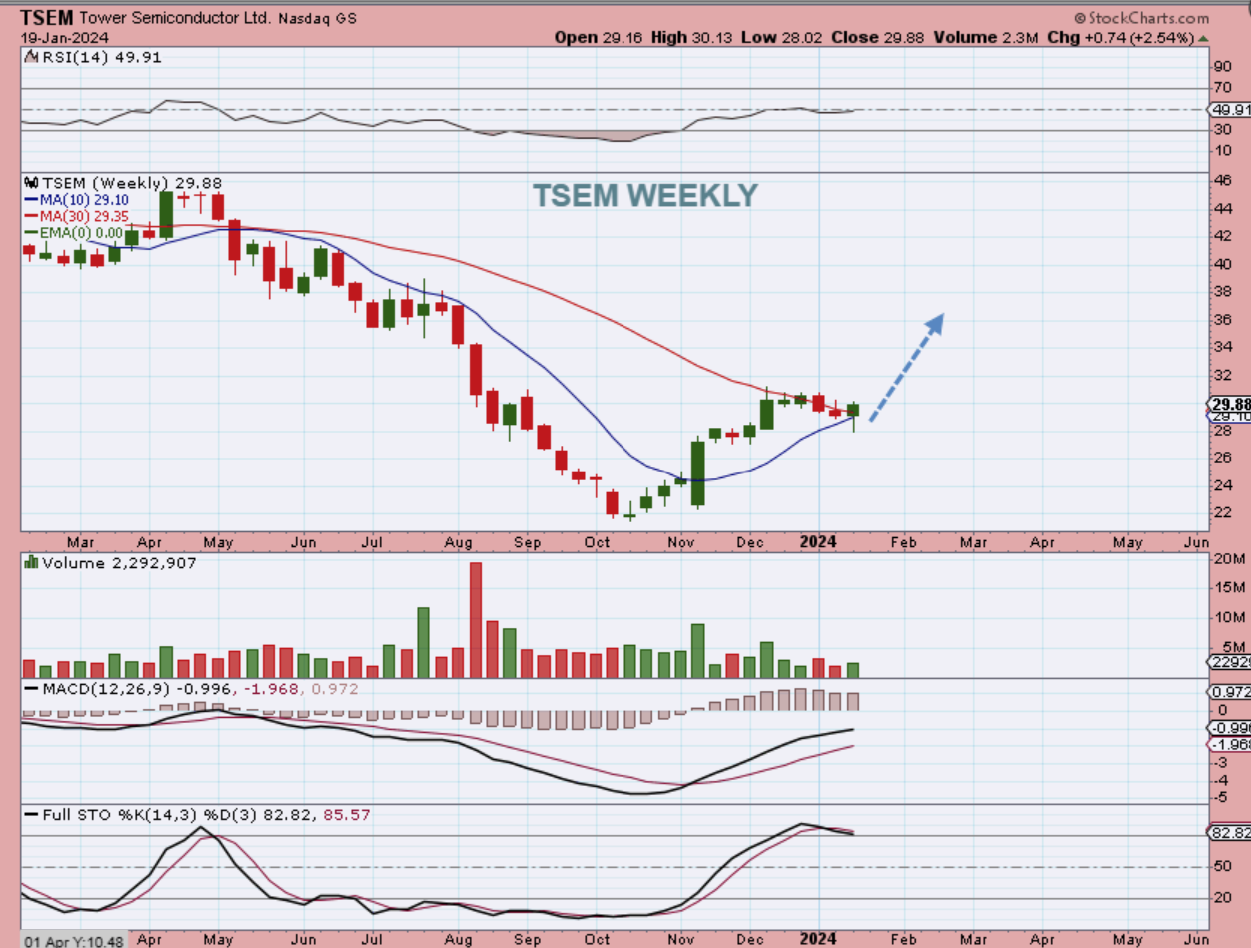
I Pointed out TSEM as a BUY on January 8th, because Semis looked good. It had been chopping sideways to support, but lagging the upside. So what happened?…
.
TSEM is the real lagger now. It was up 2.5% for the week, but I see a reversal candle at support here, so this may start to play catch up. The reversal is a weekly buy signal in a bullish sector to me, with a stop.
.
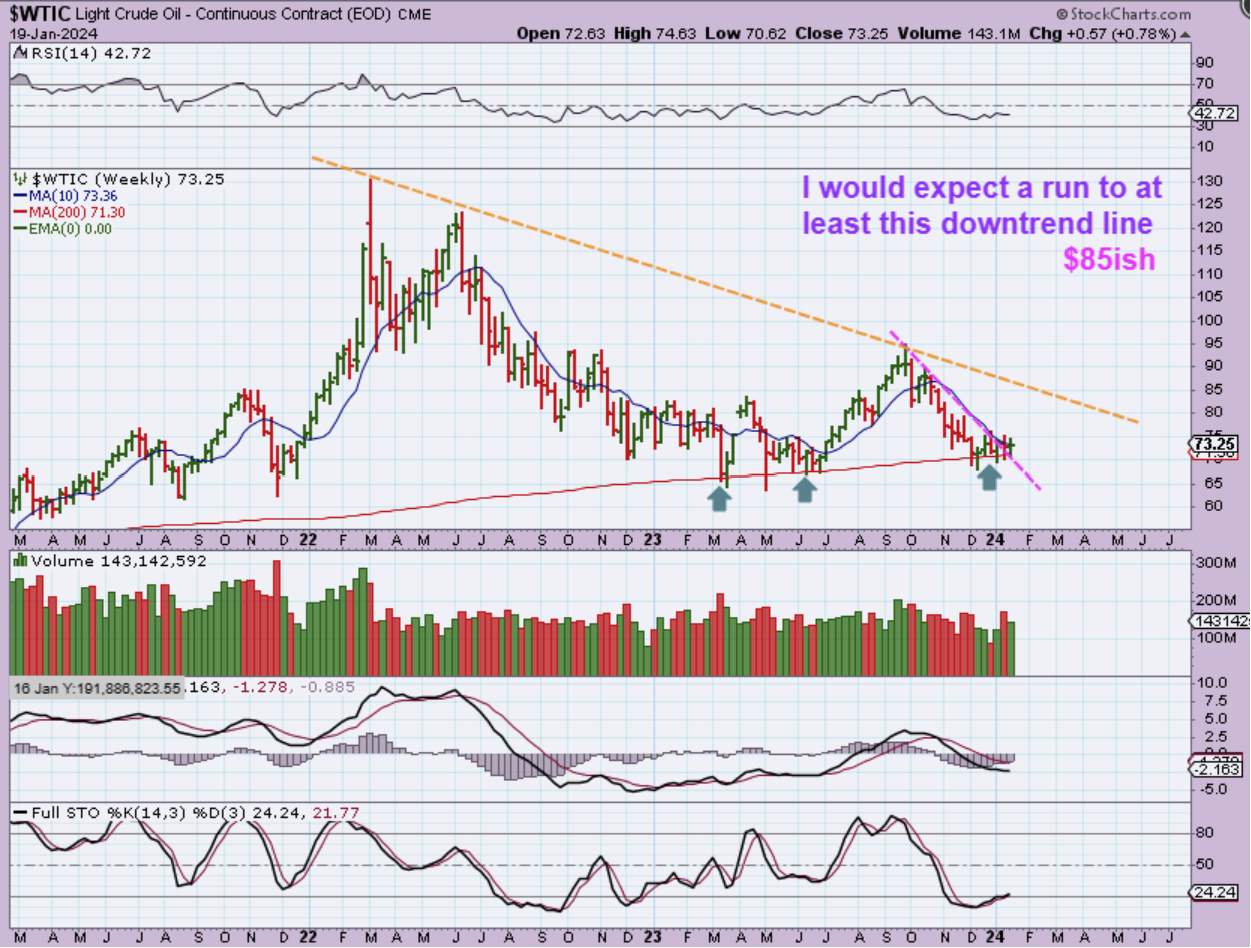
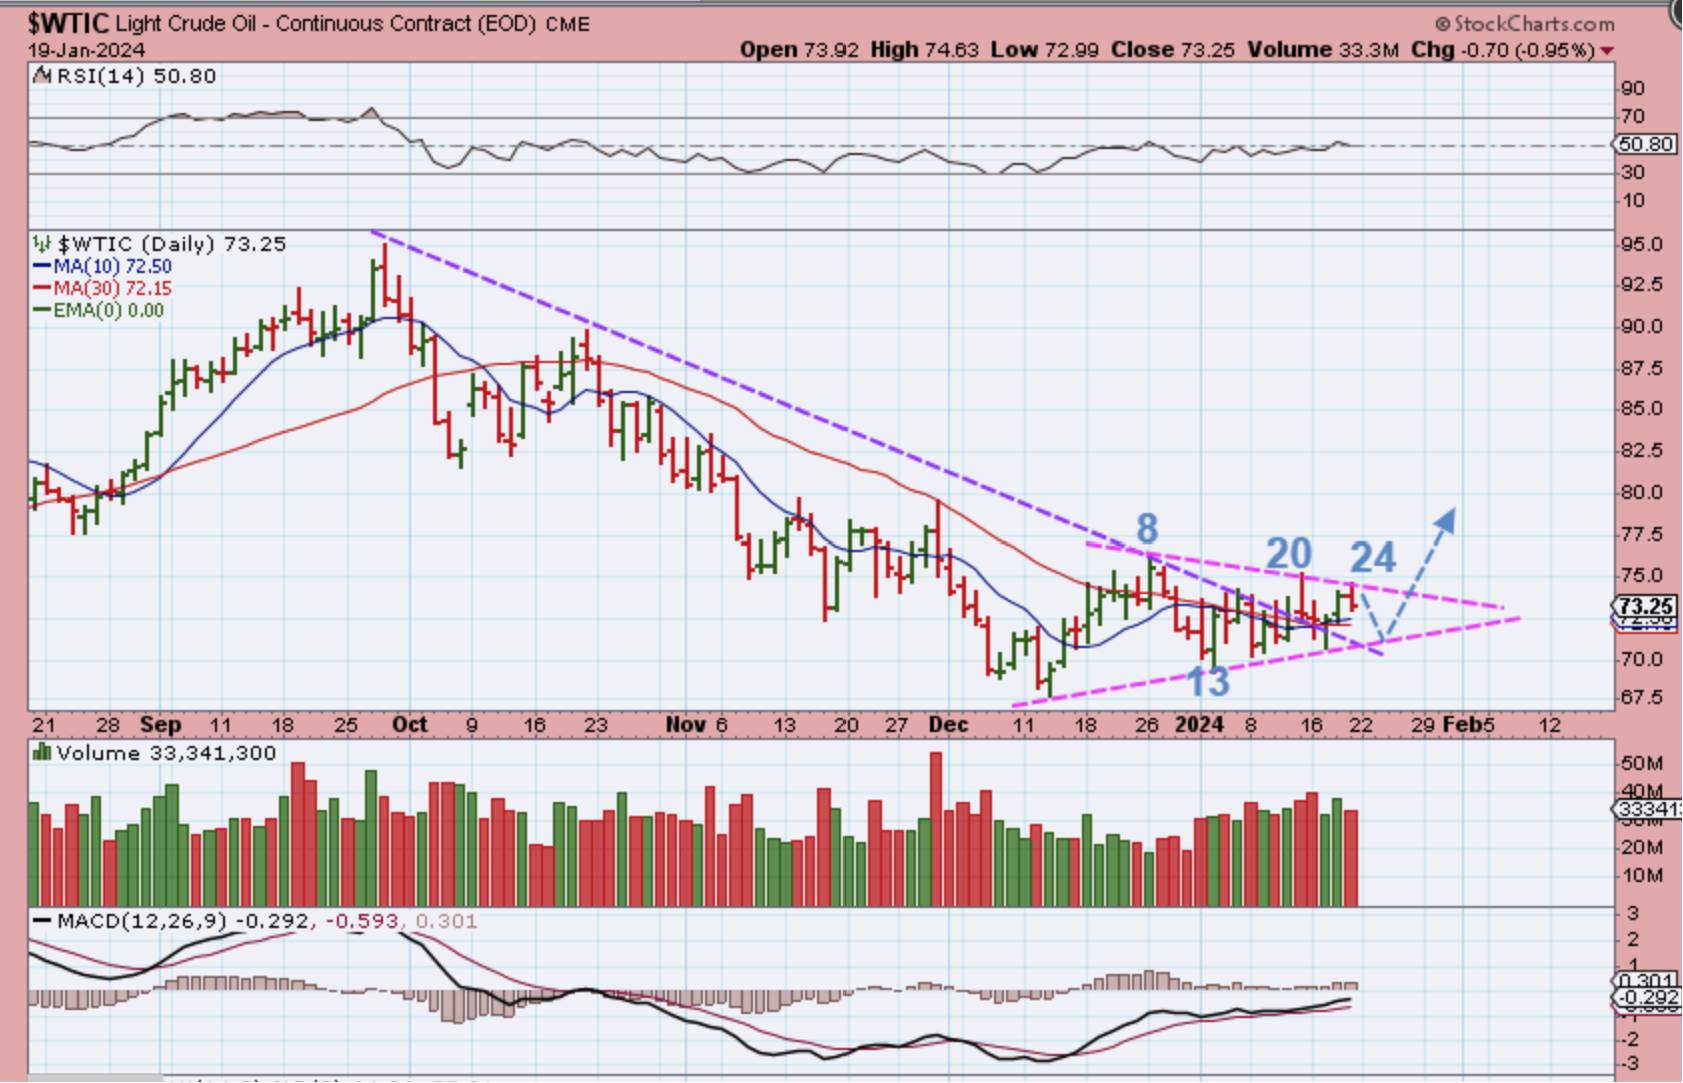
WTIC WEEKLY – Oil has been chopping along the lows and it has been very difficult. I feel that we have an ICL, but no upside move yet in the first daily cycle. We should still get a break higher, and I would expect a run to at least the upper trend line.
.
Oils daily chart is on day 24 of maybe 50+, so this has plenty of time to dip lower and still break out and run. What about Oil stocks?
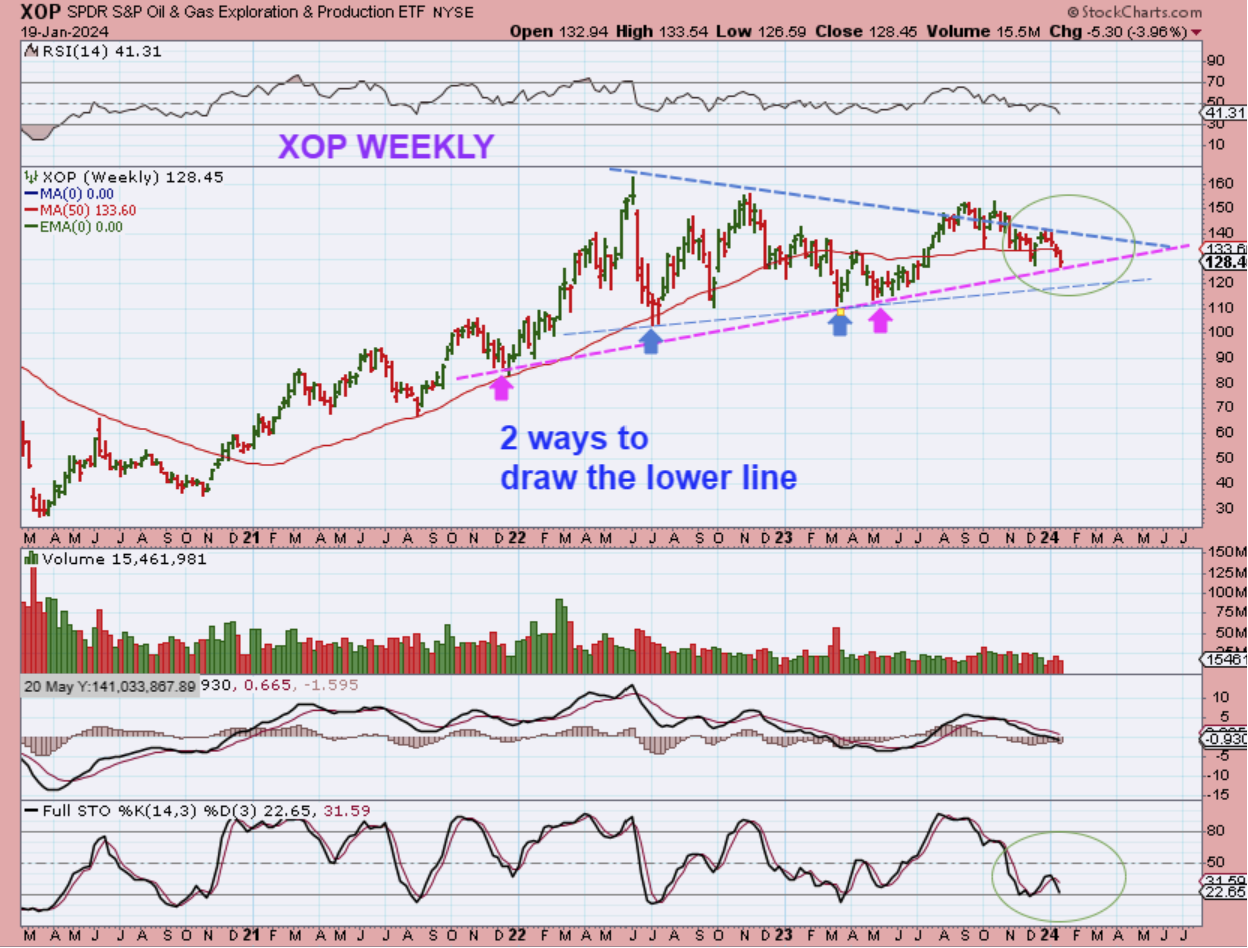
XOP WEEKLY – I still see these chopping sideways in a long, large triangular consolidation. The lower trend line is tricky though, so I drew one in magenta (the drop would be finished), and one in blue. The blue one allows more downside, so it probably depends on what Oil does over the next week. The XOP trade would be GUSH for many that like leverage. We also have APA, NOG, WTI, ERF, VET, VLO, MRO, etc.
,
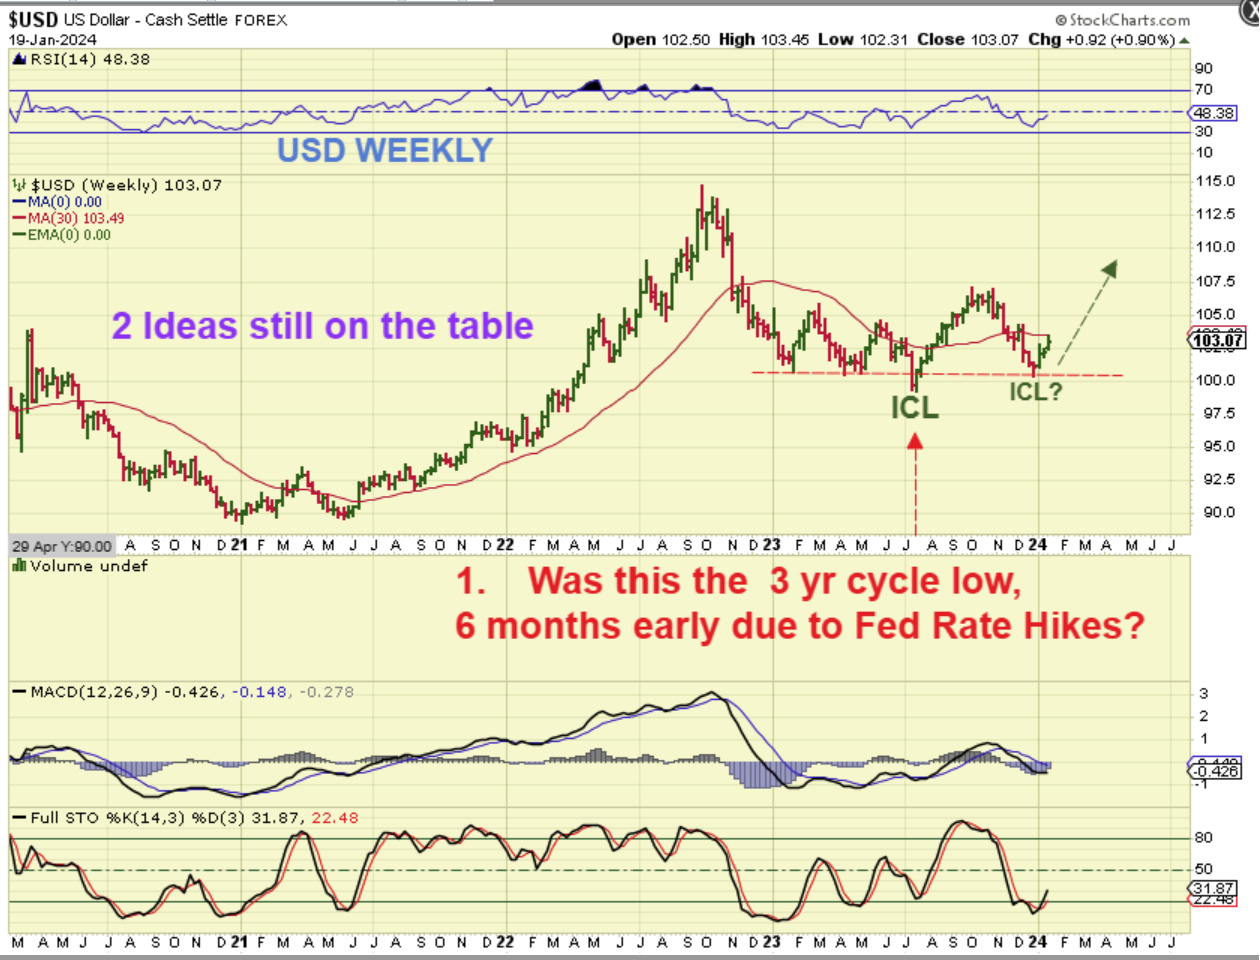
I still have 2 ideas with the USD, pertaining to that 3 year cycle low:
.
#1 USD WEEKLY – I have been wondering: Did we get a 3 yr cycle low 6 months early, due to the Fed Rate Hikes speeding things up? That is a possibility, especially with a possible higher low ICL, see the chart. Recently I got to thinking about that and came up with the next idea that also makes a lot of sense to me…
,
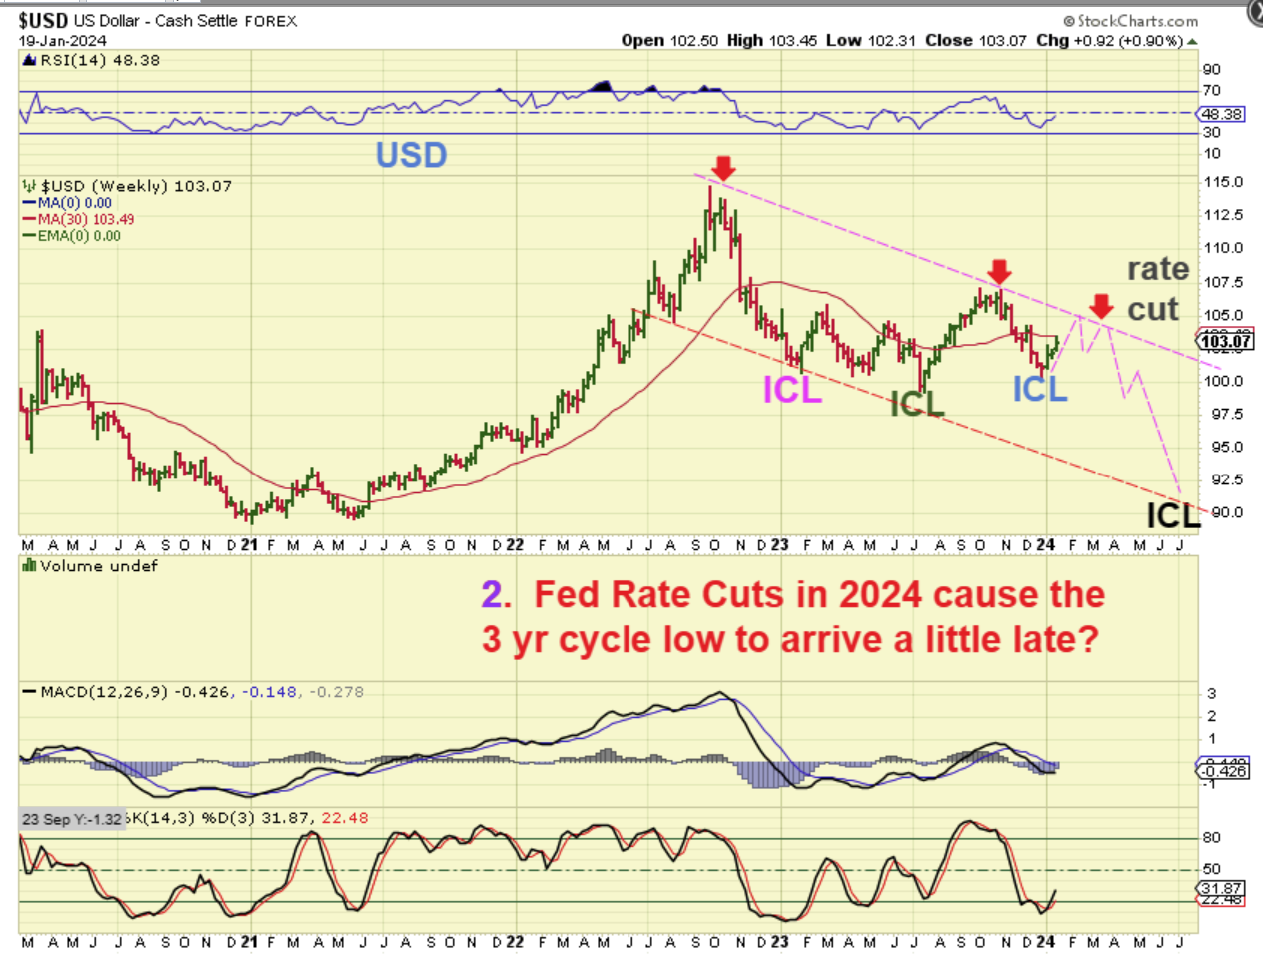
USD WEEKLY #2 -The Fed Rate Hikes caused a ‘blip’ in the set up.
1. Notice the rally in July – November, and then a higher ICL. That could be due to rapid rate hikes.
2. I do know that there is a likelihood of rate cuts next year, and those rate cuts could cause the final leg down into that ‘3 yr cycle low’, now a little later than I expected. This is very possible and would cause Gold to breakout to new all-time highs. See the chart. I think that this is very possible with rate cuts coming.
.
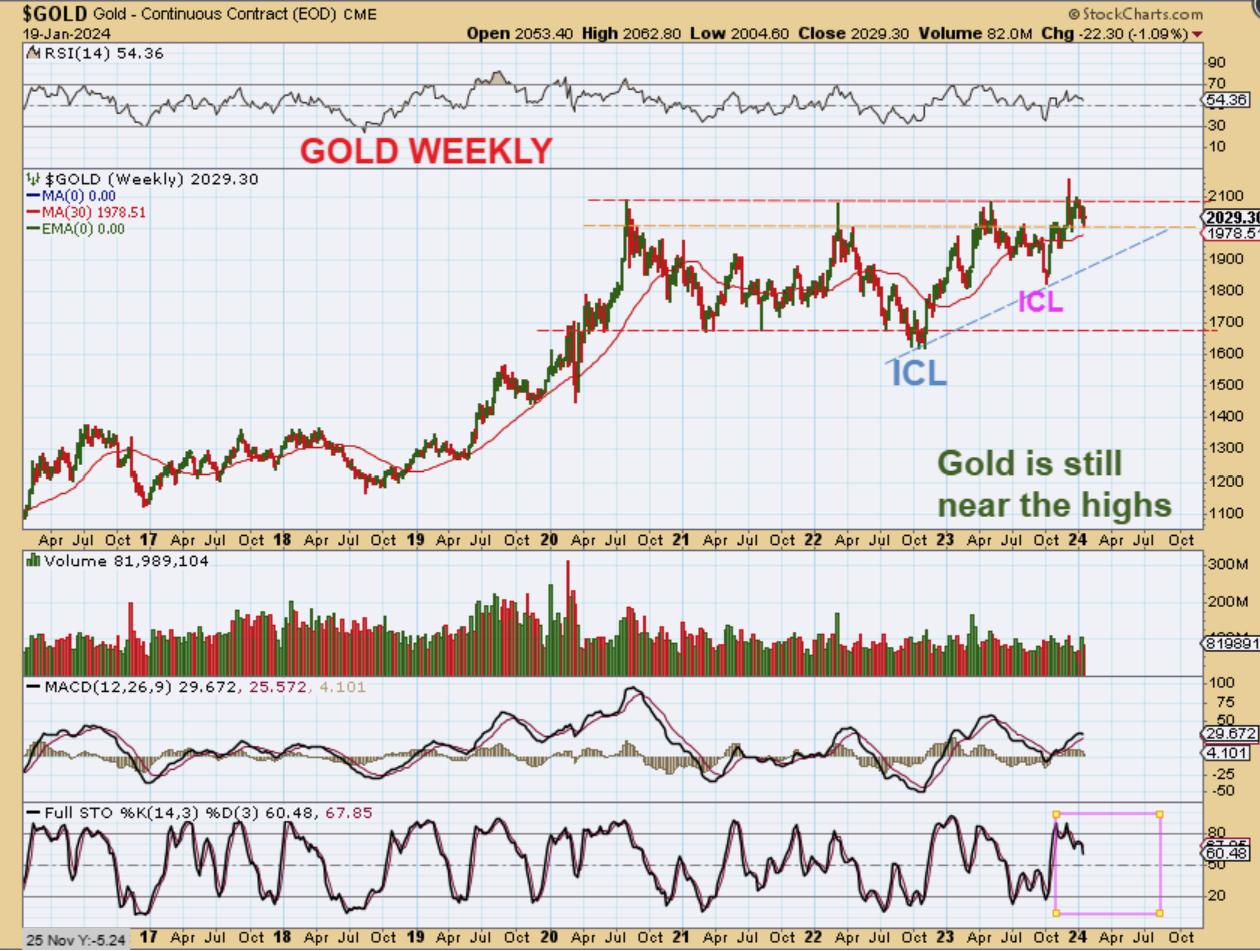
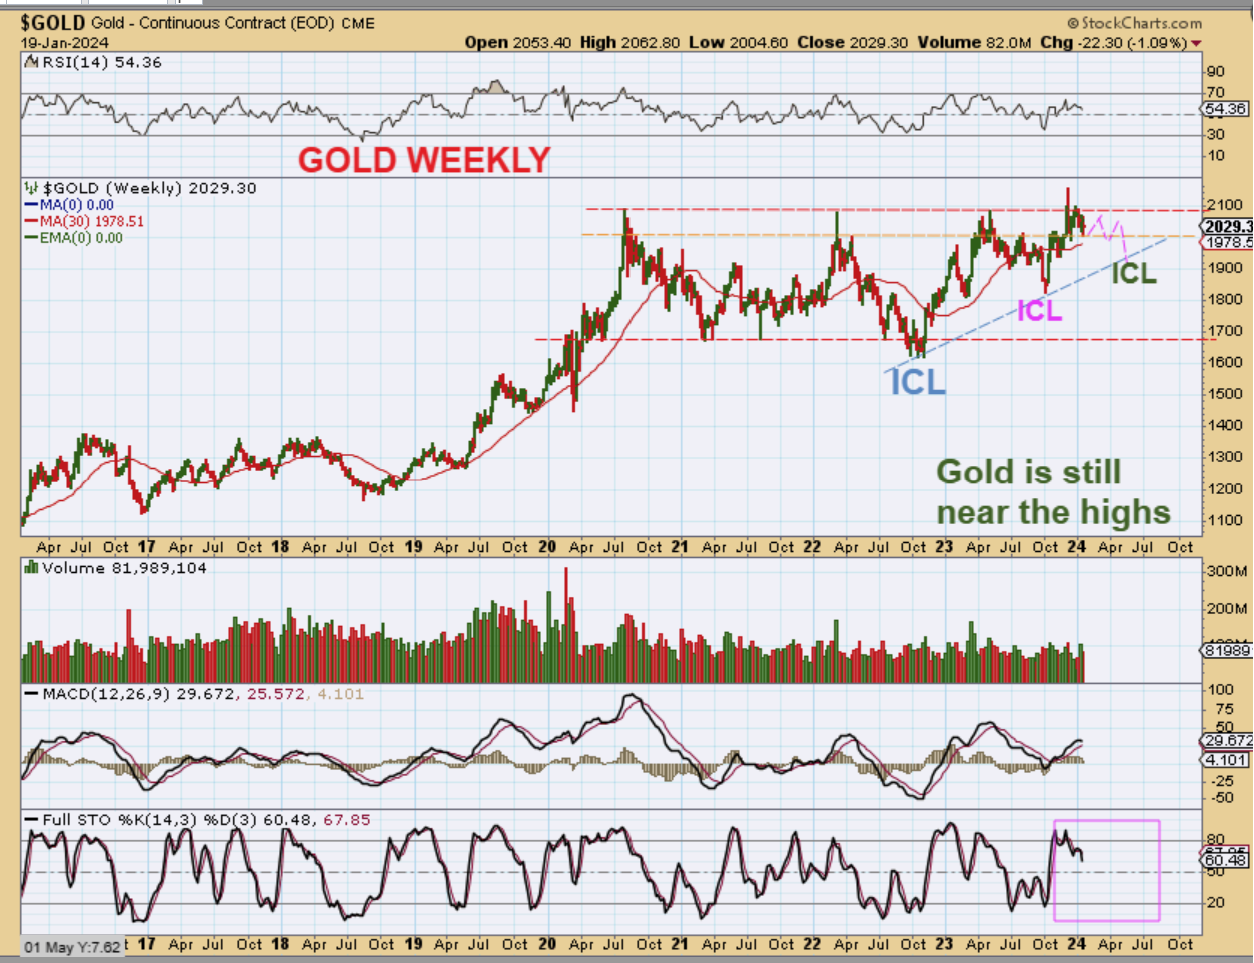
GOLD WEEKLY – Gold has been holding up near the highs, but a dip lower is expected if the USD pushes a little higher like the chart above pointed out. Gold would then…
.
GOLD would then drop down into an ICL, but it doesn’t need to be a devastating drop into an ICL. Notice that the last one wasn’t, it was a choppy daily cycle with a spike down.
.
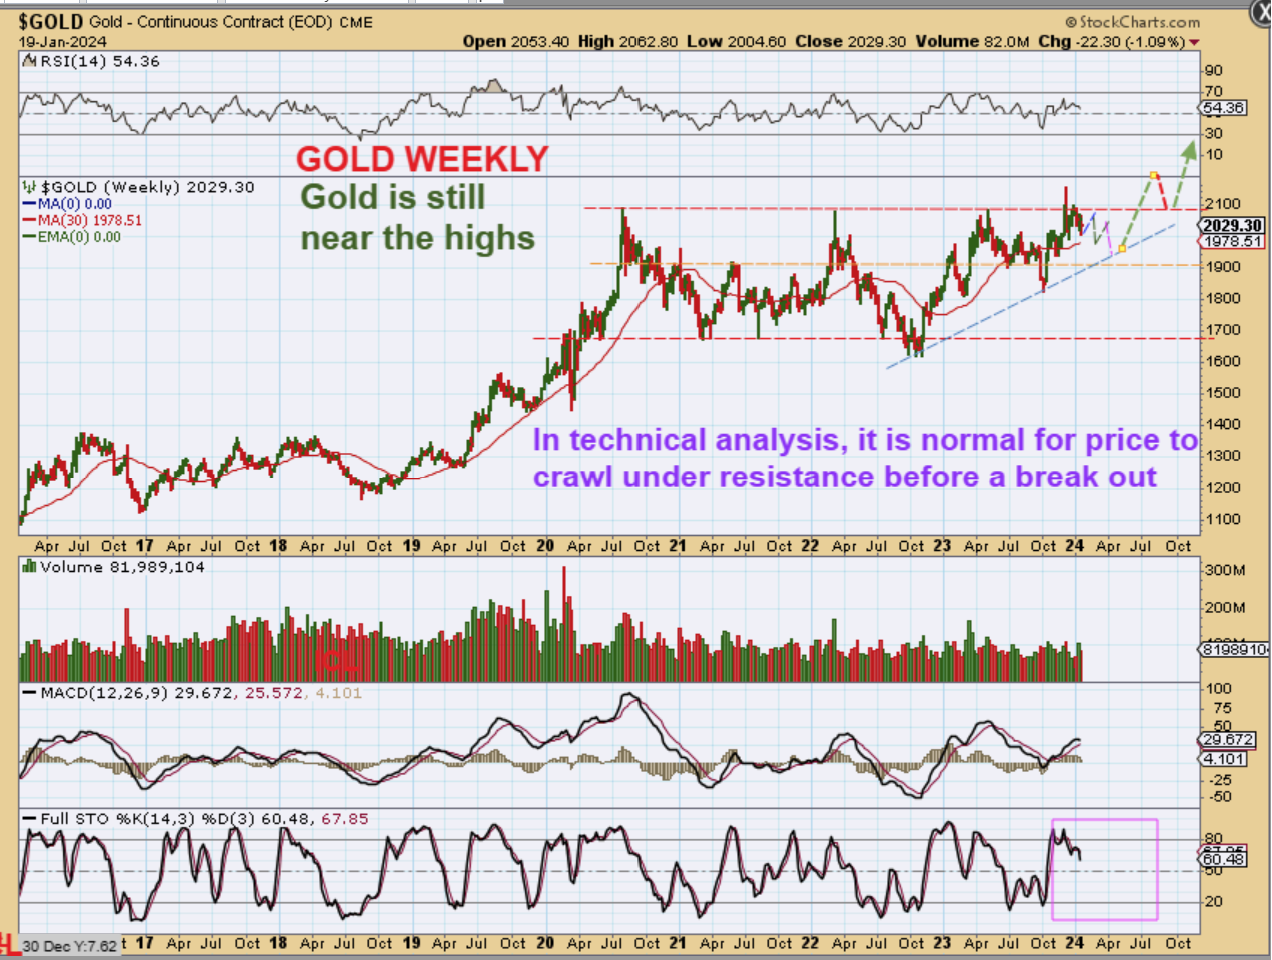
GOLD WEEKLY -After spiking down into an ICL, I am thinking that the USD rolls over (actual rate cuts or ‘Buy the rumors of cuts’ at the next Fed meetings) and Gold could rally out of that ICL to new all-time highs. Please read the chart.
.
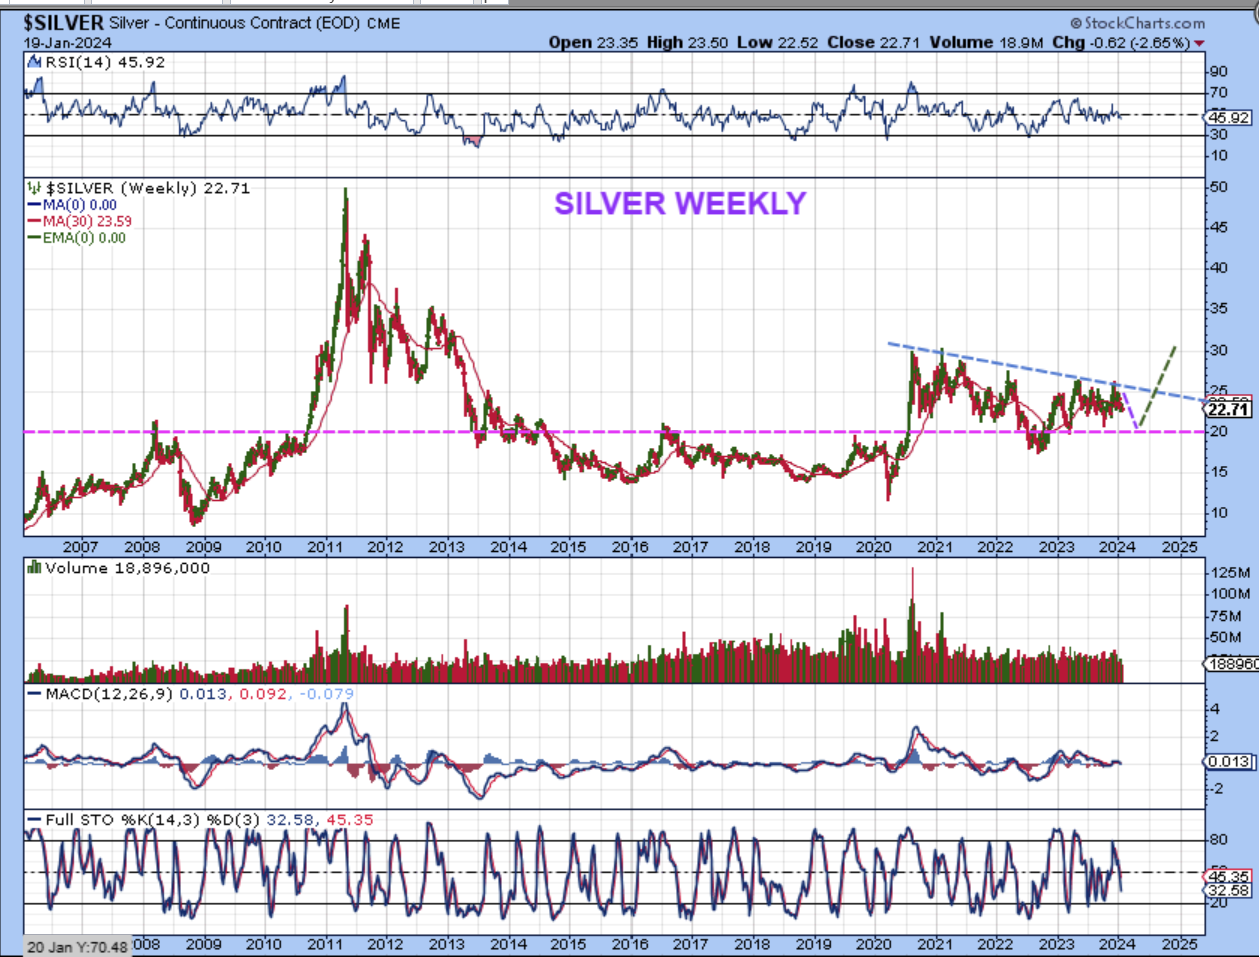
SILVER WEEKLY – Silver has been choppy and weaker than Gold. I have been drawing this consolidation as a drop to support before a breakout higher with Gold.
.
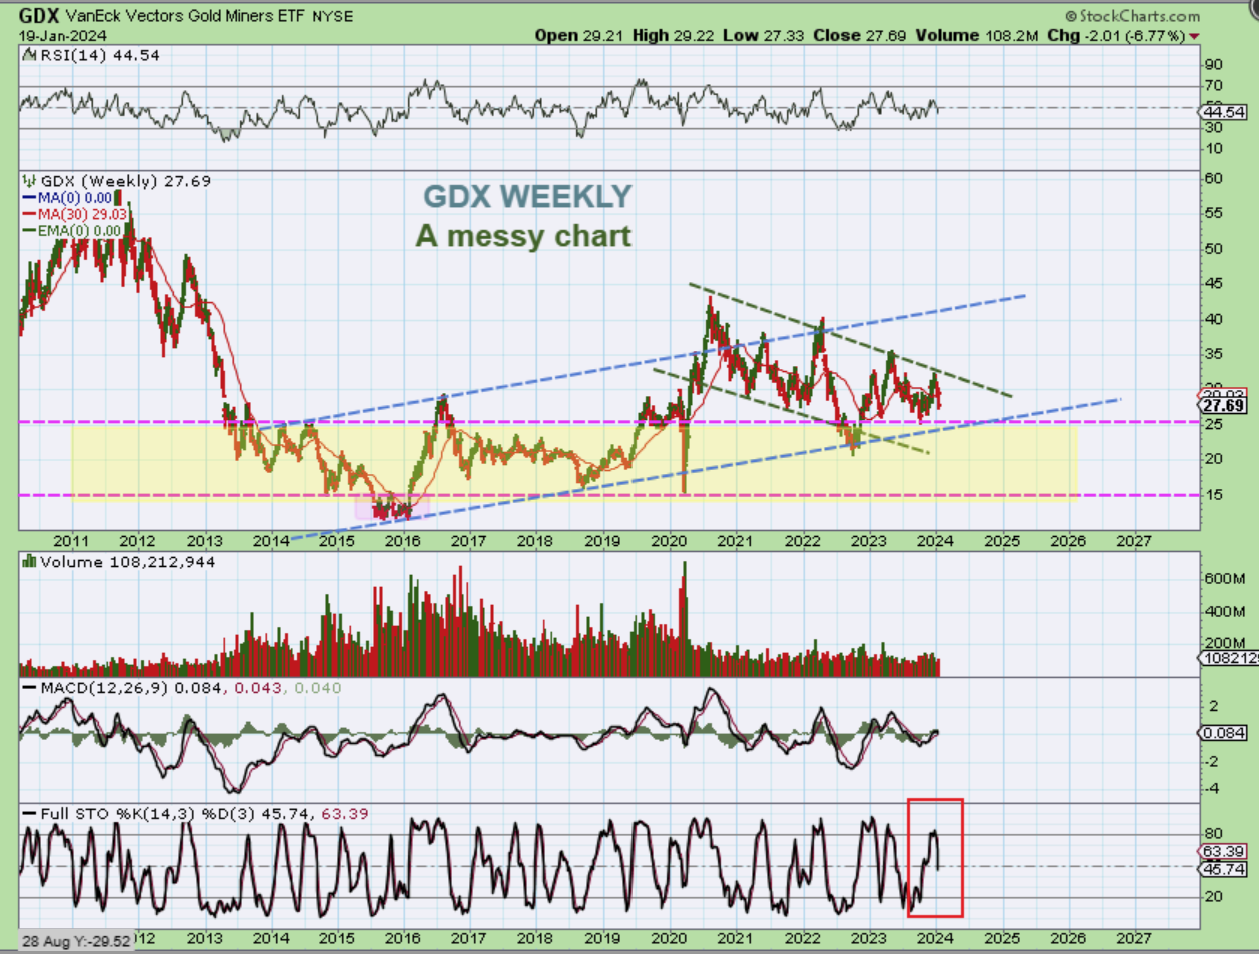
GDX WEEKLY – What a choppy frustrating mess this weekly chart represents. Miners are going to drop when Gold and Silver seek out their ICL, and I will look to buy that ICL. The rally in 2018-2020 was good ($15 to $45), and the next one may be too, with Gold breaking to new all-time highs, but right now, I do not own any Miners until Gold bottoms.
.
That General Market breakout Friday looked very bullish. I am going to look for stocks in those areas to buy, as well as TQQQ, SOXL, SPXL, etc. Oil has been choppy, but it looks ready to break out from that triangle pattern soon and Oil stocks (& GUSH) should follow. The USD and Gold have work to do, but after Gold puts in an ICL, I do think that it is going to run up and try to breakout again, this time from a higher starting point and with success. I will cover bitcoin below. The General Markets would probably be the best areas to focus trades for the next few weeks. Some of the Tech stocks are nicely set up, and even TQQQ, SOXL, SPXL are looking like they want to run higher after Fridays breakout. Breakouts are a little tricky, because they can back test, but these markets should be moving higher over time.
.
Thank you very much for being here at Chartfreak with me and enjoy your weekend!!
.
~ALEX
.
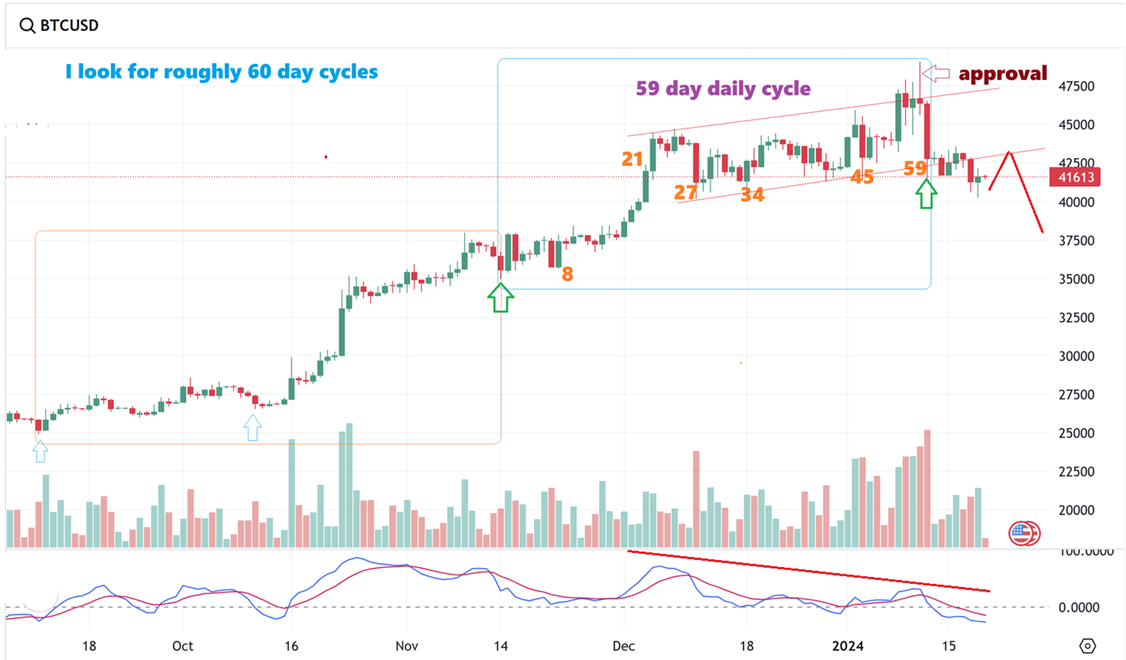
BITCOIN DAILY – Using ’30 day 1/2 cycle lows’ and ’60 day cycles’, I feel that Bitcoin completed that daily cycle on day 59 with a crash day after the approval. I said that I think we ‘peaked’ and sold my crypto stocks. I think that the next daily cycle will be lower and Crypto related stocks are crashing down already. Some have been cut in half and then some.
.
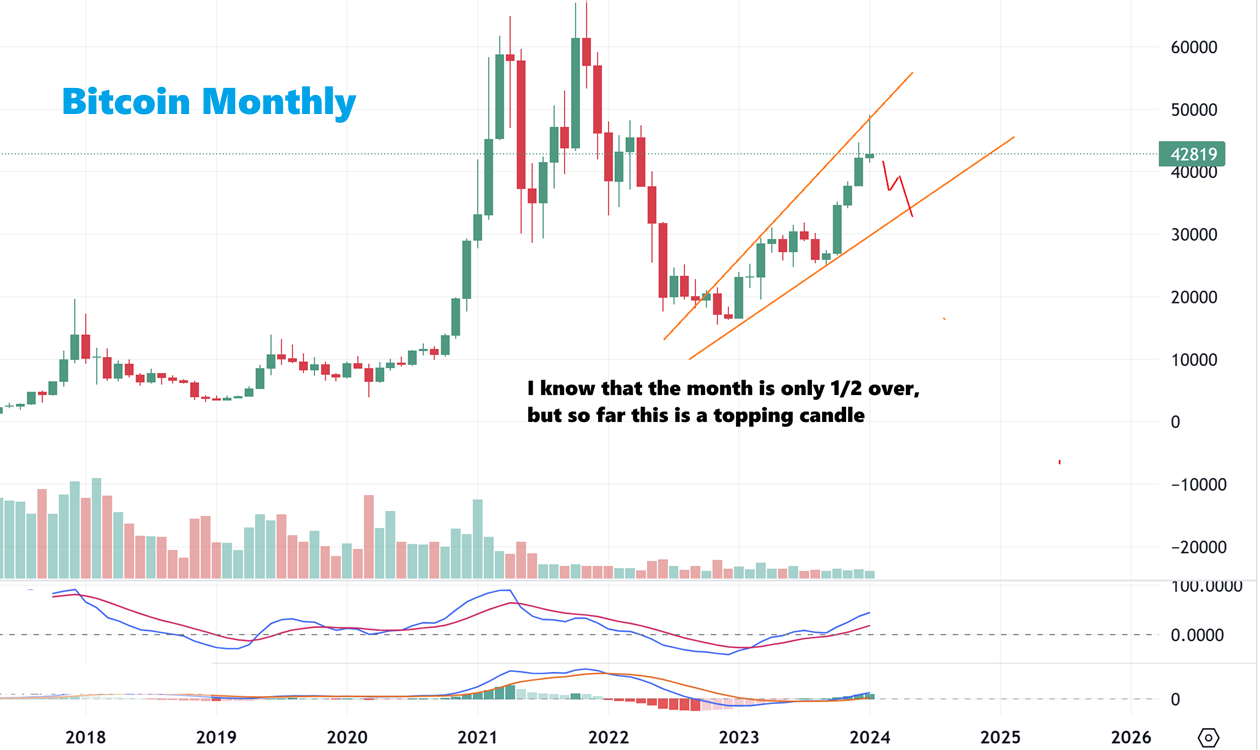
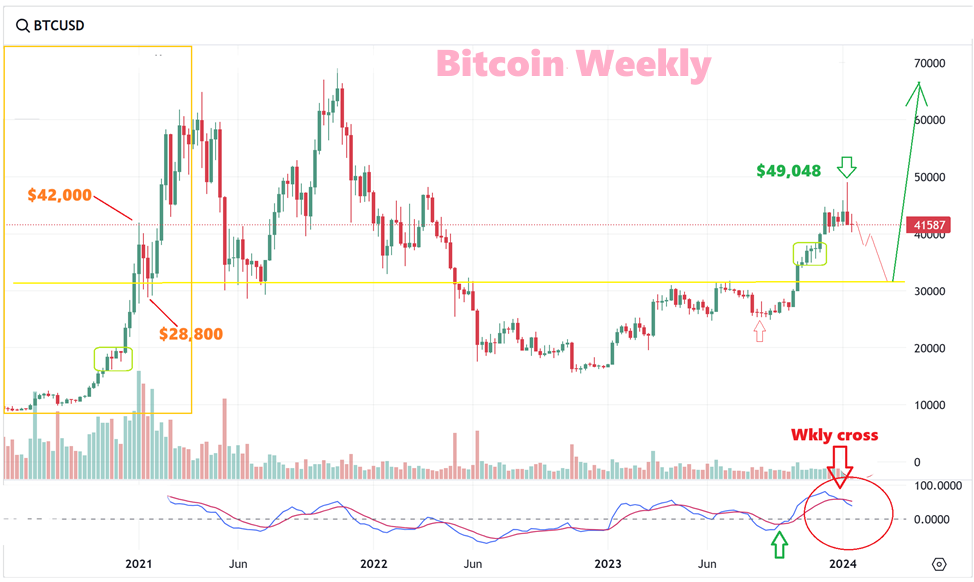
BITCOIN WEEKLY – I have been comparing the major run up in 2020 with the current one.
1. In early 2021 Bitcoin dipped from $42,000 to $28,800 in 2 or 3 weeks.
2. Could a large drop like that happen again? I think that we may soon find out. We now have a cross down in the lower weekly indicator.
.
I also drew up this monthly chart last week when I saw the reversal candle forming. I am expecting a drop in Bitcoin, with a great buying opportunity ahead!