Weekend Report December 25th
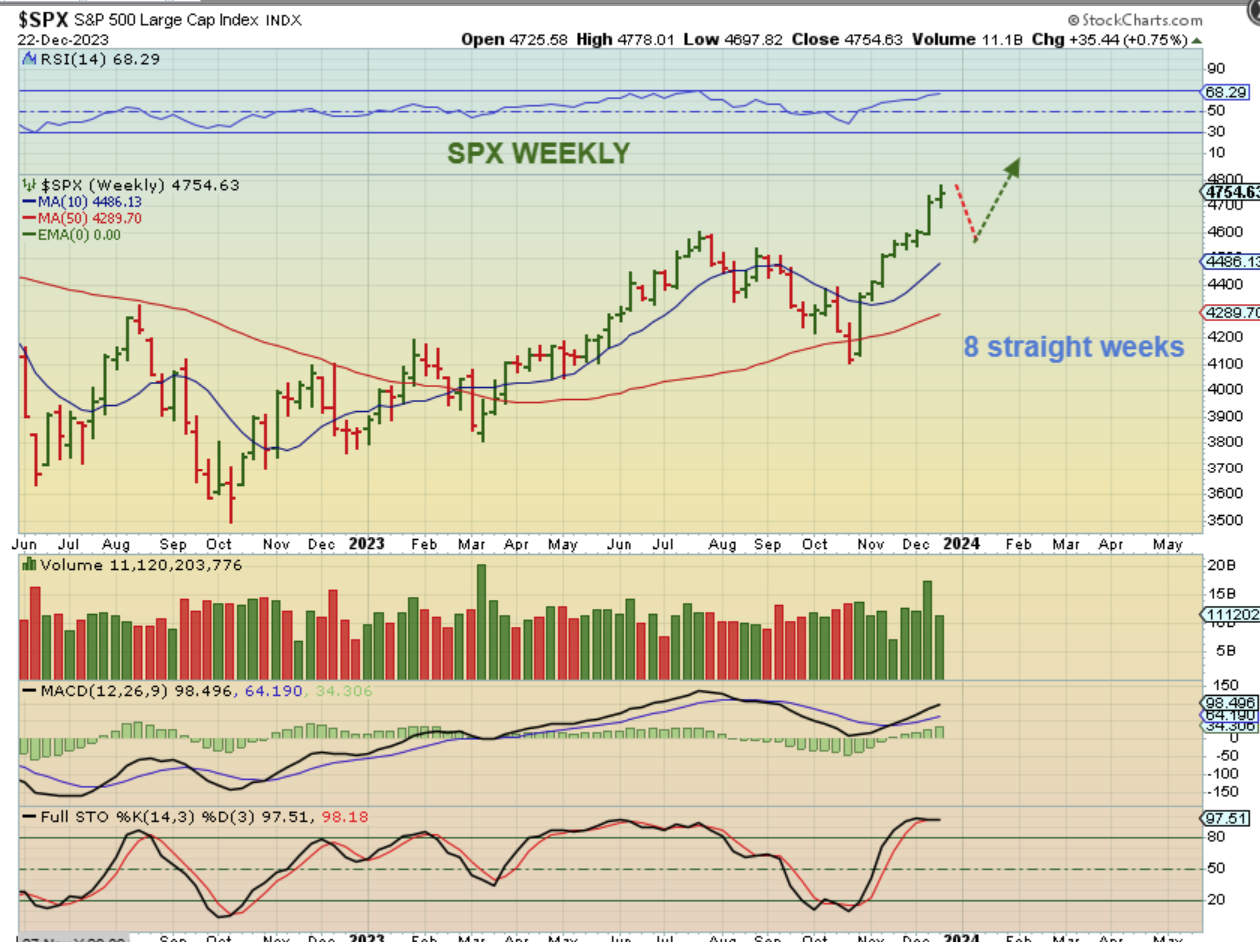
SPX WEEKLY – Well what can we say about the move out of the ICL? 8 straight weeks of gains ever since that Nov 1 Fed Mtg indicated that going forward rate hikes were now complete, and the next Fed Mtg gave indications that rate cuts would even be coming in 2024. So…
.
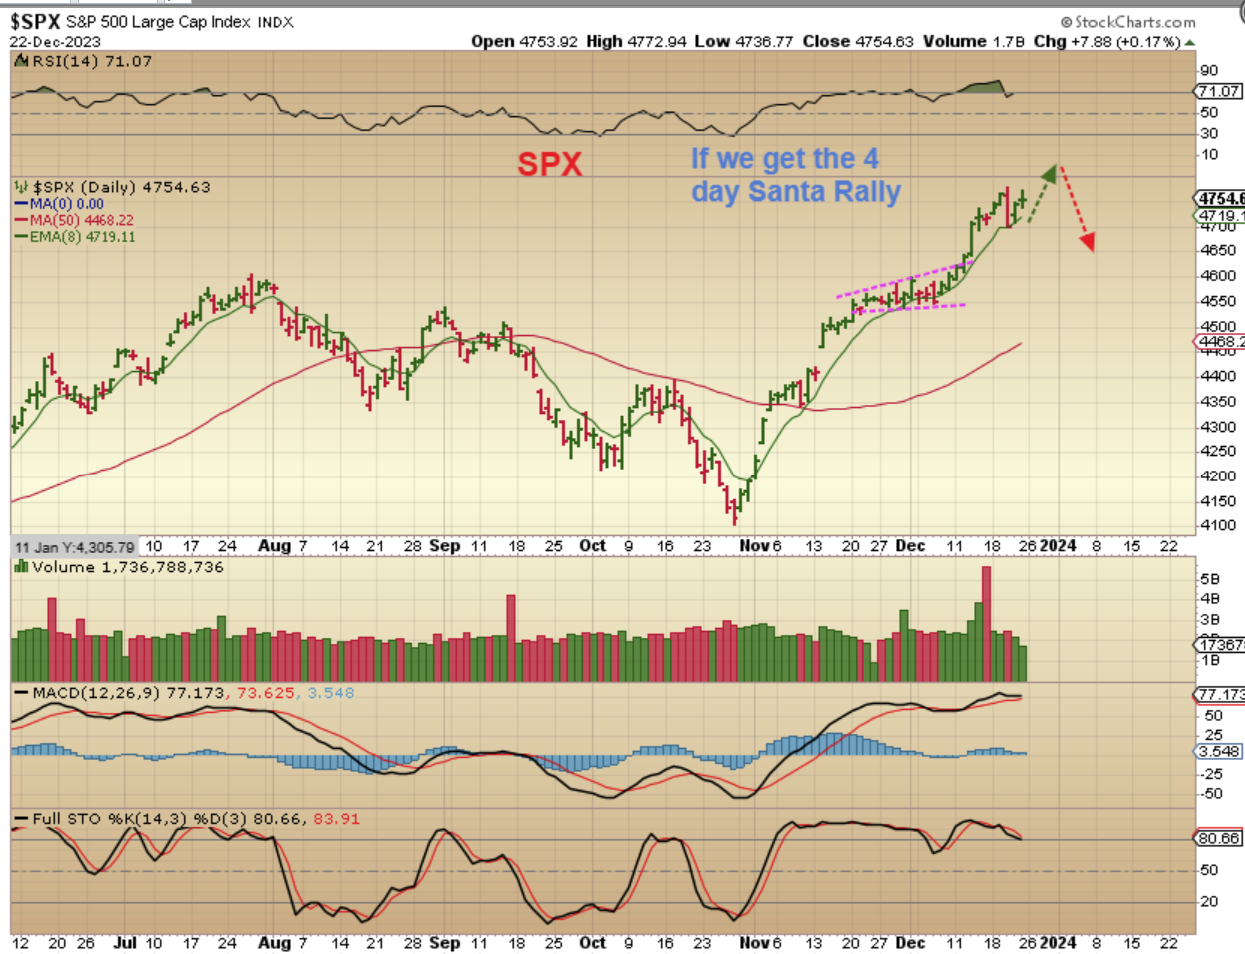
SPX DAILY – We’ve been following the daily cycle counts in the weekday reports and we are due for a dip into a dcl. That said, we often see that phenomenon where the markets rally after Christmas (Santa Rally) due to light participation during that vacation week. I have drawn that possibility here, but the markets have been so strong for so long that we should expect the unexpected too. That would be the start of that dip into the next dcl. EITHER WAY, we will buy that dip at the next dcl.
Friday I wrote:
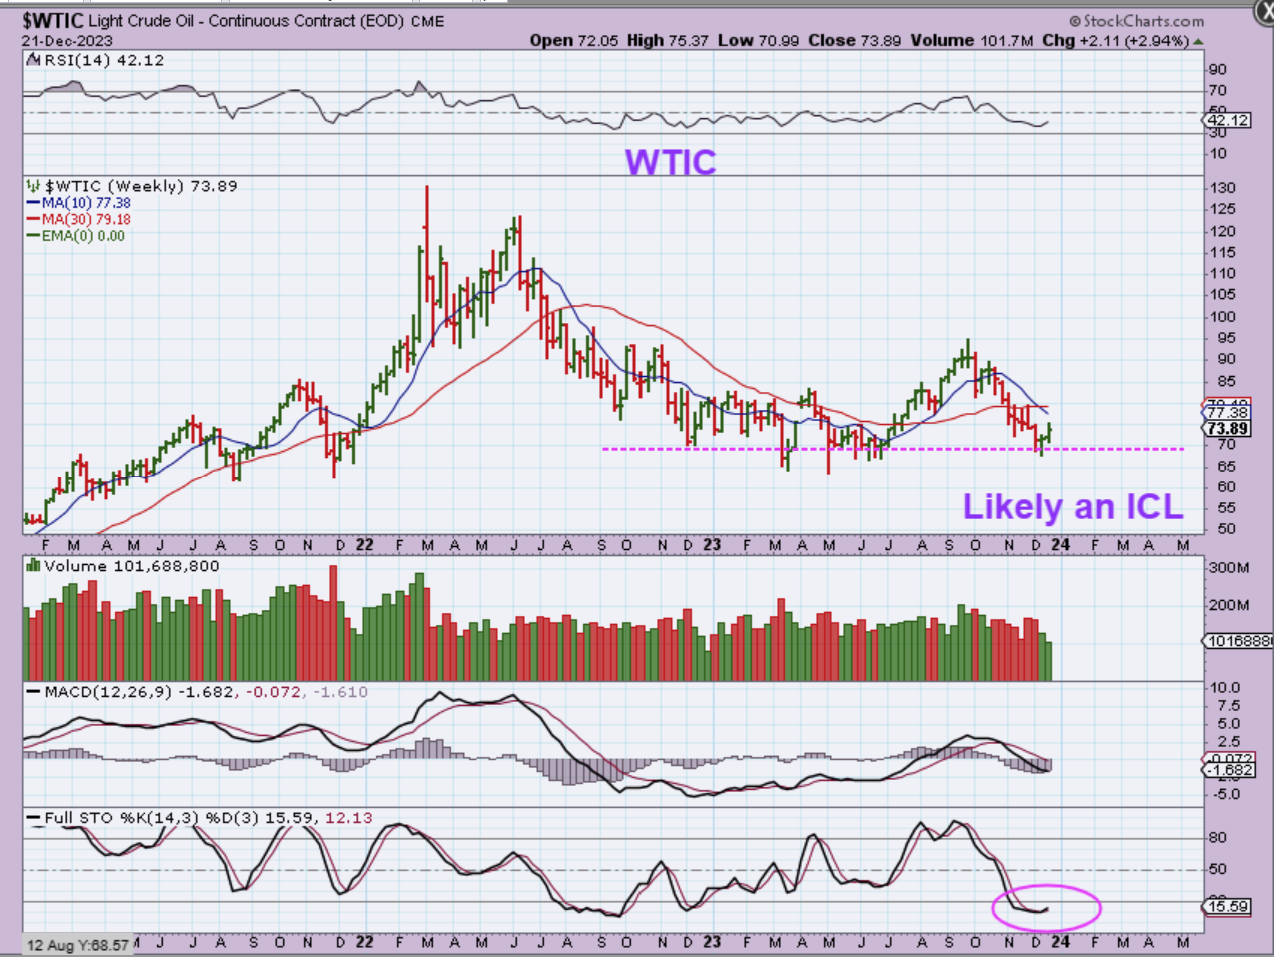
WTIC – ‘Oil does have a confirmed DCL, and there are several reasons to believe that this is also an ICL. ‘ A break of that downtrend line helps to further confirm it.

WTIC WEEKLY – We have a weekly swing low with that price rise last week. For us to see another daily cycle lower seems unlikely since we are very oversold and price is at the last support area, so we’ll watch for a break above the downtrend line or 10 week ma for further confirmation. Obviously a break below last weeks lows means that the drop into an ICL will continue for another daily cycle and could land in the $60 area..
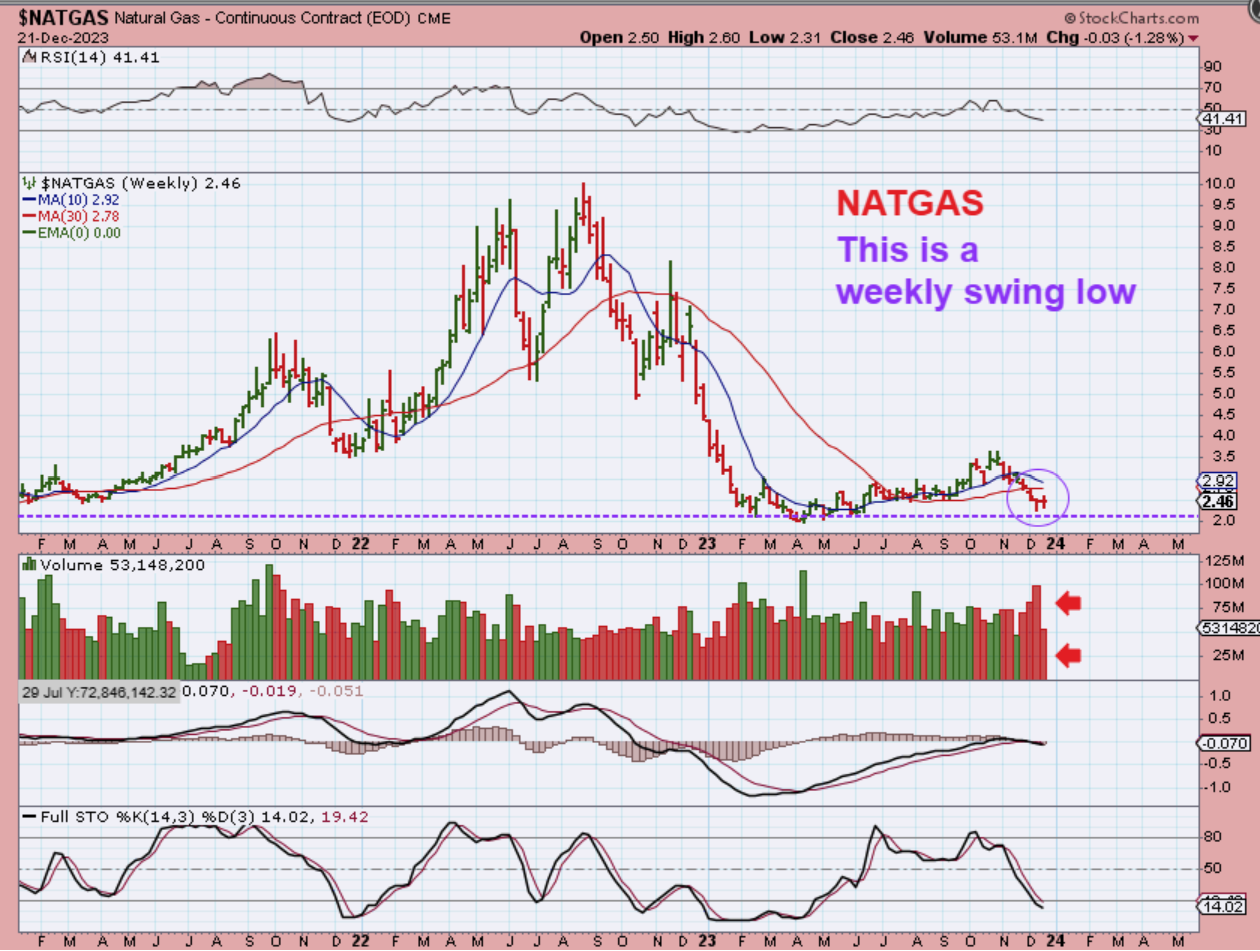
Fridays report also pointed out NATGAS as being is in a bottoming process and I mentioned that the Weekly chart is bullish too.
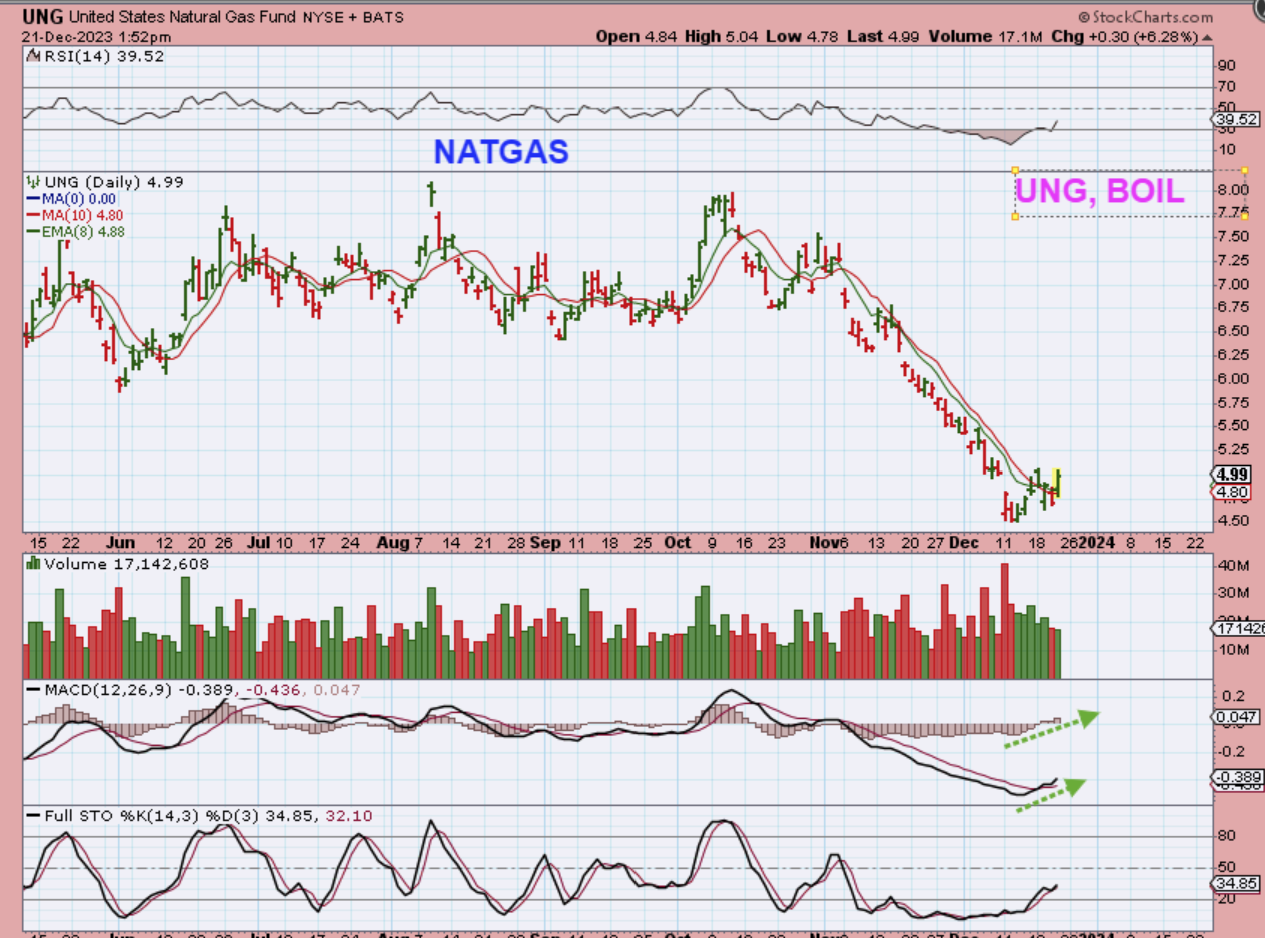
NATGAS WEEKLY– Is THIS an ICL? Maybe, but notice that Natgas is not quite at the Feb, March, April, May lows and it is not overly oversold, so we may have a dcl formed that is buyable for a trade, and as time goes on an ICL could be identified through further price action. One more daily cycle lower here would get this to the prior lows and deeply oversold, but it is not necessary, so we’ll see.
.
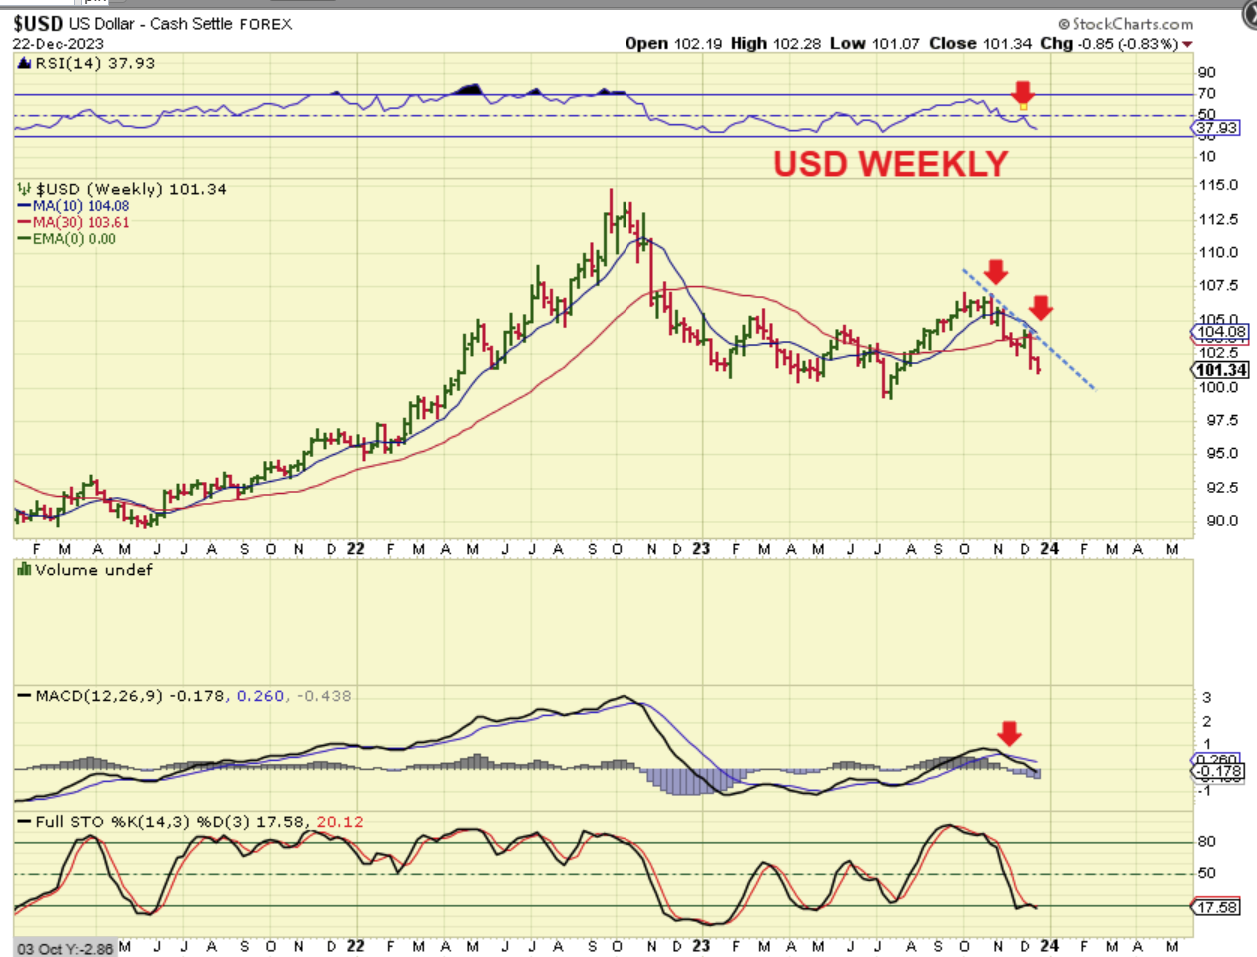
USD WEEKLY -The USD dropped this week and is selling off after a failed daily cycle. The USD rallied strongly from July to Oct, but Gold actually went sideways for most of that time. Now as the USD sells off, we are seeing Gold back at the all-time highs.
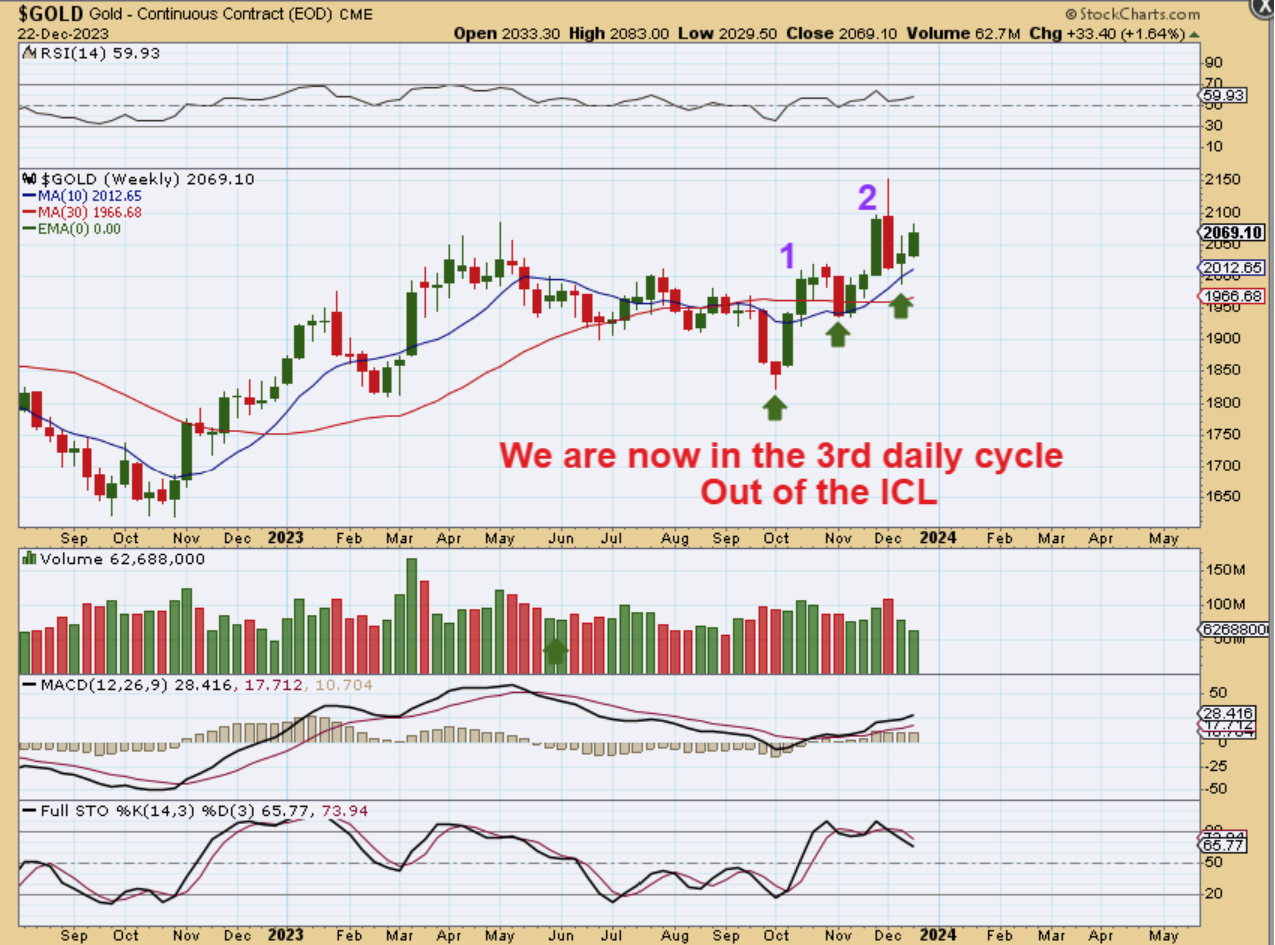
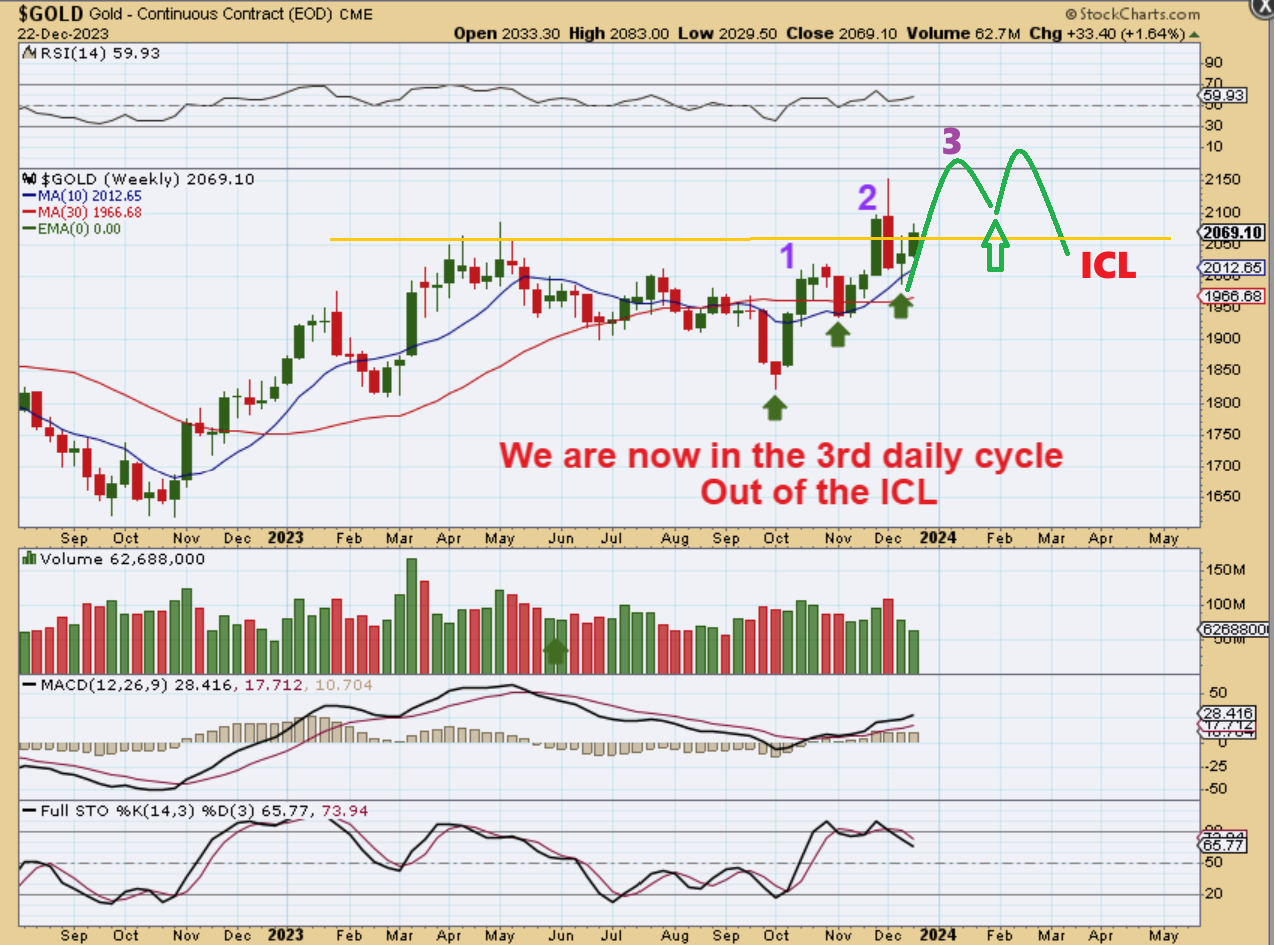
GOLD WEEKLY – We have 2 complete daily cycles out of the ICL, and the 2nd one tried to breakout and failed. I’m still a believer that Gold is going to break out and run, but it may or may not do it on this 3rd daily cycle. We may see an ICL first and then a 2024 rally to new highs. 2 ideas…
1. We are still early in the 3rd daily cycle, so it COULD work its way up there and then the ICL would back test the breakout later.
2. There was that blow off exhaustion candle, and they often take time to work off the damage, so that is why it is also possible that we complete this intermediate cycle and then try to break out.
Let me draw both of those ideas.
GOLD WEEKLY BULLISH BREAK – This would be an idea of the 3rd daily cycle making new highs and then a 4th daily cycle might double top and drop into an ICL back test. Of course, this is just a guess at a breakout at this point.
GOLD WEEKLY NEEDS MORE TIME – The exhaustion candle being a possible ‘peak’ of this intermediate cycle would mean that it doesn’t break out again yet, so we’ll probably dip into an ICL in early 2024 with 2 lower highs and lower lows as seen here. The next Intermediate cycle could then breakout. That last ICL was NOT deep, and this one probably wouldn’t be either. In fact…
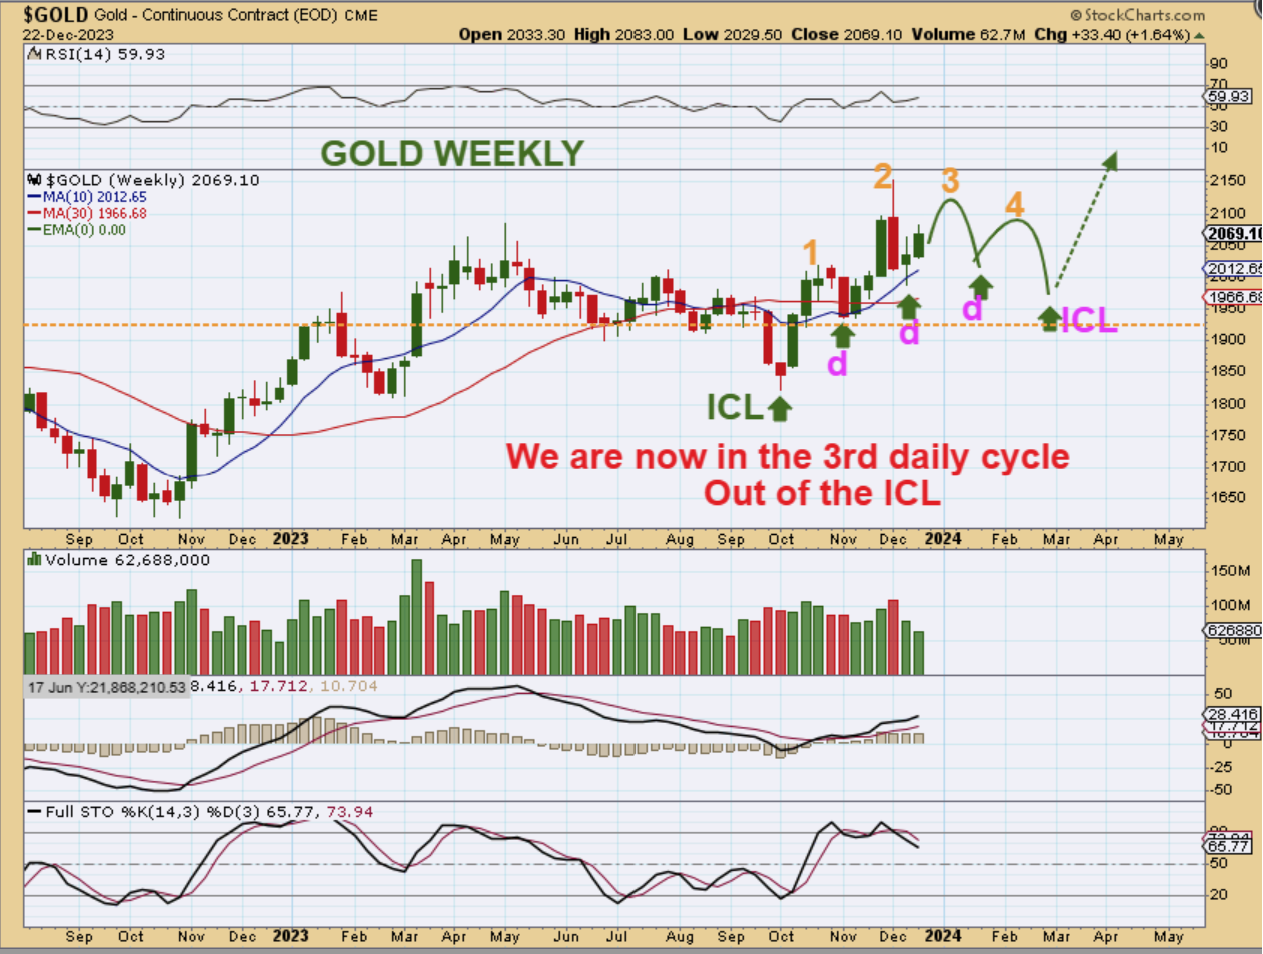
I don’t think that the next ICL will be deep and using prior ICLs in a bull run may help us to know what to expect.
.
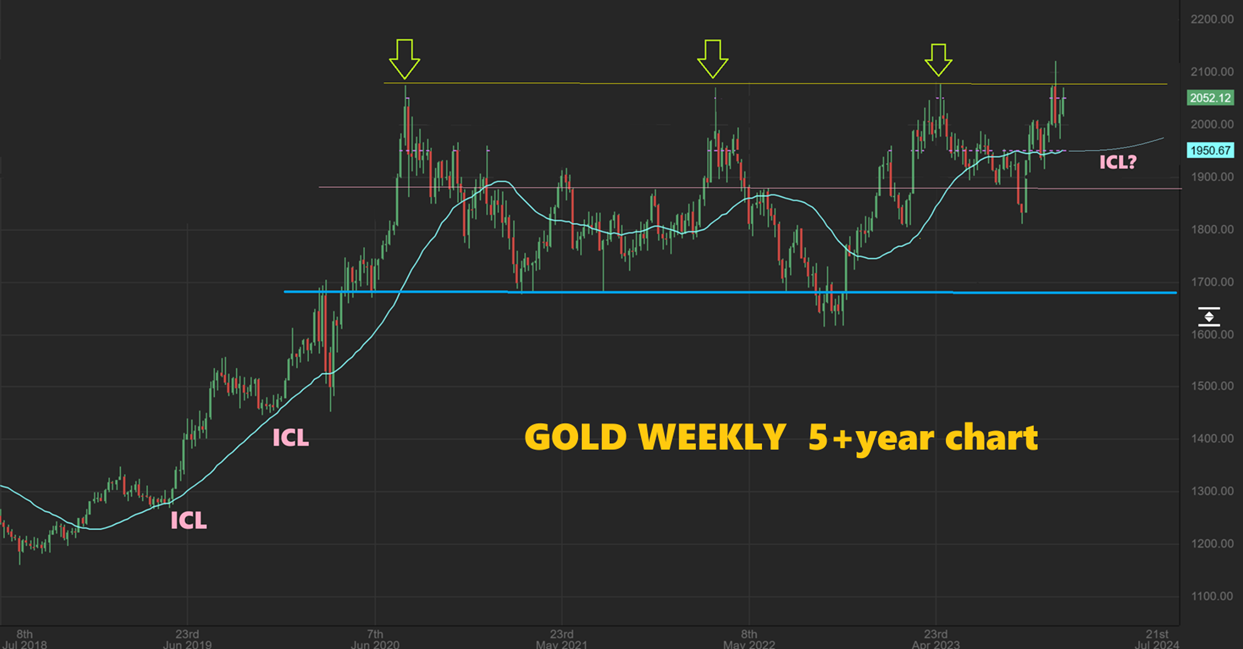
GOLD WEEKLY – Notice that I am looking at ICLs on that past Bull run of 2018 again, and they chopped over to the 30 week ma. If that happened here, it would still keep us above the 1/2 point of this massive consolidation and it would make it easier to break out on the next move out of an ICL. In other words, I’m looking for a higher ICL at the blue line.
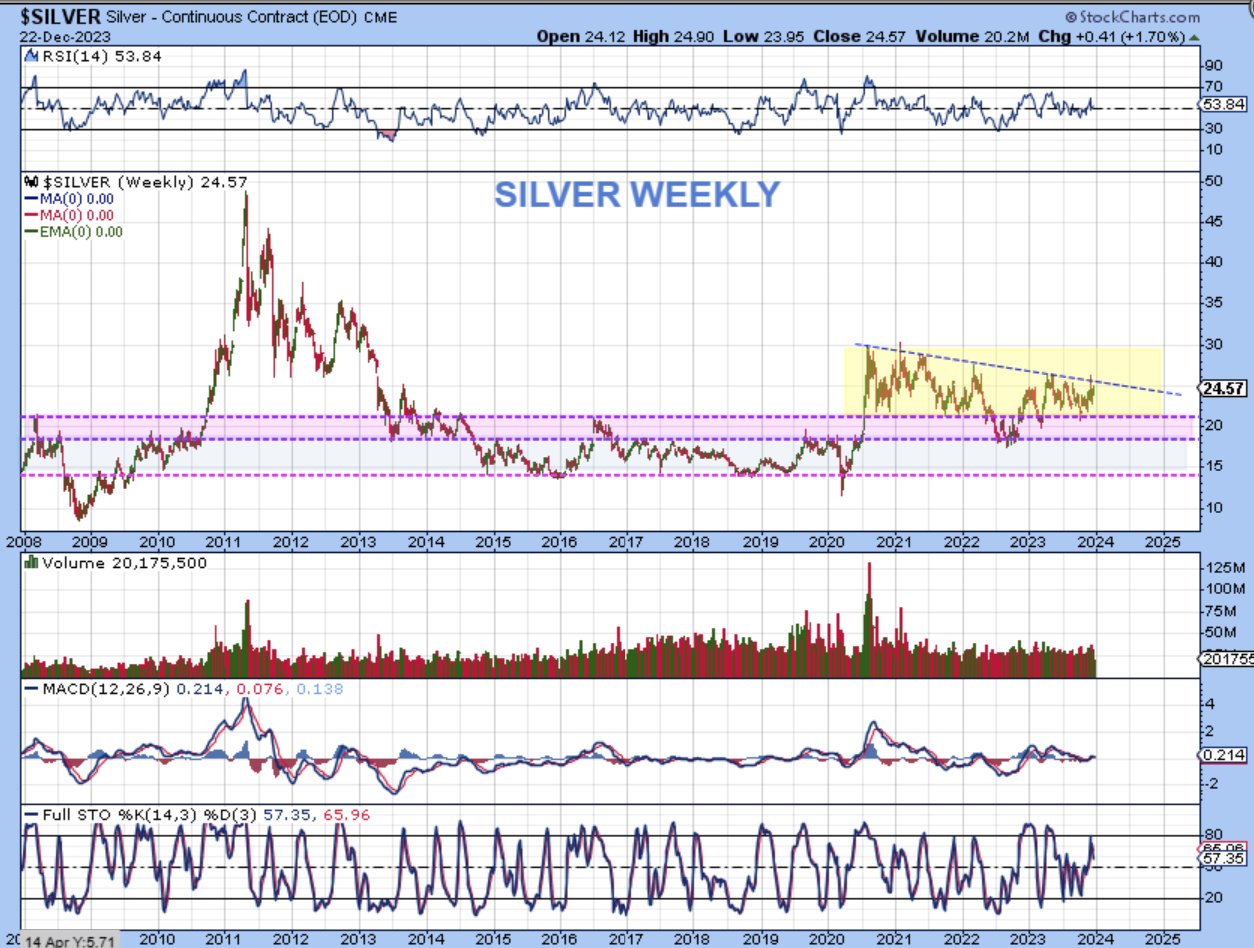
SILVER DAILY – Silver has a series of higher ICLs too. The last 2 intermediate cycles lasted 6 months and then 7 months (they often do run from 5-7 months long). That would bring us to late March early April if we run 6 months this time. We have started the 3rd daily cycle for Silver and it can run to the highs again, or just chop around. The weekly is a long consolidation…
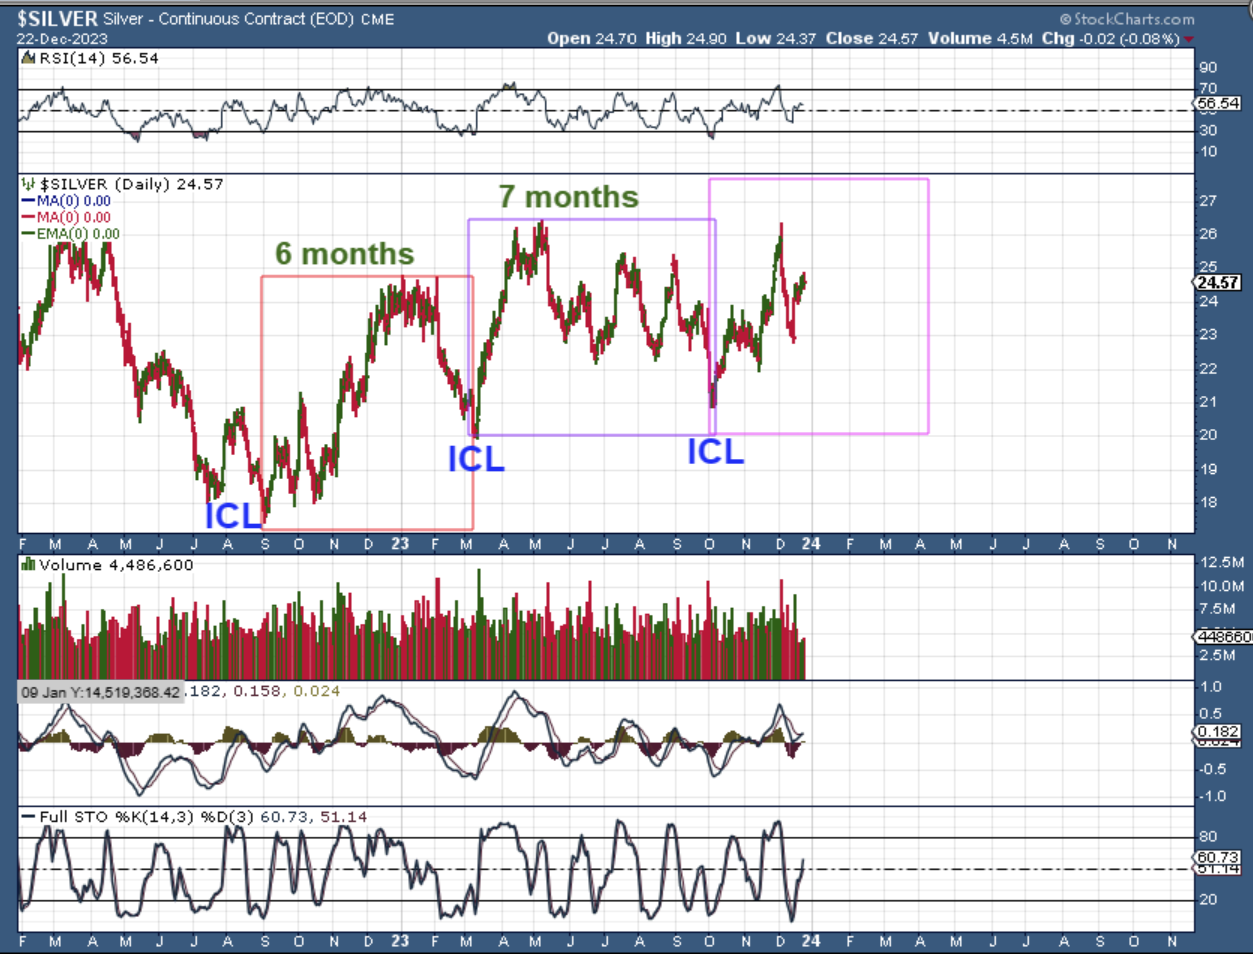
SILVER WEEKLY – This is actually quite a bullish looking big picture for Silver. Even if we rally and then drop into an ICL in March or April, a future breakout of this long pattern could be very explosive. This is also a series of higher ICLs and support is above $20.
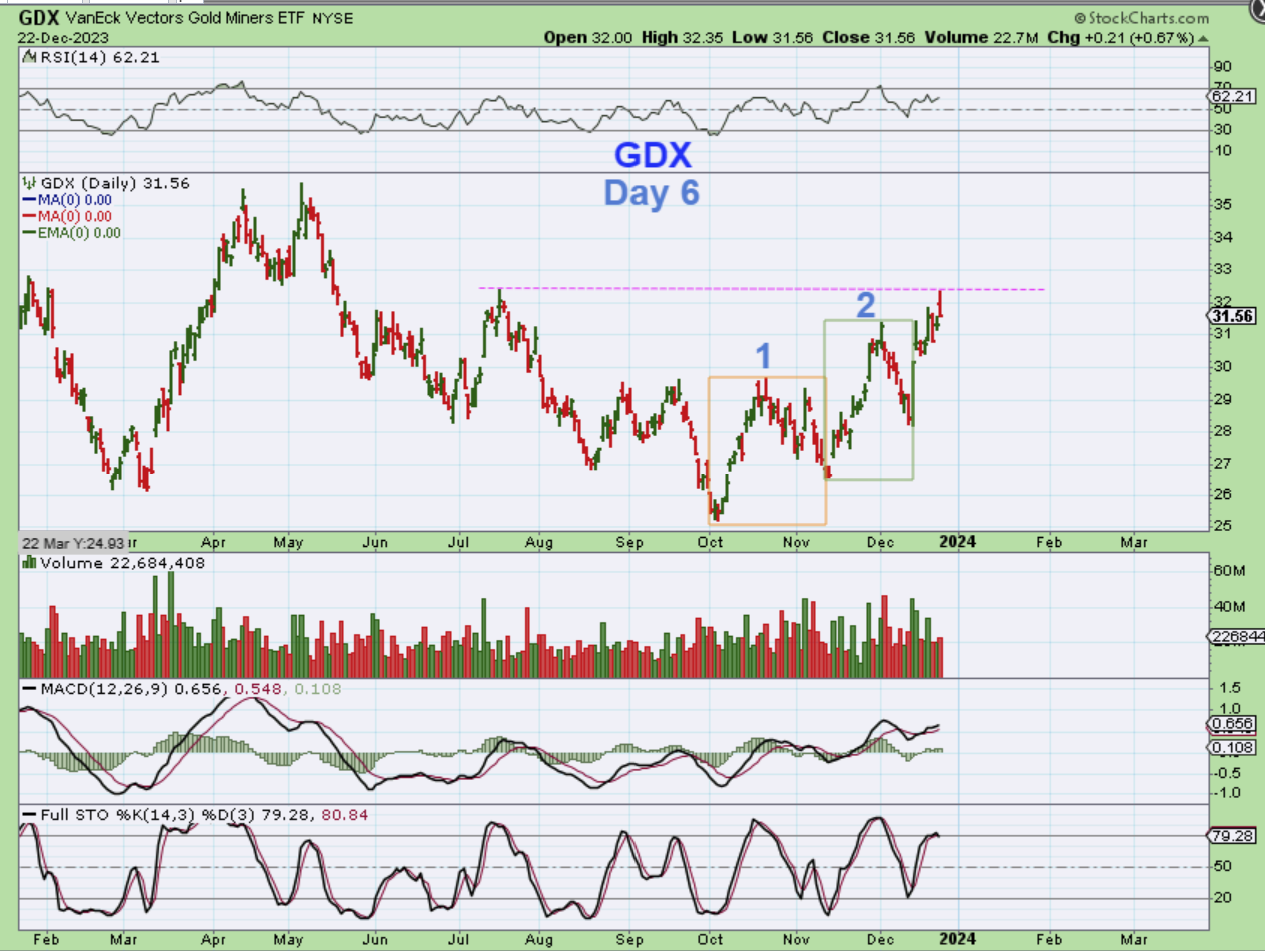
GDX – It is only day 6 of the 3rd daily cycle and the Miners are being bought. I noticed that Gold and silver are not making daily cycle highs right now, but many Miners are. This means that they are leading now and even without a breakout to new highs by Gold, people are buying & possibly accumulating Miners. How might this play out going forward?
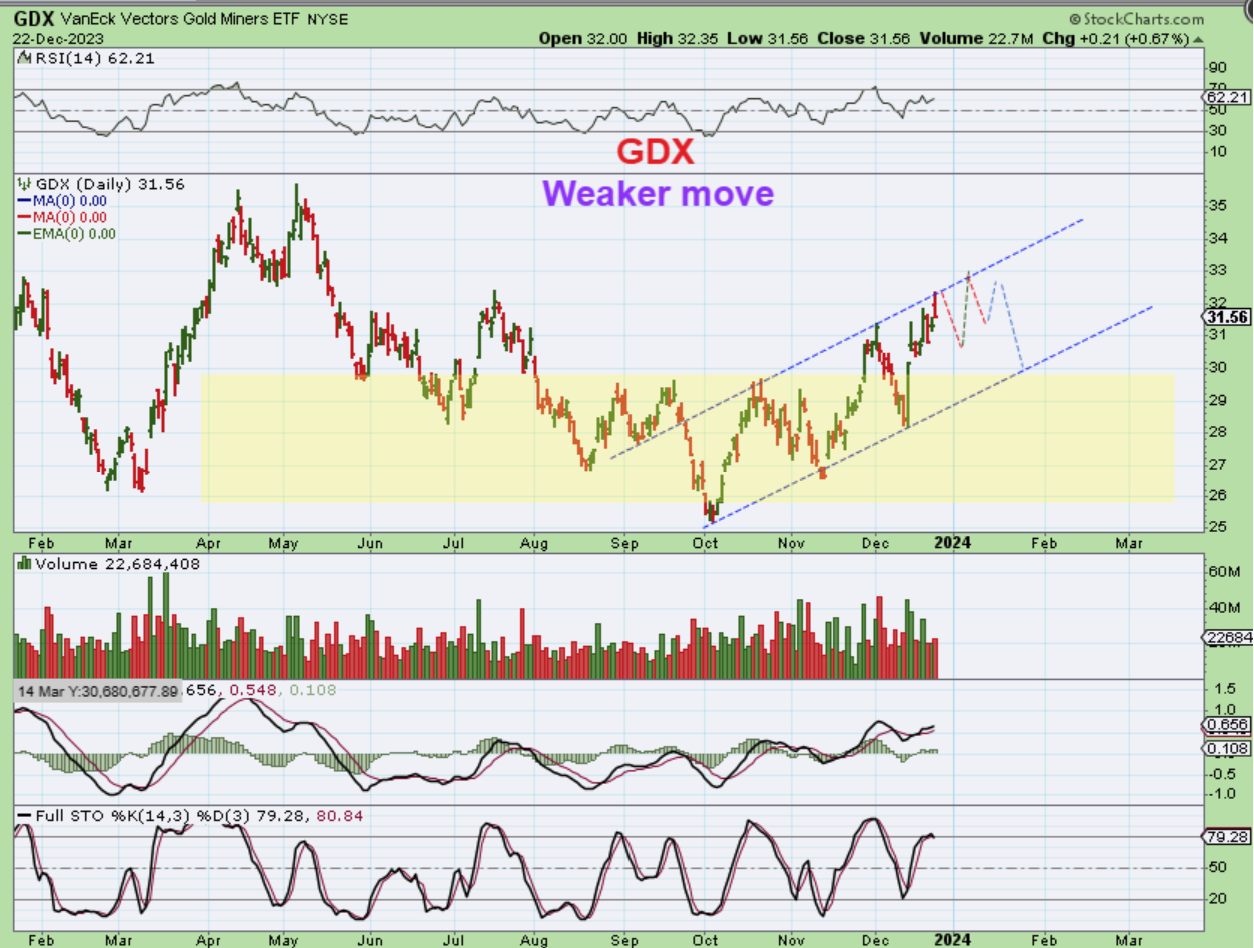
GDX – A weaker move would likely be higher but choppy over time, especially if Gold cannot break out to new highs. I do see an upward trending channel forming, so I included that here. Price could chop along the upper channel line.
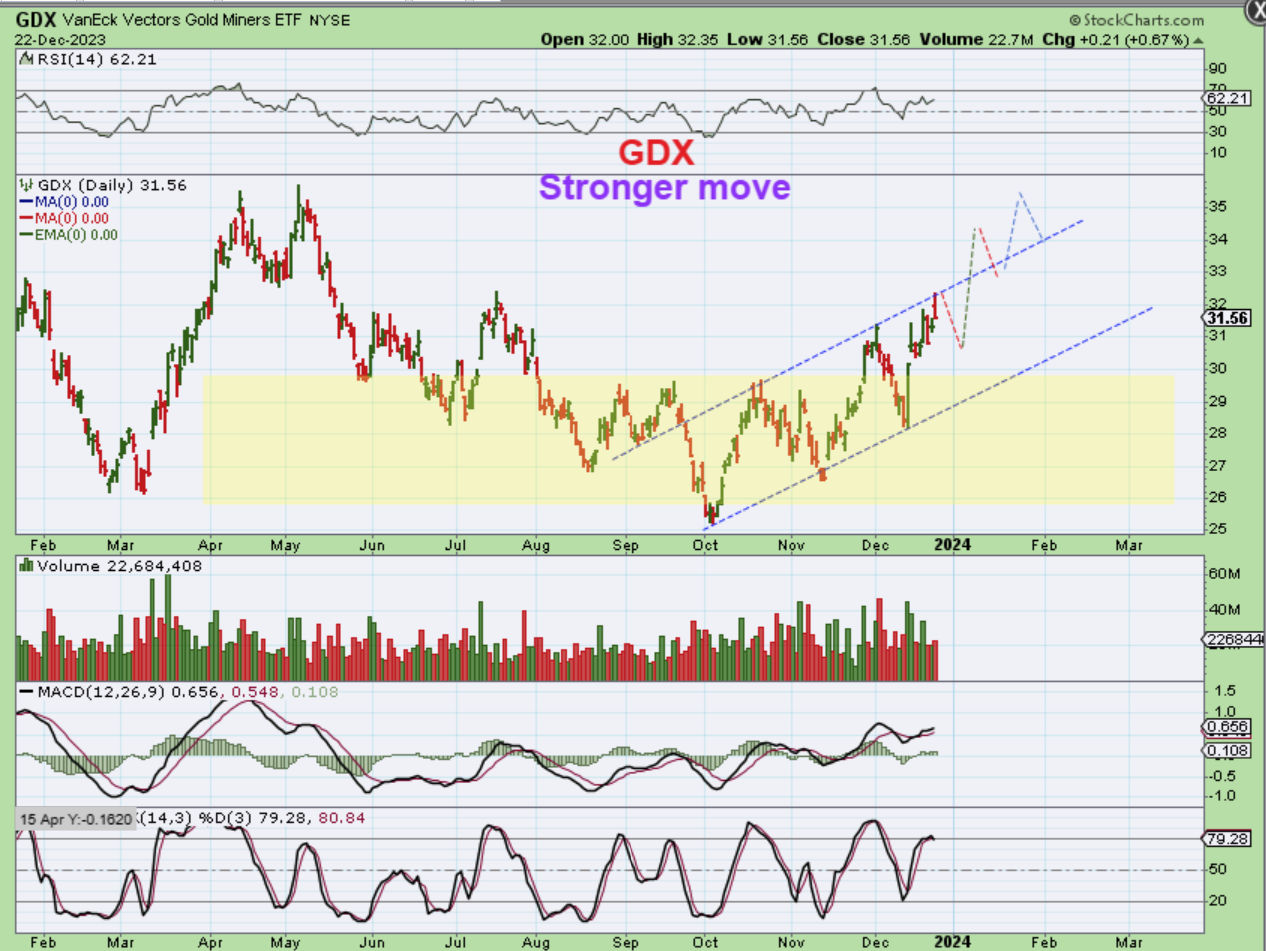
GDX – A stronger move would naturally have GDX climbing back up to the May highs. Either way I do think that GDX will get to the former highs, but the speed of how or when it gets there is in question without a Gold breakout. Gold could chop sideways while Miners continue to rise higher too. We are seeing that take place now.
With only 4 trading days left, the end of 2023 is going out with a bang! When you look and see the General Markets running straight up and still near the highs, Precious Metals are still near the highs and Crypto currencies and Crypto related stocks have been absolutely explosive! So next week we’ll see if we get that Santa Rally or not. Gold, Silver, and The Miners are still rather early in that 3rd daily cycle, but they need to continue to move higher to avoid becoming a L.T. Daily cycle. I’ll be covering that in the weekday reports. Crypto related stocks, Bitcoin and Alt-Coins, what can I say?!! Another excellent week for the basket of crypto. These are running like Cheetahs! I want to explain my longer-term thoughts on Bitcoin below. At this point 2024 looks to be very promising.
With this time off at Christmas and New years approaching, I hope all are well and enjoying family and friends, because isn’t THAT what really makes life worth living? Family and friends. I also want to thank everyone here for being with me (some for many years!), my extended family and friends! Even those that do not write in the commenting section, I will occasionally hear from some via emails, and I do appreciate you all. Thanks for being a Chartfreak with me. I was away on Friday and when I came back and ran through the comments I just had to laugh! There was quite a party going on here Friday, with intermittent trading 🙂 I expected 10 comments and we had 45 🙂 Thanks for the well-wishes, and I appreciate everyone here.
And next, on to what may be the best trades in 2024 %percentage wise…The Crypto Sector.
.
~ALEX
,
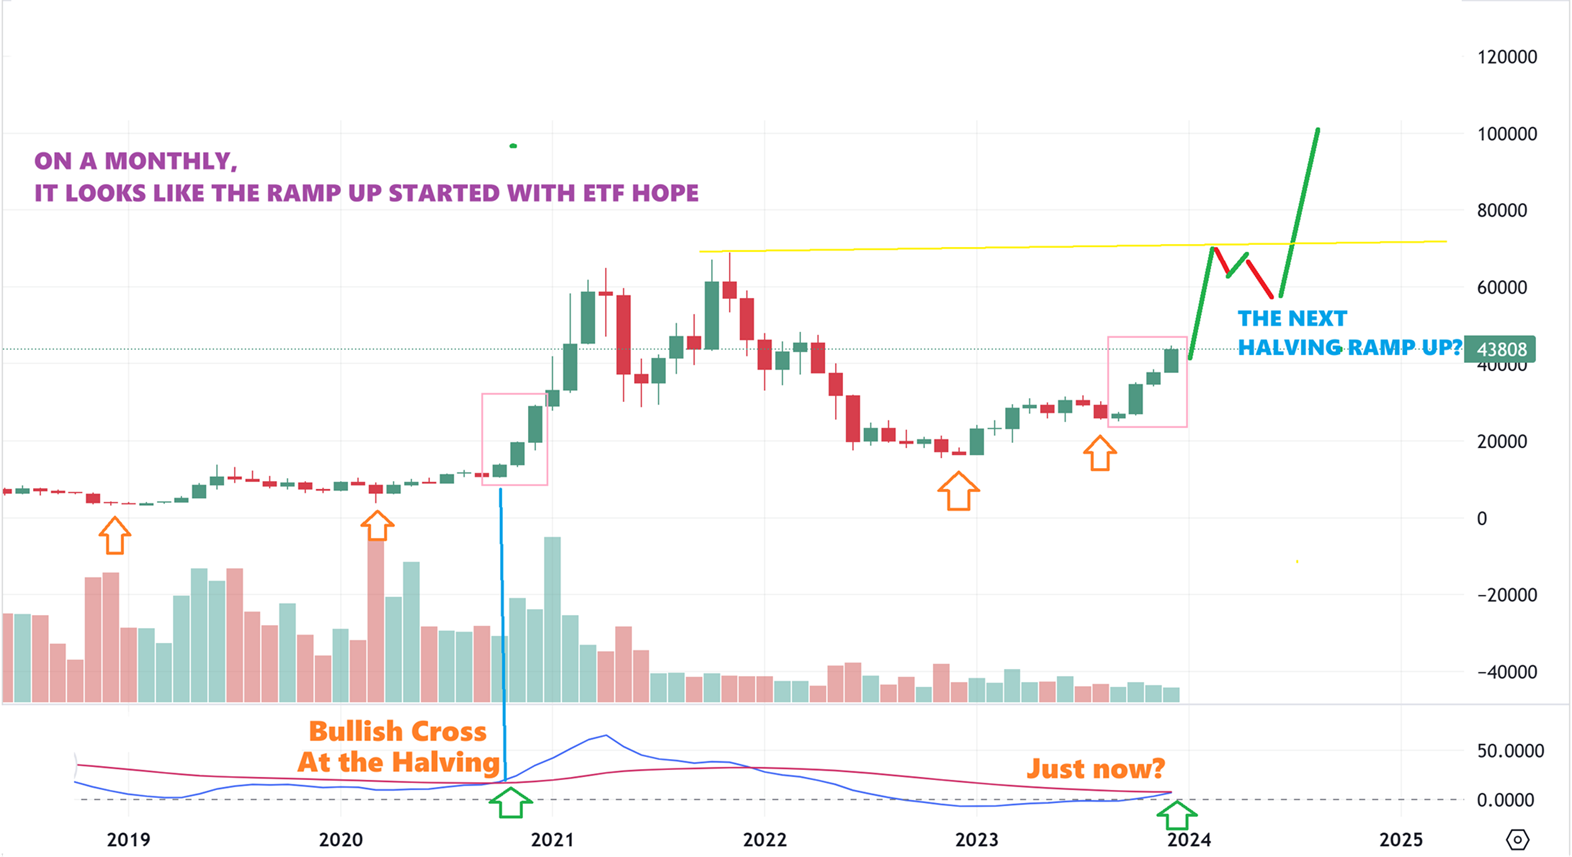
BITCOIN – Last summer I started to discuss the ‘Halving years’ and the RAMP UP that comes during those years more and more. We have one coming up in 2024, but I started to notice that the ramp up that usually comes at or after halving seems to have already started early (Likely due to the ETF proposal).
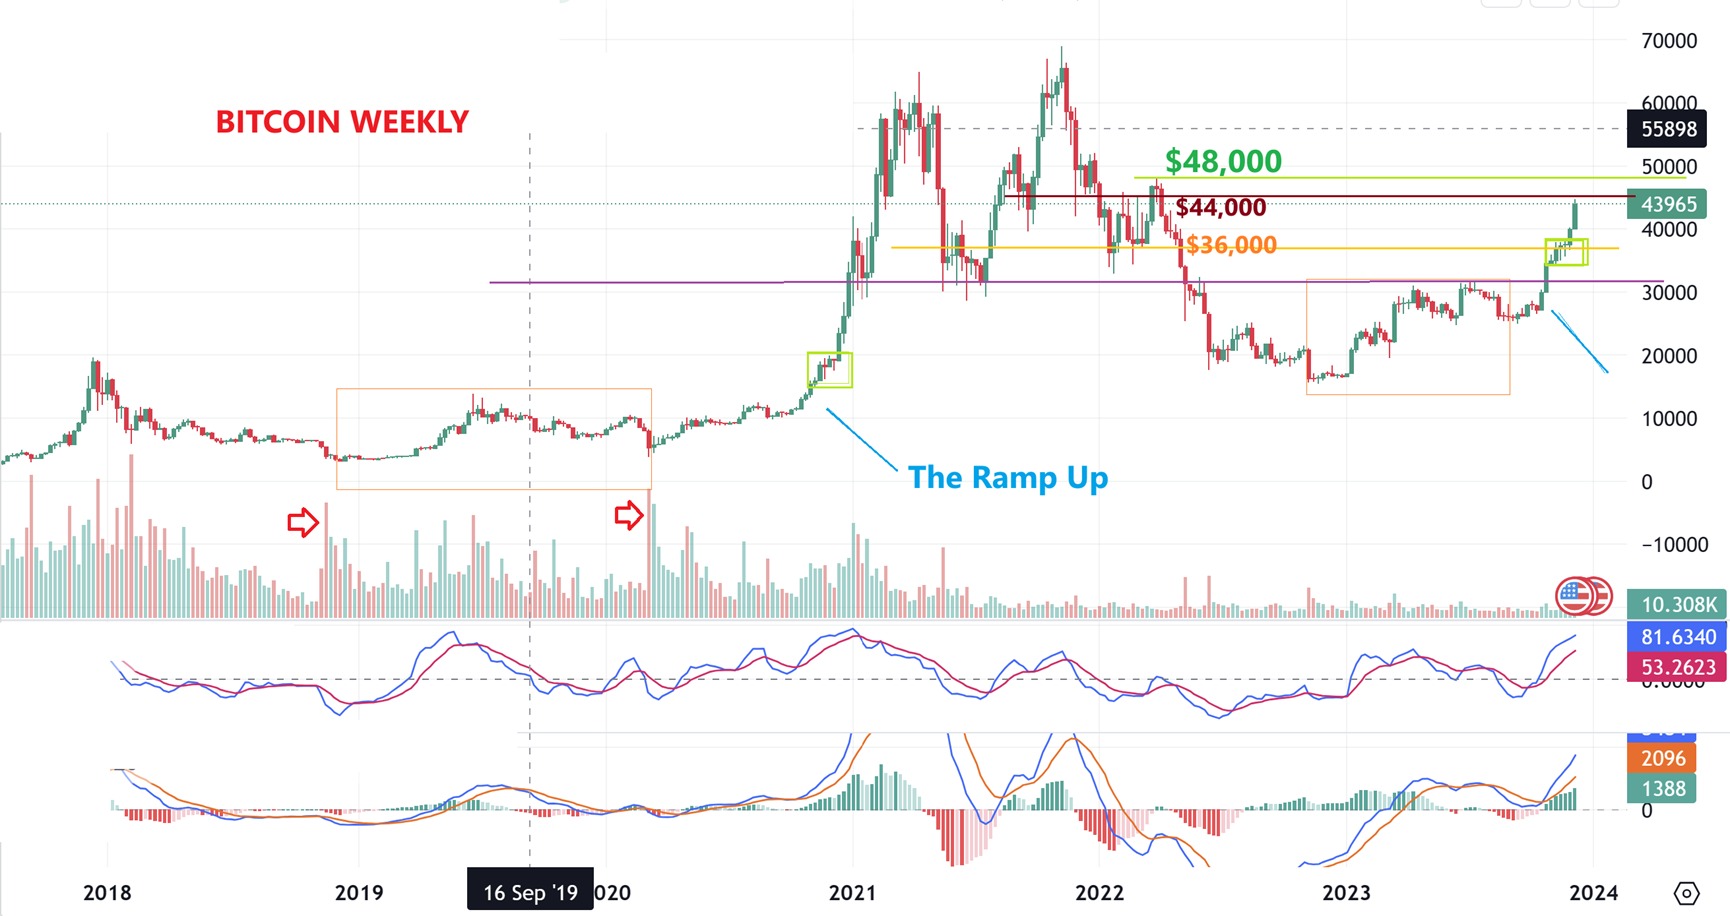
So with that idea (that the ramp up started earlier due to the ETF), I then showed this chart a while back and showed that those similarities were still there. The base, the ramp up started, a green box showed the midpoint consolidation and then it powered higher. I was discussing the $36,000 target last summer, then the $44,000, and then the $48,000 as seen on this chart (Dec 8 chart)…
Note: BITCOINs 2016 & 2020 halving ramp up was a run to all-time highs.
.
Bitcoin now: Running out of that base, Bitcoin had the green box running correction and then a slight pause before ramping straight up. The odd thing is that we are still seeing similarities to that run in 2020, so I keep asking myself: Is the run up to the ETF decision going to make that 2020 halving run right now, and then after an ICL dip in 2024, will we then see a 2nd run for the halving period? I am starting to think that this might be the case. If so, this could be a HUGE year for Bitcoin ( & crypto currencies like Ethereum, Litecoin, Tether, Solana, Dogecoin, etc etc ). So…
.
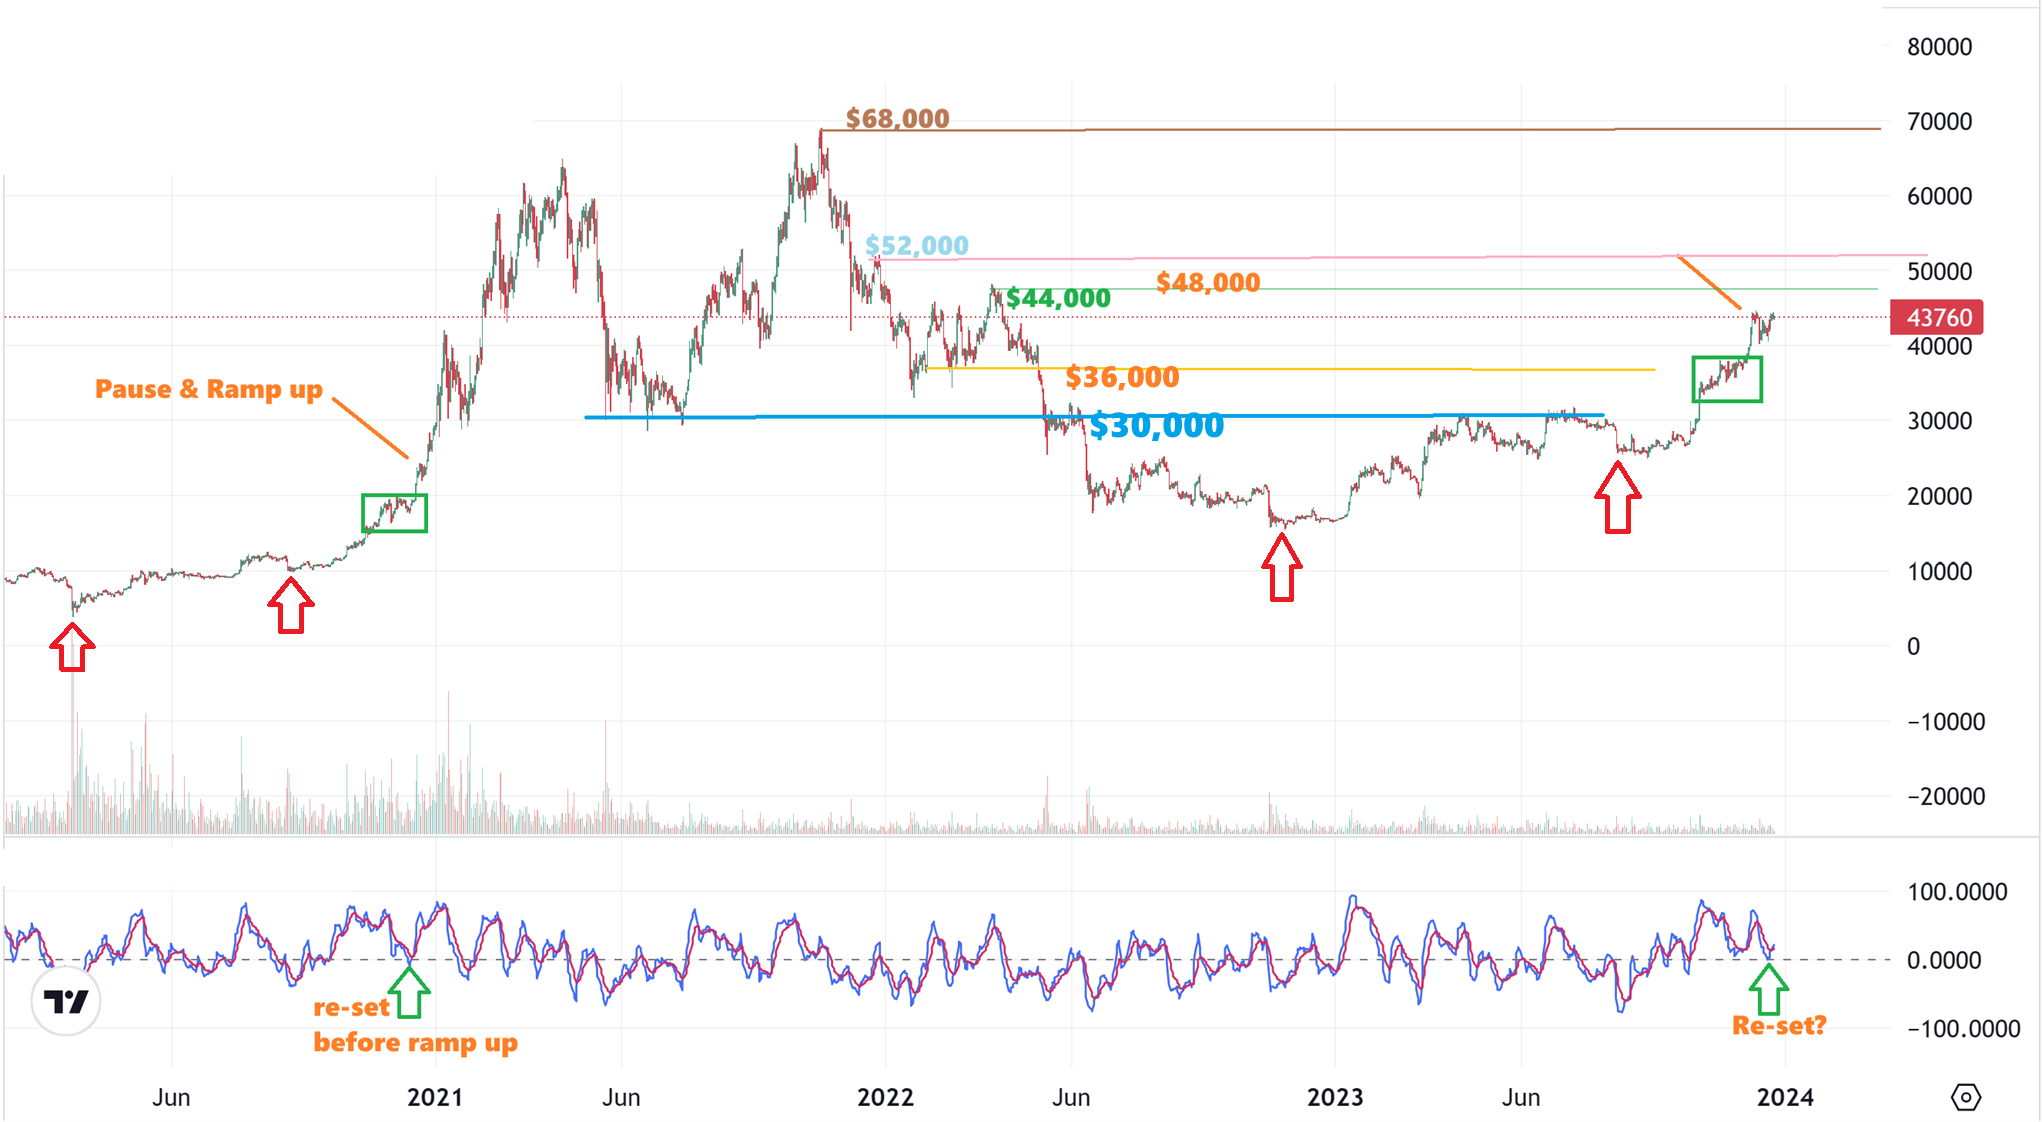
Let’s review how price is currently moving on this run higher is very similar way that price ran into the halving run of 2020. Immediate targets would now be $44,000, $48,000, $52,000, and prior highs were near $68,000.
1. Notice how that Green box consolidation brought the lower indicator to a ‘re-set’. That just happened now too.
2. We are currently ‘pausing’ at $44,000 resistance and that 2020 run paused with a small bull pennant too.
3. If this moved like it did in 2020 after the pause, it would shoot straight up into the ETF timing of January, and then just when EVERYONE is bullish about the ETF, and you hear everyone discussing how much crypto needs to be purchased with an ETF approval, etc— it might just sell off into the ICL like it did in 2020. Buy the rumor/sell the news. THE NEXT ICL IN 2024 WILL BE ANOTHER STRONG BUY. Now lets go weekly..
.
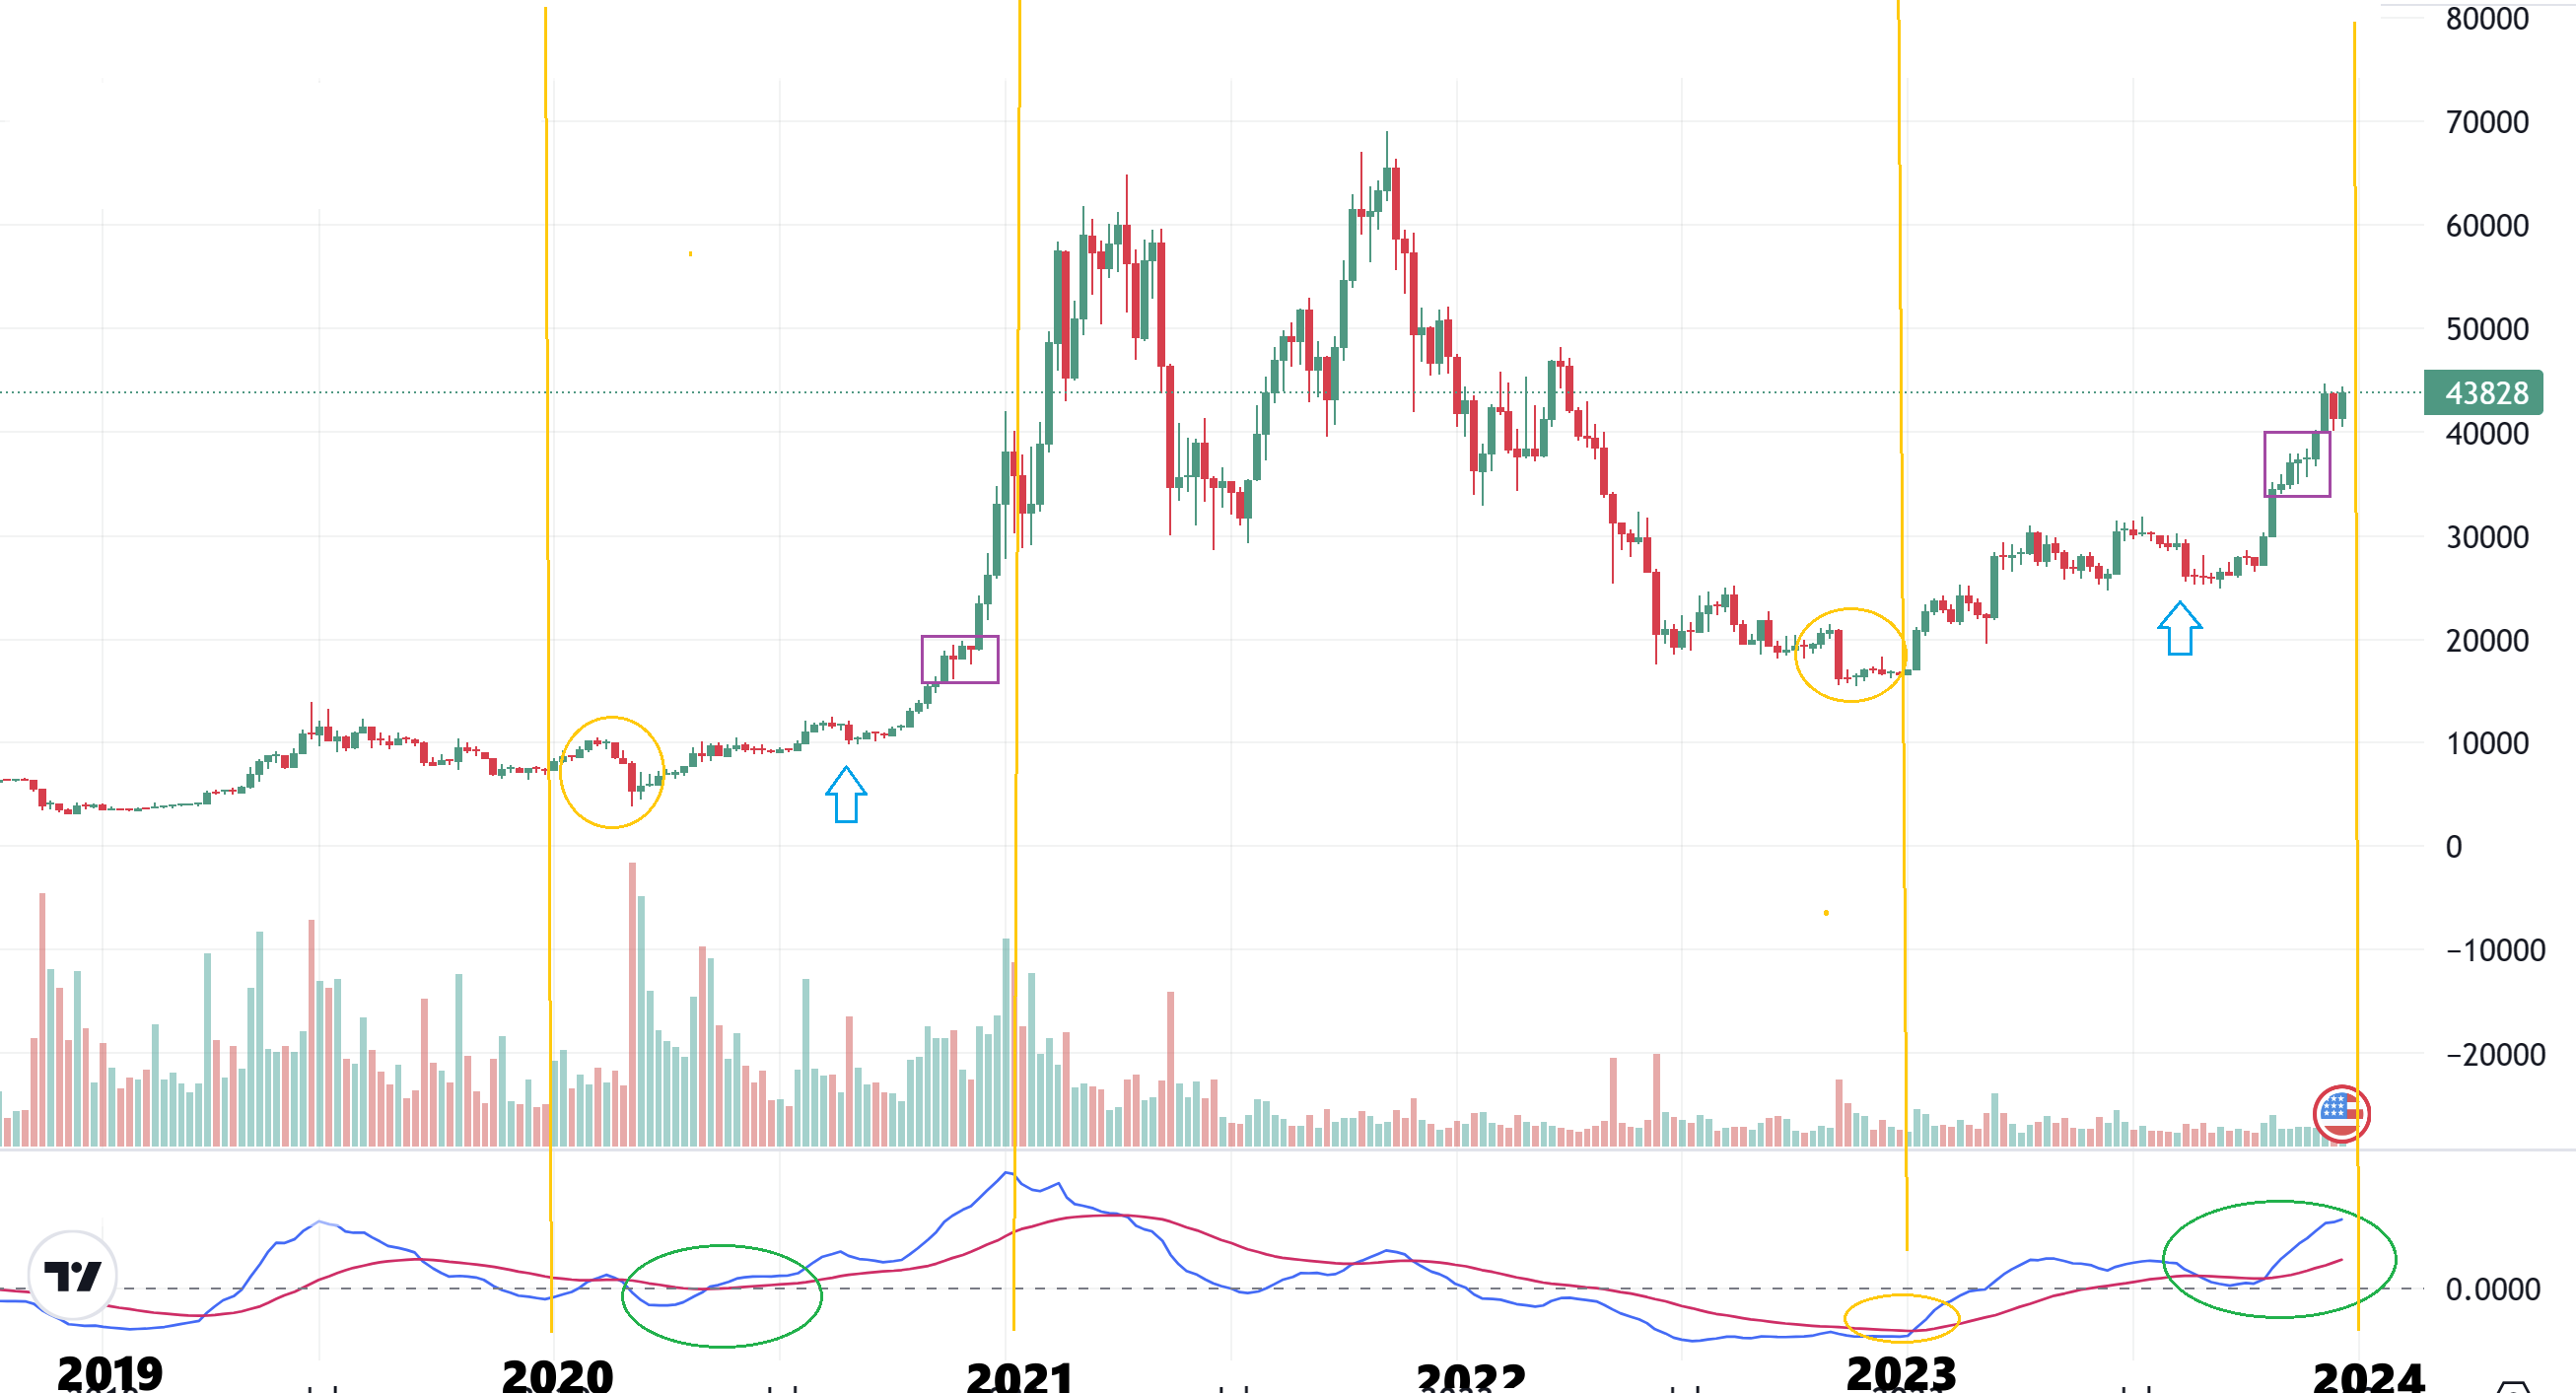
BITCOIN WEEKLY– The weekly chart is quite similar too, with the exception that we have a weekly flag right now above the purple consolidation box. In 2020 the pause was much shorter and didn’t show up on the weekly chart. That said, this push higher looks very similar to that first run up in 2020. I have put both runs between the 2 orange vertical lines.
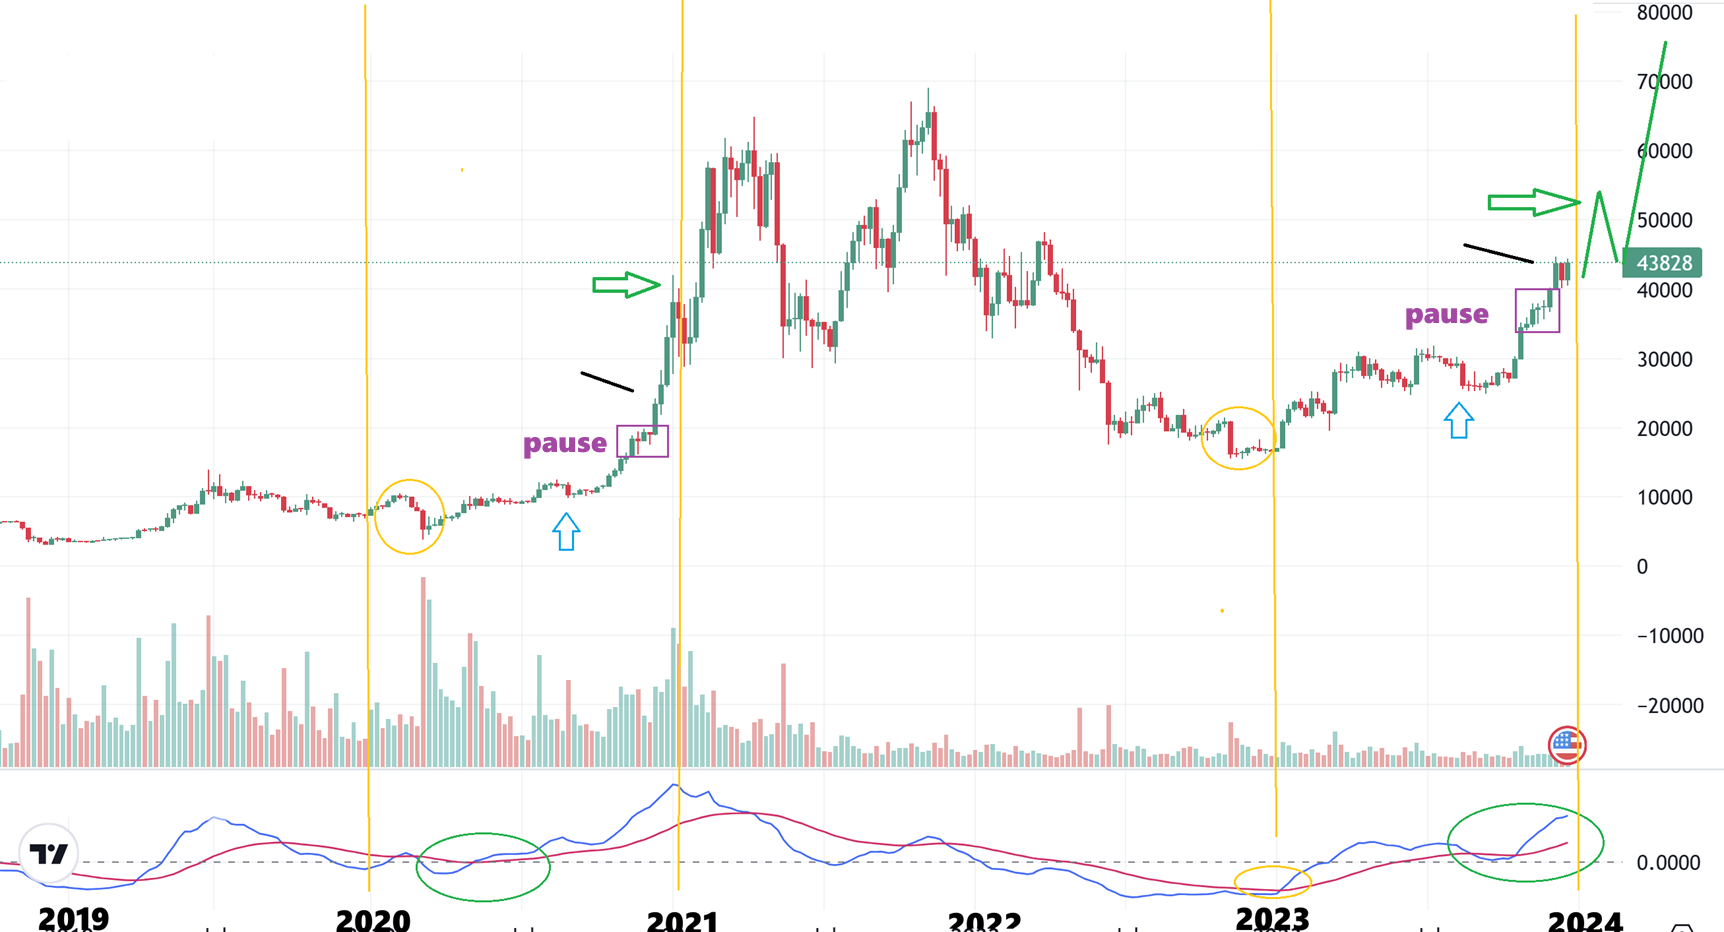
BITCOIN WEEKLY– This would be that weekly possibility if this ran straight up into the ETF over the next couple of weeks, and then dipped down into a low over time. I want to caution everyone about something though: When bitcoin drops? It can drop QUICKLY and lose 10,000-15,000 in a short period of time, so I personally will want to lock in some gains on the way up. Whether you do or not is your choice. Next—1 more amazing chart.
BITCOIN MONTHLY– I know that this looks extreme or maybe it looks like I’m out of my mind, but this is actually a conservative chart of Bitcoin by the end of this upcoming halving year and maybe into early 2025. I think that Bitcoin can run to $120,000 to $160,000, but for now this is a Monthly chart showing the similarities of that 2020 ramp up to now.
Take a look at the 2 Pink Boxes and you’ll see that the ramp up for the 2020 halving time period started with 3 strong months, and we also do already have that right now. I cannot and am not saying that this is exactly how it will play out, but the similarities are there on all time frames. I have said before that…
.
The above chart is not exactly how it will play out, but I have said before that this will make it easy for MARA, RIOT, BTBT, BITF, HUT, HIVE, etc etc to run back up to former highs and beyond, and those gains would be huge. That is why buying a basket has been so rewarding already, and that is also why buying that next dip into an ICL will be a strong buy too. These are choppy and can be very difficult to just buy and hold, but the gains have been solid. In fact…
.
LAST WEEK I said that BTBT, HUT, WULF, EBON, HIVE, etc and others were still possible laggers. I had them in the weekend report and other reports. How did they do if you just bought a small basket of the laggers on Monday?
.
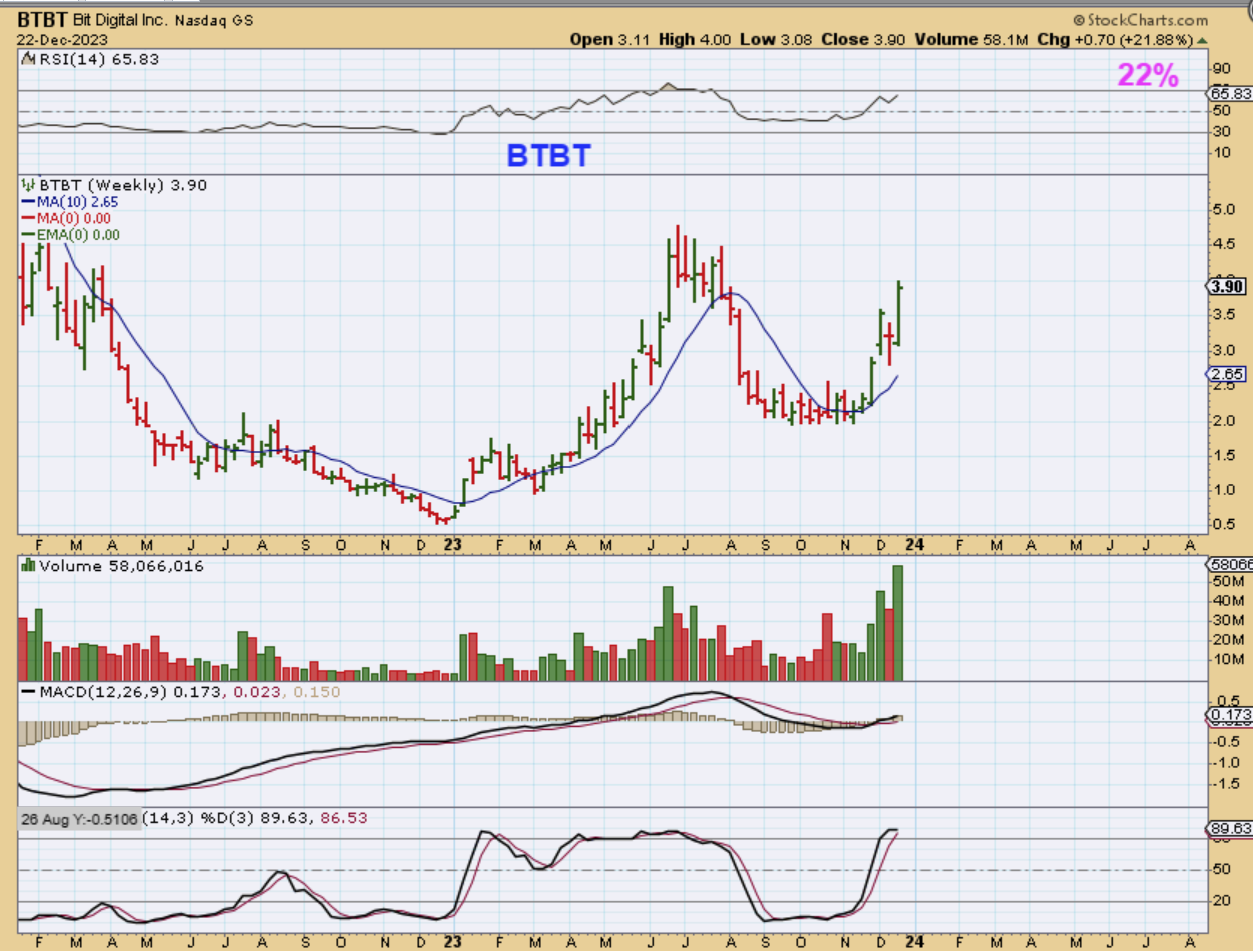
BTBT was up 22% last week alone and volumes are surging too.
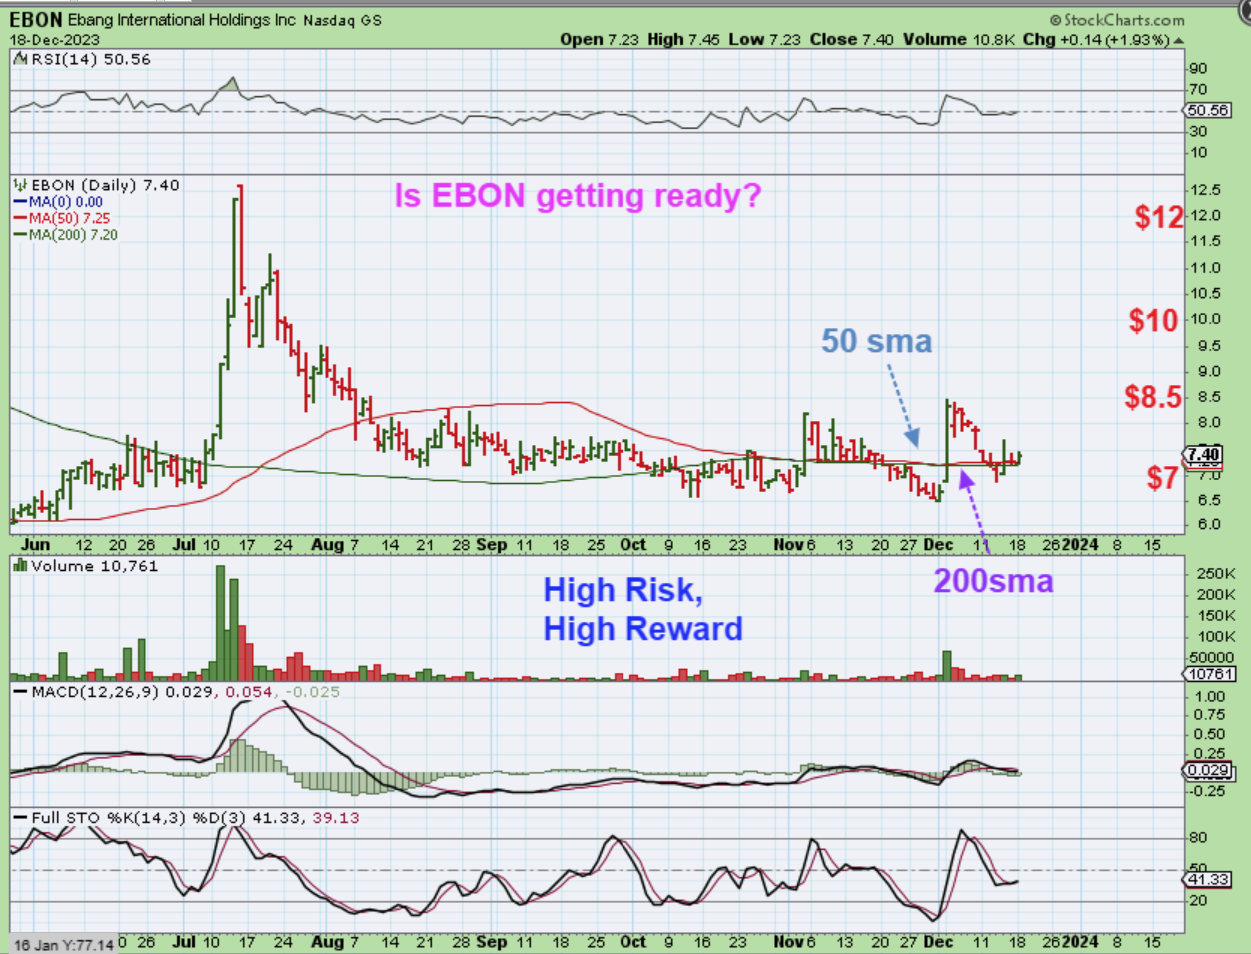
I used this chart of EBON in the $7 area to show the potential of it as a lagger , but sadly I didn’t buy it because volumes were really light.
.
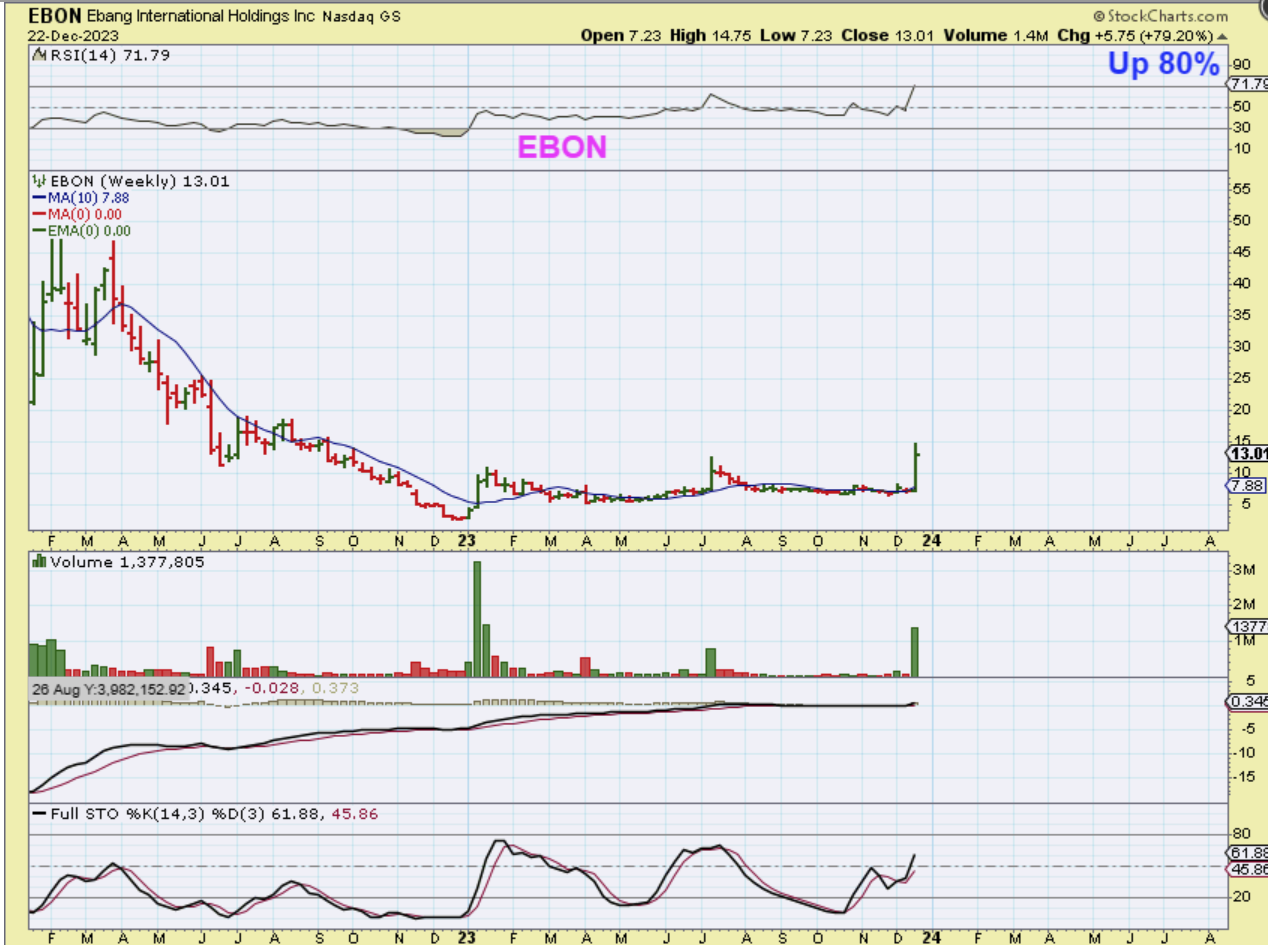
EBON Burst higher to $14.75 (100%), and then pulled back a little. The volumes increased 🙂
.
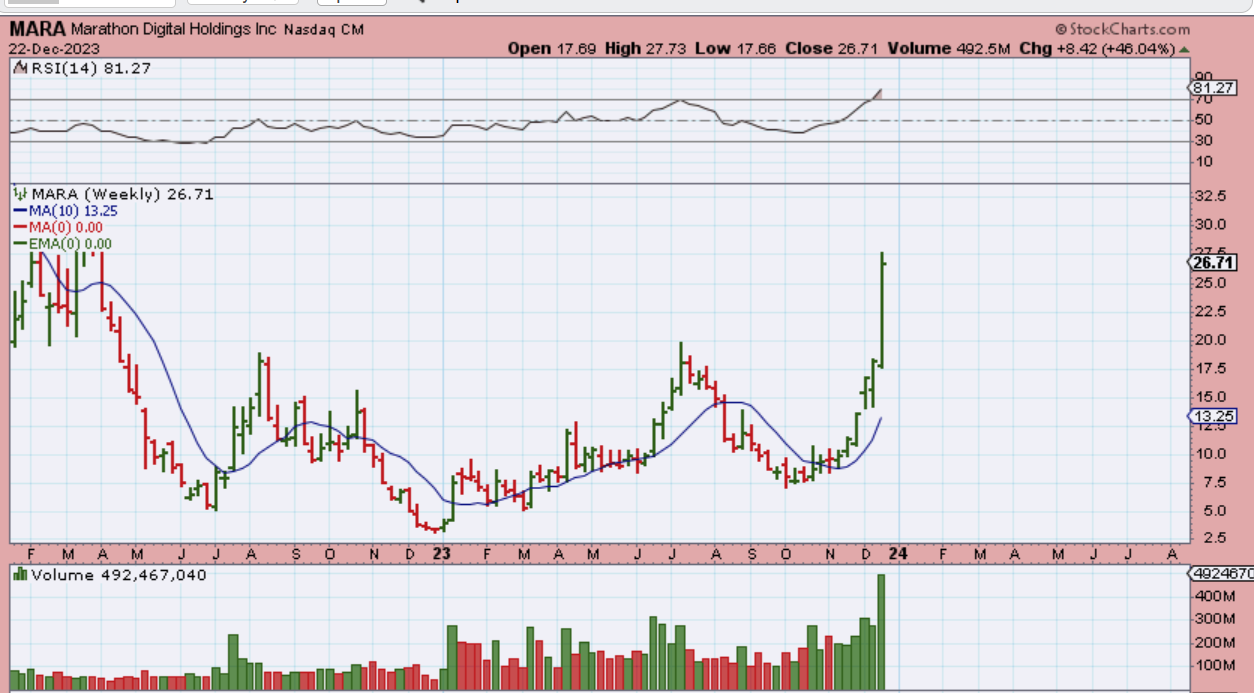
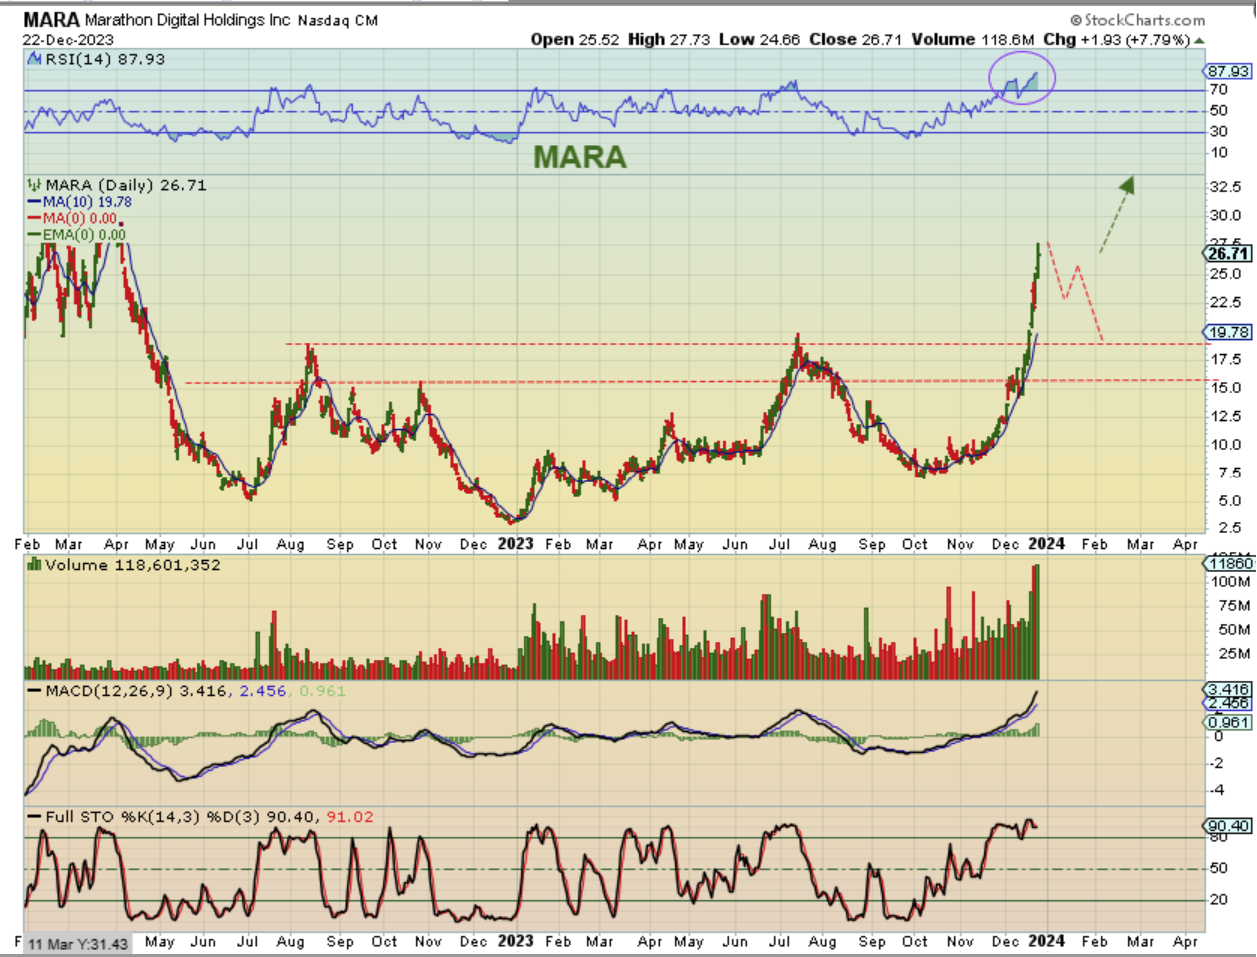
MARA has been in the basket of crypto stocks for a long time, and it was up another 46% last week alone! Some here bought this recently at $8, some near $10, and others 2 weeks ago on the midpoint consolidation at $14. Congrats!
I actually sold a good chunk near $23-$24 on this run and put in into a lagger after Mara just kept running higher.
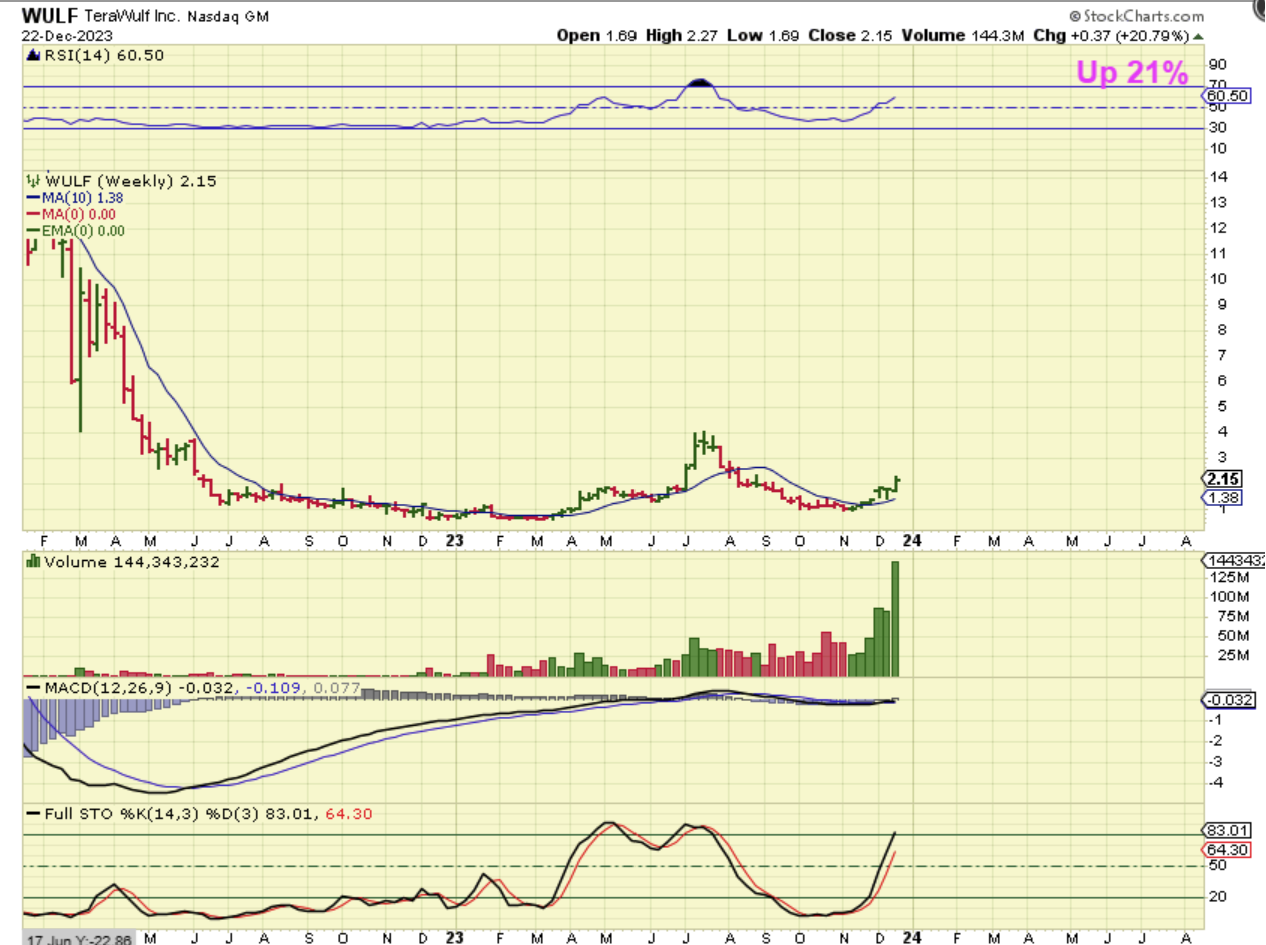
WULF is choppy on a day to day basis, but it was up 21% last week, and doesn’t it look like it has much higher to go in 2024? I’ve been regularly pointing this one out since it released earnings close to $1 area. Huge volume is streaming in now. Could this really run from $1 to the teens? Yes, I think that it can over 2024. So far we are up 100%.
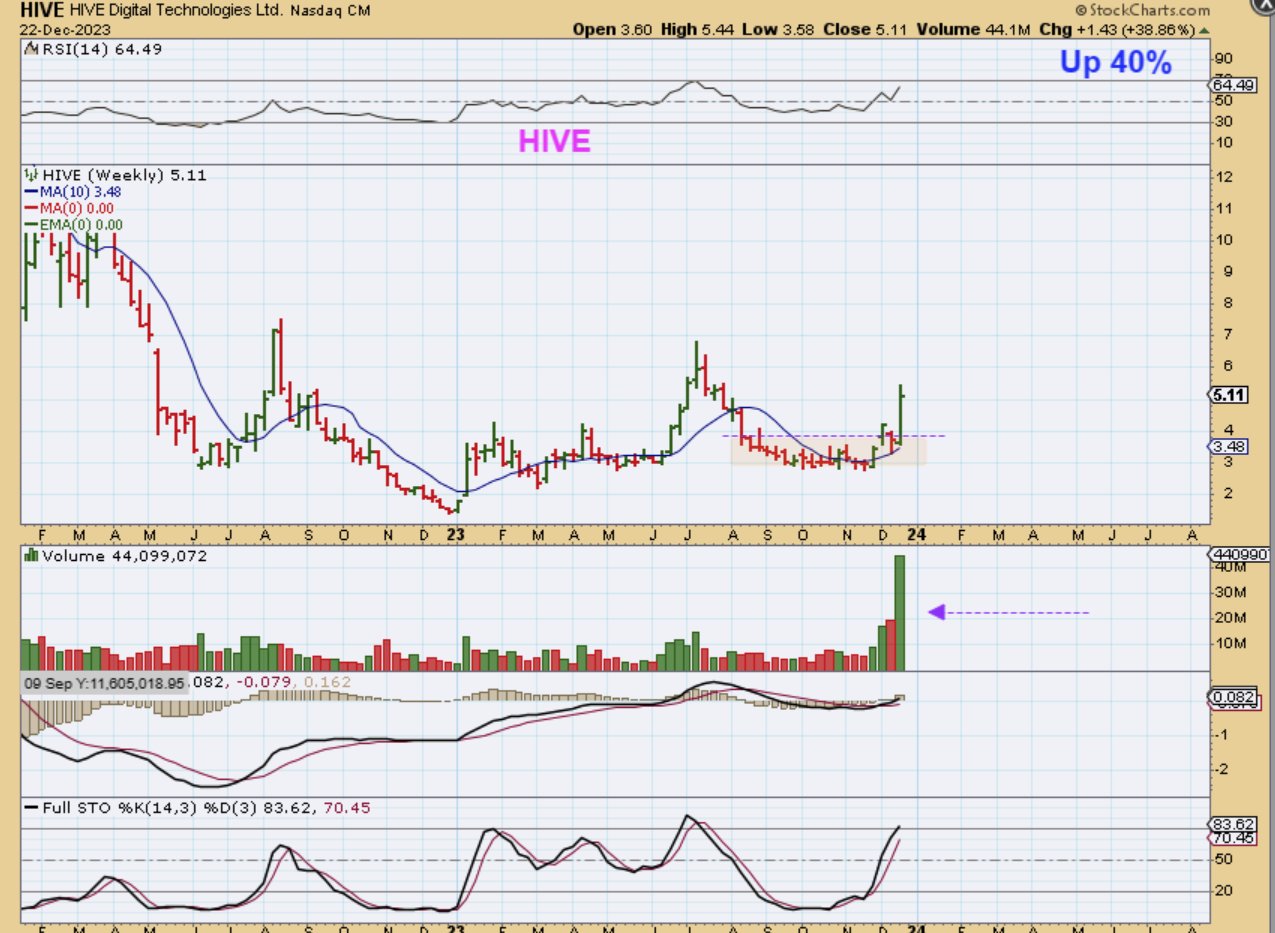
HIVE bounced right off of the 10 week ma as it back tested the base. Then last week it surged up 40% with a strong spike in volume.
.
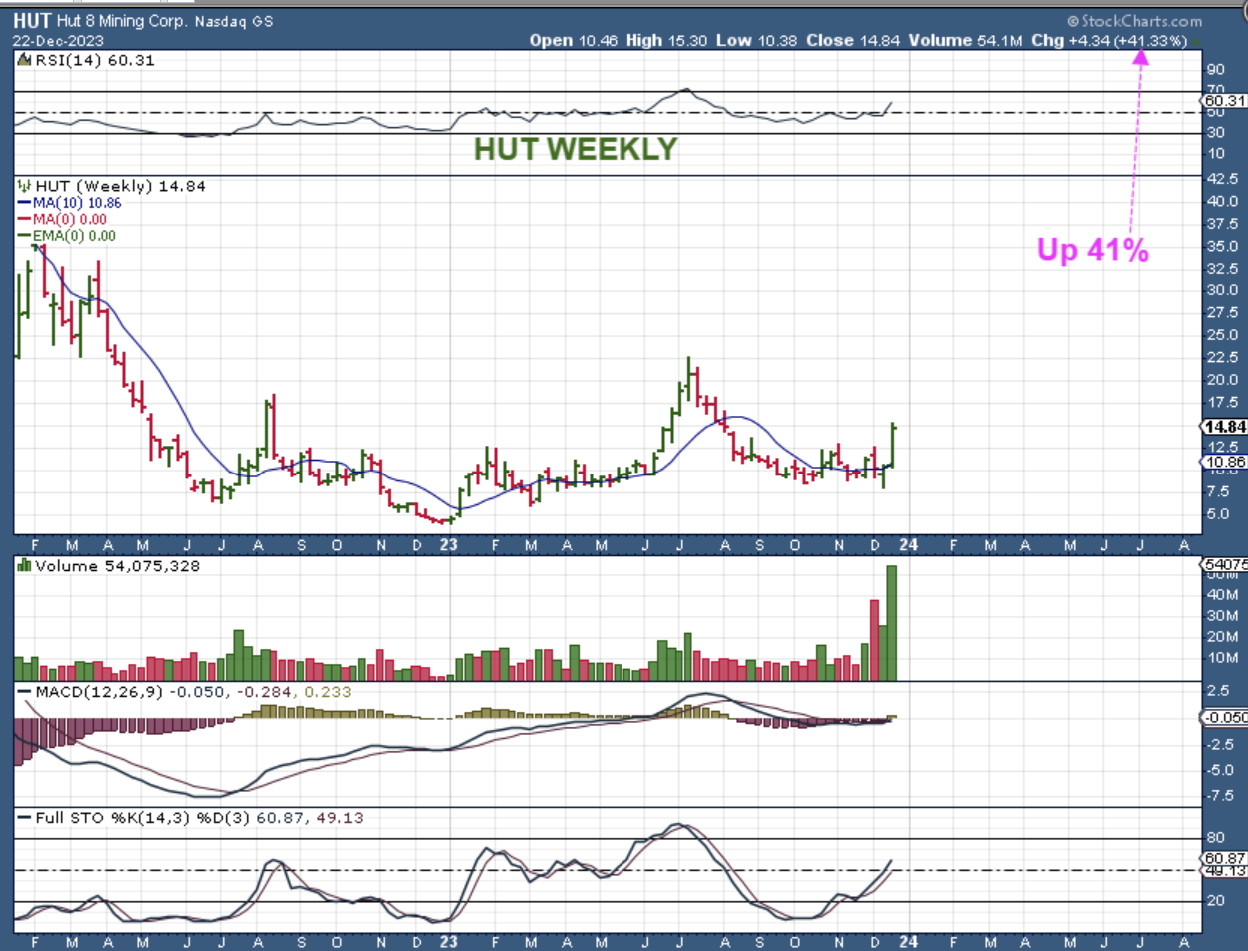
HUT WAS POINTED OUT ON DEC 18 AS A LAGGER POPPING FROM THE BASE…
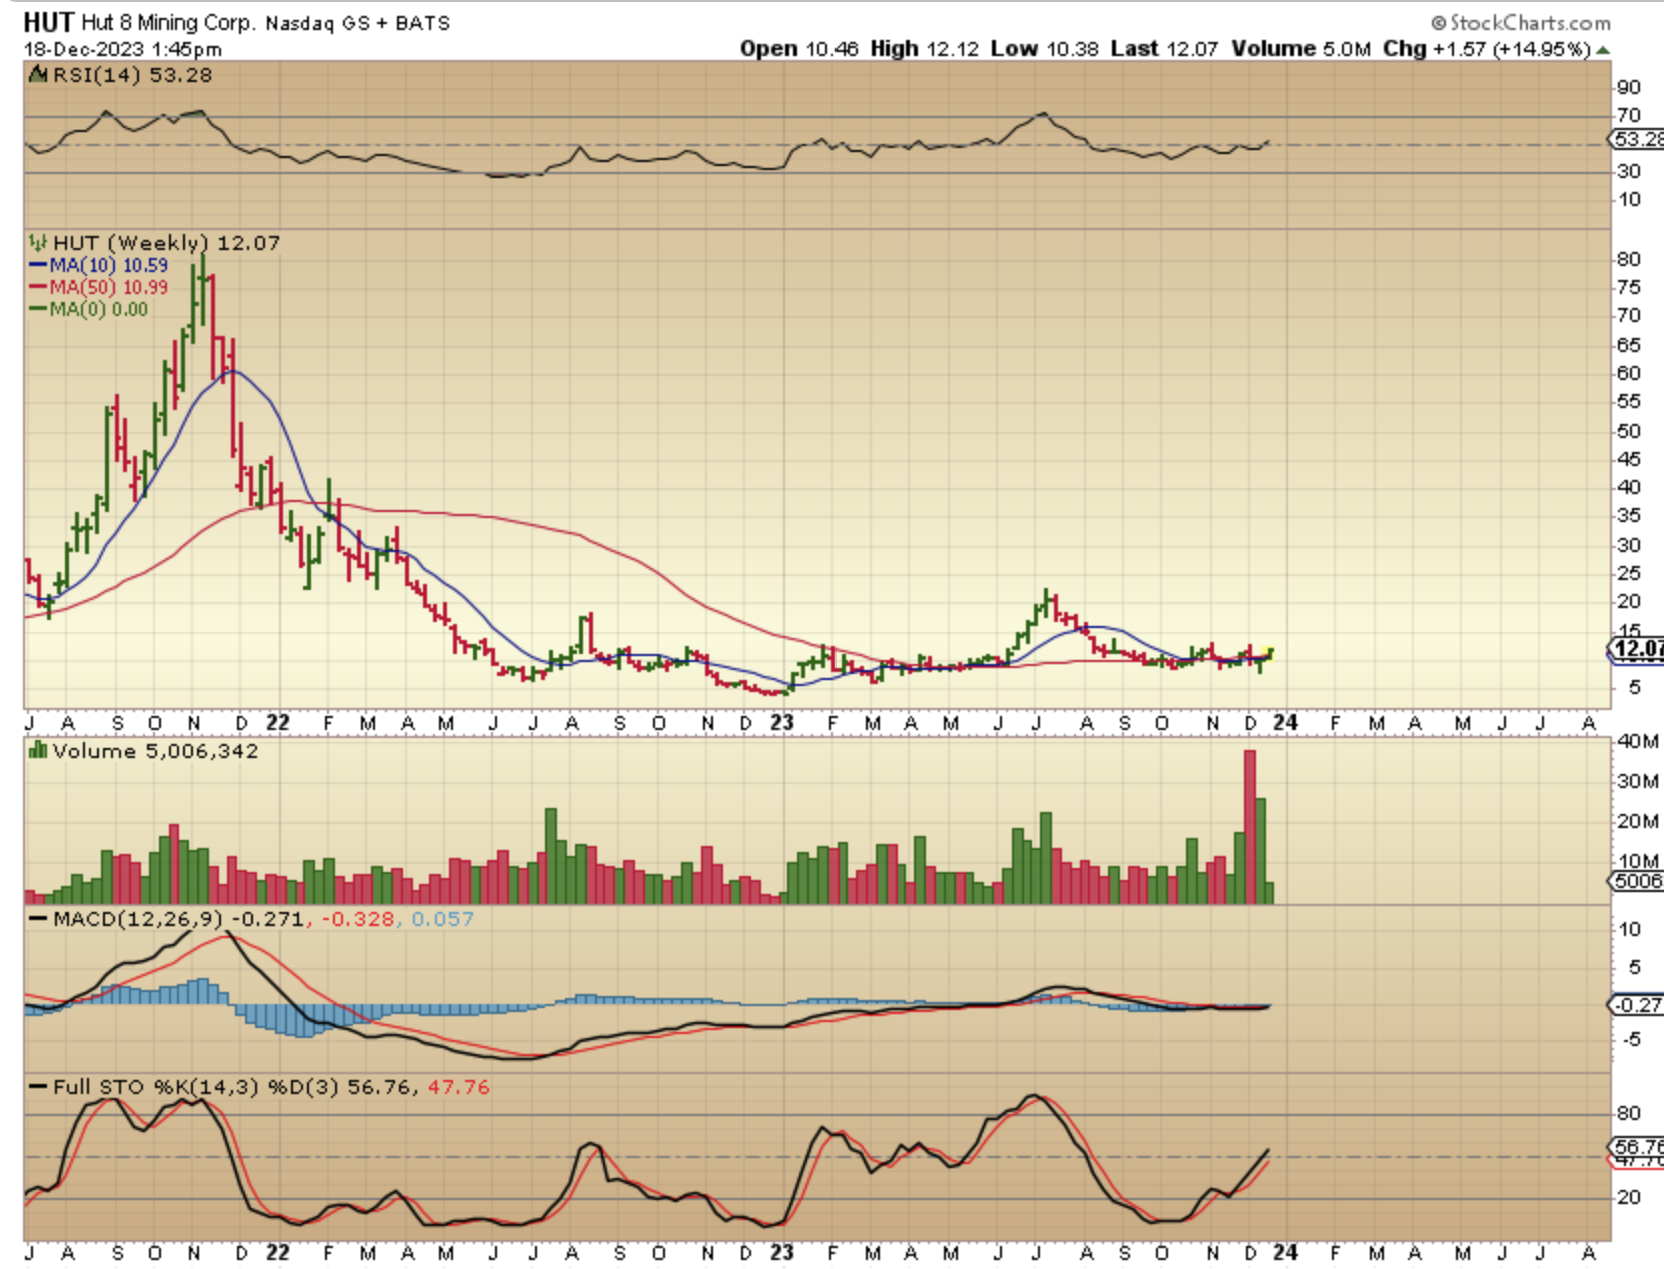
HUT shot up 41% after lagging at the lows of the base, so you can see why these will become a strong buy after a good drop into the next ICL.
.
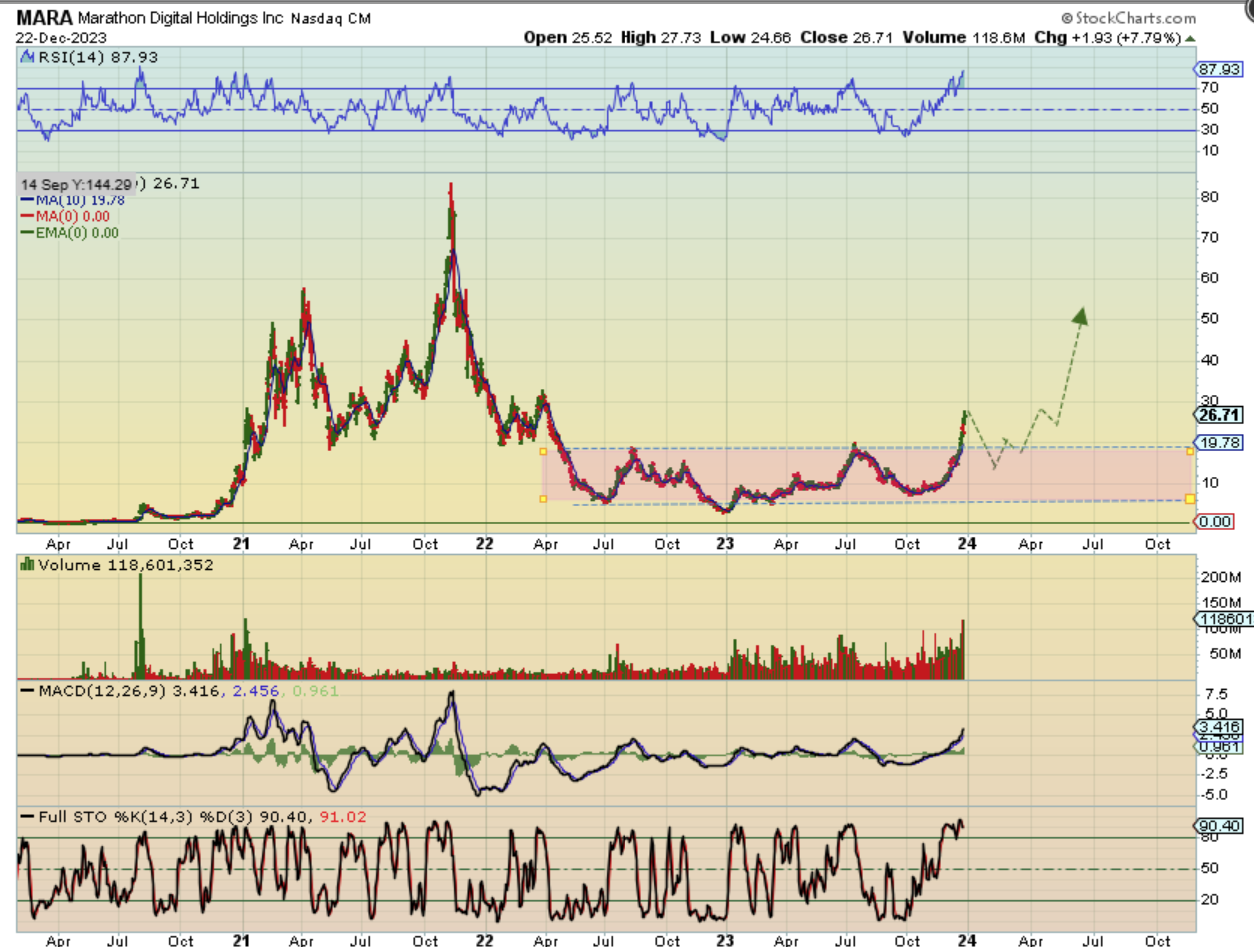
Obviously jumping into a crypto stock now that already has been running, like MARA for example, is very risky. Sure, this can just chop sideways and bull flag or put on a pennant and then continue higher, but it also might drop down and back test the breakout at the $18 area. Who wants to buy near $30 and watch it drop to the teens? Ouch. So maybe try a lagger if Bitcoin continues higher into January, or wait and be ready to buy at the next ICL, because…
.
…Or wait and be ready to buy at the next ICL, because when I look at MARA, that really just looks like price breaking out from a base. A back-test and run to the highs could be very profitable too!