Tuesday Dec 5th
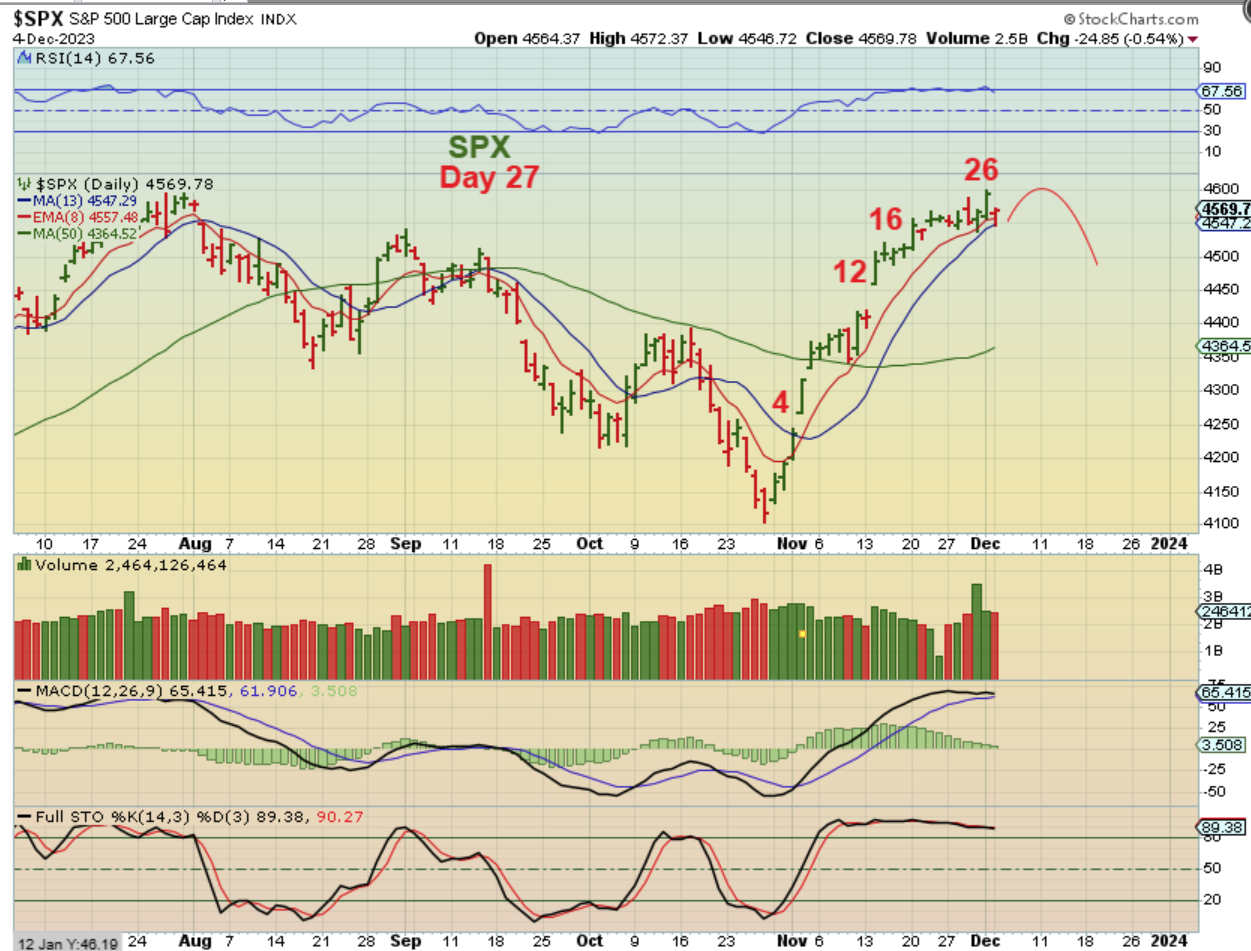
Note: When I look at the General Markets, I see that we are on day 27. Most daily cycles may average 35-40 days( 2 more weeks to a low?), but we know that we also have seen a few extend to 50 days in 2023. So at this point when I look at the data this week, I do see some areas where the markets can stall or stagger, but again, we could have 2-3 more weeks of trading until a dcl is due. At day 27 I usually become more cautious, but not overly concerned. Let’s go to the chart…
.
SPX – Day 27 dropped and reversed higher at the 13sma just like we saw 2 days ago, so we are still seeing buying at the highs and this can go higher. Like I mentioned in the intro though, time is gradually running out for one last strong push higher in the first daily cycle.
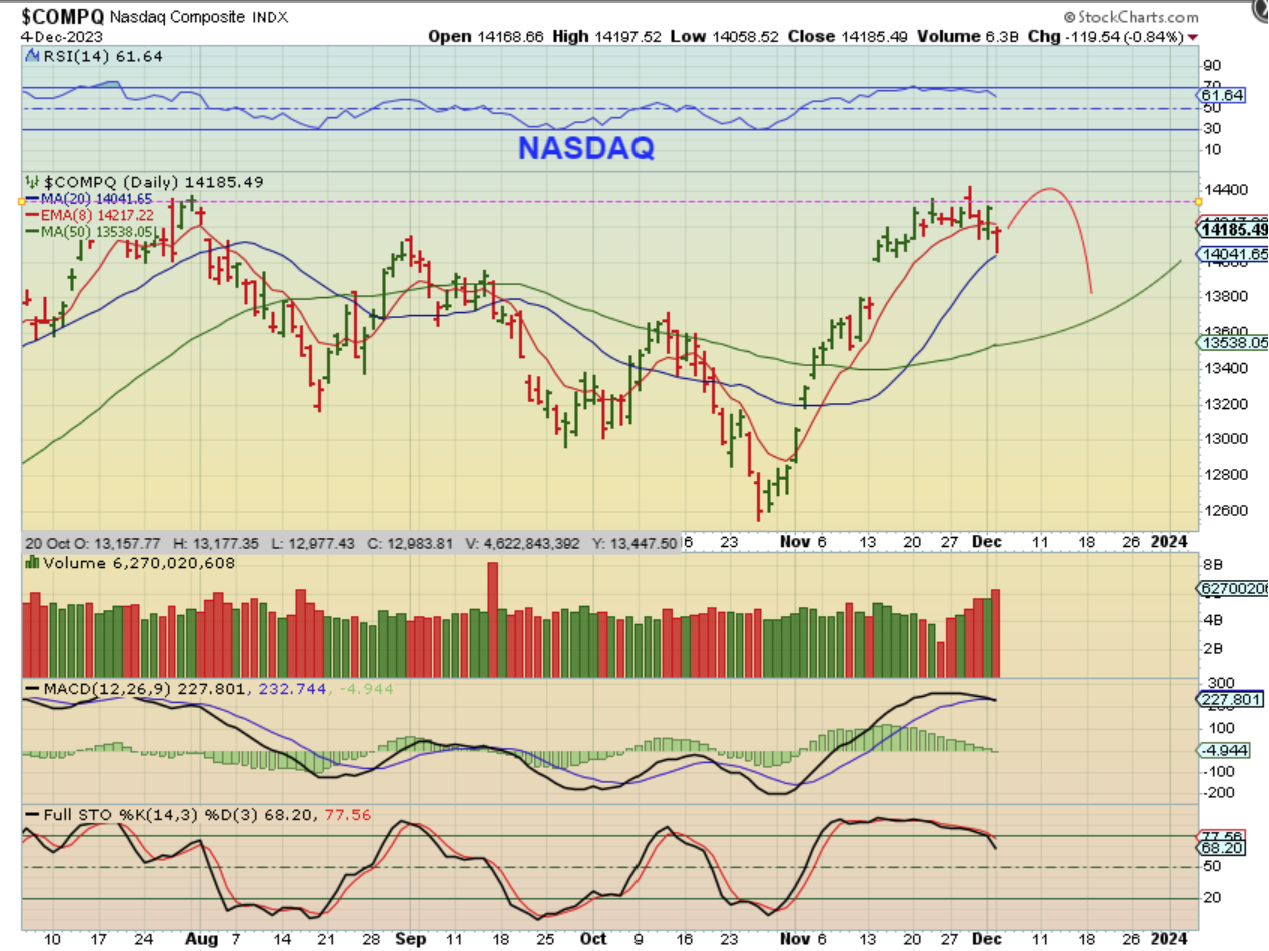
The NASDAQ: Notice that this actually dipped lower than the 13sma and tagged the 20sma before reversing. We can still see a good bounce before it rolls over, but a dcl will be coming due in a couple of weeks and may even fill that open gap.
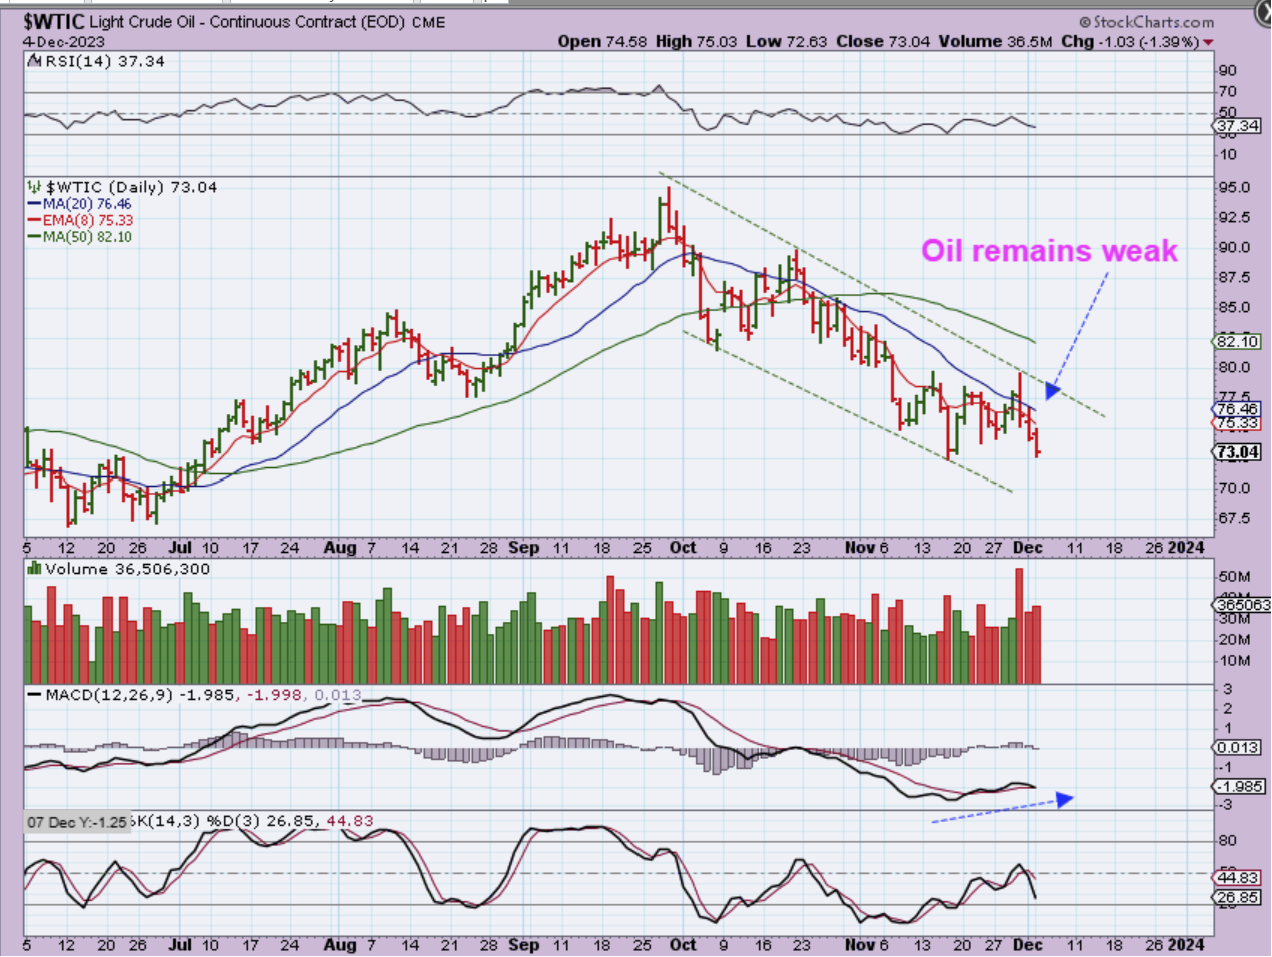
WTIC – Oil is weak and could not make progress. It is not oversold, so Oil may drop back to the June lows with a complete round trip.
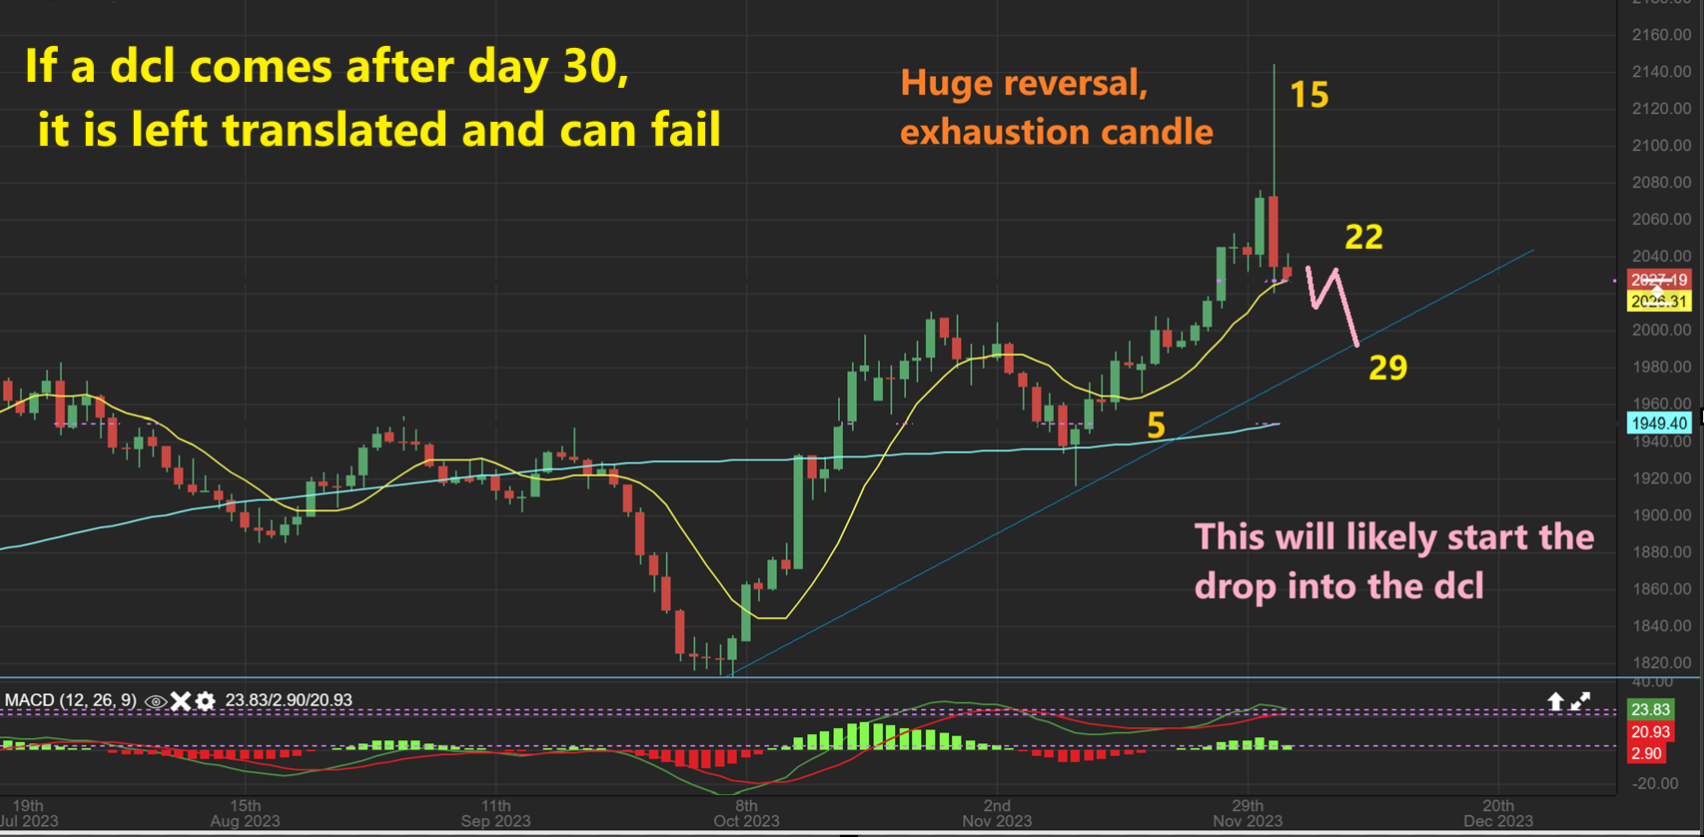
This is where things get tricky with Gold blasting off Sunday night, but then selling off again. Why? That gives us a massive exhaustion / reversal candle in Gold that can take time to recover from, but that didn’t change the look of The USD. Let’s take a look.
.
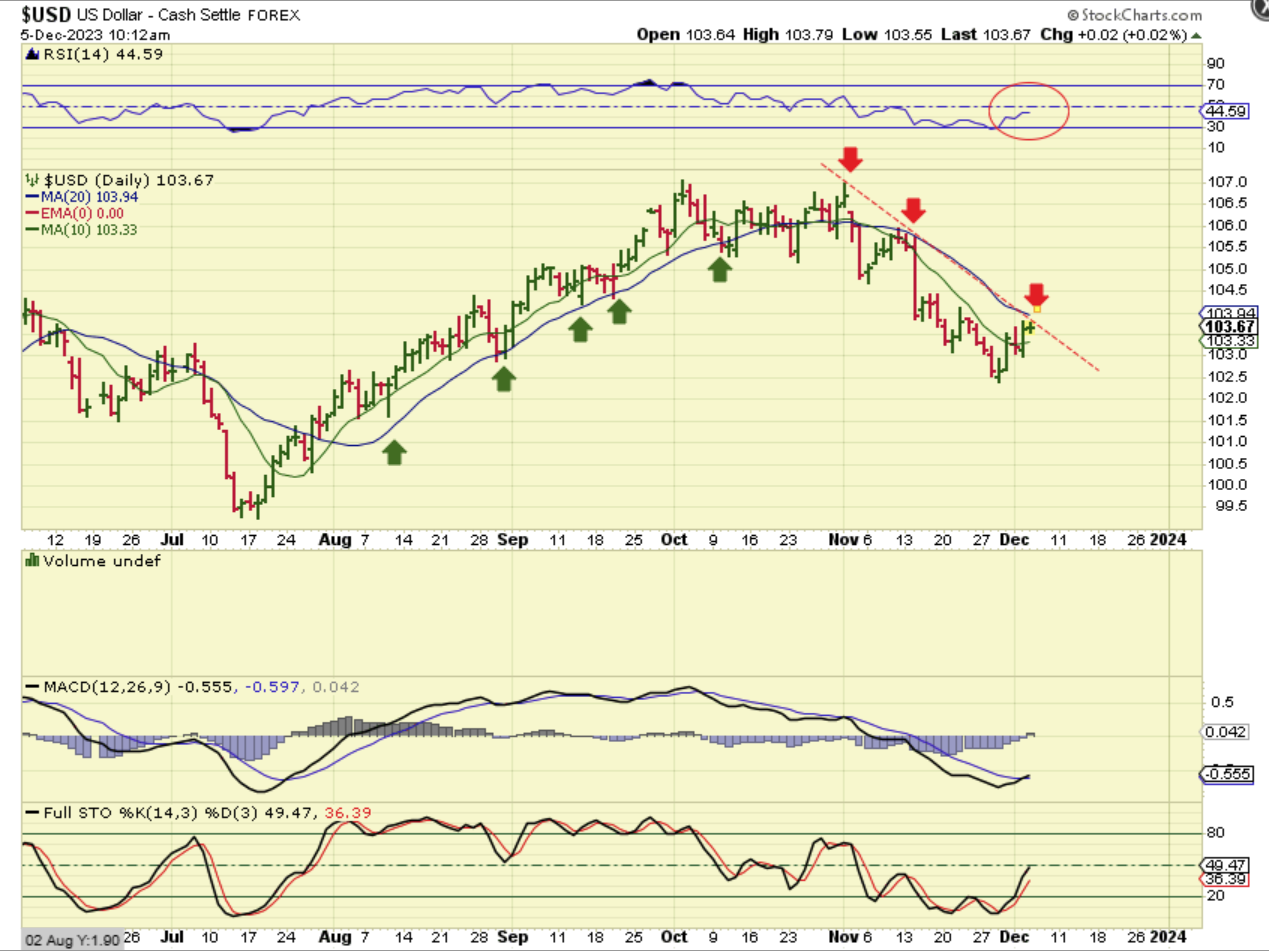
THE USD – I was thinking that we have a dcl forming, but I was also thinking that it would remain weak and eventually roll over. So far the USD is still trading below the 20sma and an overhead trend line. Now we’ll see how this plays out, because Gold had a major pop and drop…
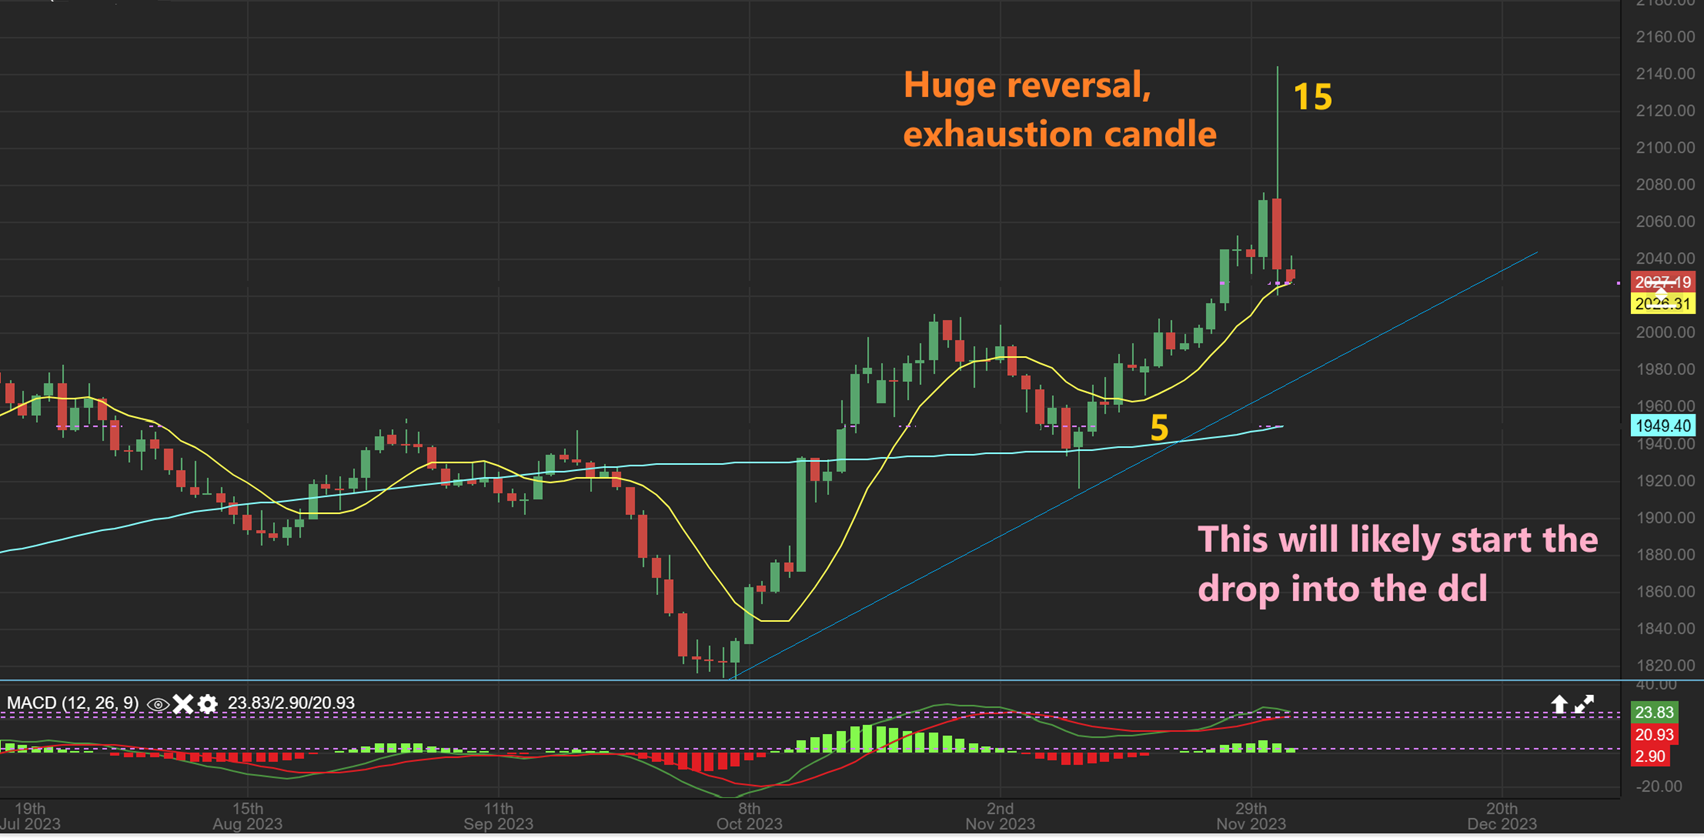
So GOLD took off on Sunday night (day 15) and ramped up $20, $40, $60, $70+, from Fridays close at $2071 to $2143, but then it started to sell off. This gives us a huge reversal candle before trading even started in the U.S. This was when the Asian markets were open, and that is all that I attribute it to. No conspiracy theories from me. Gold was hot and taking off when the Asian markets were open, and then it sold off. That is all I care about, and what does this mean to me? Well, it is a reversal candle, so…
.
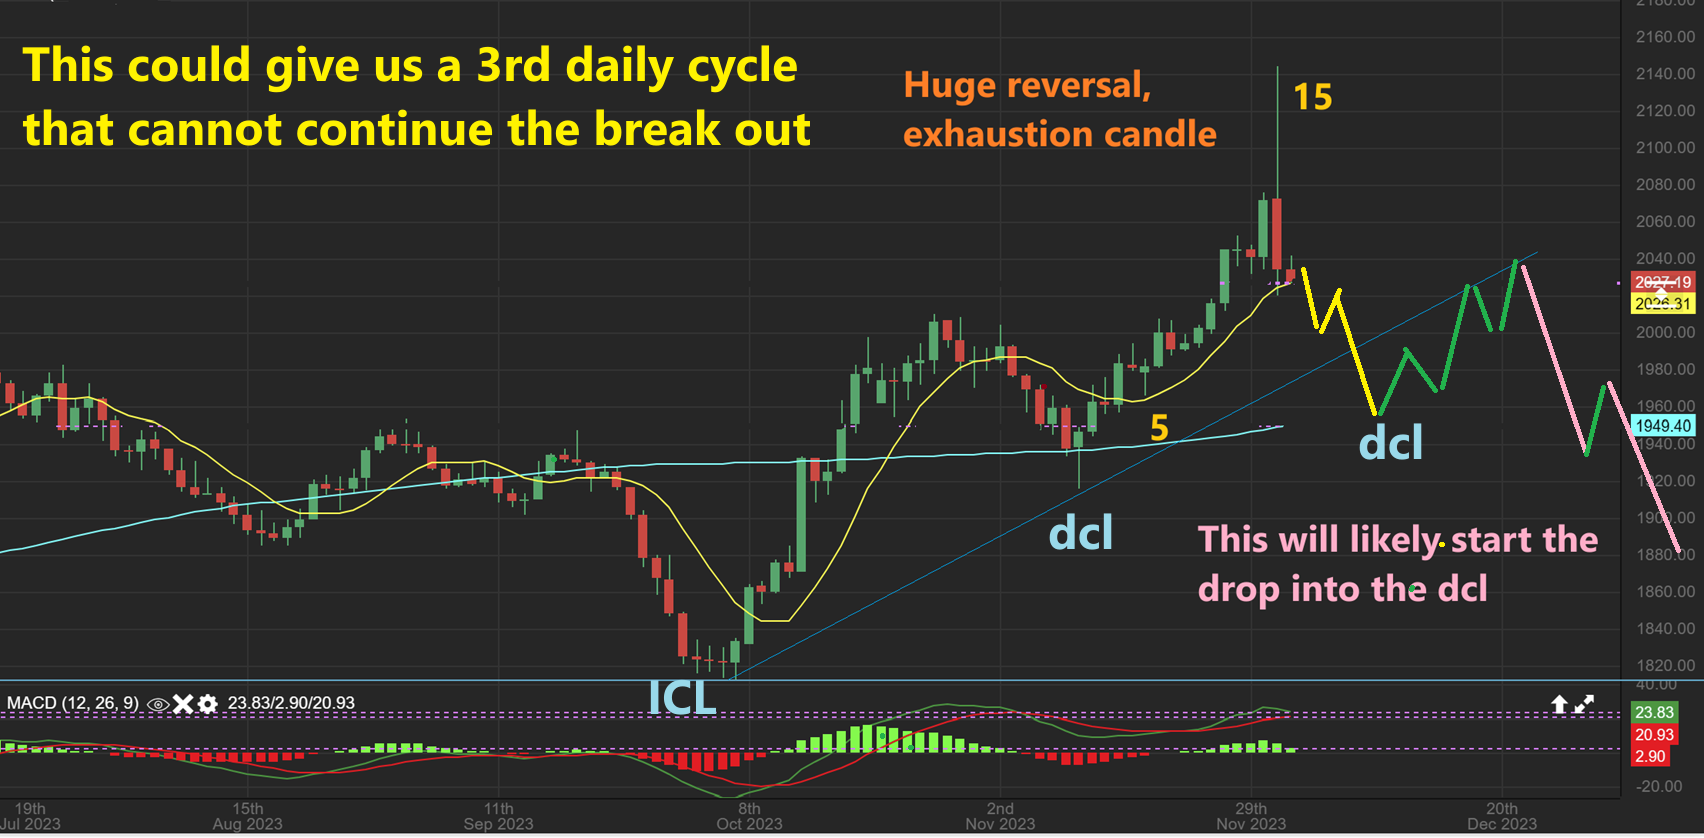
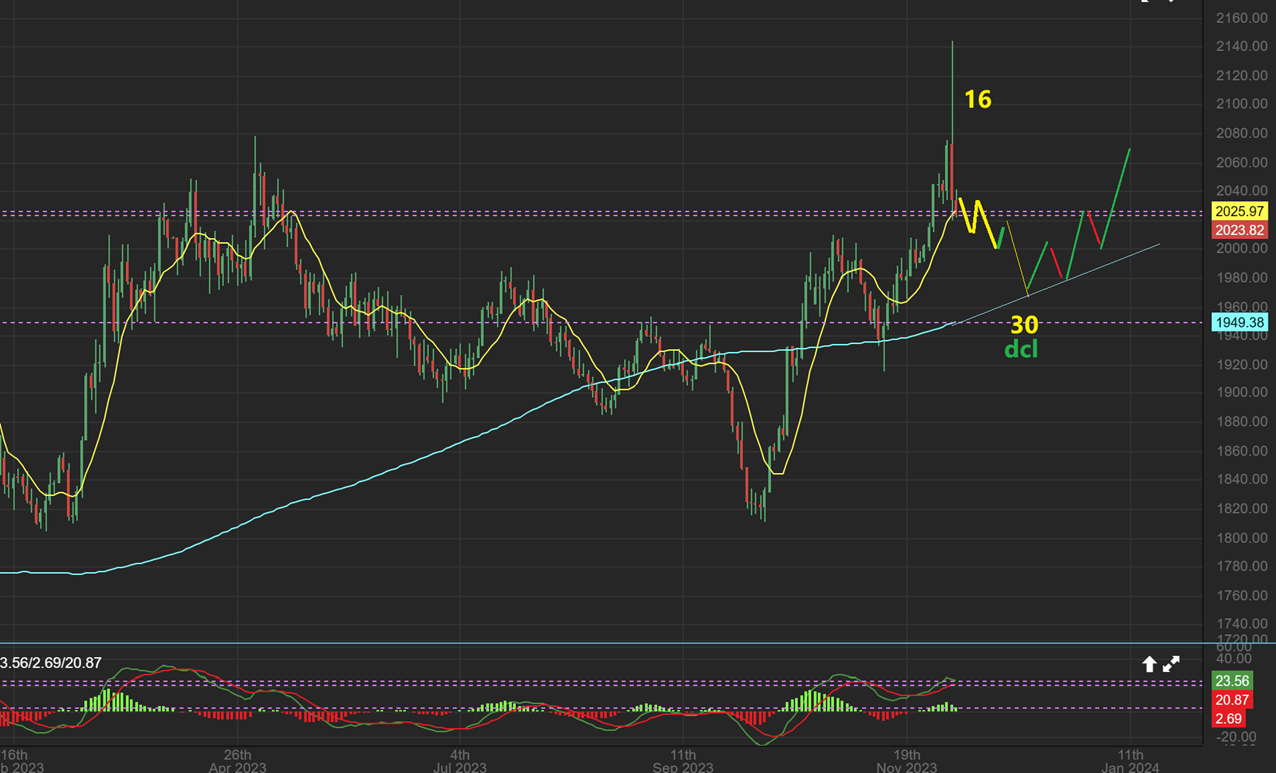
Well, it is a reversal candle, so if this drops down and forms a dcl before day 30, it will be R.T. Then we can wait and see what the 3rd daily cycle does. Will that be enough consolidation and chop to allow the large reversal to be consolidated, or is this the ‘Peak’ on this intermediate cycle?
Option #1 – Just sell here and watch to see if this becomes L.T. or R.T.
Option #2 – Ride it down to a dcl. If it is L.T. (peaks early) you would sell daily cycle 3. That has a bit more risk of downside depending on when you sell, so let me draw that…
.
Gold could drop to say day 32 as a dcl, maybe at the 50sma. We have a peak on day 15, so…
.
That gives us a L.T. 2nd daily cycle. We would then expect the 3rd daily cycle to be unable to make new highs. It may chop around and bounce up to the trendline or bounce around as drawn here, but that would be another place to sell (maybe even buy JDST or DUST for those desiring to). A H&S forms with the 3rd daily cycle.
.
THIS WOULD BE THE WEEKLY CHART BAD NEWS:
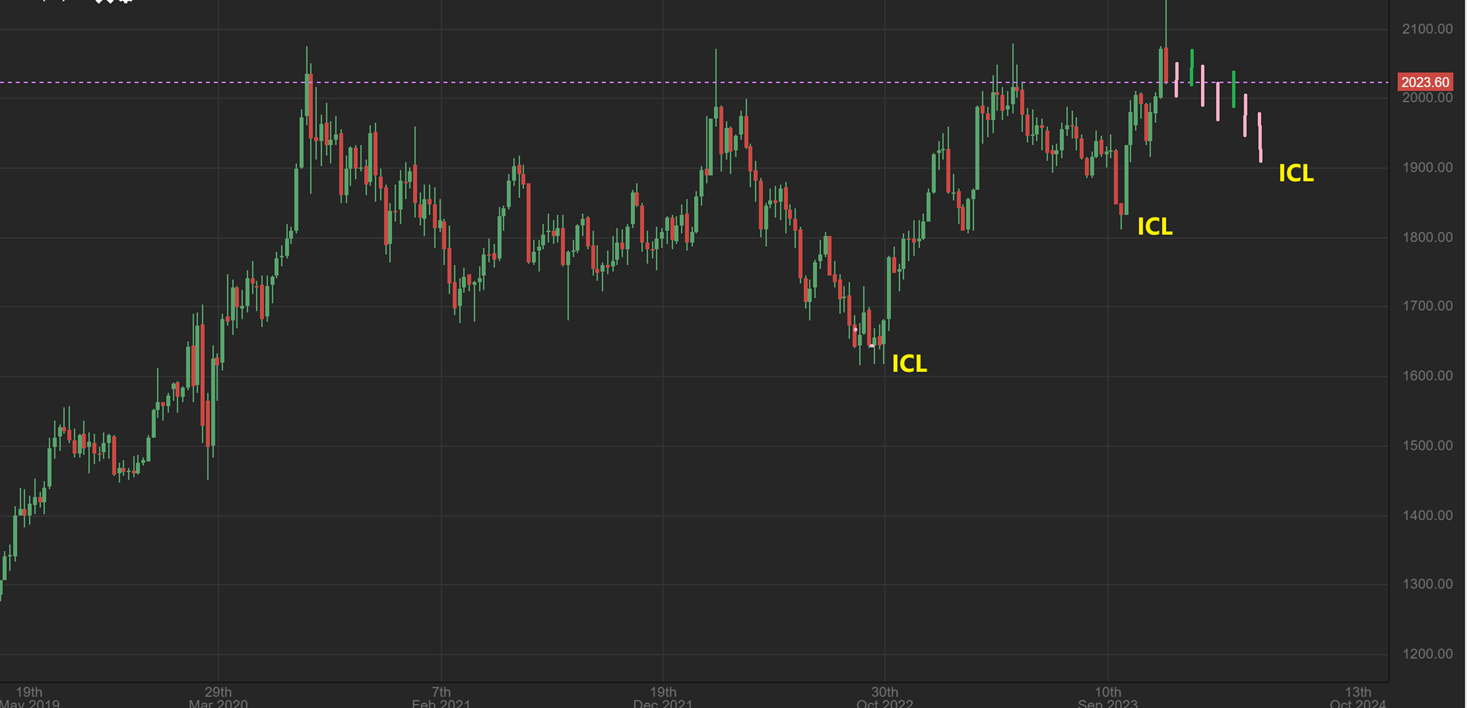
That reversal becomes the ‘peak’ of this Intermediate Cycle on daily cycle 2, and the 3rd and 4th daily cycle make lower highs and eventually lower lows that drop into the next ICL. We have to face that as a real possibility.
Jumping over to the GDX ETF:
If you followed my reports, You bought a basket at the ICL, maybe added at the dcl. You could just lock in your gains now and then watch how this plays out. Or sell 1/2 and watch how it plays out. You can also ride it out and see if Miners try to consolidate up high and break out during daily cycle #3, or even this daily cycle #2.

.
These are the main points to take from todays report.
Gold broke out higher on Sunday during Asian trading, but the buying exhausted and selling took over immediately. This gave us a massive reversal candle that is also considered a ‘false break out’. Both of those are short term negatives and usually take time to repair. It can be the peak to this entire Intermediate cycle. If that is the case here, we definitley may have just seen the ‘peak’ for this entire intermediate cycle during the 2nd daily cycle, with 2 more choppy daily cycles that follow. Some may want to lighten up or outright sell everything Miners, since you can always get back in later if things firm up. Selling here at day 16 for Gold means that you would watch how this plays out from the sidelines until it puts in the next dcl. You are assuming that the top is in on daily cycle #2 and may buy daily cycle 3. You would then be looking to see if this daily cycle becomes L.T. or R.T. when the next dcl forms, because that would influence the strength or weakness of the 3rd daily cycle. This is a bullish view, but it would involve allowing the 2nd daily cycle to bottom out, consolidate into the 3rd daily cycle and see if dc #2 was R.T. or not. The 3rd daily cycle will either recover or roll over too.
.
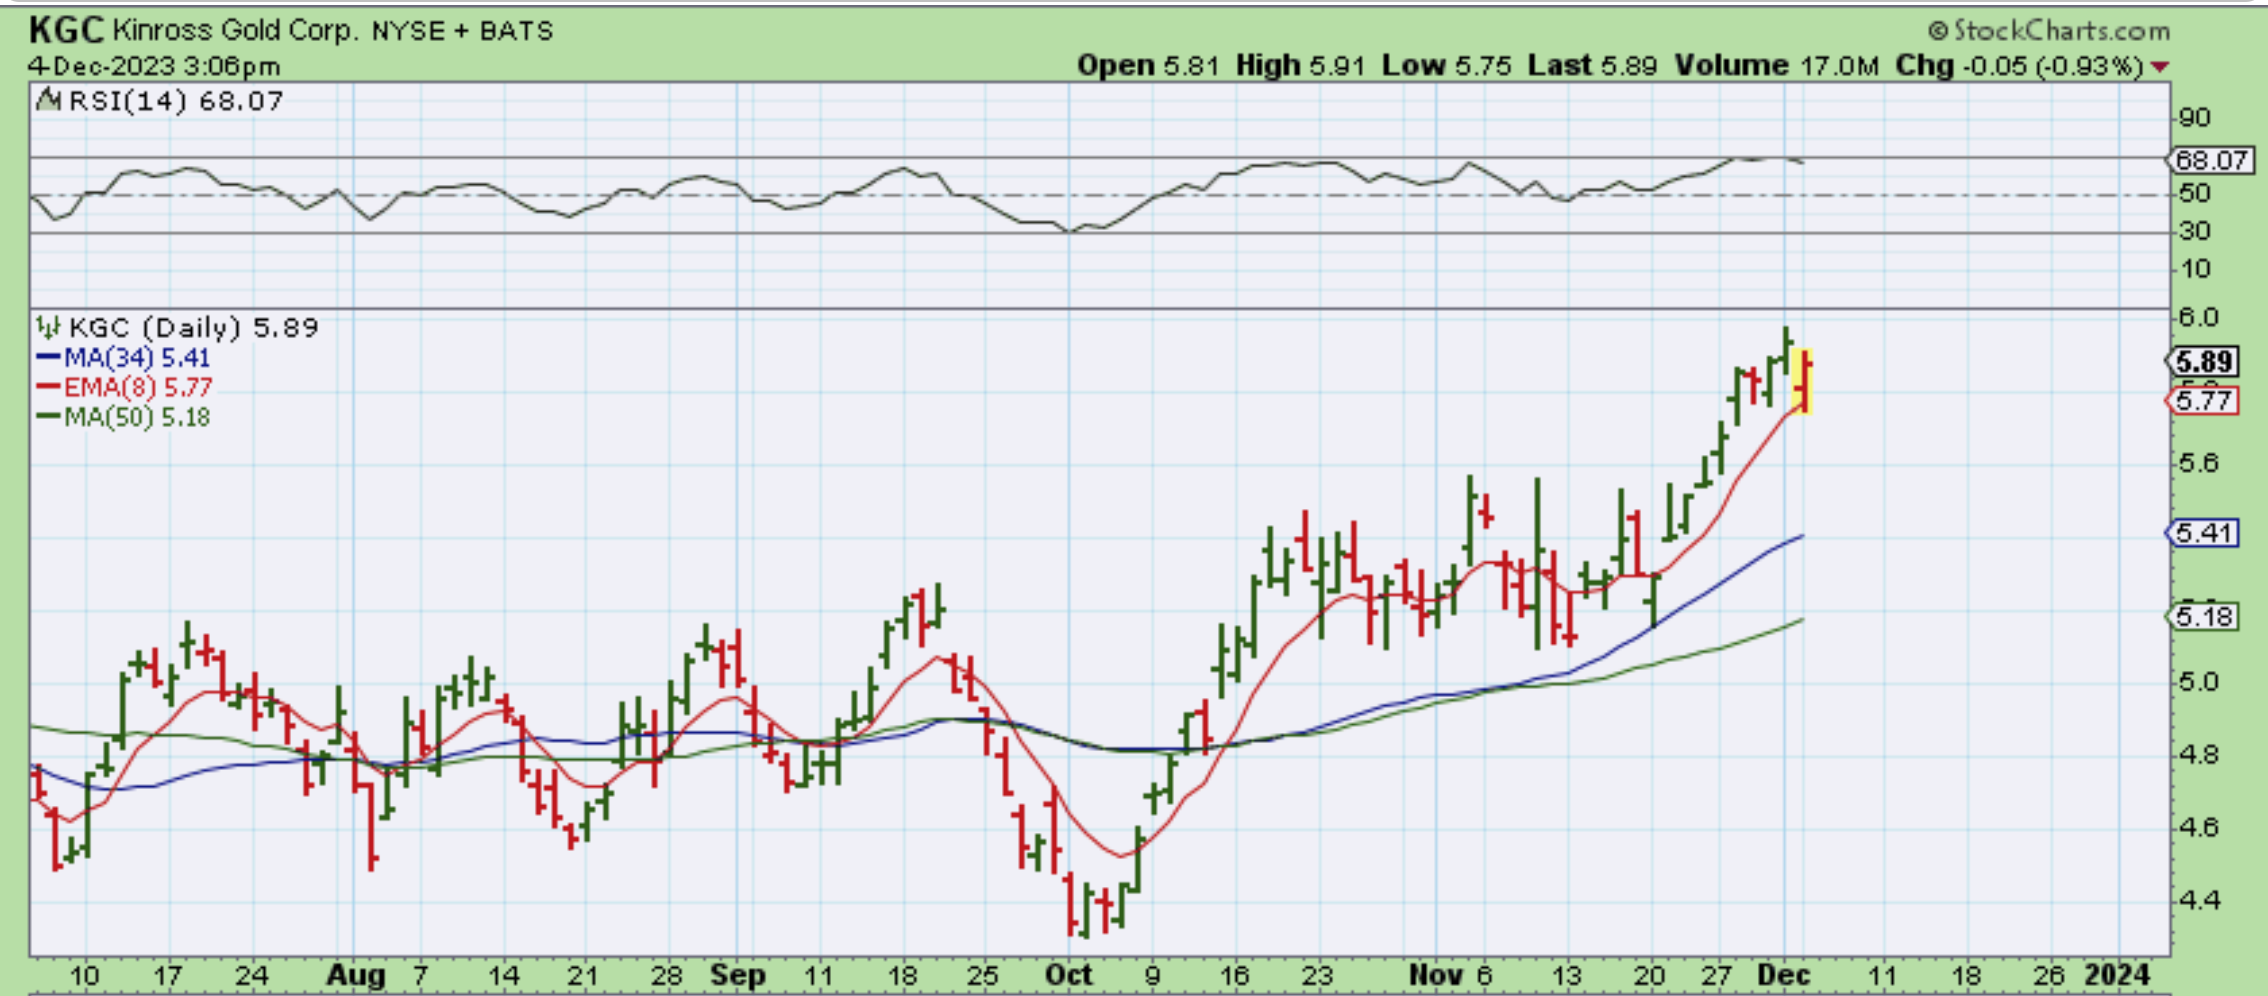
We are talking about selling Miners when some are still up near the highs, like KGC, EGO, HMY, etc, so it’s not easy to sell here. Some dropped and reversed yesterday, like KGC. What if some Miners continue to climb even though Gold consolidates and chops around? That is possible, but with a strong exhaustion reversal, there is also the chance that these are THE highs and you are getting out before the drop into the next dcl takes these lower to the 50sma.
.
We really need time to see ‘exactly’ how this will play out, but exhaustion candles are usually exactly that, exhaustion. We see a move in a direction that is now exhausted for a while. Gold will become choppy or droppy. I lightened up considerably and may just outright sell it all and wait for the next dcl. I have other trade ideas that I can put my money in, and I’ll discuss a few below. MJs and Solars are looking good again too. Crypto trades and other trades are still playing out well. I will cover a bit more below. Enjoy your Tuesday trading.
.
~ALEX
.
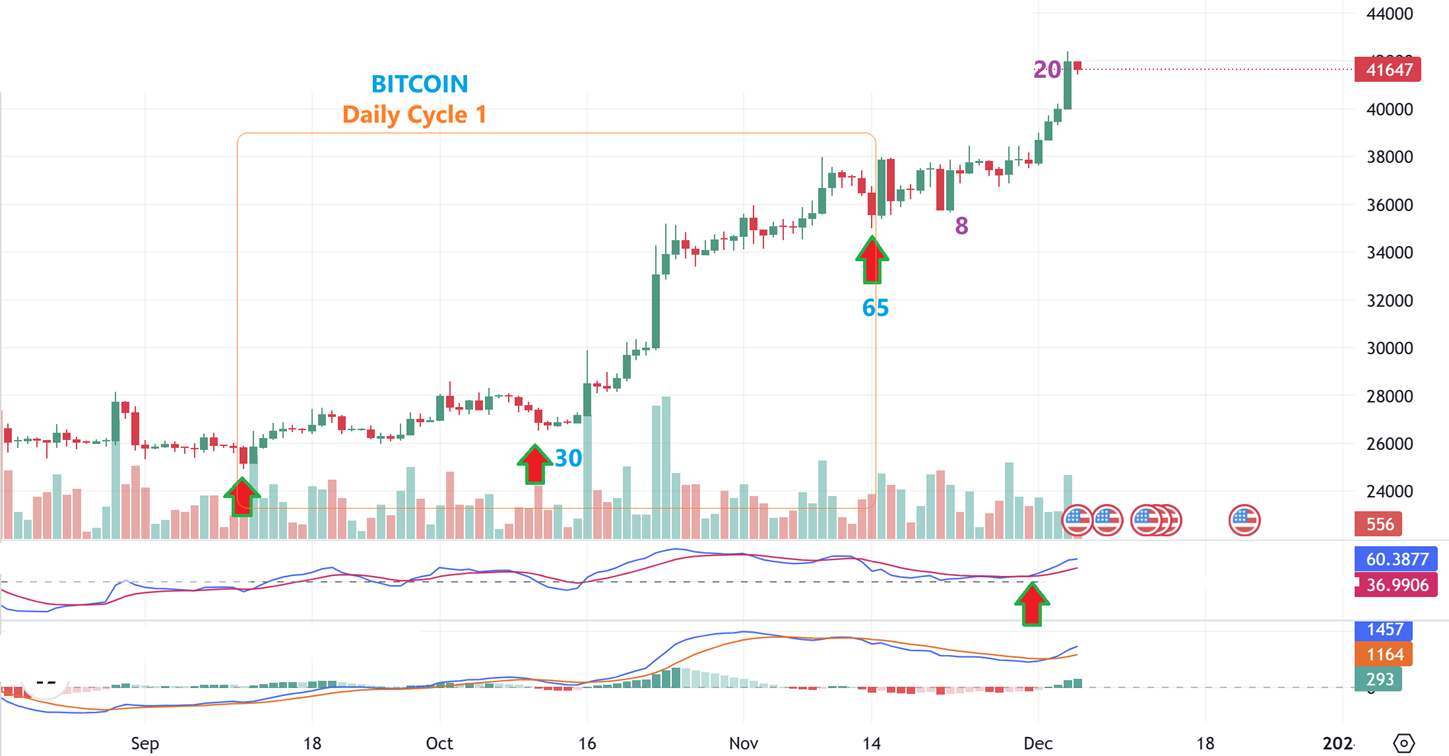
BITCOIN DAILY – Bitcoin rallied this weekend and Crypto stocks were up 10-20% on Monday. They are extended, so I won’t be showing buy opportunities at this time, but if you bought these when recommended, you are up very nicely.
.
I wanted to do a quick review of some set ups that were in last weeks reports, to show that they are playing out as expected. It gives confidence to future set ups…
.
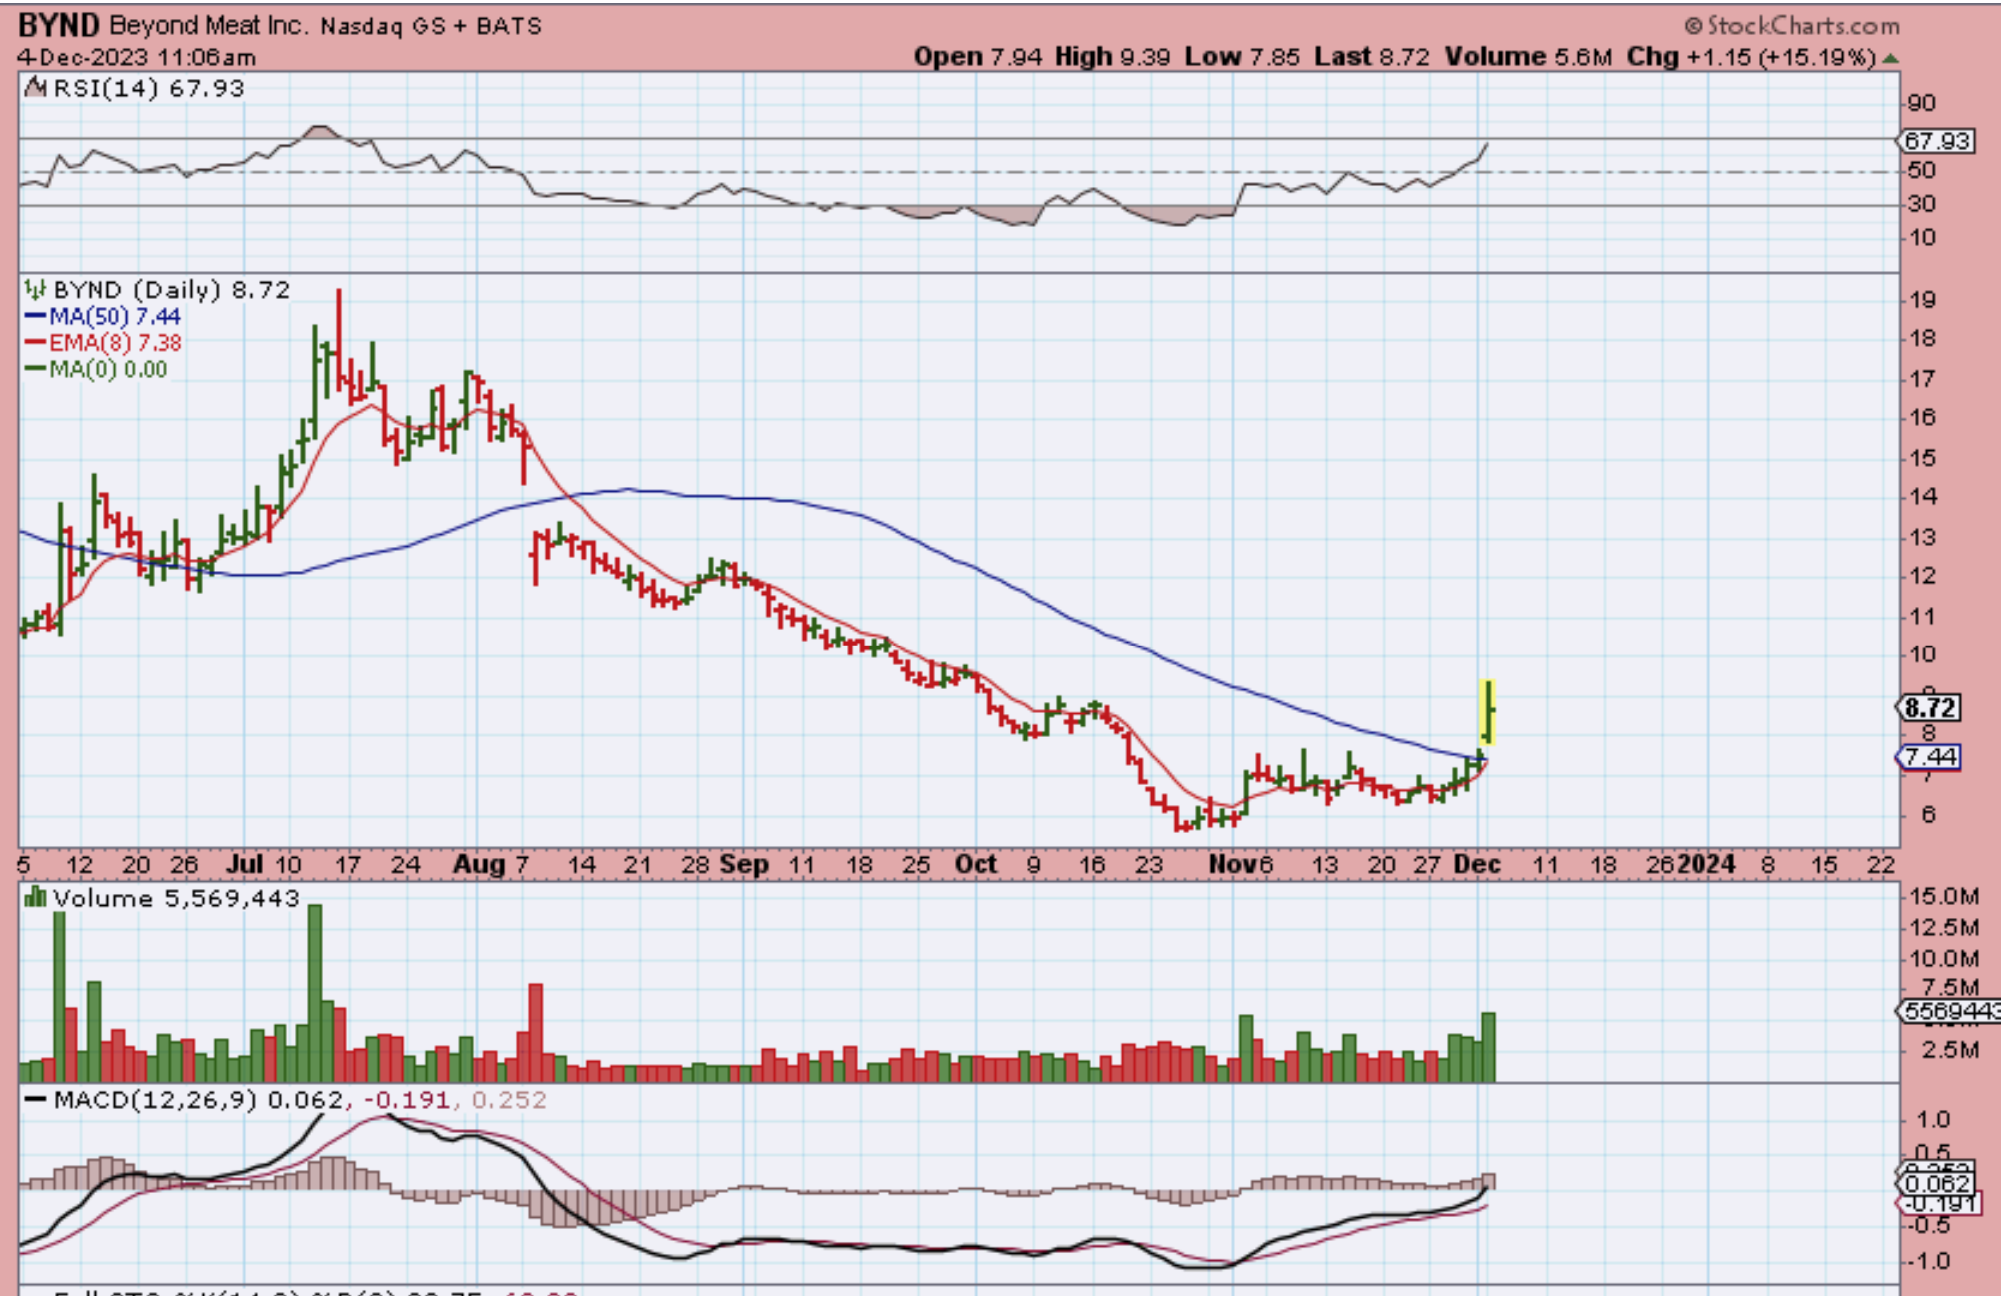
Beyond was pushing under the 50sma with volume so I posted it as a buy. It popped 20% yesterday and then pulled back a bit. That means that it is still a buy, especially if it back tests that 50sma.
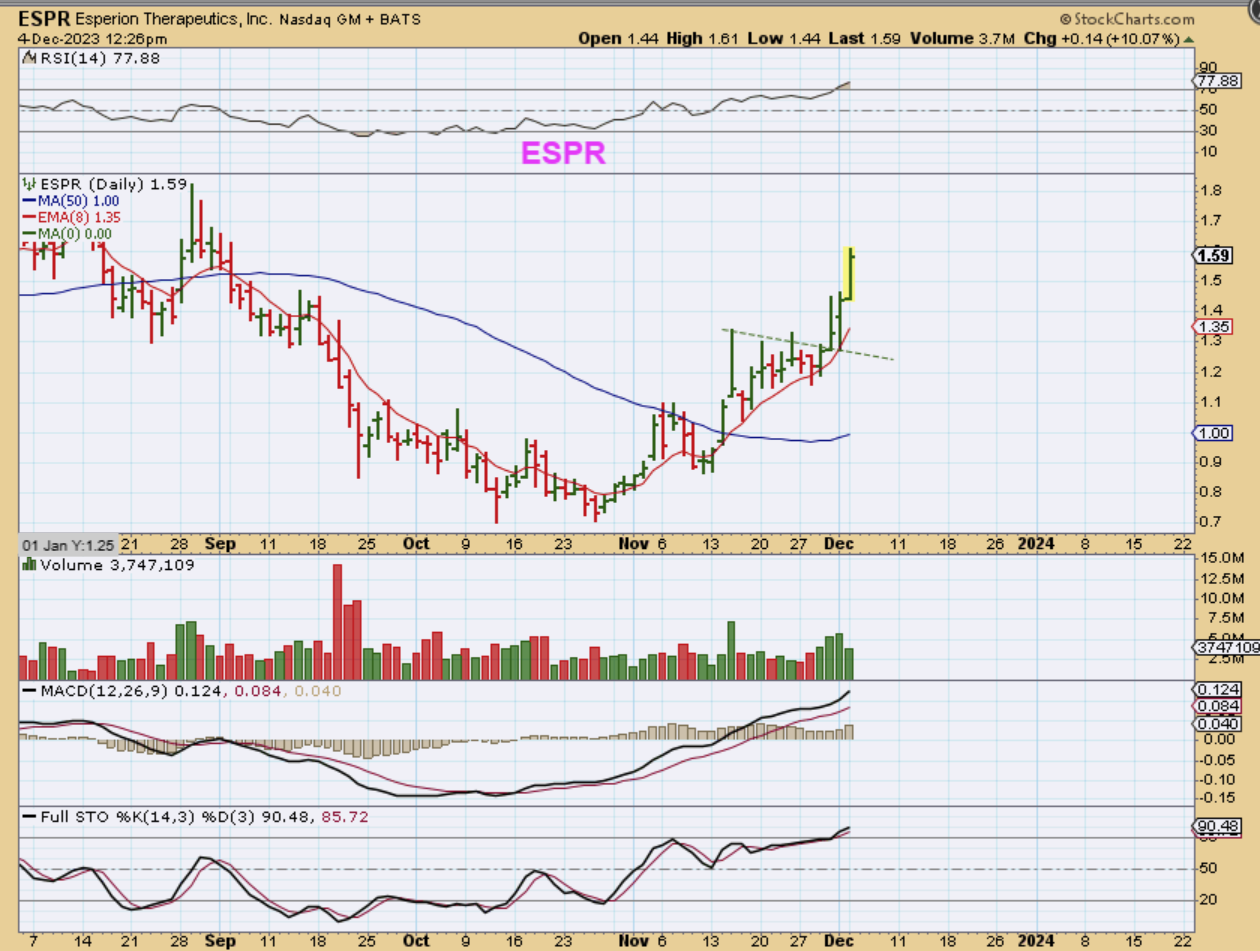
ESPR – has been discussed and it continues higher.
.
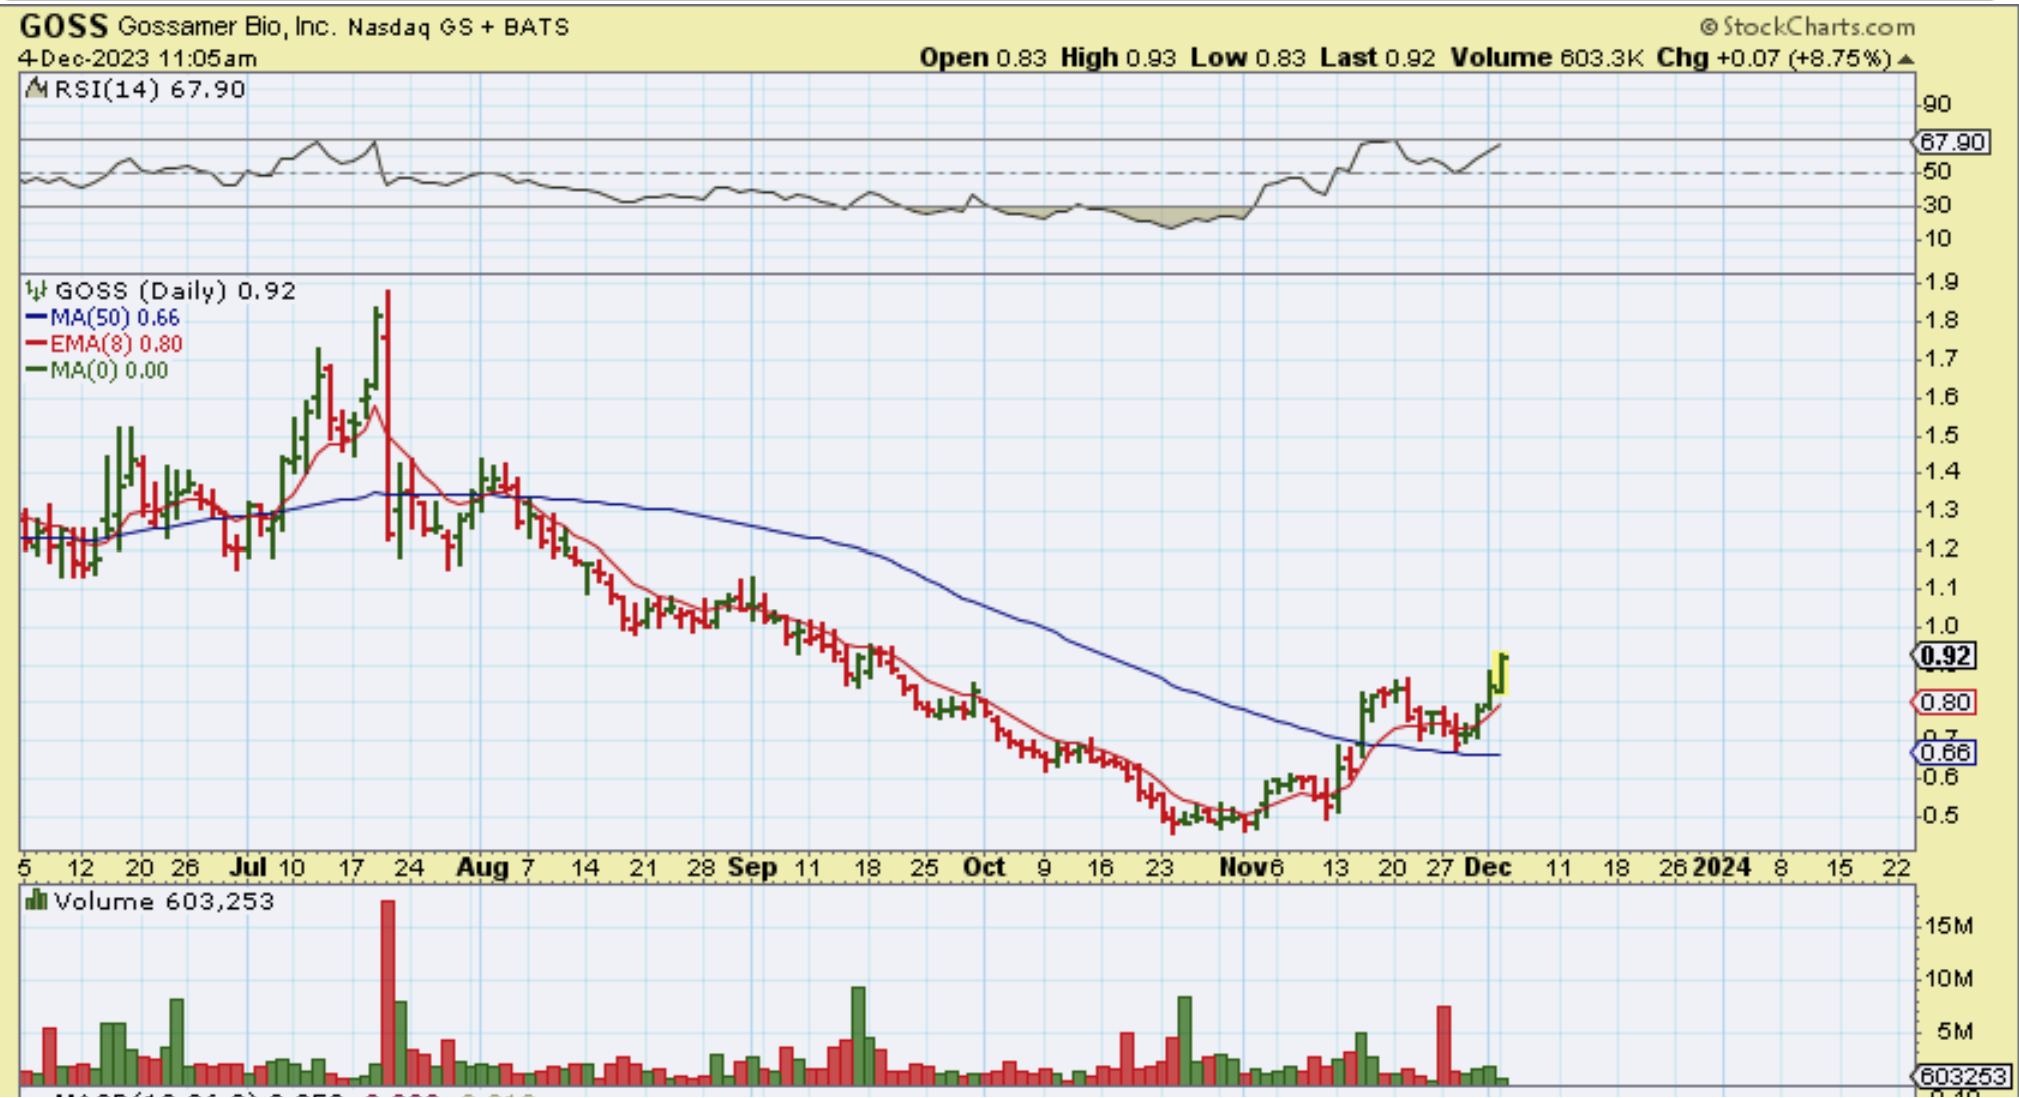
GOSS was posted after a back test of the 50sma, it was up 8% when I captured this chart in the morning, and GOSS then closed up 15% .
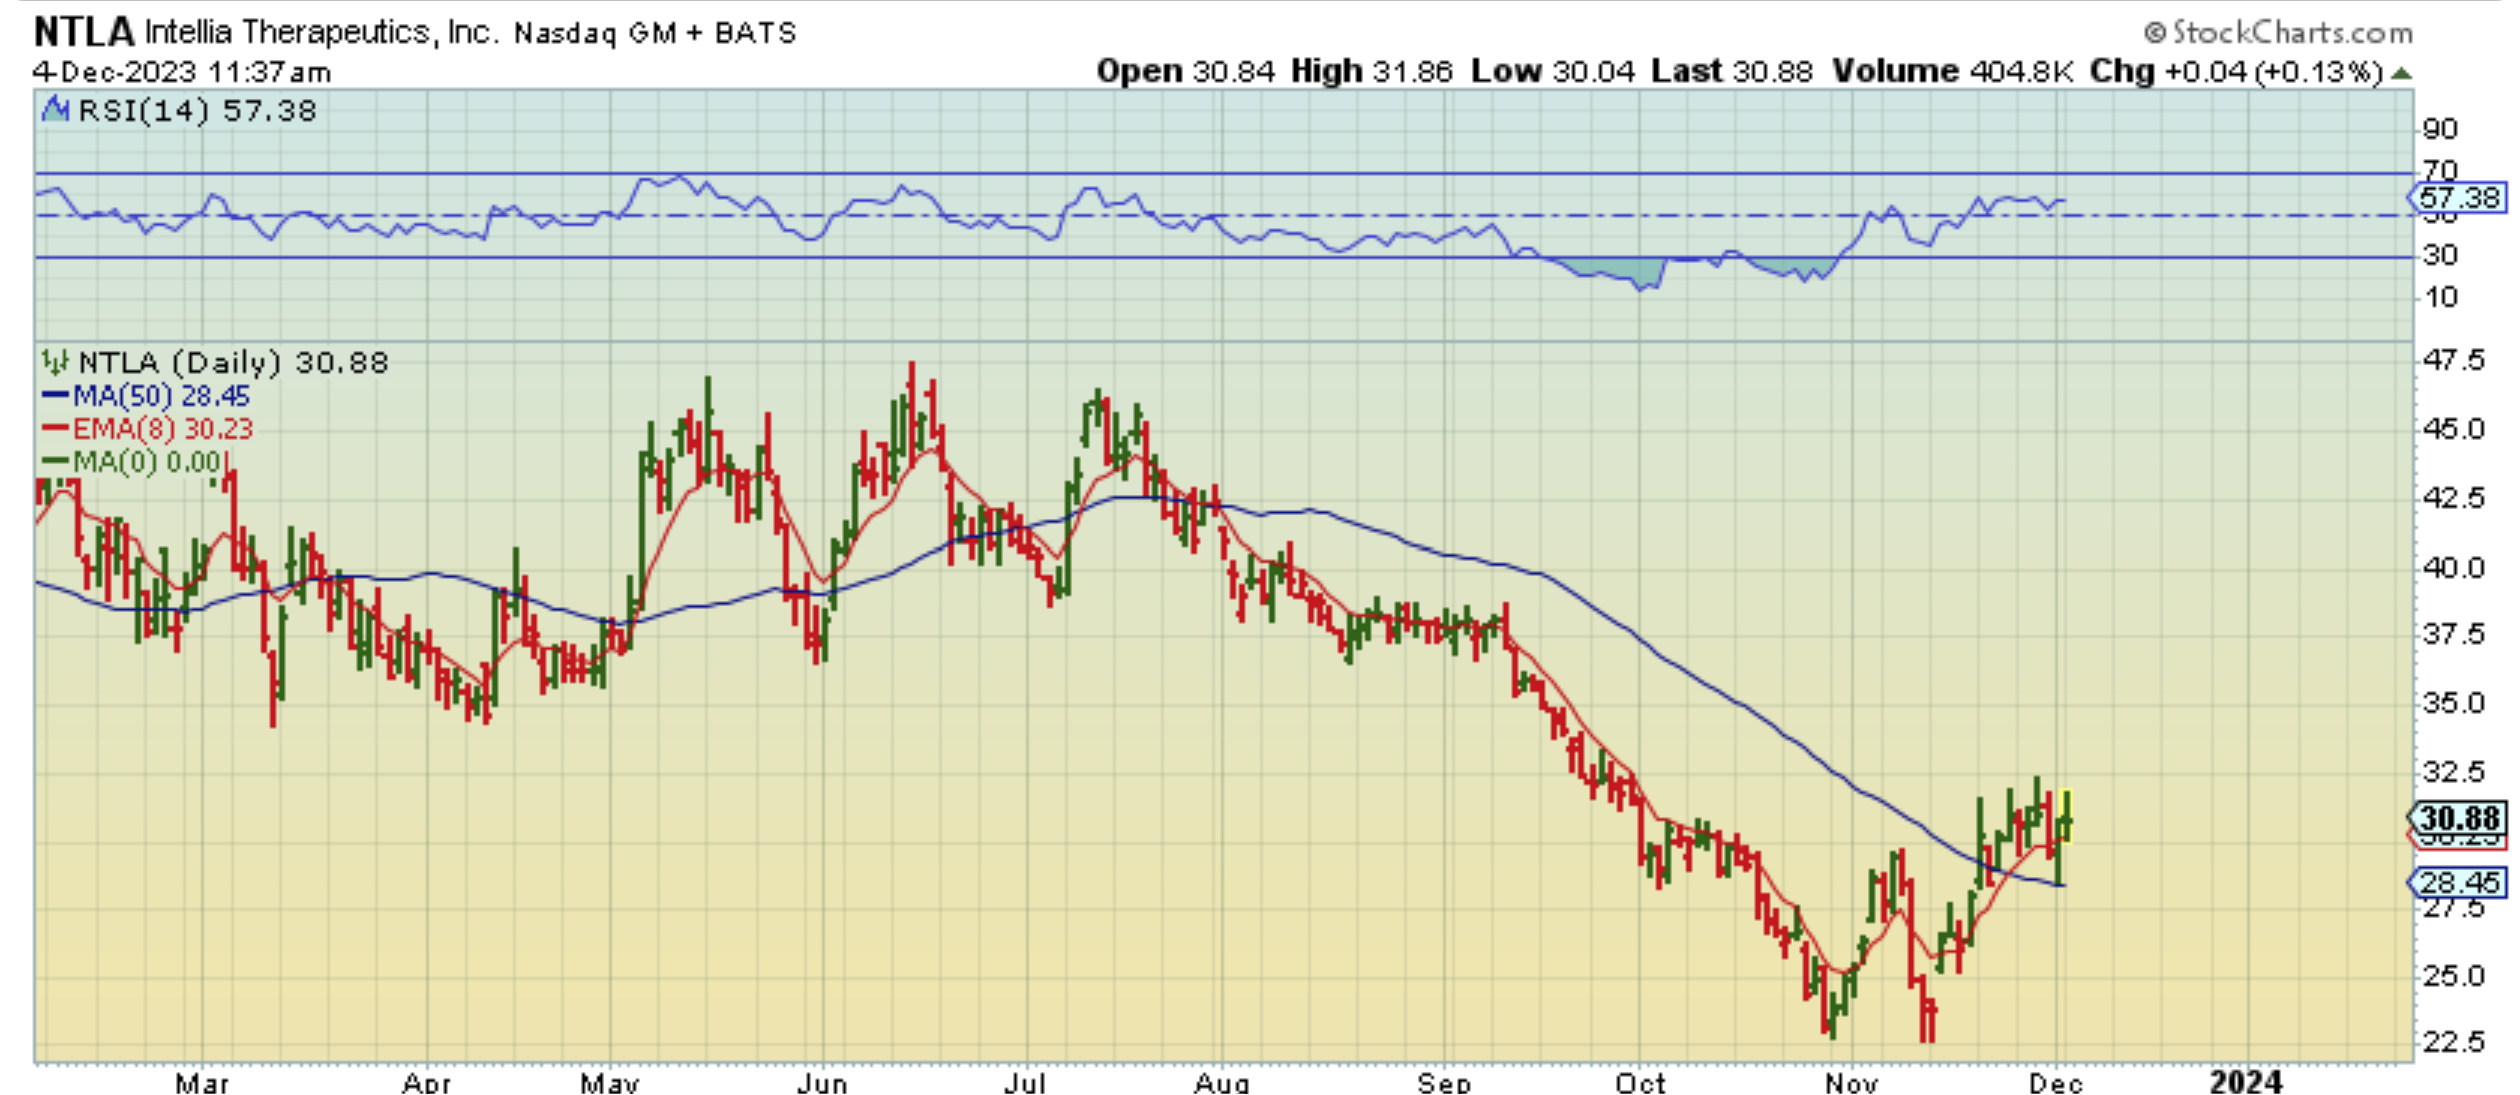
NTLA is similar to GOSS after a back test of that 50sma. NTLA, EDIT, TWST, GH, etc are still bullish set ups, so LABU is as well.
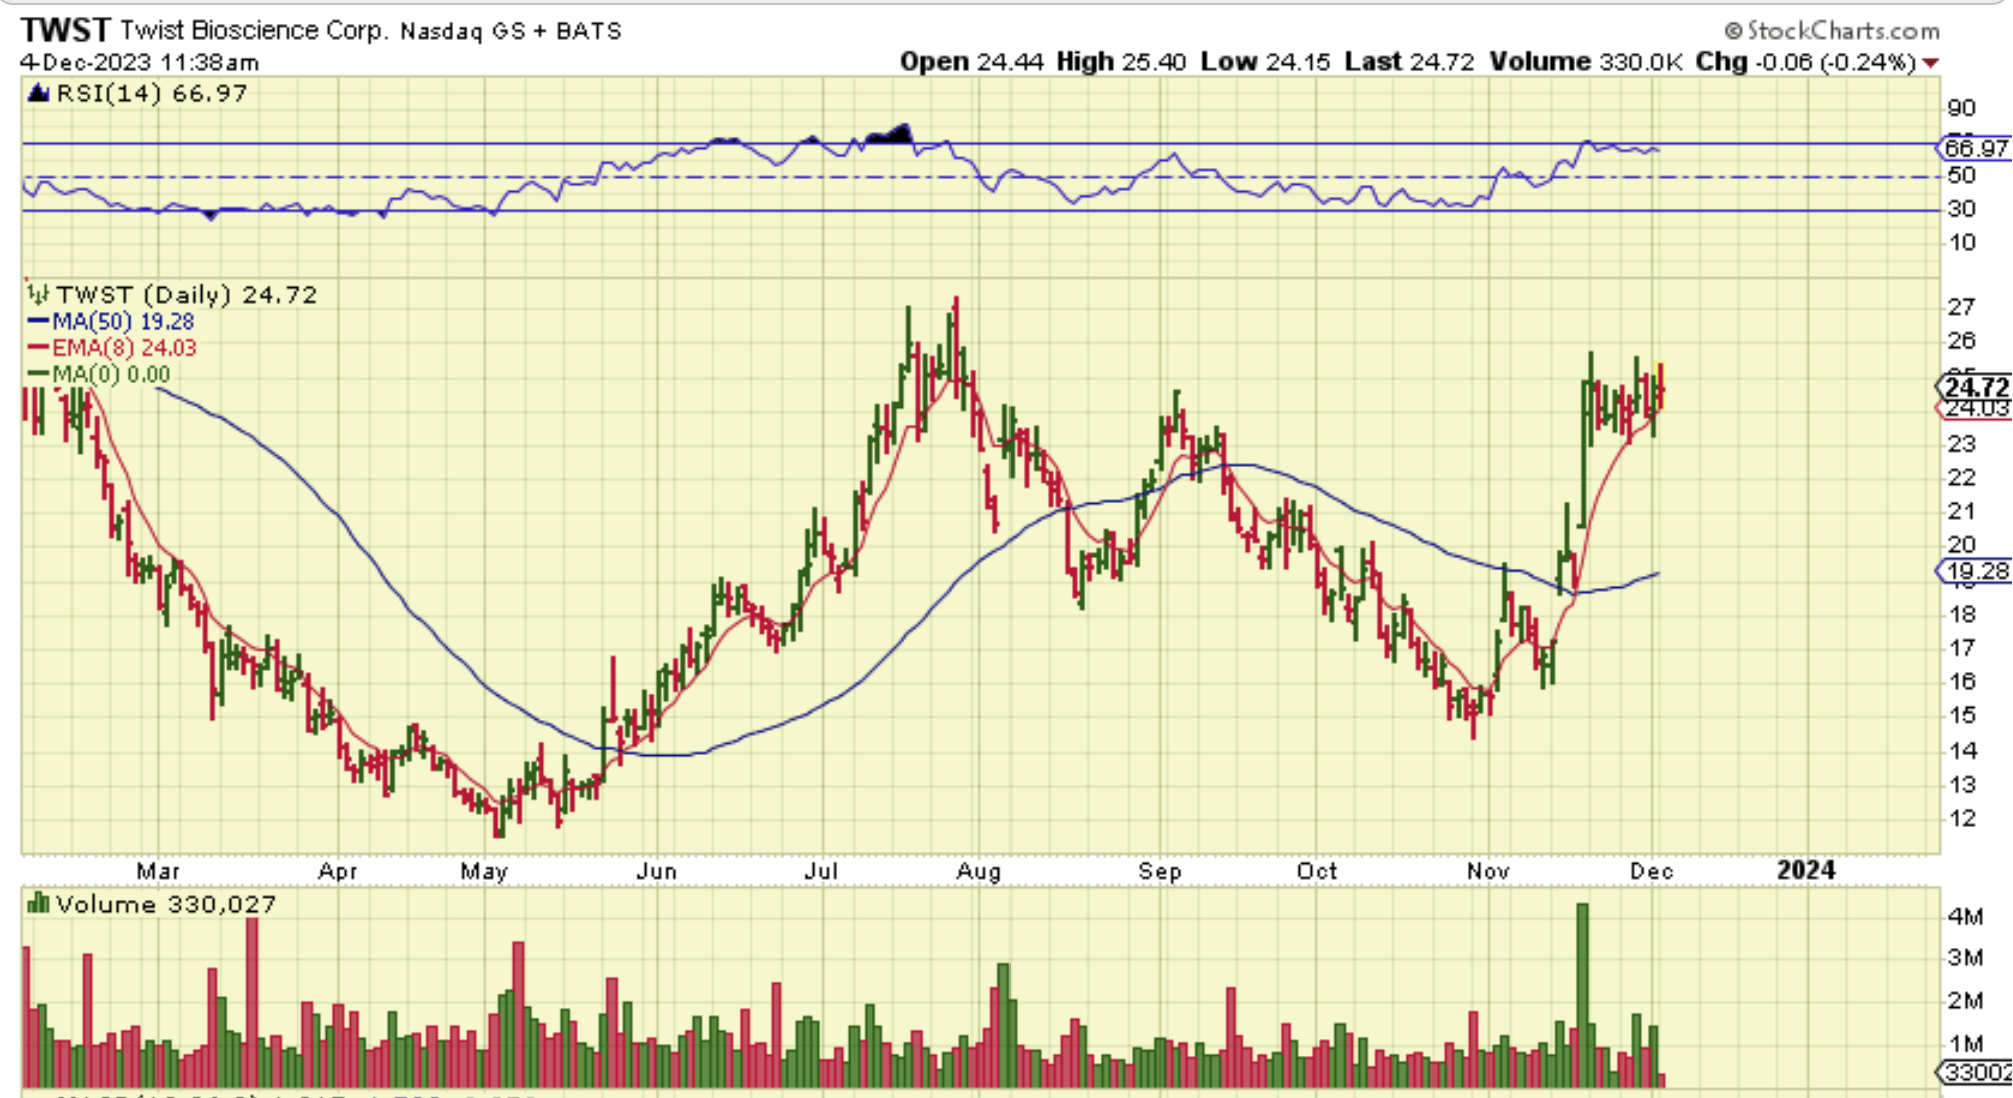
TWST has been pointed out too. It is consolidating some strong gains that it made on the last run and is a bullish consolidation at this point. Usually people buy the break out (or buy here with a tightish stop under $23).
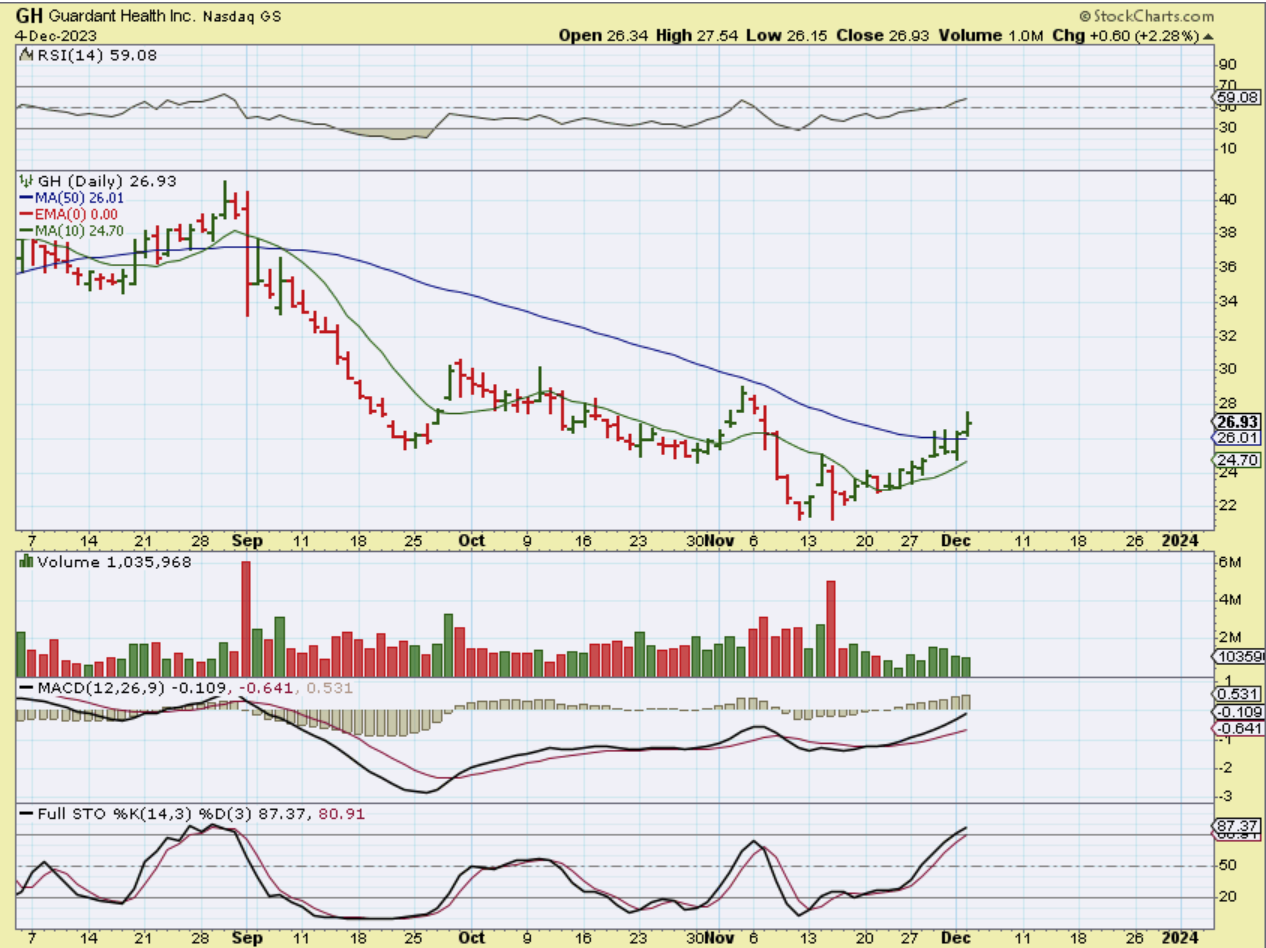
GH continues to creep higher out of a base and above the 50sma. This is a buy too.
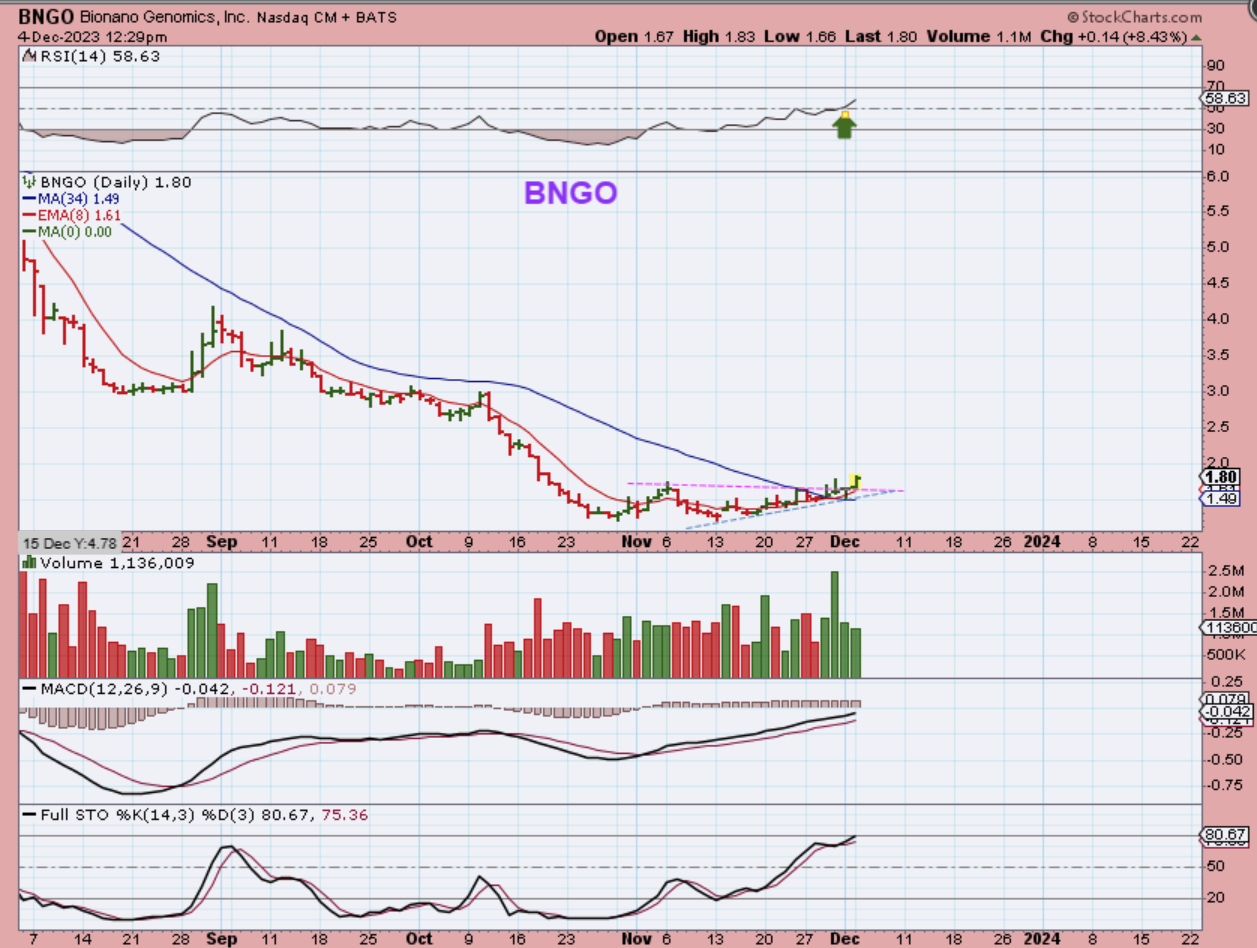
BNGO has not been in the reports, but this is a bullish base with price now breaking above the 34 sma. It is pushing on the 50sma (not shown, sorry), but a breakout should be bullish too. The upside potential looks very good.
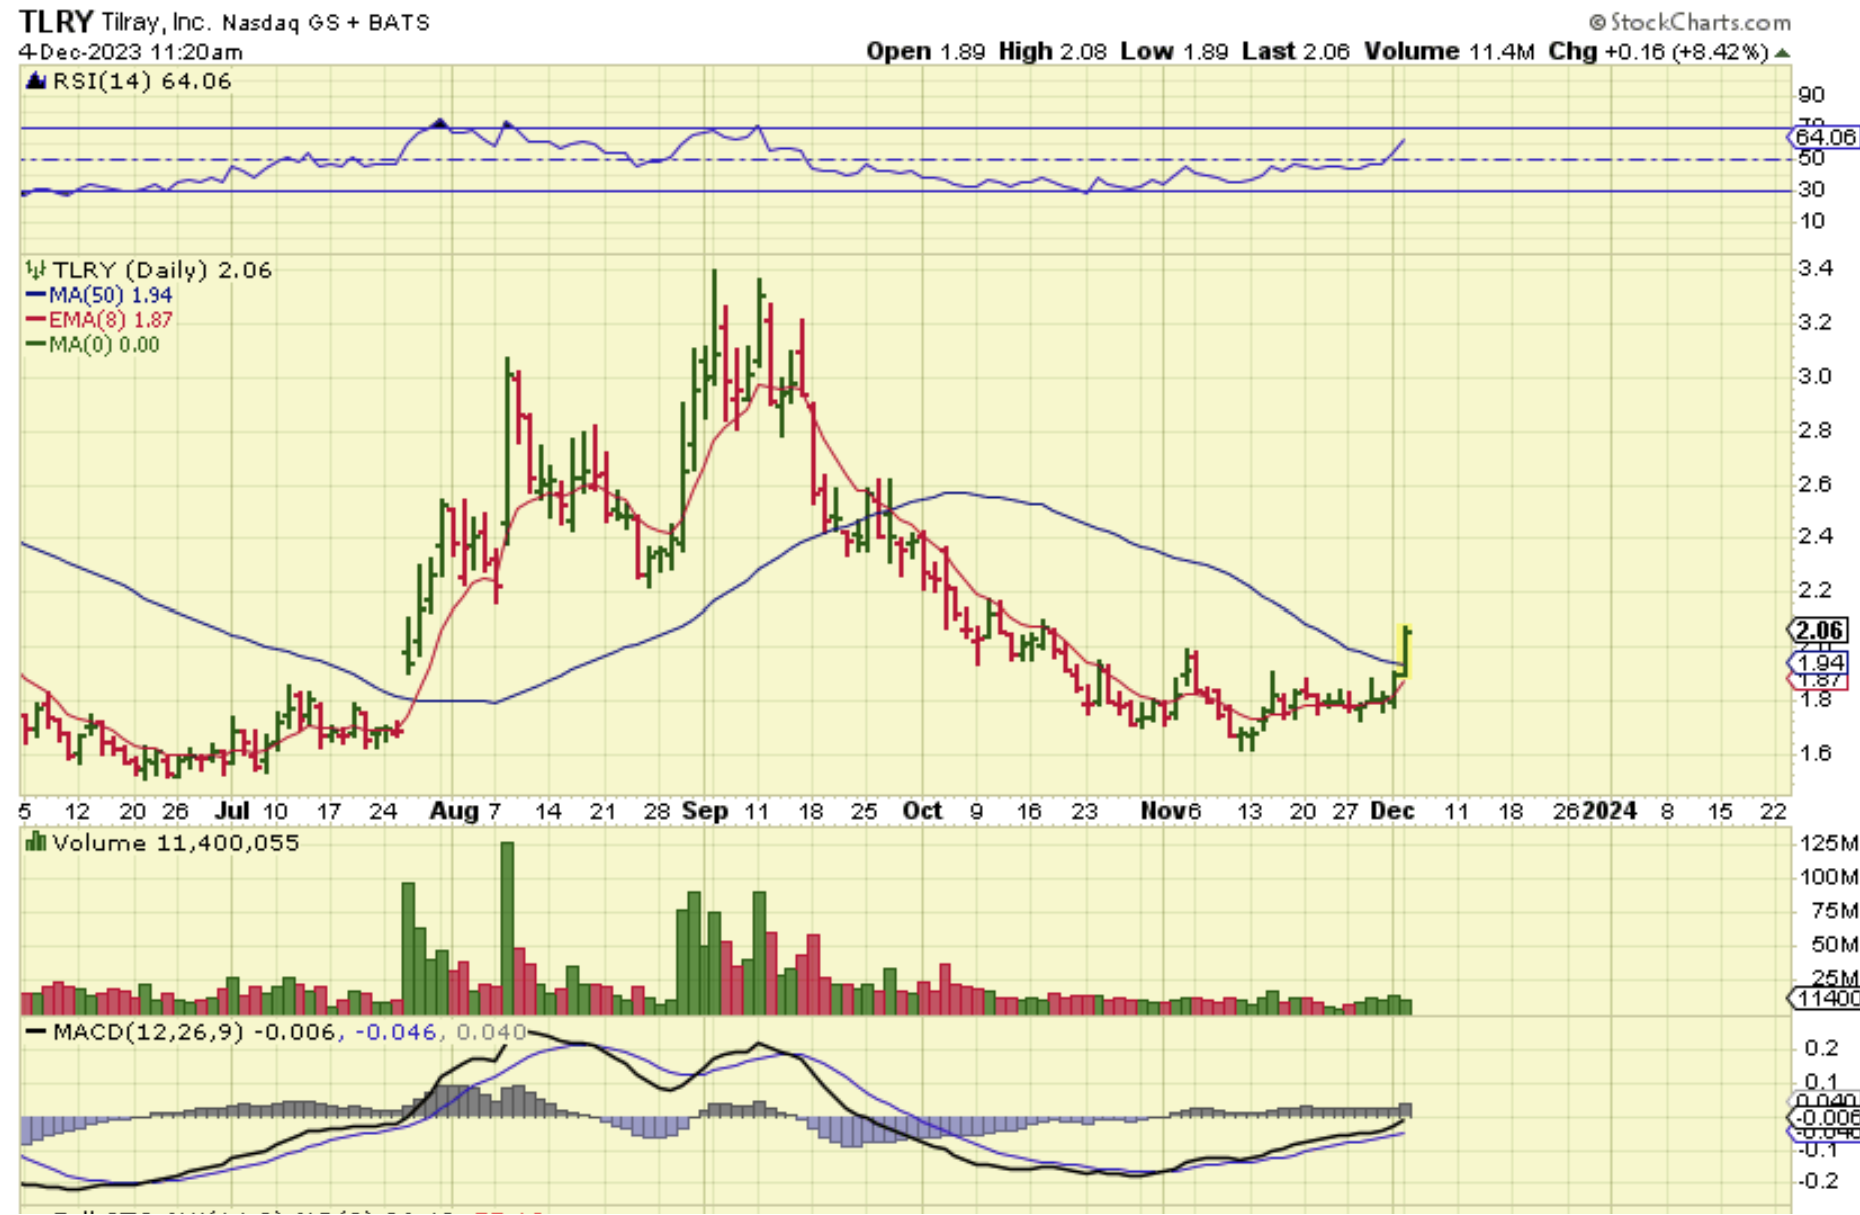
MJ STOCKS CONTNUED TO PERFORM WELL OUT OF THE LOWS. See TLRY, CGC, ACB, CRON, GRWG, CRLBF, OGI, SNDL, etc,etc.
.
TLRY was crawling sideways under the 50sma, and it broke out yesterday.
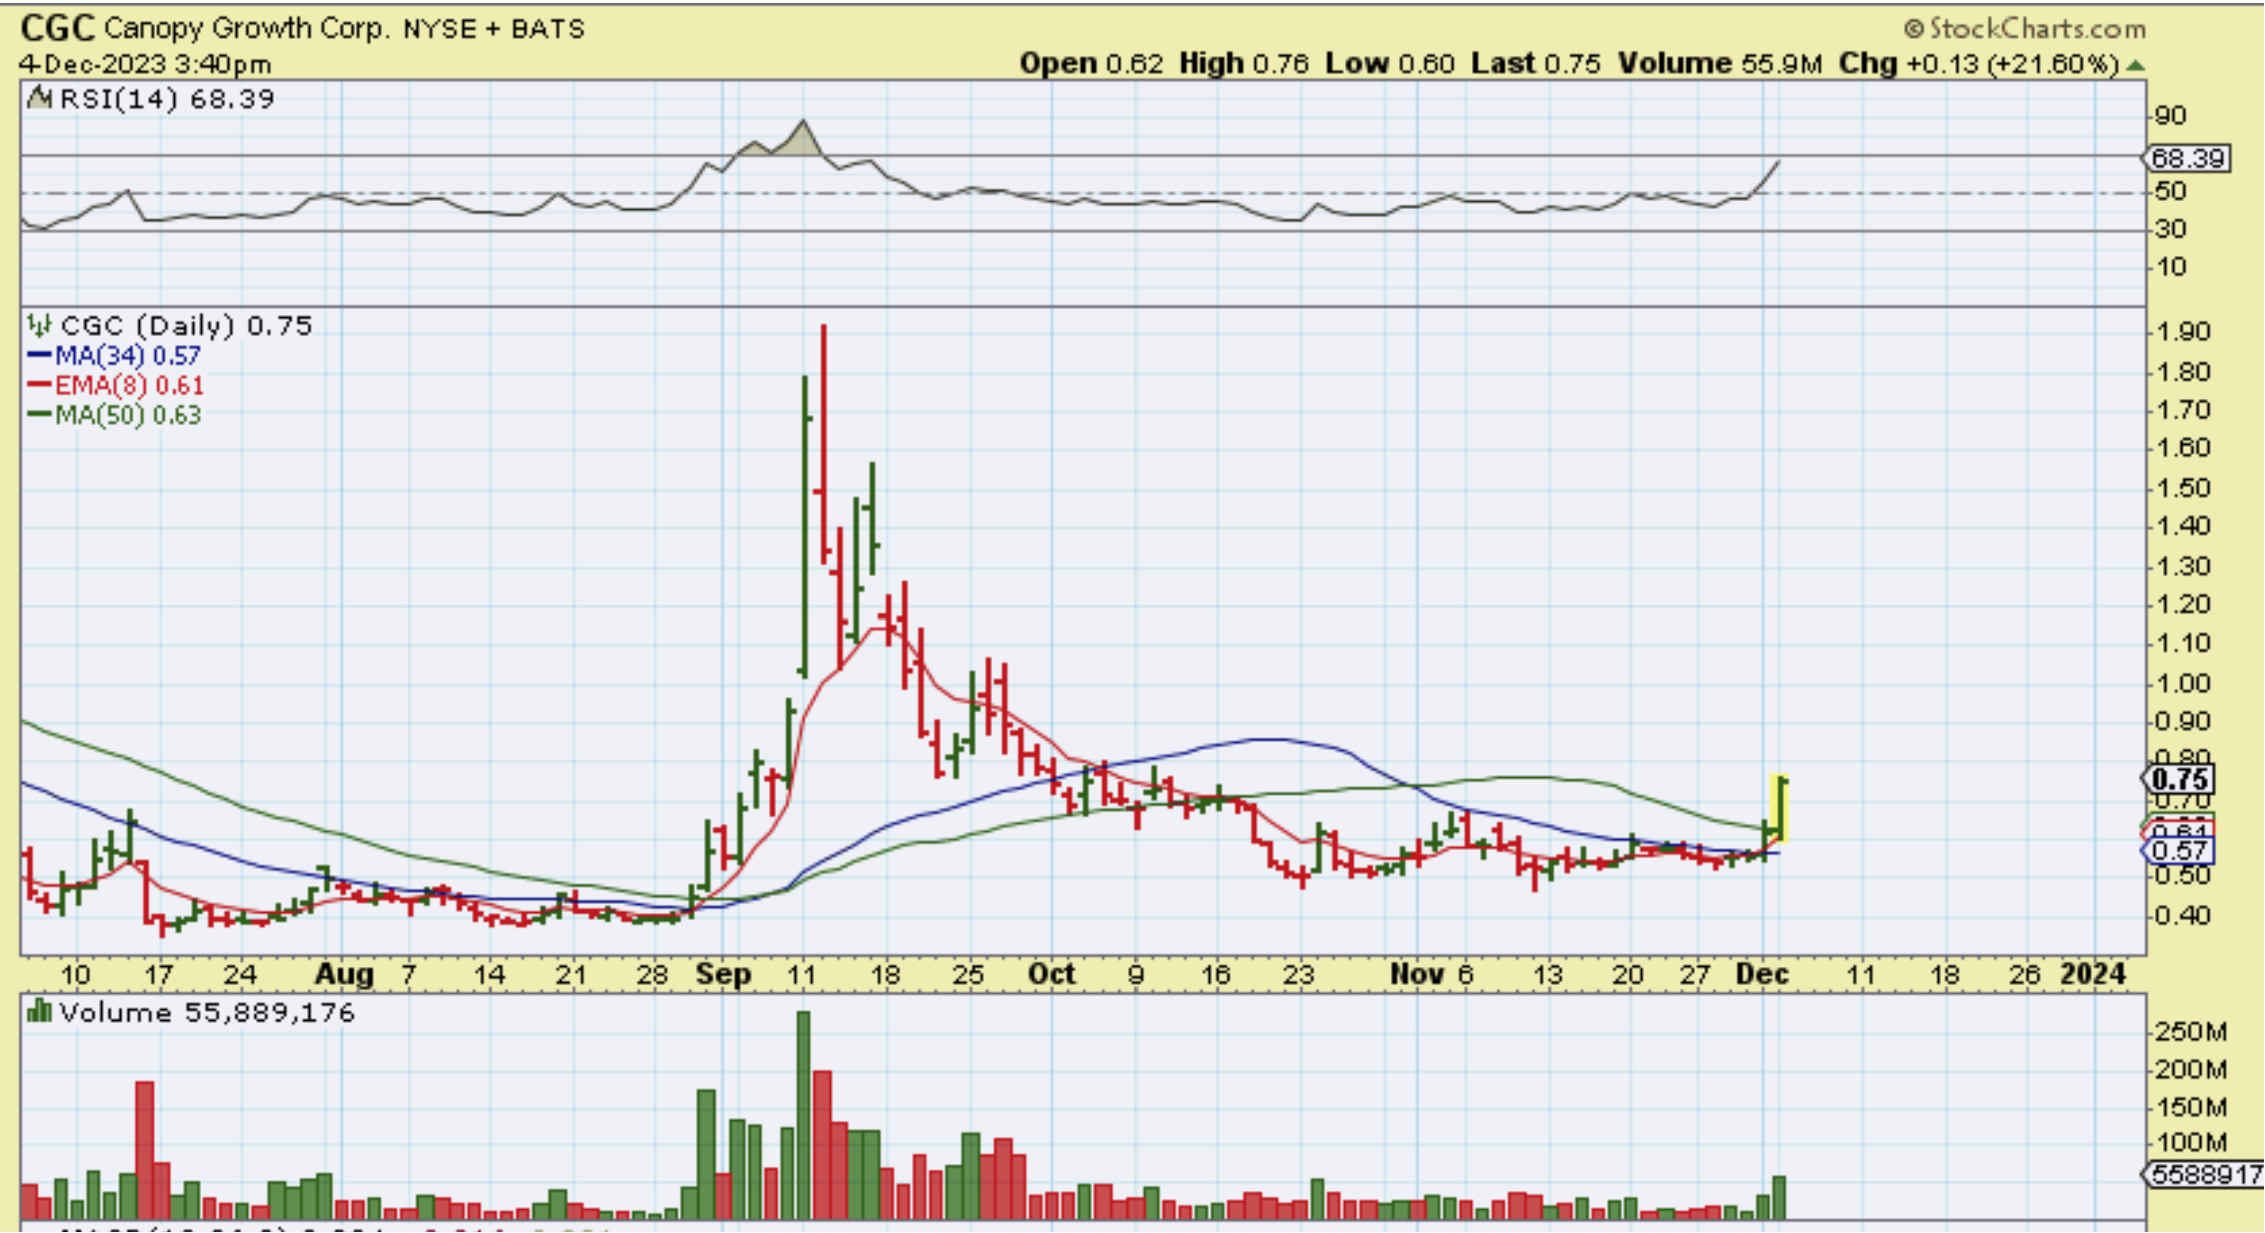
CGC -popped on Friday and had follow through on Monday. Many MJ Stocks ( or MSOS & The MJ ETF) look bullish.
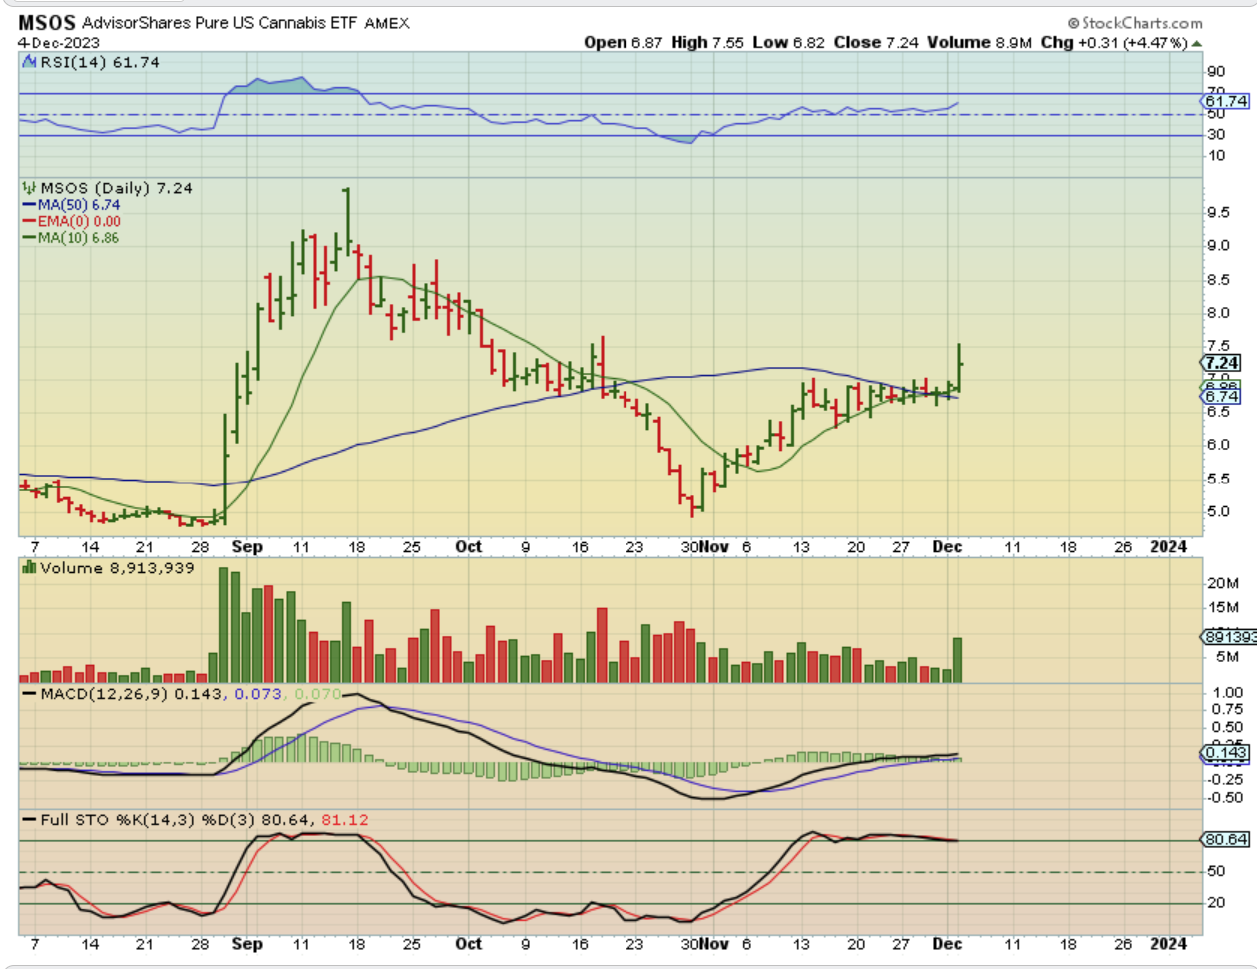
MSOS & MJ broke out yesterday too. The sector is bullish.
.
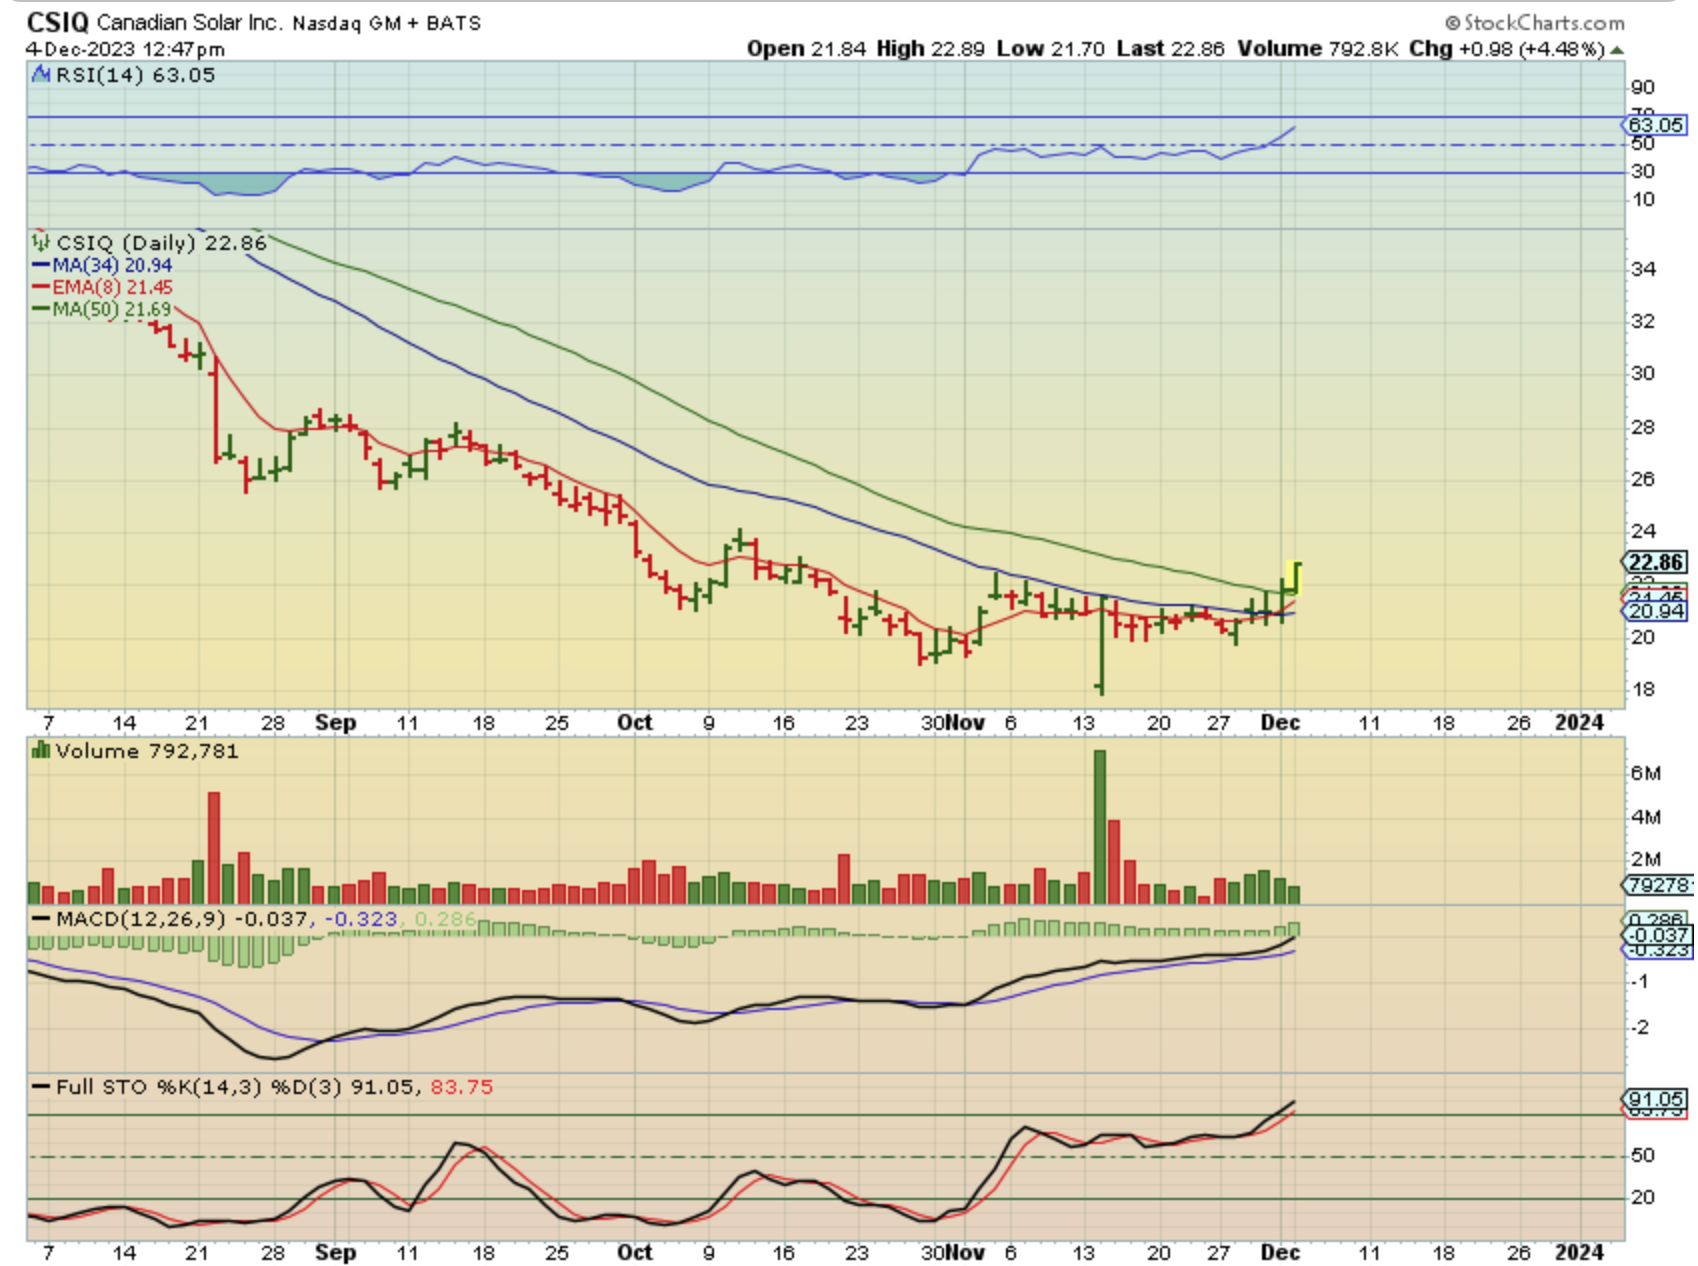
SOLAR STOCKS ALSO LOOK BULLISH: CSIQ, SPWR, RUN, NOVA, SOL, etc
.
CSIQ popped above the 50sma, and this was midday, but volume was already looking good.