December 3rd Weekend Report
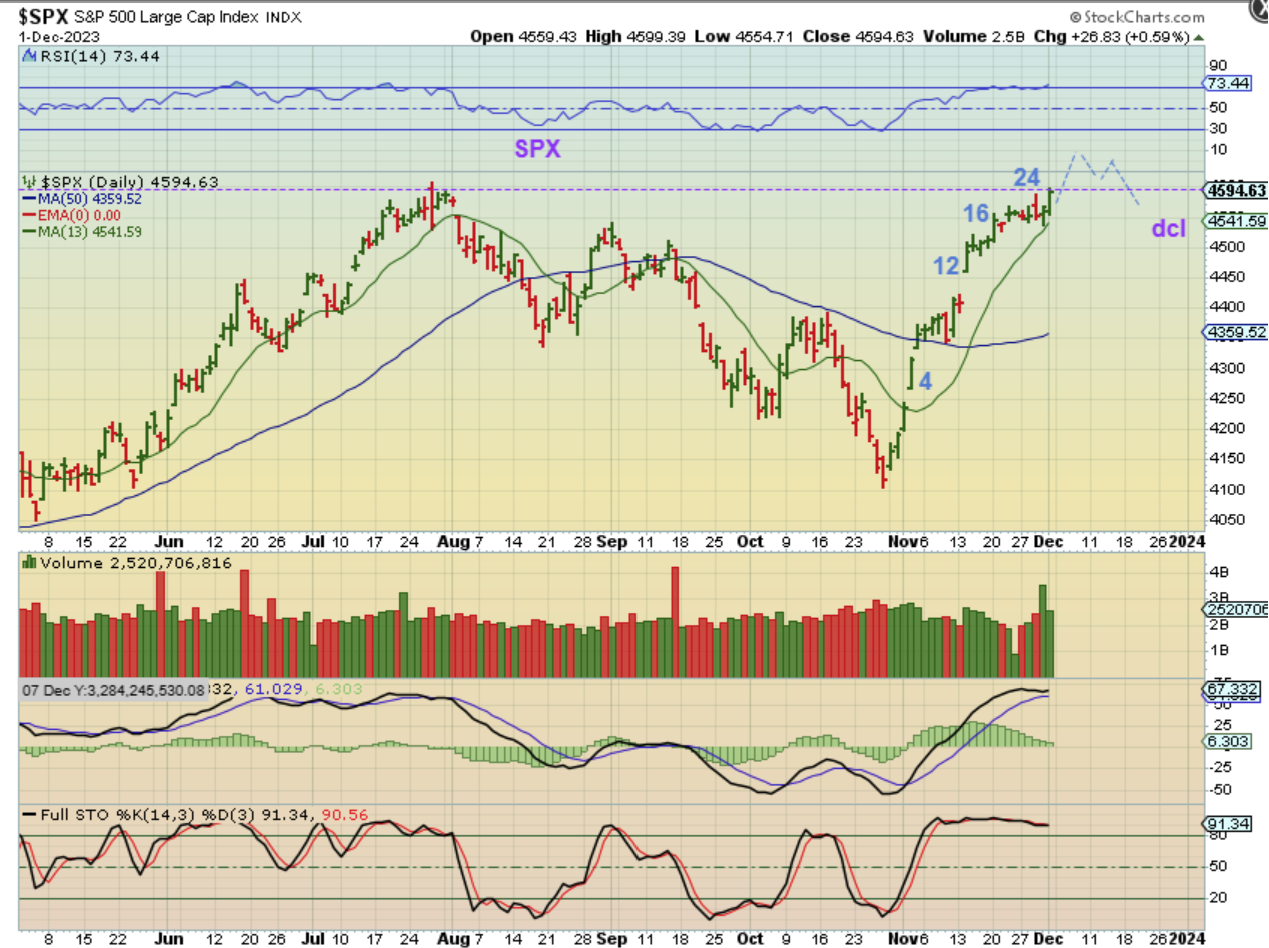
SPX DAILY – The SPX reversed at the 13 sma and closed at the highs of the week Friday, day 24. We will eventually see a dcl, and they cam come in after day 35 or 40, so we could continue higher and then dip lower later. I had recommended a stop under the 13 sma in a prior report, since price could dip to the 10sma and then overshoot a bit.
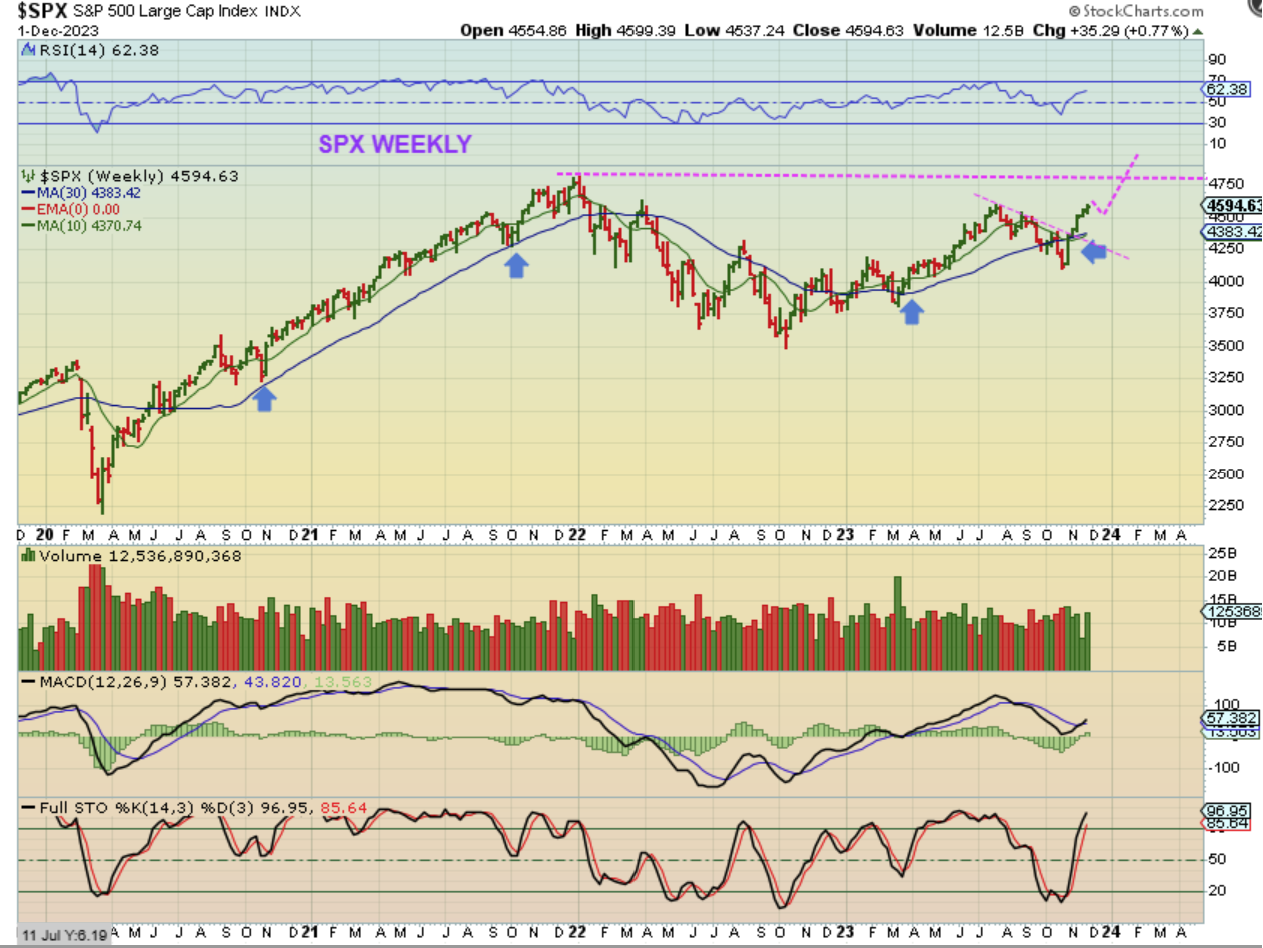
SPX WEEKLY – Price closed at the highs on the weekly chart and notice how strong of a move this has been coming out of the ICL. 5 Weeks of a rally has erased the 3 month drop into the ICL. These markets ran straight up, and with everyone figuring that inflation has been tamed and that it would mean that the Fed will stop raising rates, maybe even start cutting rates, this can continue.
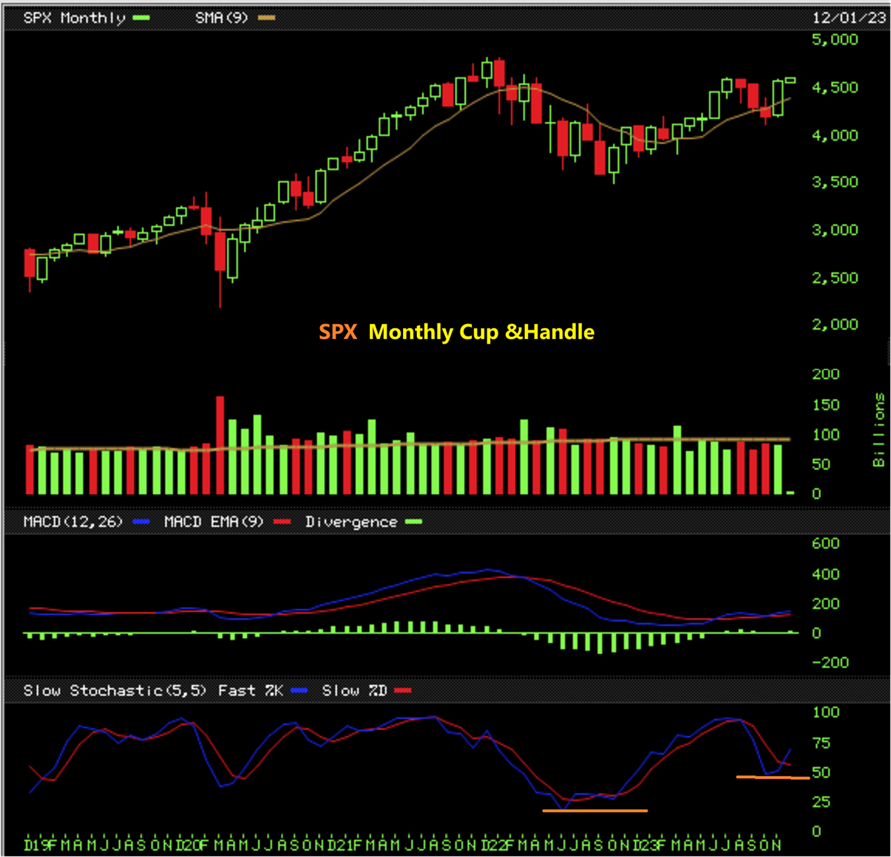
THE SPX MONTHLY CHART IS A BEAUTIFUL LOOKING CUP & HANDLE. The stochastics was re-set with that dip. If this set up plays out as a true Cup and handle, it indicates that we are just getting going again. 2024 looks promising with possible rate cuts by the Fed again.
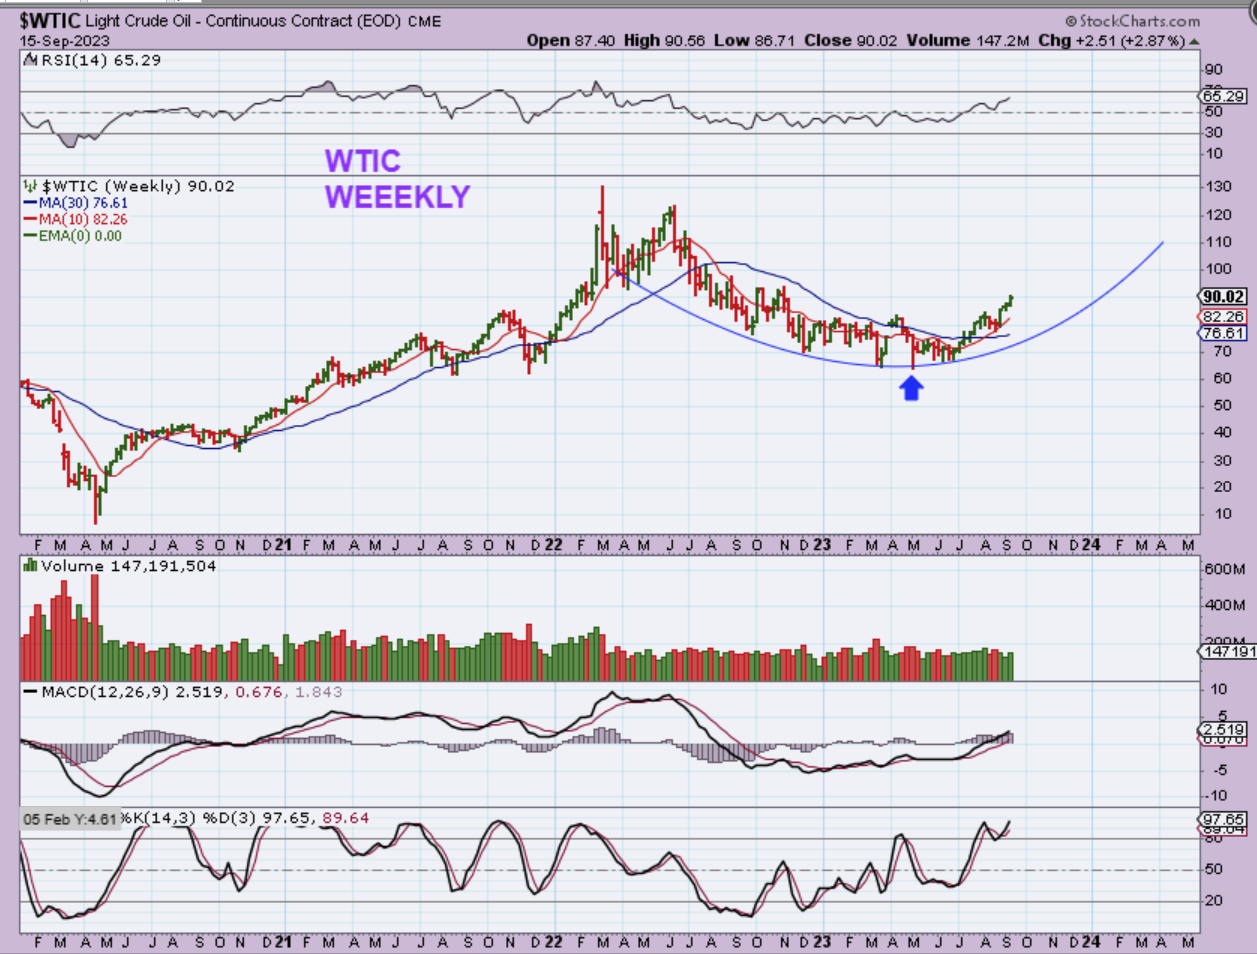
WTIC WEEKLY – Back in September as Oil ran higher out of the ICL, I thought that with Oils choppiness, we could see a rounding bottom or cup form, with a pull back to that cup as we dipped into the next ICL? I drew that here.
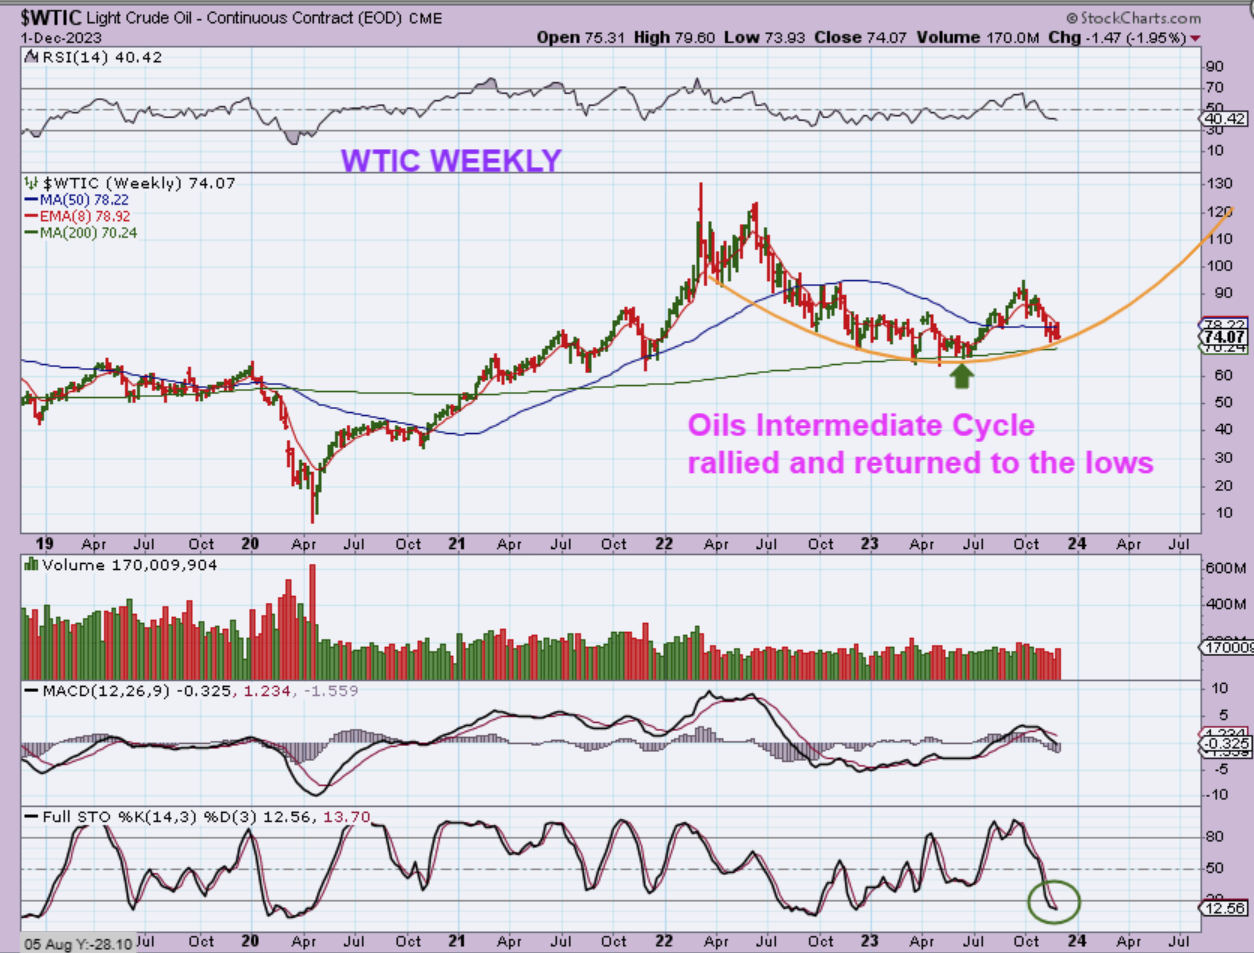
WTIC WEEKLY – We do still see that cup formation here. I’ll be honest, I didn’t think that this drop would be this deep or steep, I thought that it would chop sideways and slant down more or less to the blue 50 week ma, but this is what we have now with a steeper drop and a weaker looking Oil chart heading into an ICL.
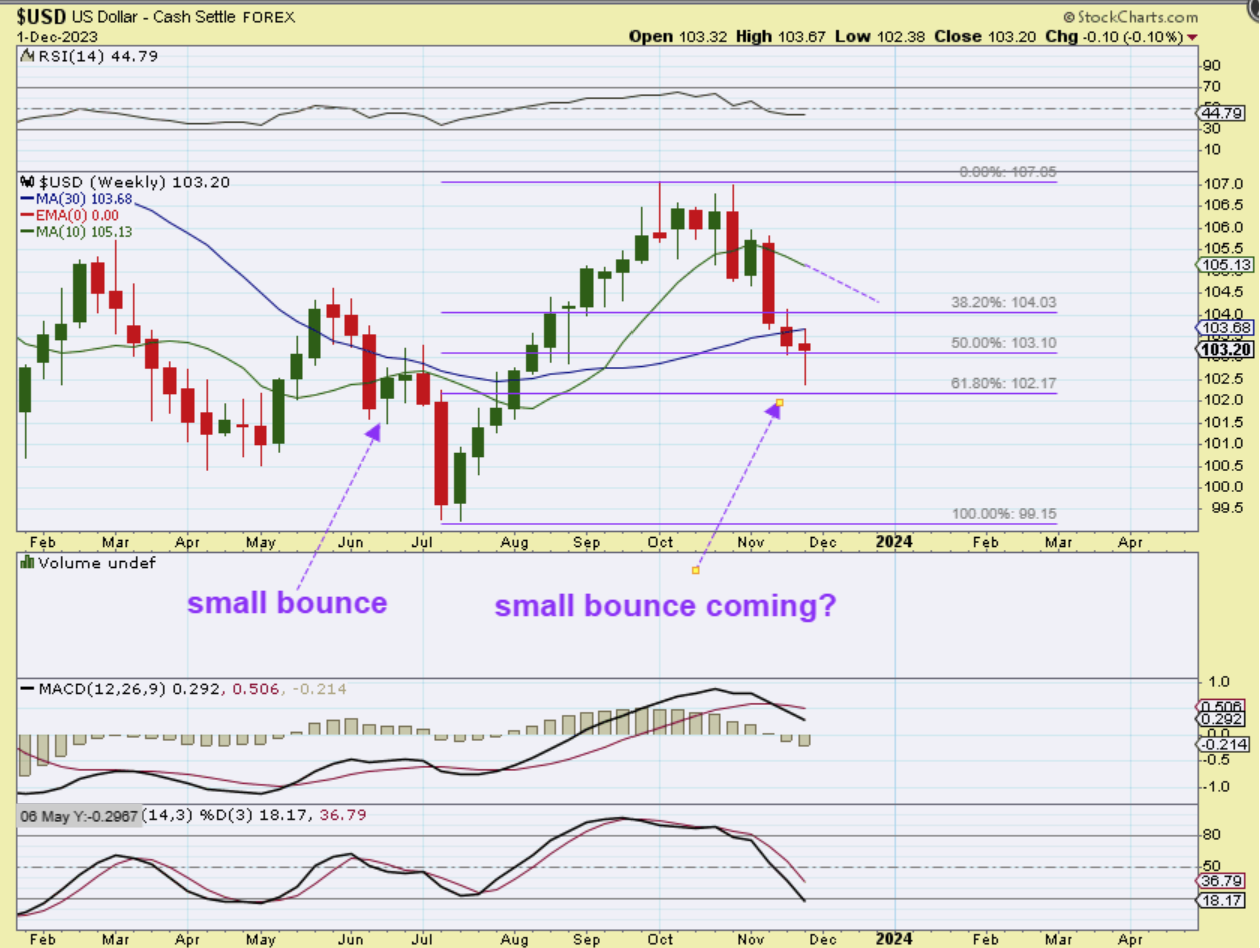
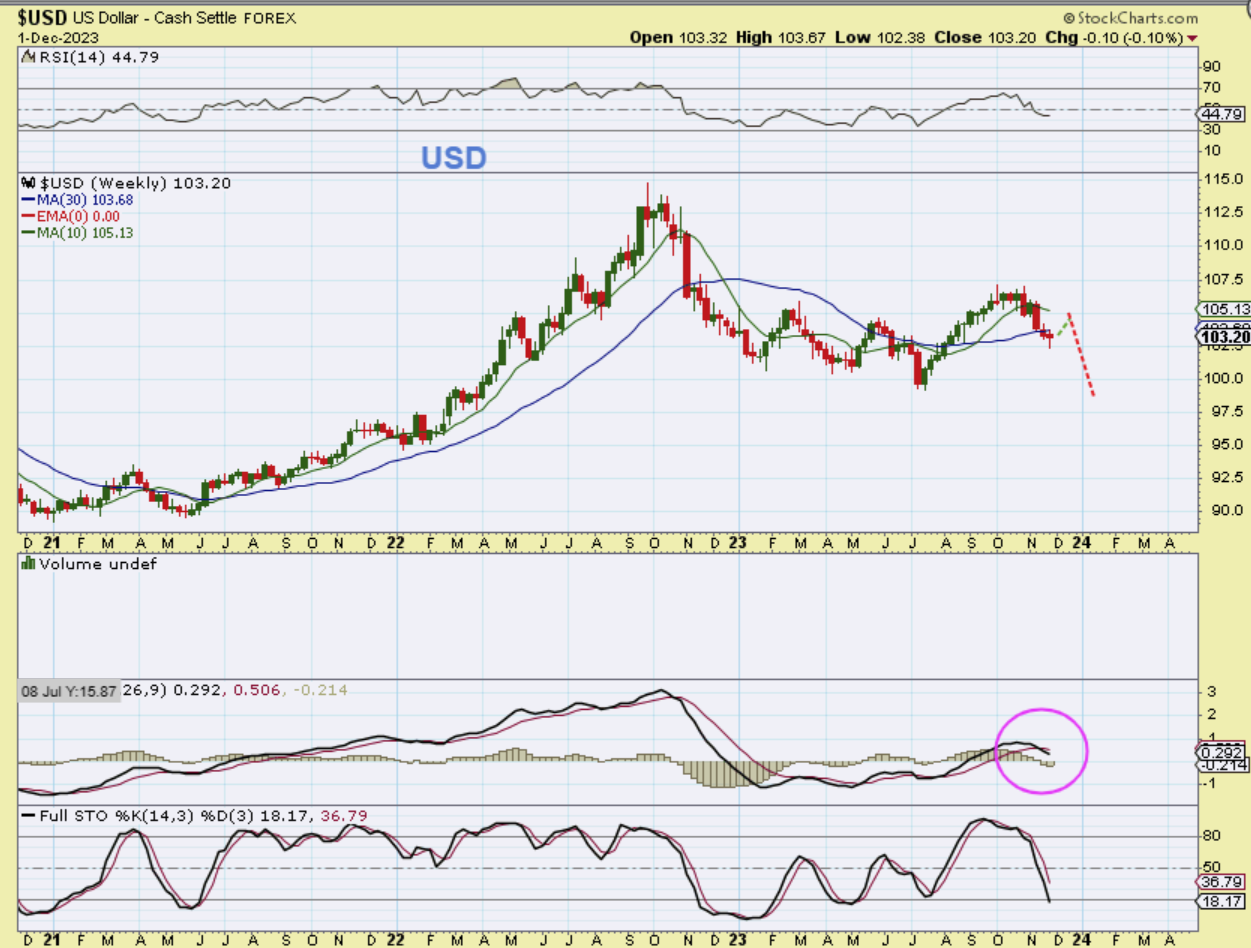
USD WEEKLY – We have a reversal candle on the USD, and this is making some nervous as Gold is at the all-time highs again. I am hearing people on twitter actually calling this the best time to short precious metals. With that, I wanted to point out the small reversal candle & bounce in June, to show that we may just see a small bounce from this reversal candle too, and that is what I expect. Why?…
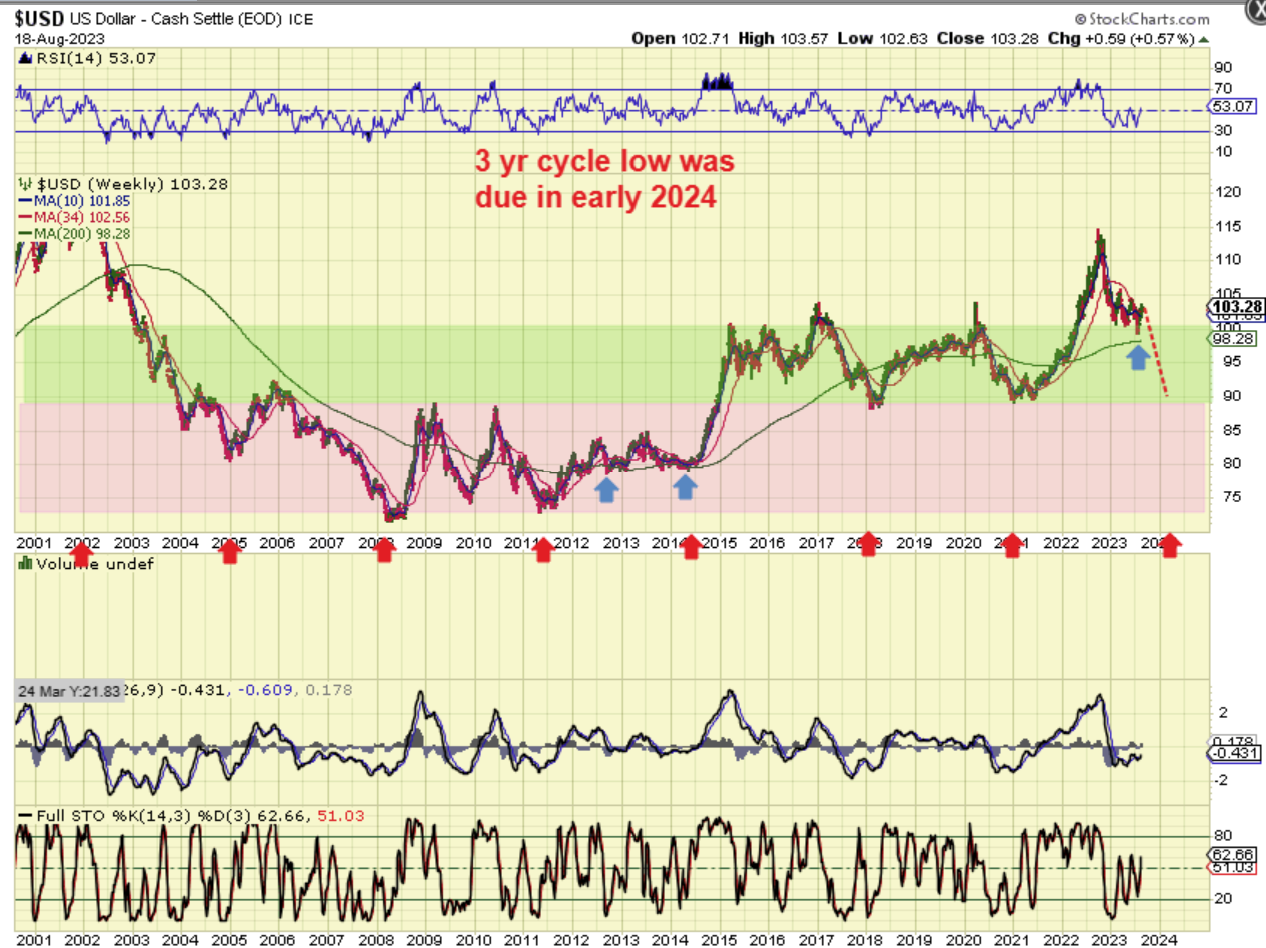
USD WEEKLY – Since way back in September of 2022, I have been discussing the expectations for the USD to drop into a 3 year cycle low in 2023, and that is what we have been seeing. I have repeatedly mentioned that in past reports, with charts like this one from August of this year. I have been saying for over a year (even before the USD peaked) that a deeper drop for the USD would help Gold break out to all time highs. You can see (red arrows) that these 3 yr lows are very reliable.
.
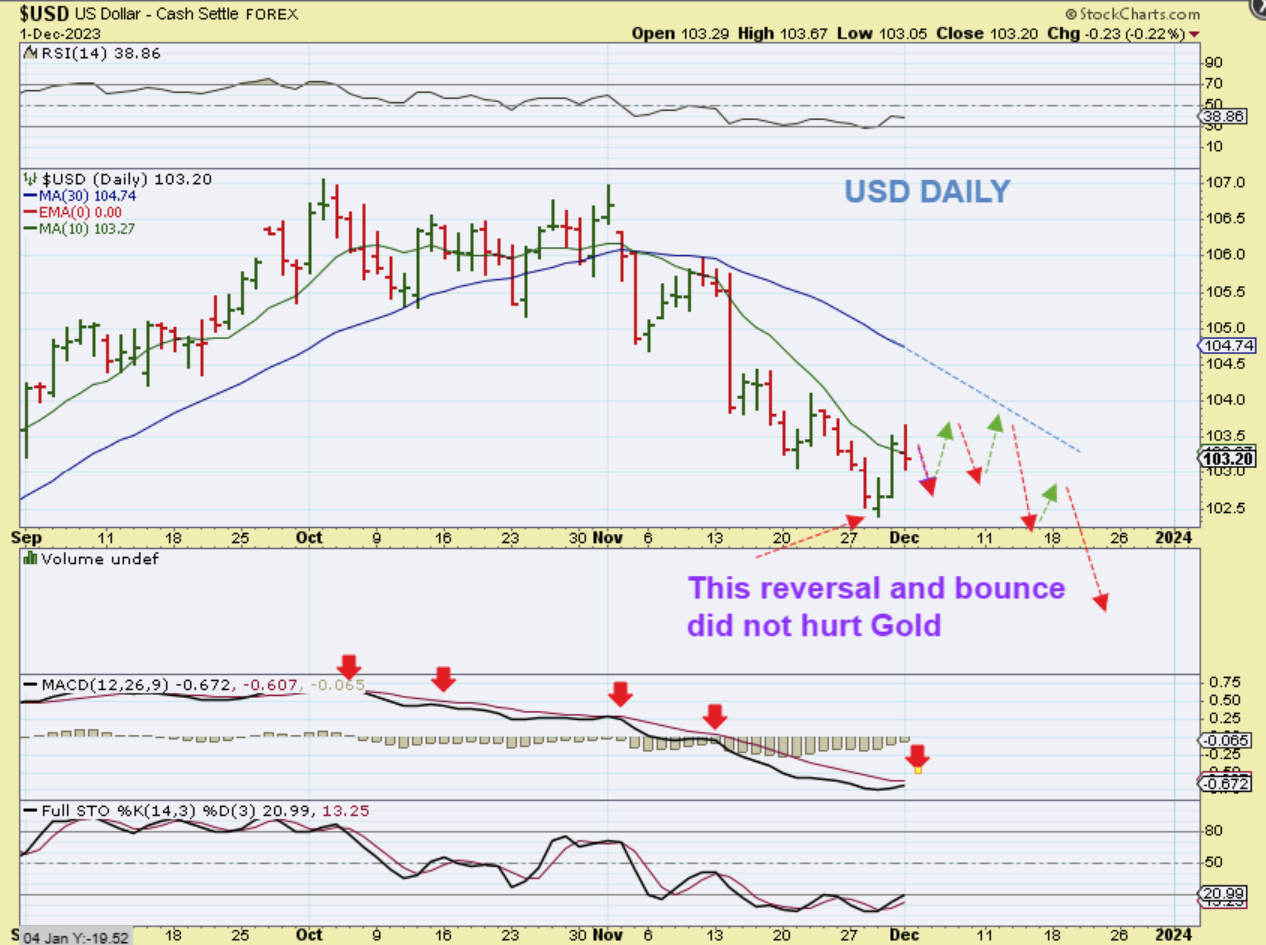
USD DAILY – So with our reversal this week, I believe that we could see a choppy attempt at a move higher, but it should roll over in time.
USD WEEKLY – We could see something like this on the weekly chart after that reversal last week.
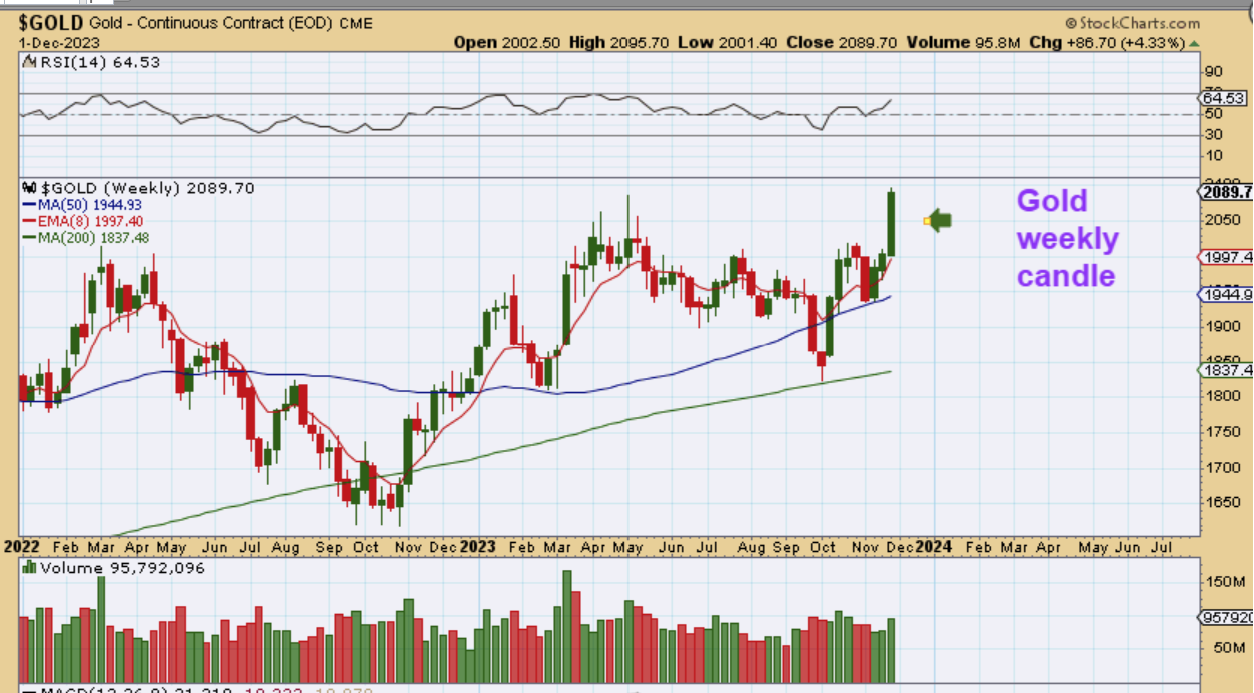
I want to point out that with a weekly reversal candle at the lows in the USD, you would expect a reversal candle at the highs with Gold, right? That did NOT happen- Gold closed at the highs.
.
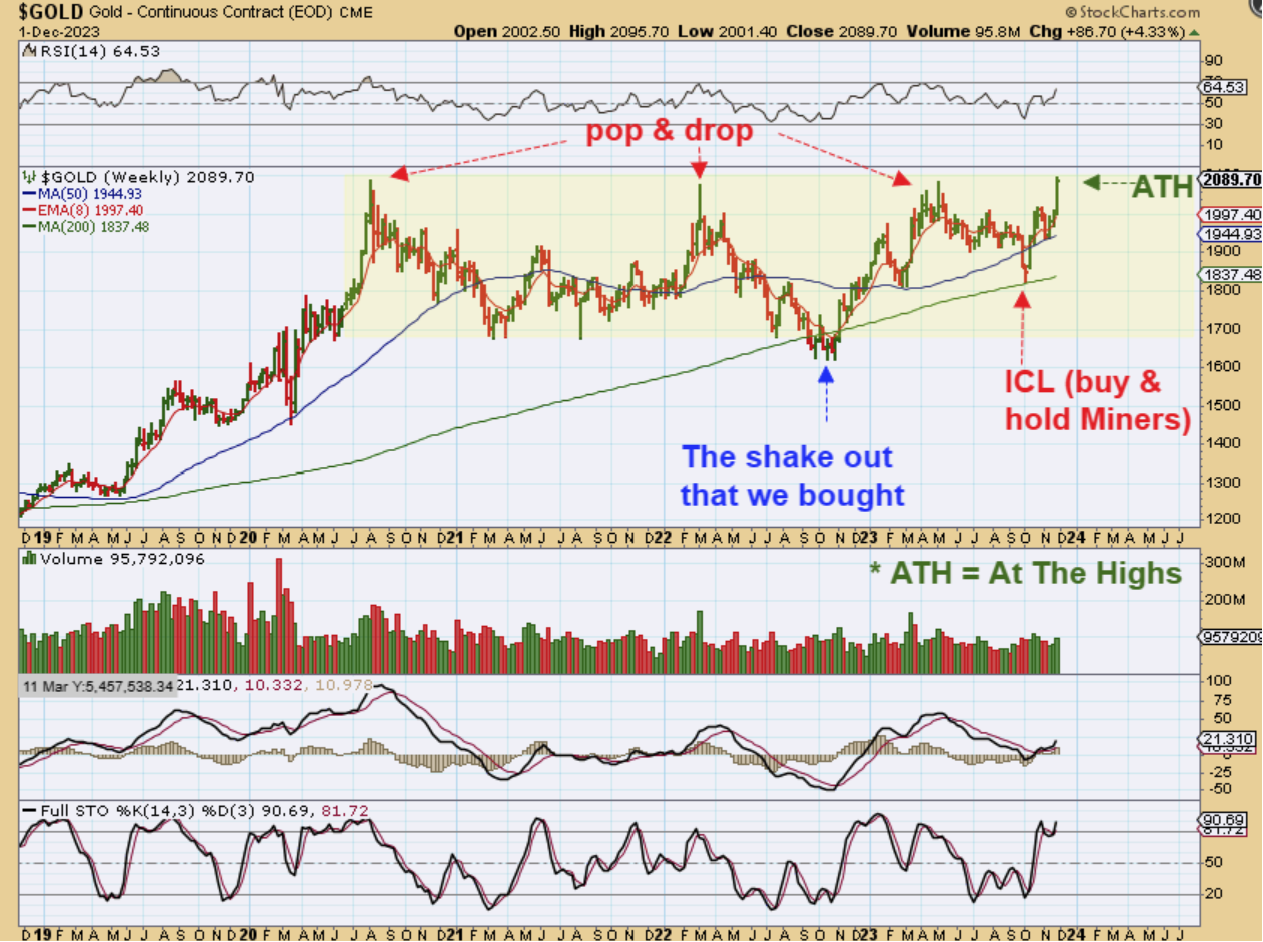
You can see on this GOLD WEEKLY CHART that Gold closed at the highs. It closed at the highs with the USD reversal, so it did not have a reversal candle at the highs following the USD reversal candle.
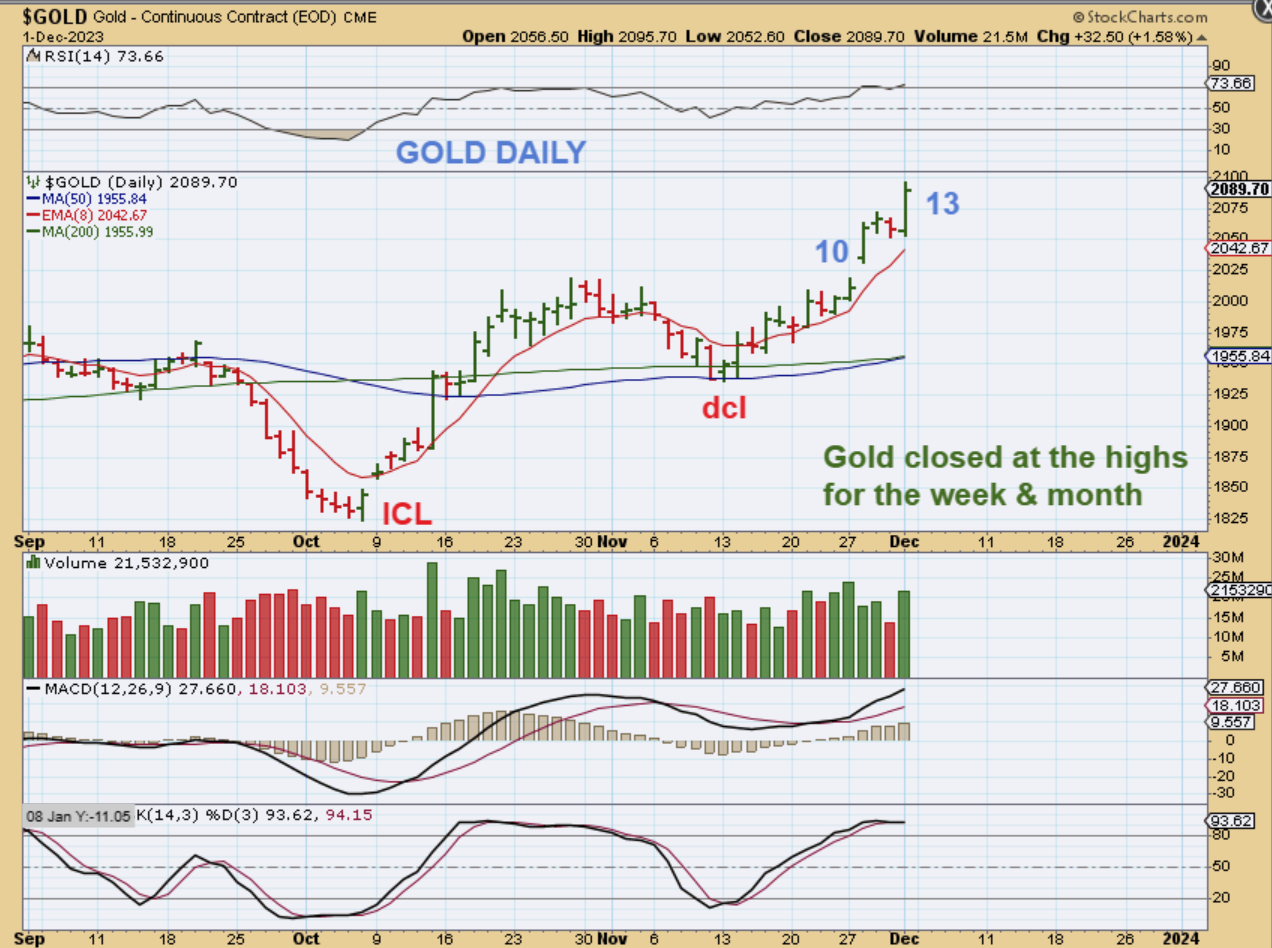
GOLD DAILY – Here we see Gold on day 13 (for stockcharts, day 14 on spot golds chart), up at the highs and climbing along the 8 ema on this run of the first and 2nd daily cycle. This is a bullish run for Gold out of both lows.
.
On a weekly basis, Gold closed near the all-time highs for the first time in years. In the past it ran up here and sold off at the end of the week giving us the weak looking pop & drop. Gold is at the highs. This looks very promising for a break out soon.
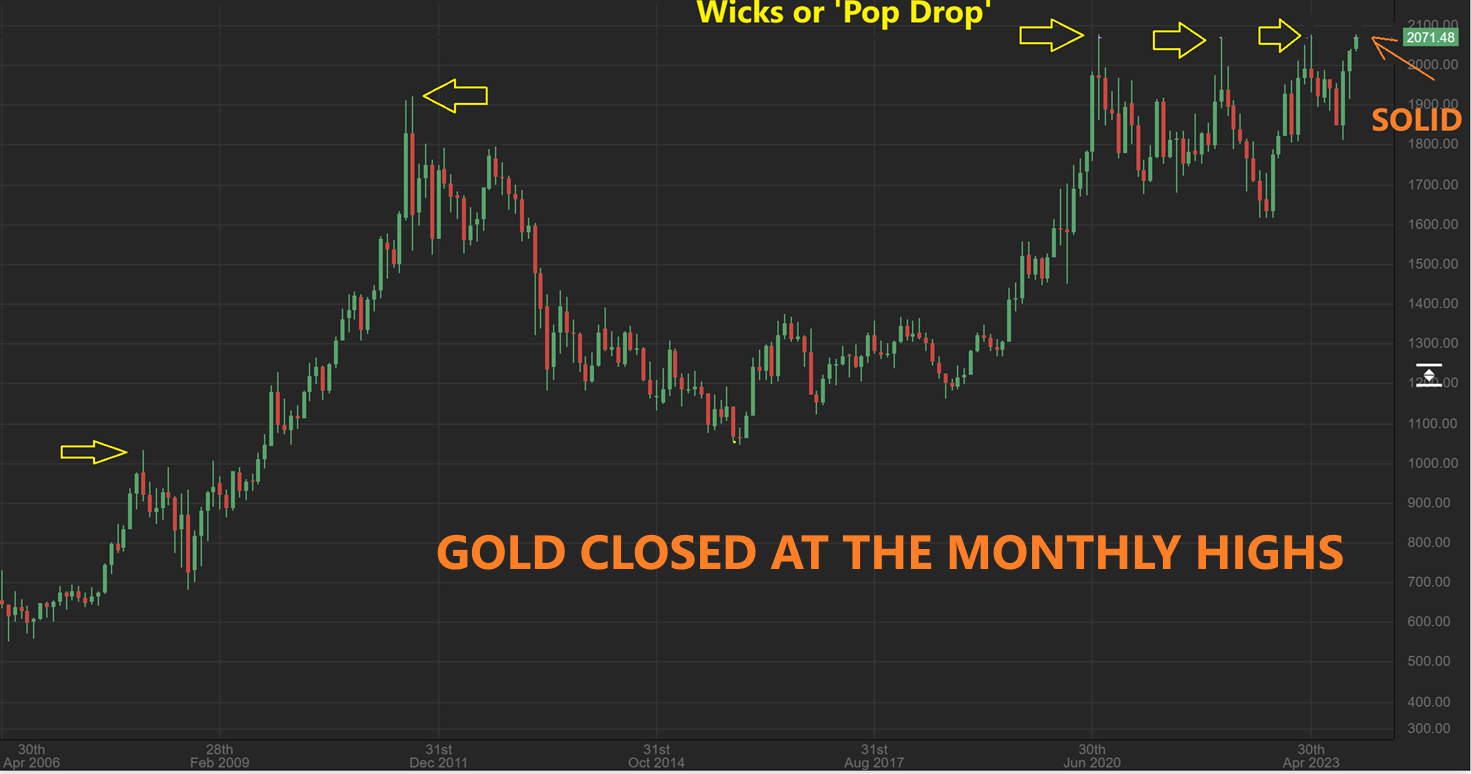
GOLD MONTHLY – We see the same thing with the Monthly chart. In the past, Gold ran up to the highs over $2000 and then sold off, giving us ‘wicks’ and a pop and drop for the month. This time Gold is at the monthly highs. Again, I was reading on Twitter last week that several people are recommending that there is no better place to go short the precious metals than right here. That means that a breakout could cause a short covering rally as well as a buying rally, and in a big way.
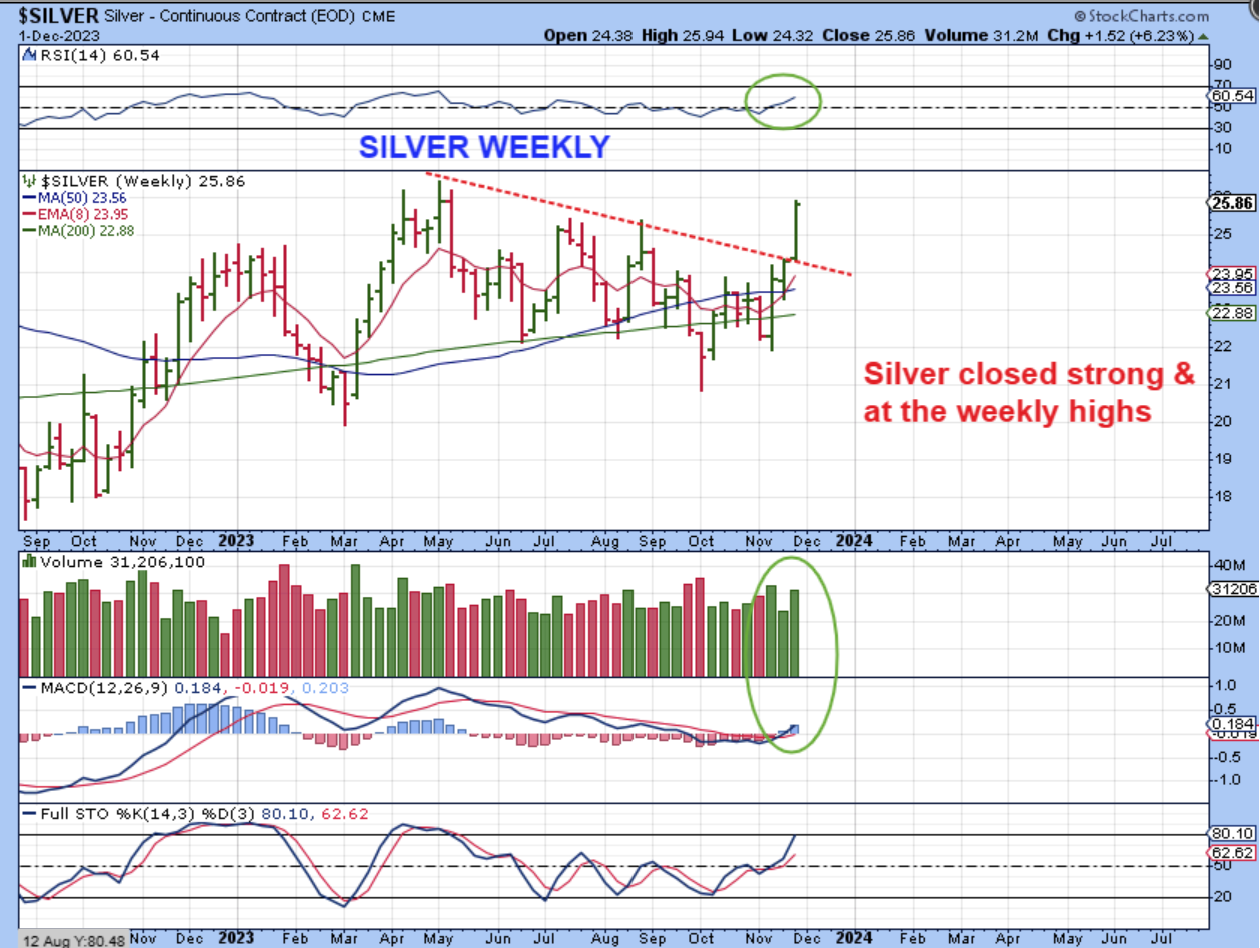
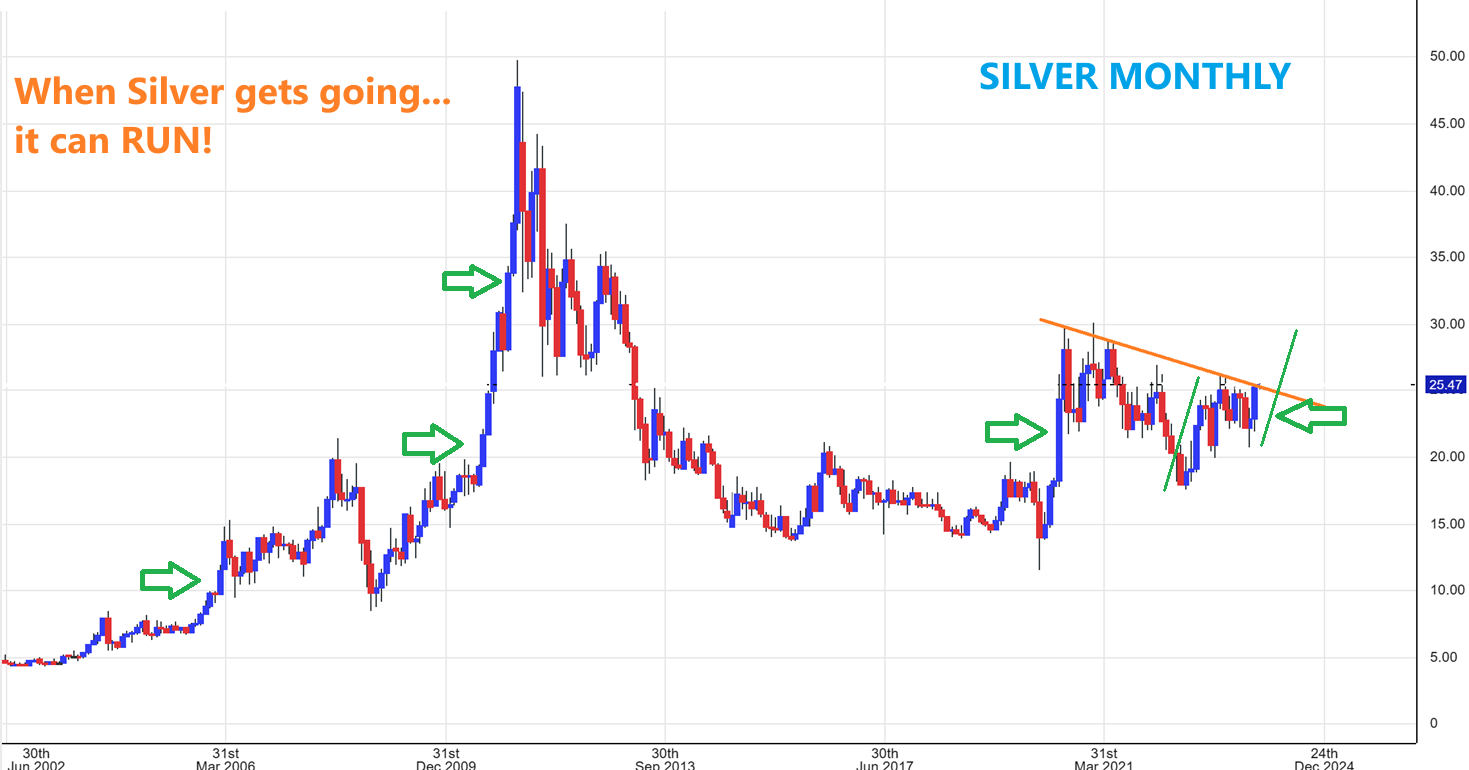
SILVER had a bullish weekly breakout and closed at the highs too. It also has a weekly MACD cross over.
The Big Picture View shows a massive consolidation that has lasted for 3 years! Silver could really run here.
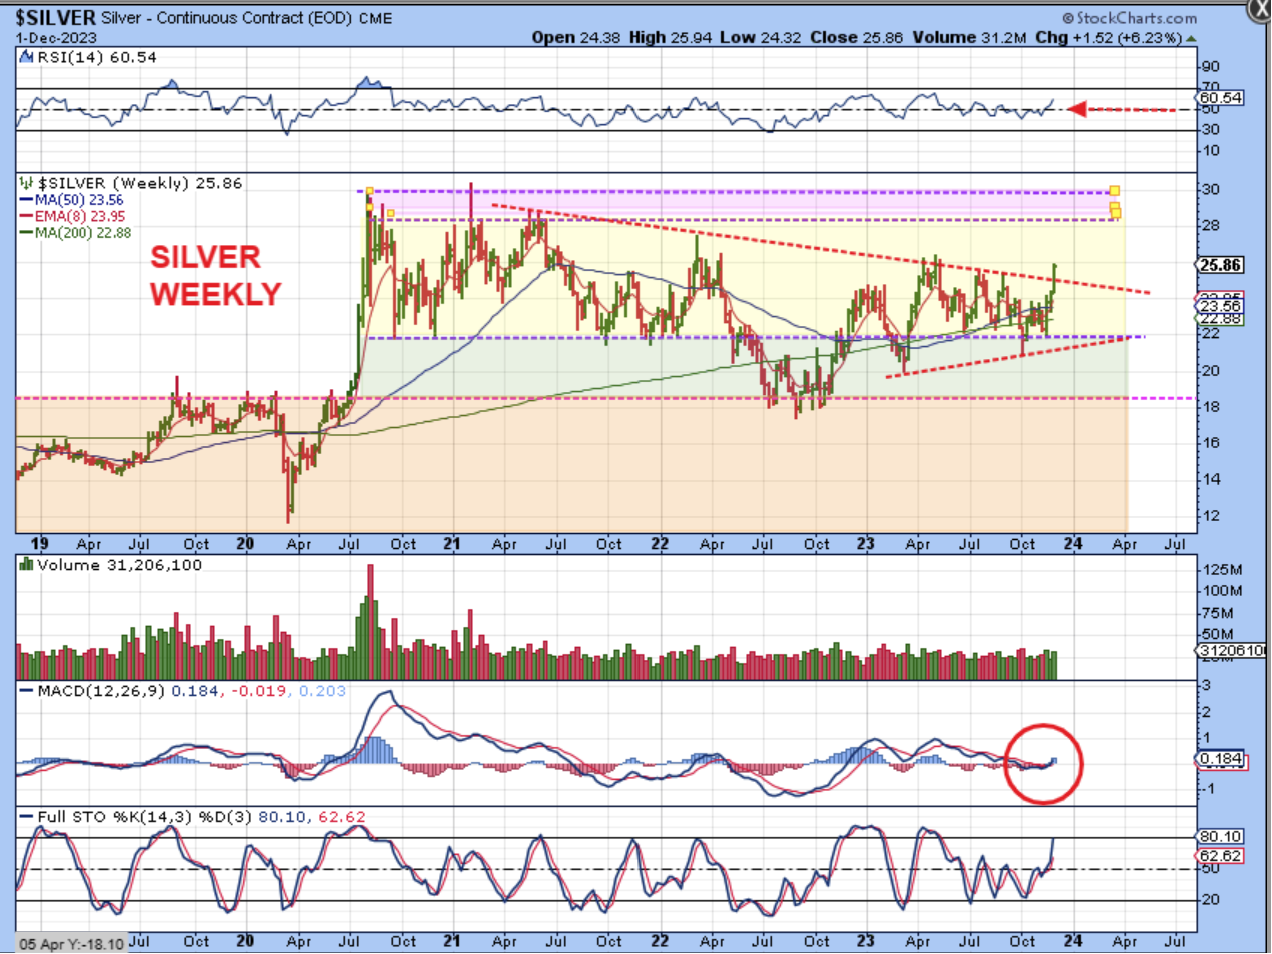
And this is the real Big Picture View. Silver has some very long candles when it gets bullish, so I wanted to point that out here. If Silver does a strong break out from here, we could see some fast gains. I might add to or buy more silver stocks at that point.
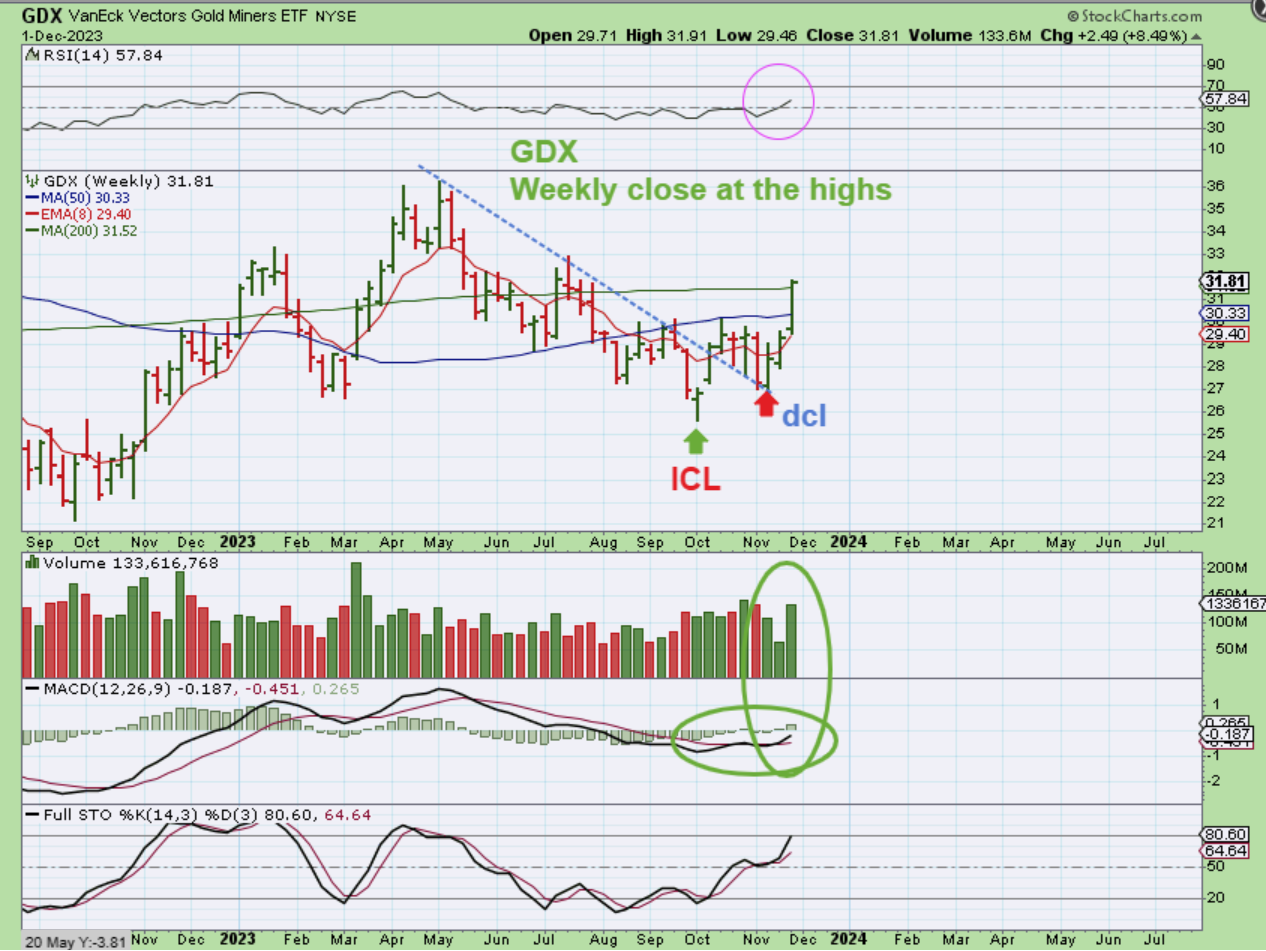
GDX made a strong move this week and it also closed up near the highs, GDX had an 8.5% ramp up!
.
We have been enjoying some very bullish markets and very bullish set ups over the past several weeks. Looking at the charts in this report you can see that at times we may have had to endured a little choppiness and sideways action at times, but payoff for those that were patient is paying off. The set ups remain Very Bullish. It has been best not to overtrade, but to stay invested with the basket of Miners or crypto stocks that we bought at the lows. If Gold makes a break to all-time highs and starts to trend higher, Many doubters could begin to buy and accumulate too, adding to the bull run. Things look very good for December and on into 2024. Let’s enjoy the ride! 🙂
.
~ALEX
.
REVIEW: I have been discussing the great expectations for Bitcoin in 2024, which is the year of halving that takes place every 4 years. The idea of an ETF is exciting many too. I discussed how in 2016 and 2020 we saw bitcoin rally in a HUGE way, reaching new highs each time, and I expect that to happen again in 2024. I actually called the bear market lows at the end of 2022, and recommended crypto stocks like MARA and RIOT that ran very well. After a sell off into the recent ICL, they have based out and started higher again. We are making excellent money here again, so Now let’s continue the review with charts from past reports…
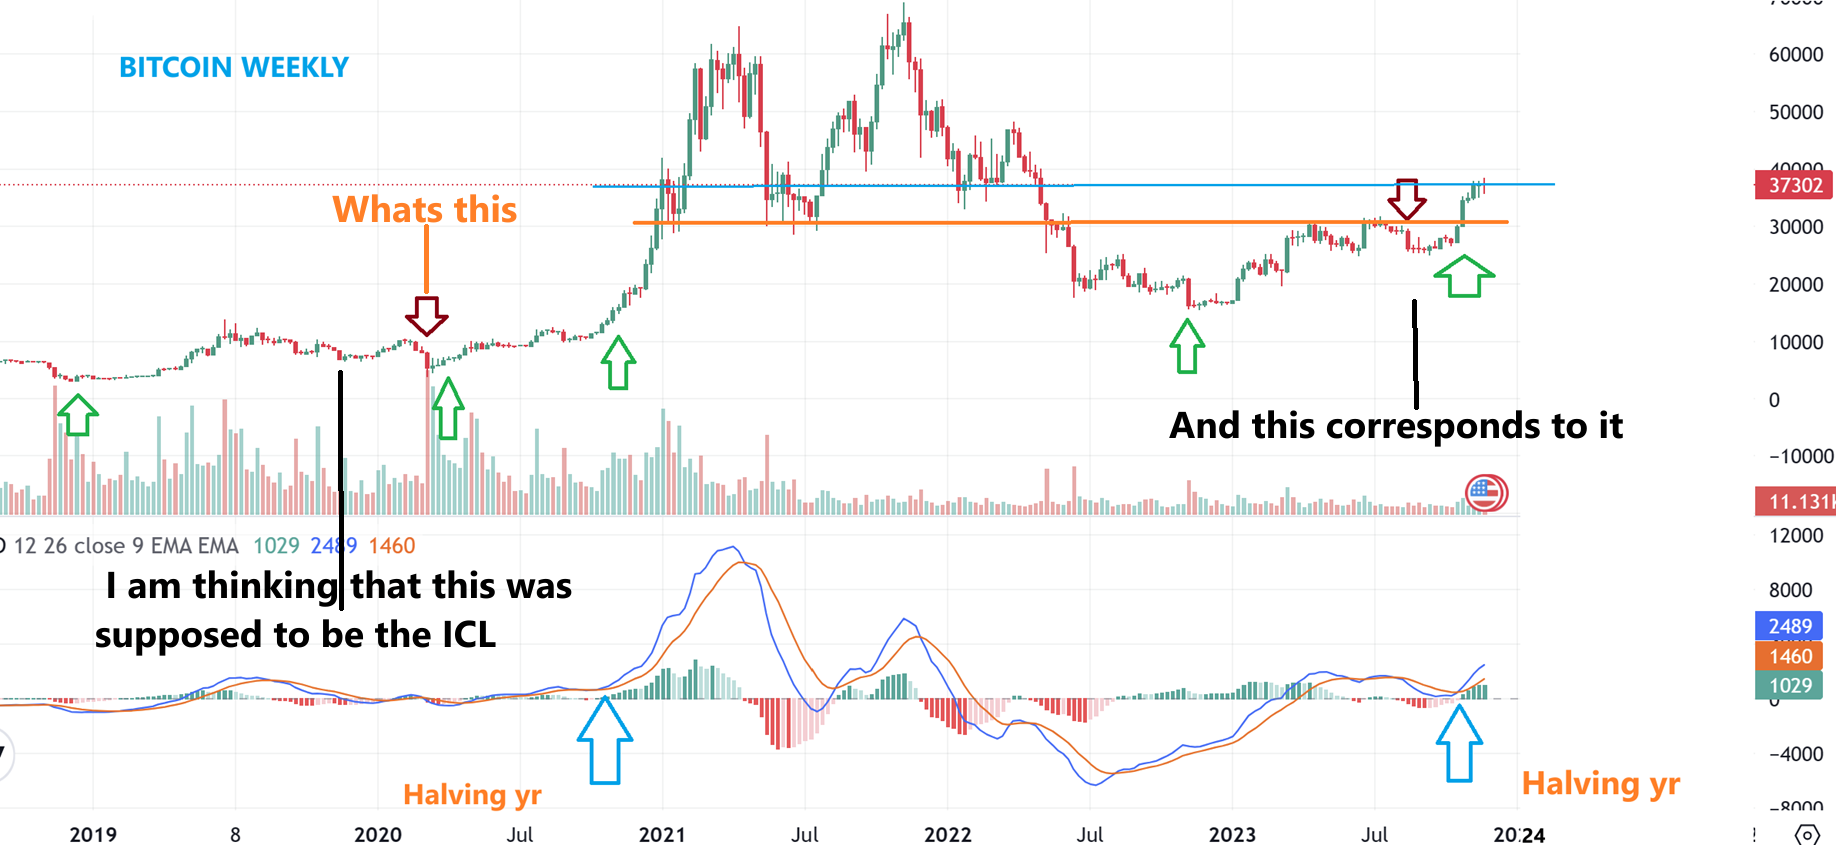
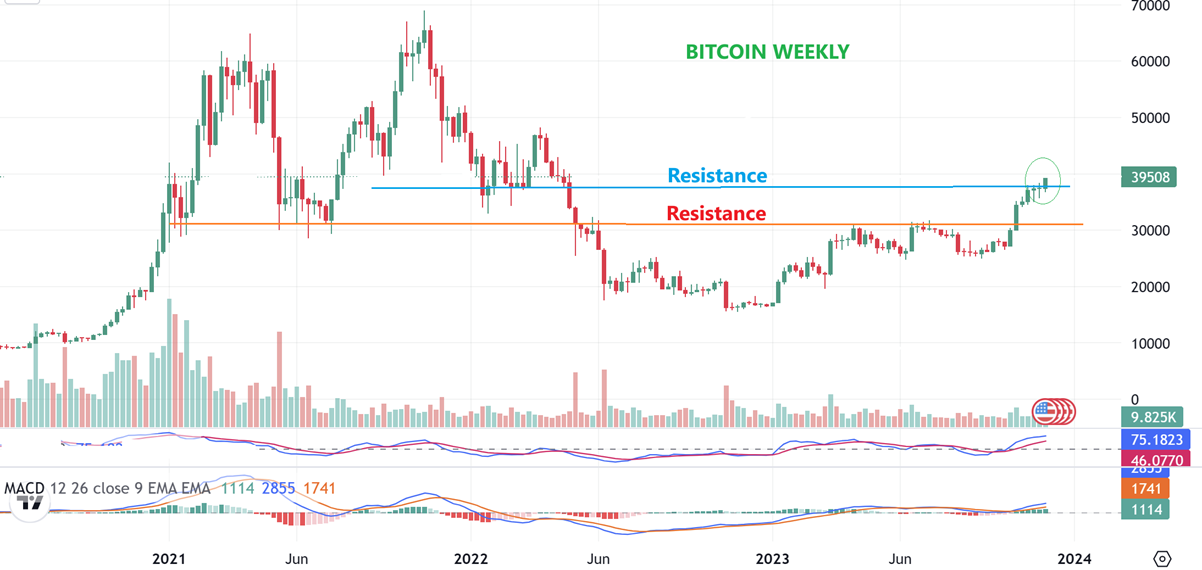
BITCOIN WEEKLY – In a recent report I compared the chop before the ramp up at the halving year of 2020. I felt that we had an ICL toward the end of 2019, but then that covid slam down that is found in every chart ( SPX, QQQ, GDX, GLD, SLV, etc ) was an anomaly in March 2020. Then I pointed to the recent weekly drop down as the ICL that corresponds to that 2019 one. So …
BITCOIN DAILY – Bitcoin really would have had to have had a mild ICL, and I noticed that the uptrend was broken and recovered, so this should mark the ICL. Following the ICL, Bitcoin ramps up and I said that this current ramp up is a move out of that somewhat milder ICL….
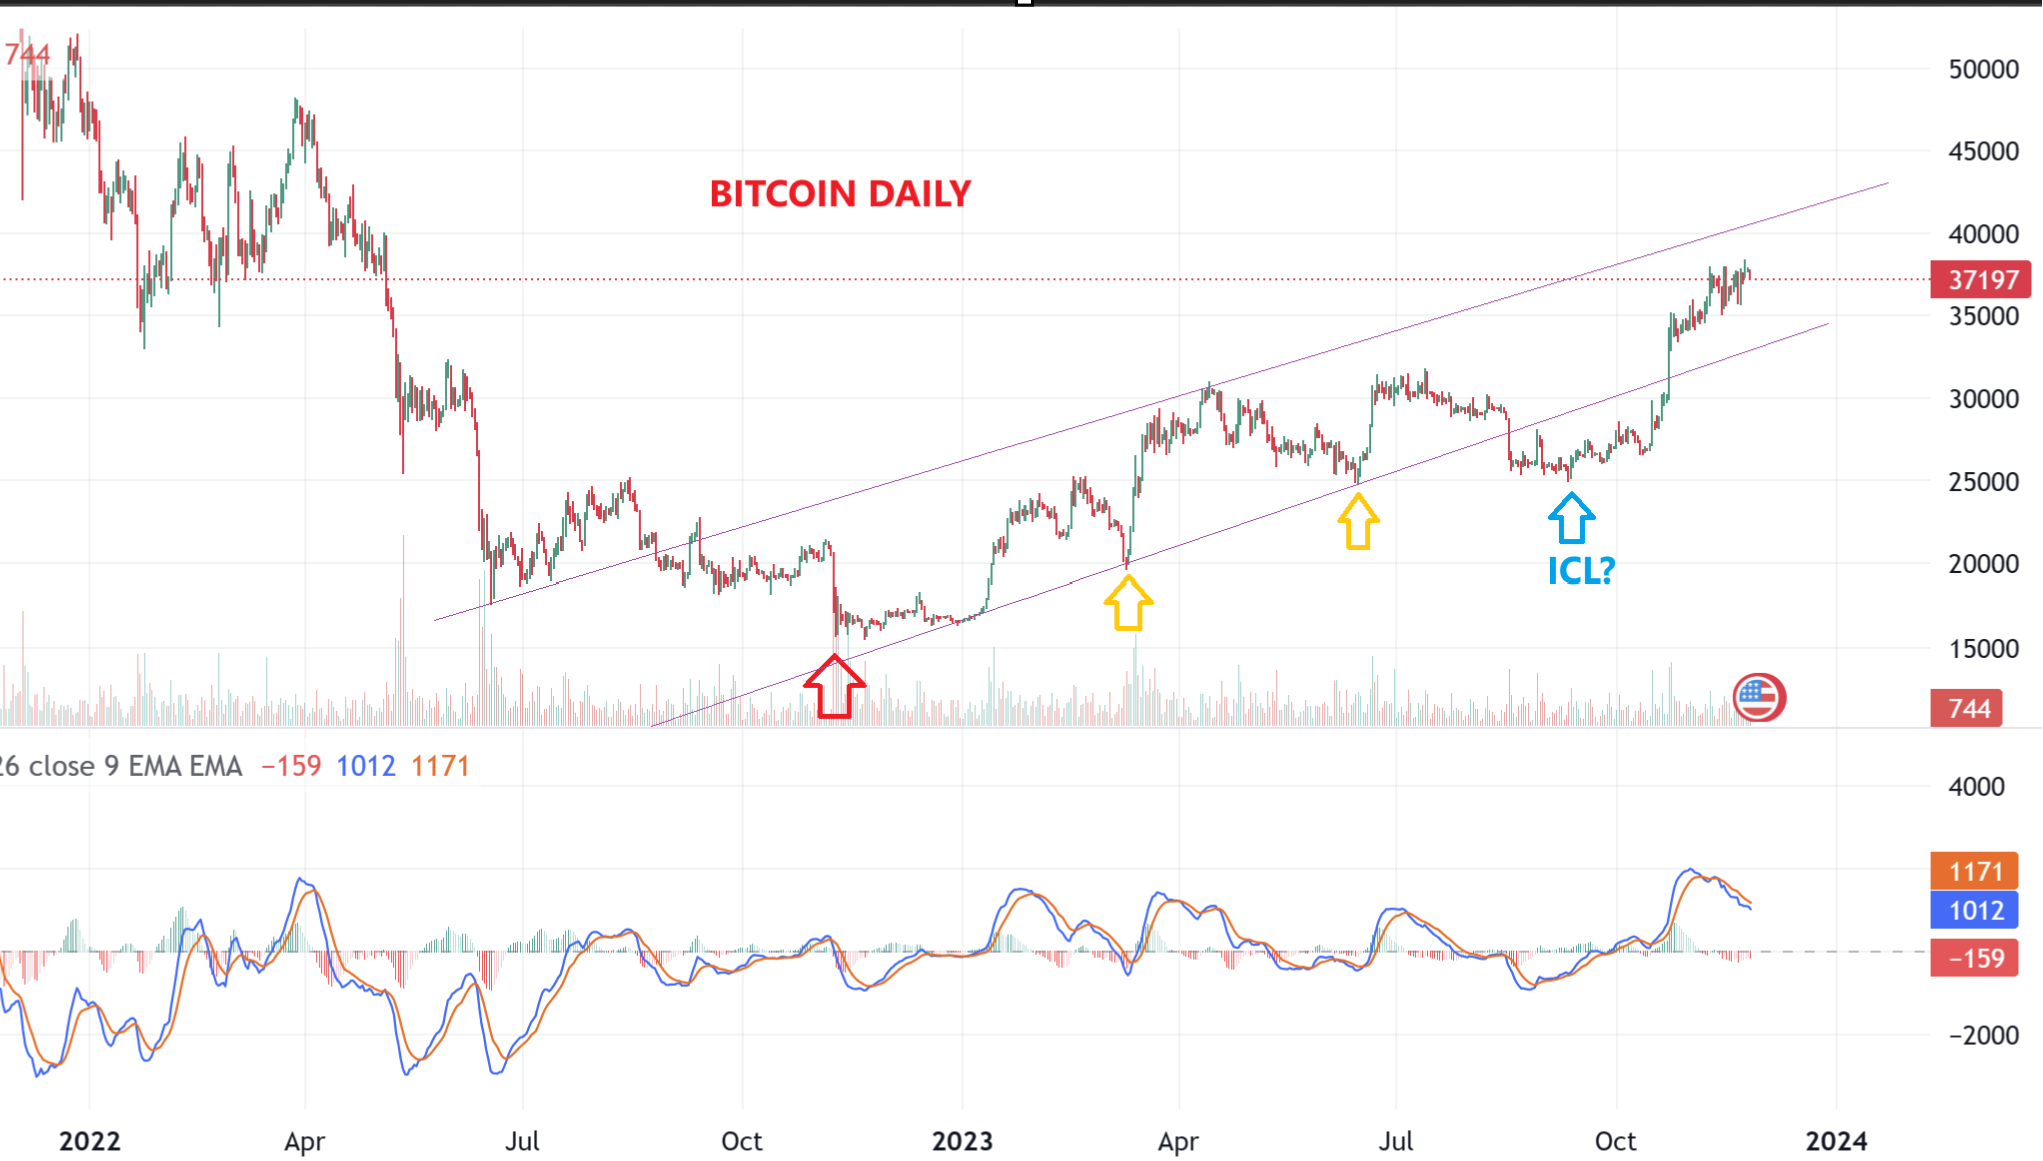
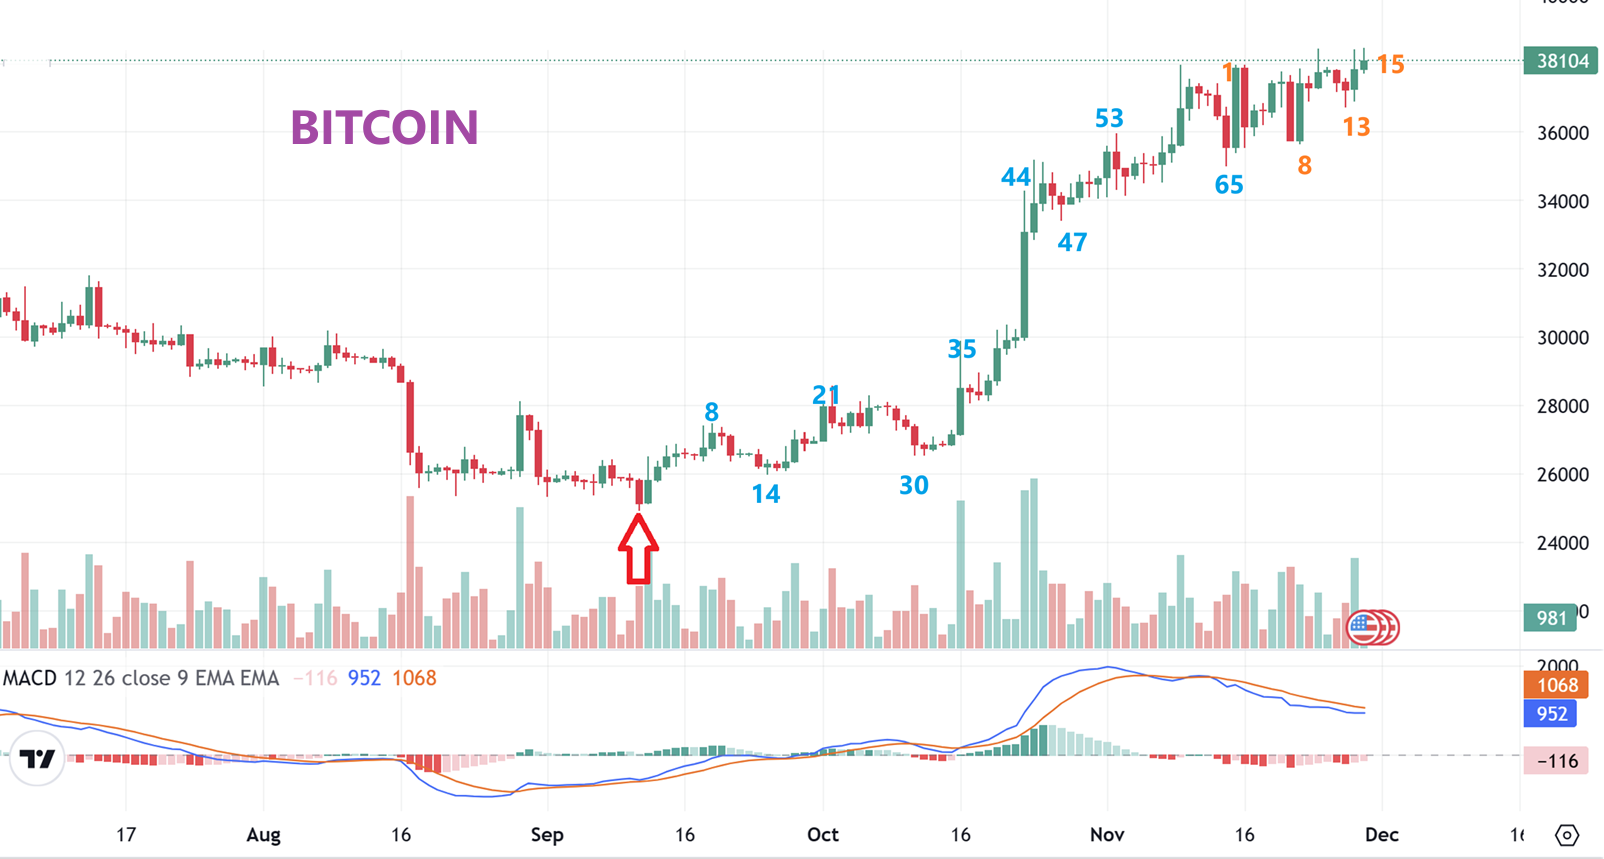
BITCOIN DAILY CYCLE COUNT: I then discussed the cycle count out of that ICL, using 30 day and 60 day markers. You see what I label a 1/2 cycle low at day 30, and then a drop into a DCL came in at day 65. THAT MEANS that we should stay long, since this choppiness was only day 15 of a possible 60 day move. Could Bitcoin now make its way through that resistance area that I had marked? It was very possible this early in a daily cycle…
.
BITCOIN WEEKLY – Bitcoin continued to push its way through resistance, with that dcl in place recently. By the end of this week Bitcoin was still trying to push through that resistance and this had an awesome effect on our basket of Crypto Miners over the last couple of weeks. Let’s take a look…
.
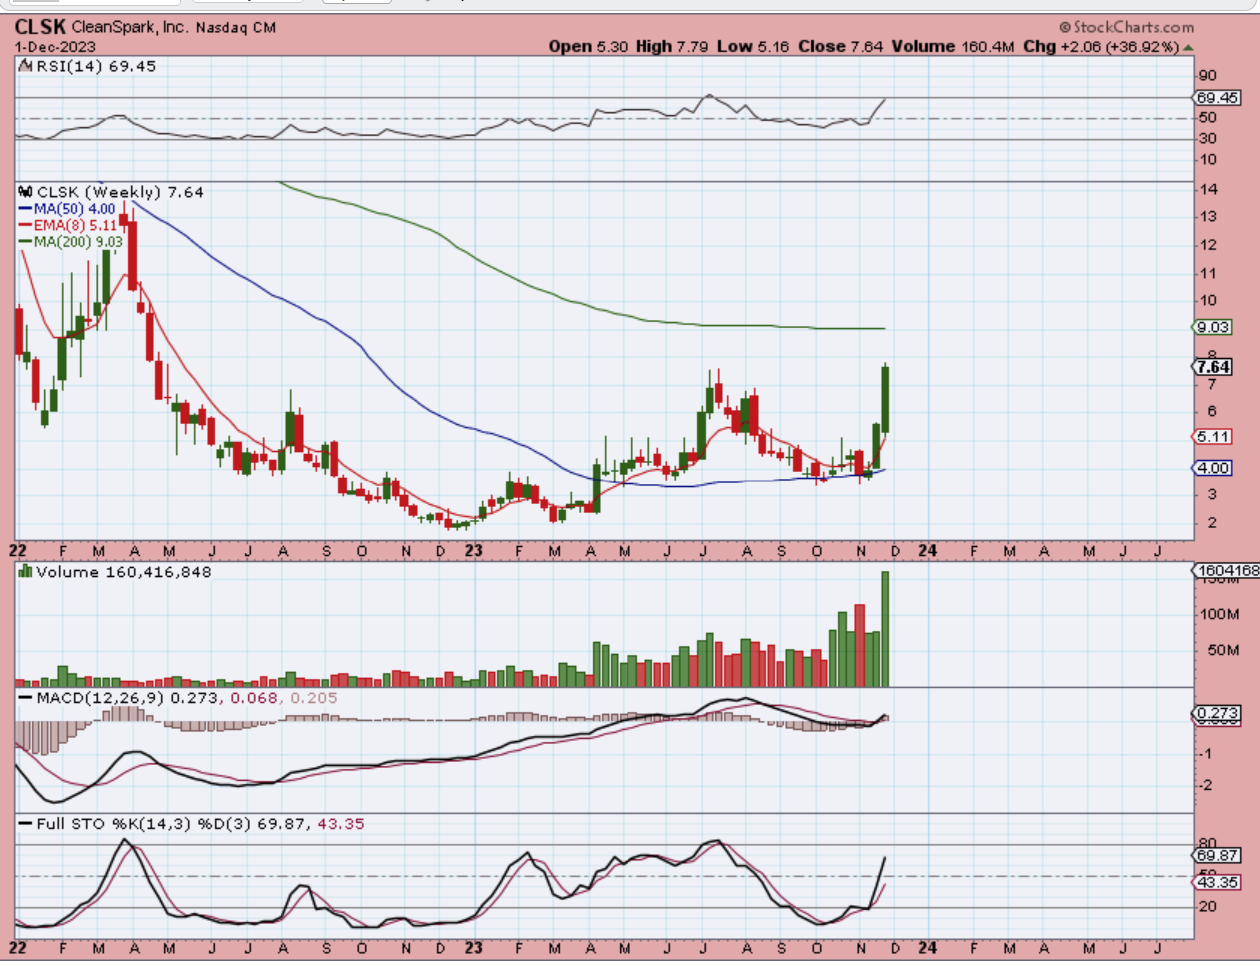
Well, CLSK was up 42% last week and 37% this week. It’s not even overbought!
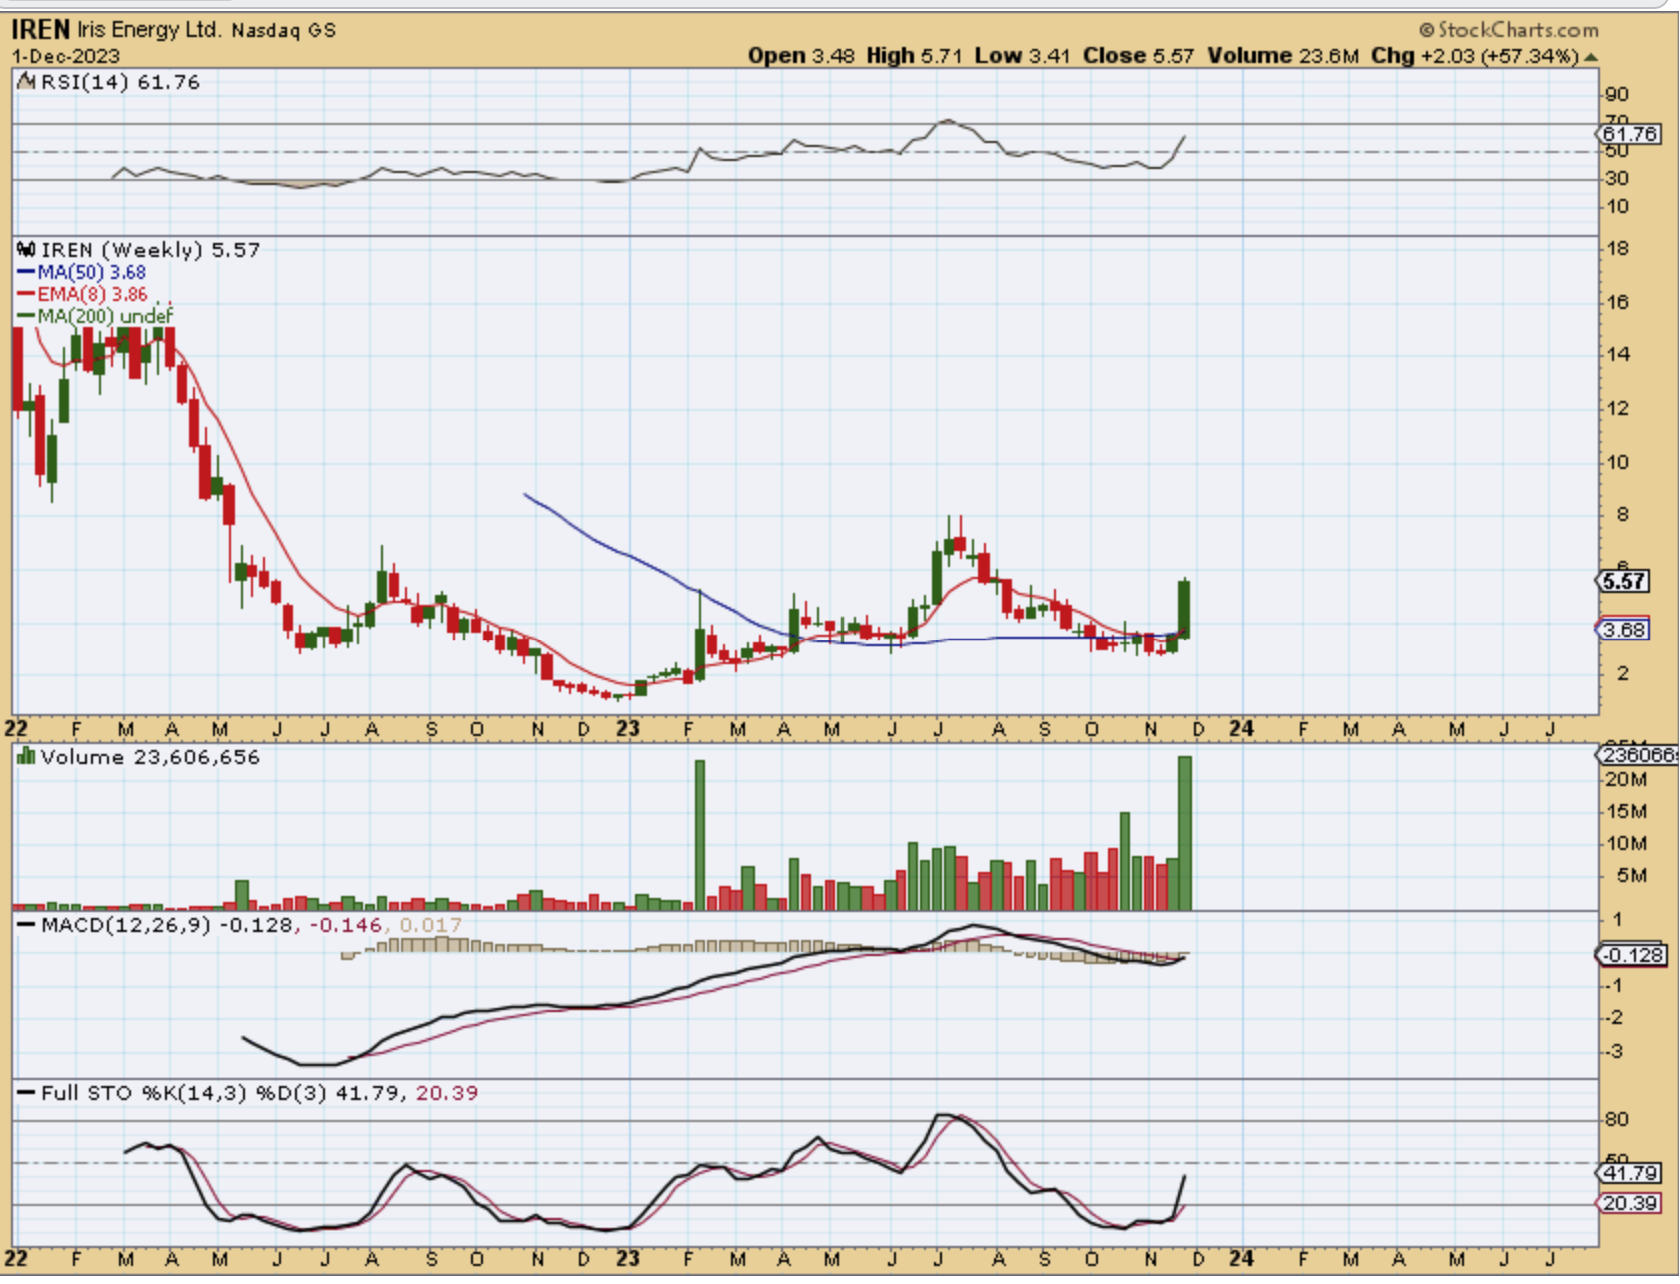
IREN was pointed out as taking off out of base, and it was in my basket. IREN surged up 57% for the week, with huge volume.
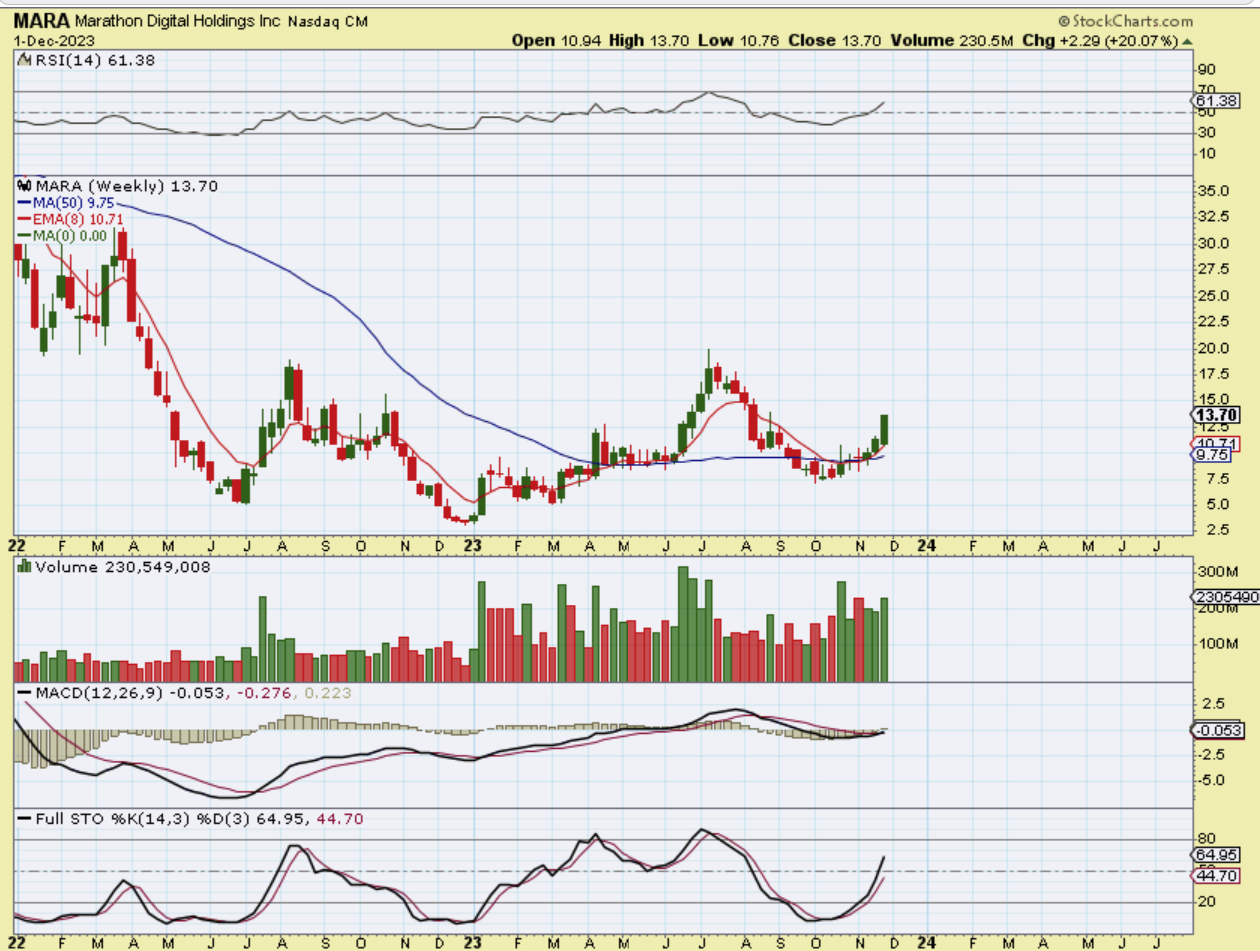
MARA WAS UP 20%
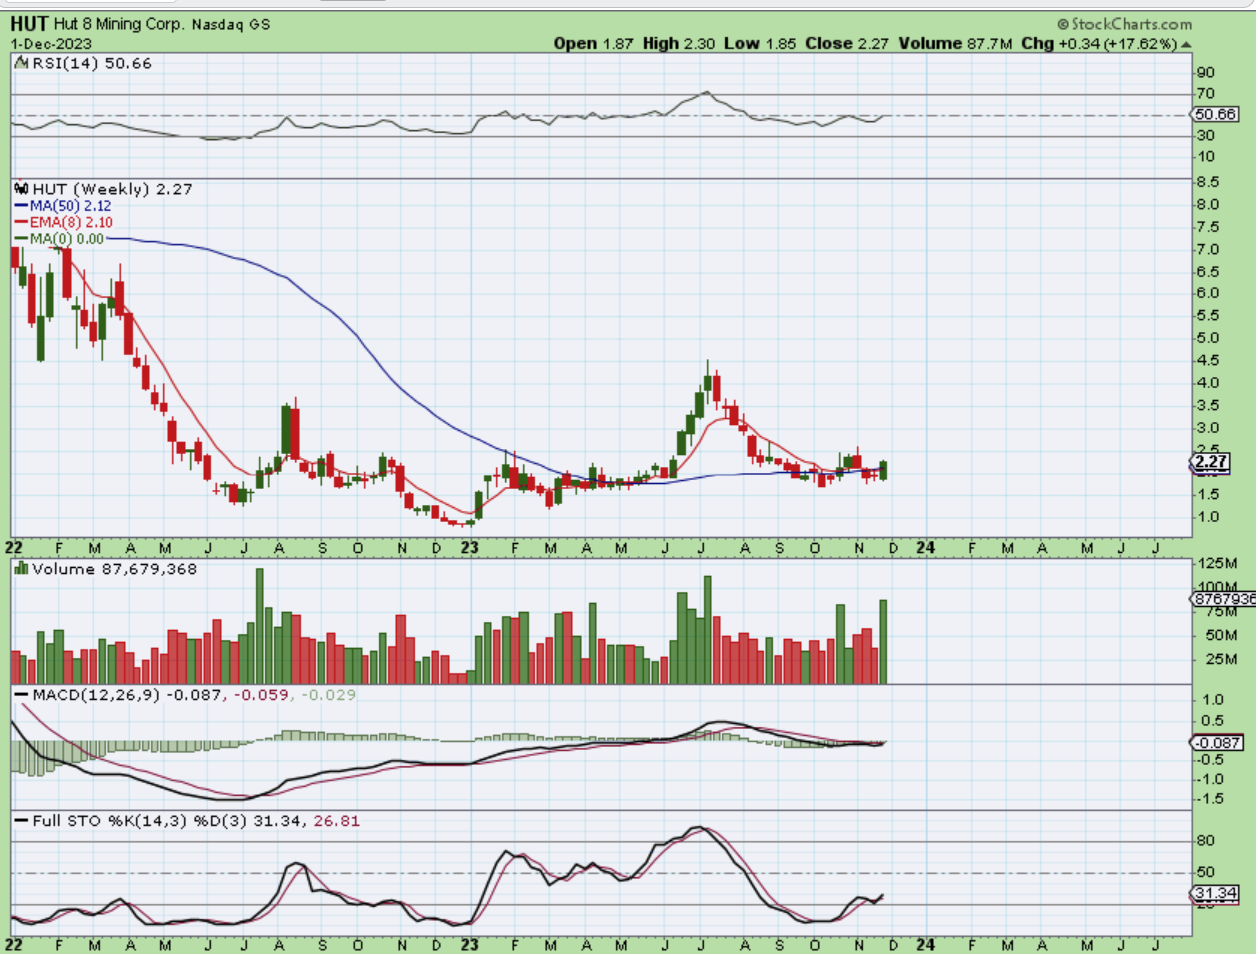
HUT, HIVE, BTBT & a few others were still lagging at the lows, but they popped at the end of this week, gaining 18% on average now that Bitcoin and other Alt Coins were running.
Did you notice that these are
1. Still at the lows,
2. Still oversold, and
3. Still look like they have plenty of upside? They do and there are others, so I will continue to cover these and their bullish set ups in the daily reports throughout the week with daily charts.