Weekend Report – November 26th
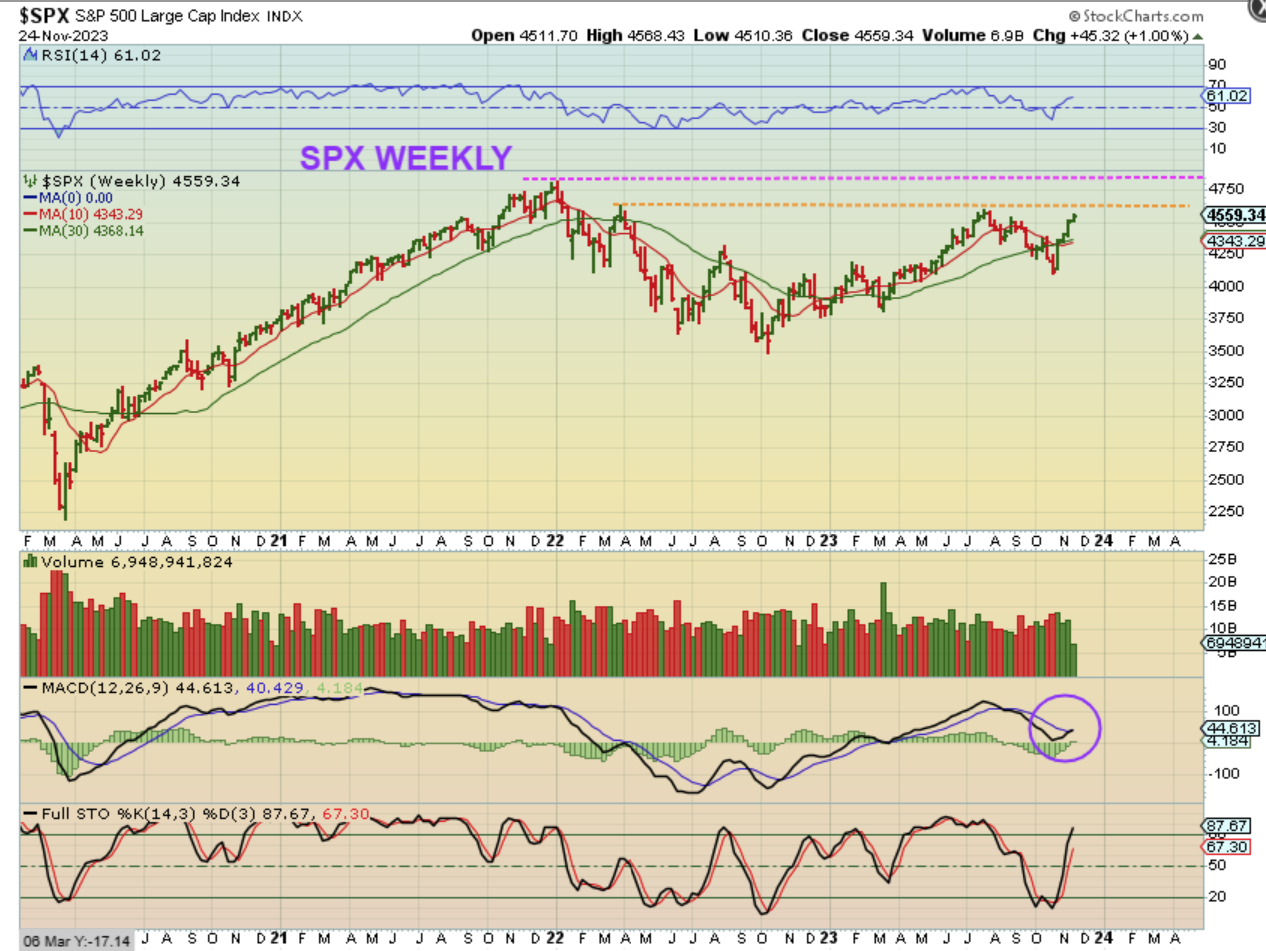
SPX WEEKLY– We have a bullish run out of the ICL and a 4th straight week of gains in the General Markets. It is stretched well above the 10 week ma, so it could pullback or churn sideways soon too. That said, for many, buying near the lows of the ICL or along the way is often a buy and hold trade for a few weeks or even a couple of daily cycles which can last for a couple of months.
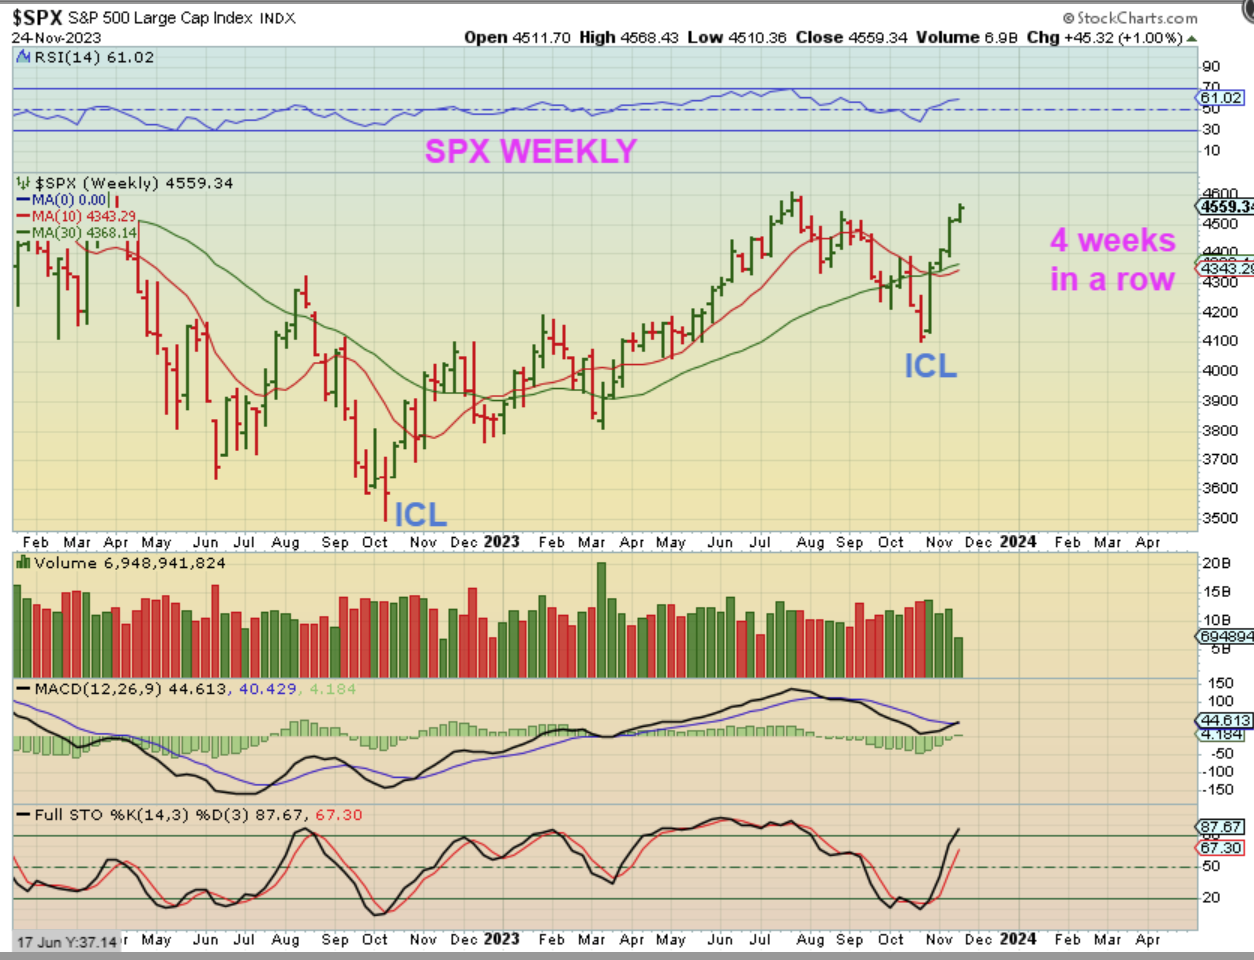
SPX WEEKLY – In the big picture we are already almost back at the 2023 highs, and I have drawn lines of price targets from former highs in 2022 marked out here also. We still have weeks and even possible months of upside from here, though it may get choppier over time.
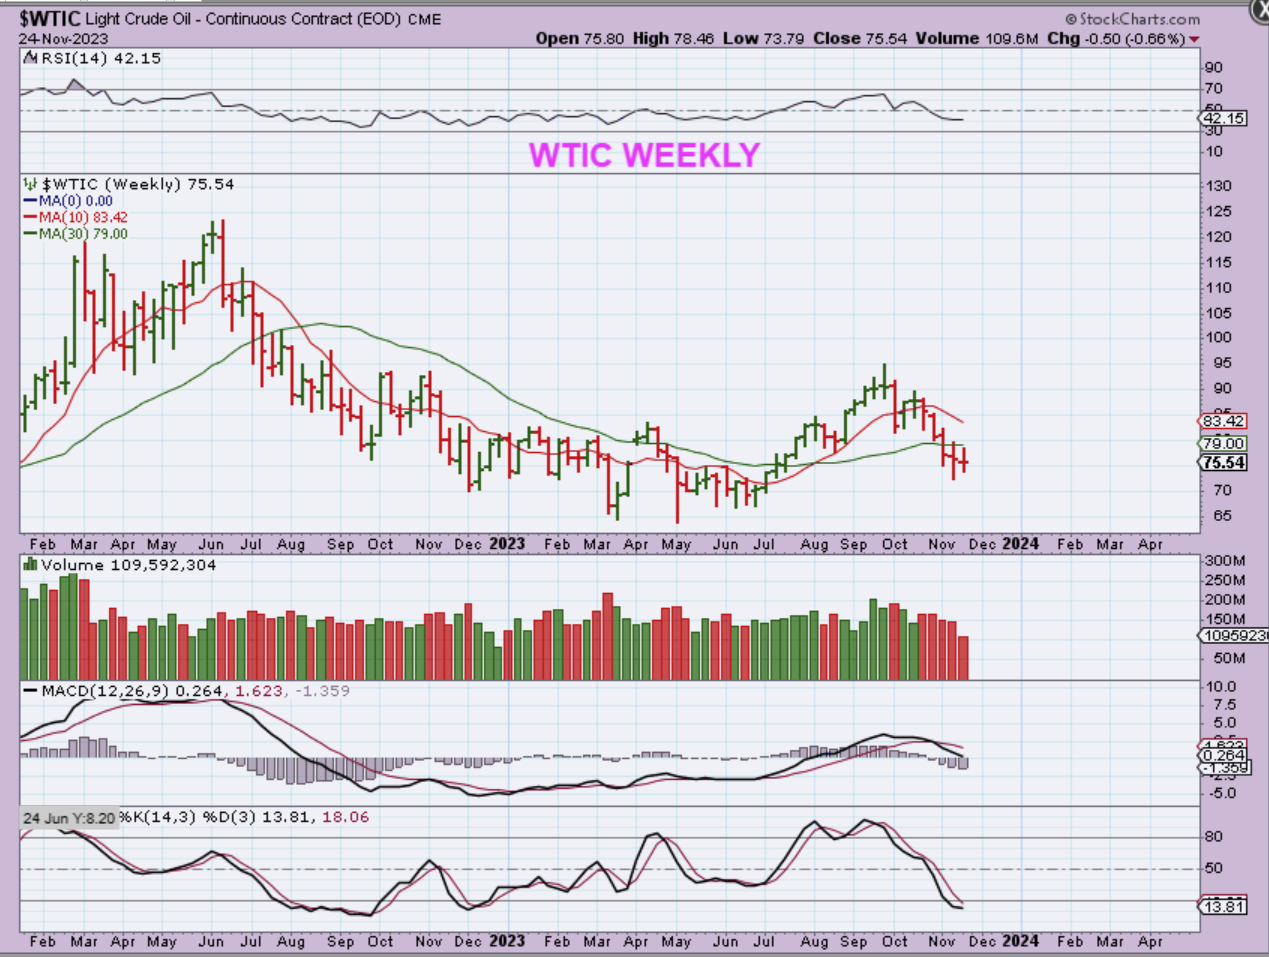
WTIC DAILY – Oil is due for a low and has become choppy at the recent lows. With this recent choppiness the MACD has now crossed higher, so normally I would expect that we should break above the downtrend. It could be considered a ‘buy’ as it breaks above the 200sma and downtrend line, but I am personally not really trading Oil lately. I like other sectors set ups better, since Oil has become choppy and difficult. If it starts to trend higher, it may offer better results.
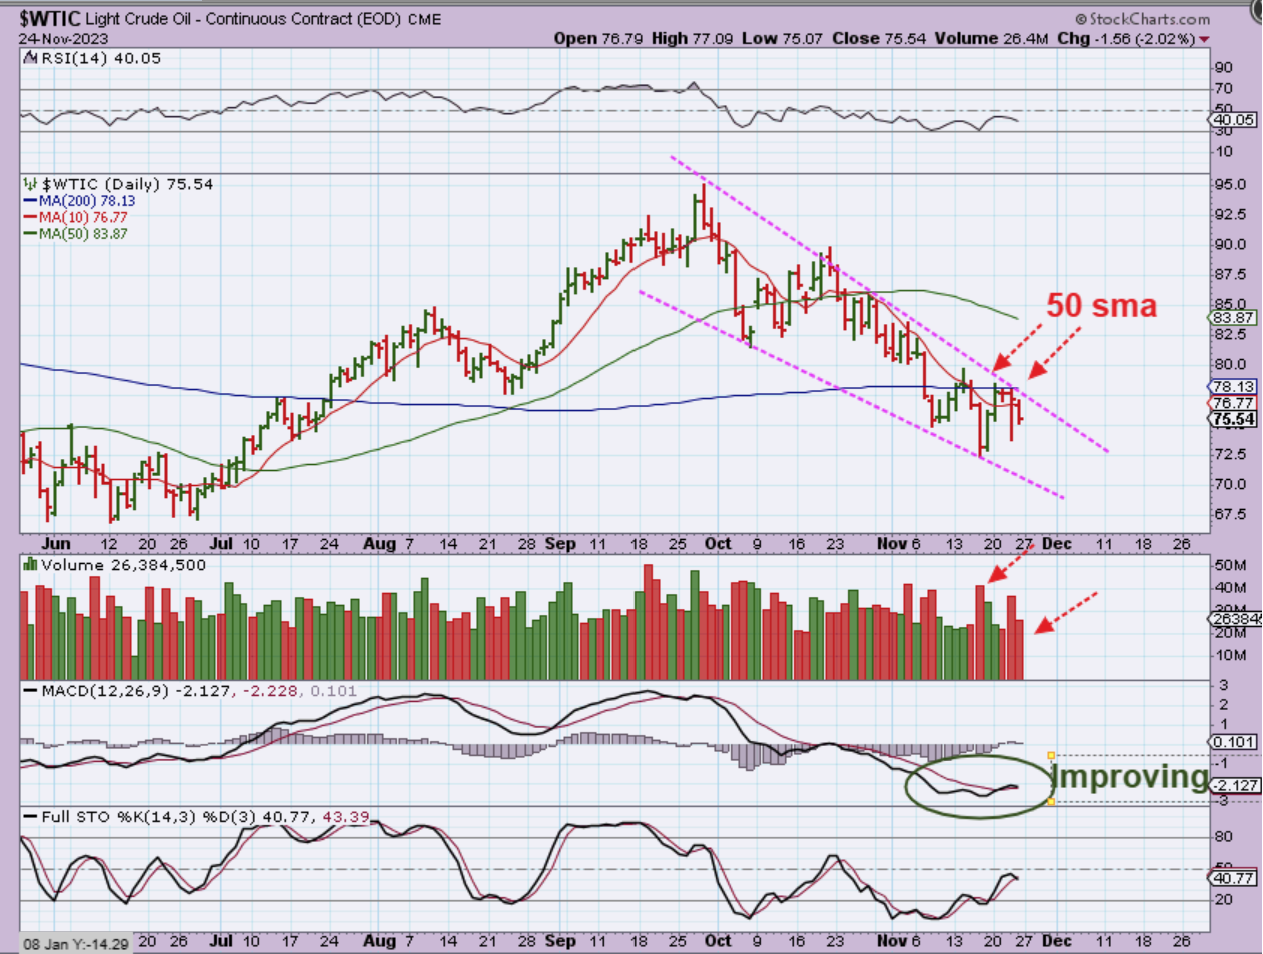
WTIC WEEKLY – The weekly chart is finally oversold and we have 2 indecision candles at the recent lows, so again, we could see a reversal higher next week, but I am more interested in the General Markets, Precious metals, and Crypto set ups.
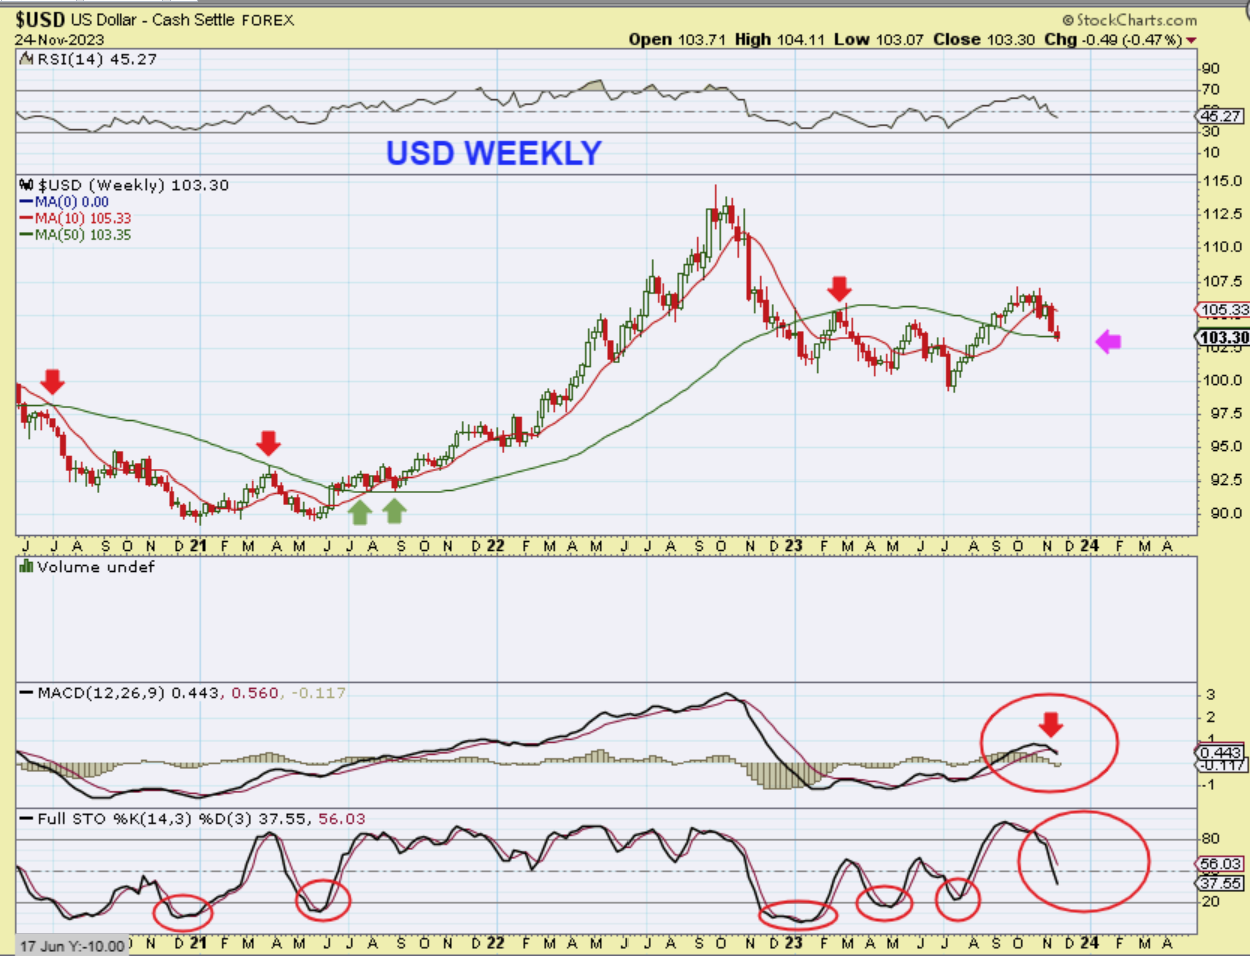
The USD topped out and is rolling over as expected. It can bounce higher and chop around short term, but it is basically on its way to putting in that 3 year cycle low that I have been mentioning for a over a year now.
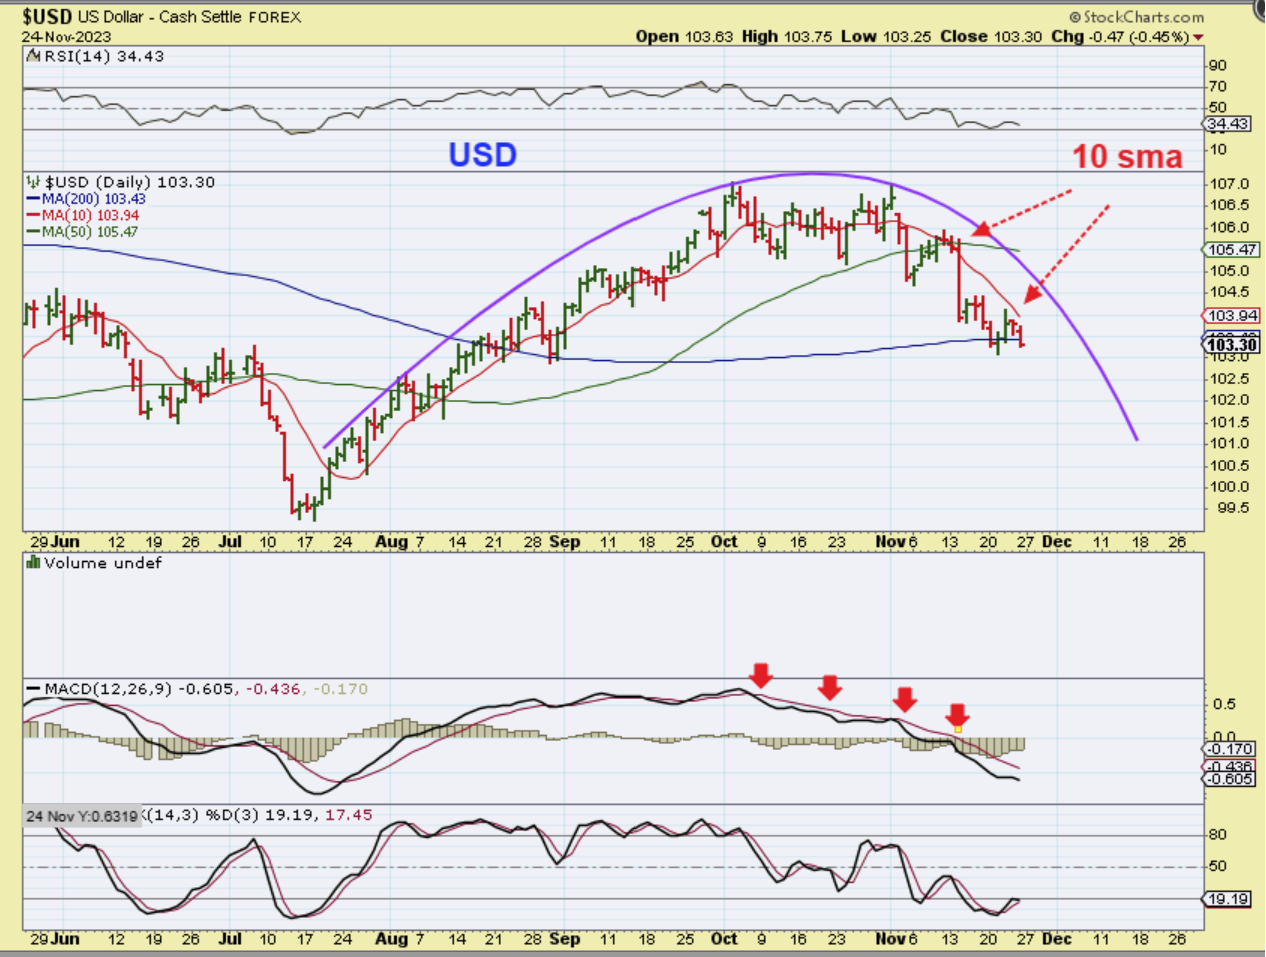
THE WEEKLY USD – I’m showing the green 50 week ma line and pointing out with arrows that price can react here. So far price is pushing through slightly below it, so we’ll see if this can continue next week too, or will the USD temporarily bounce back. If it does, I still would expect it to be a short-lived bounce. The stochastics is not oversold and the weekly MACD is crossing under. This calls for more downside in the big picture.
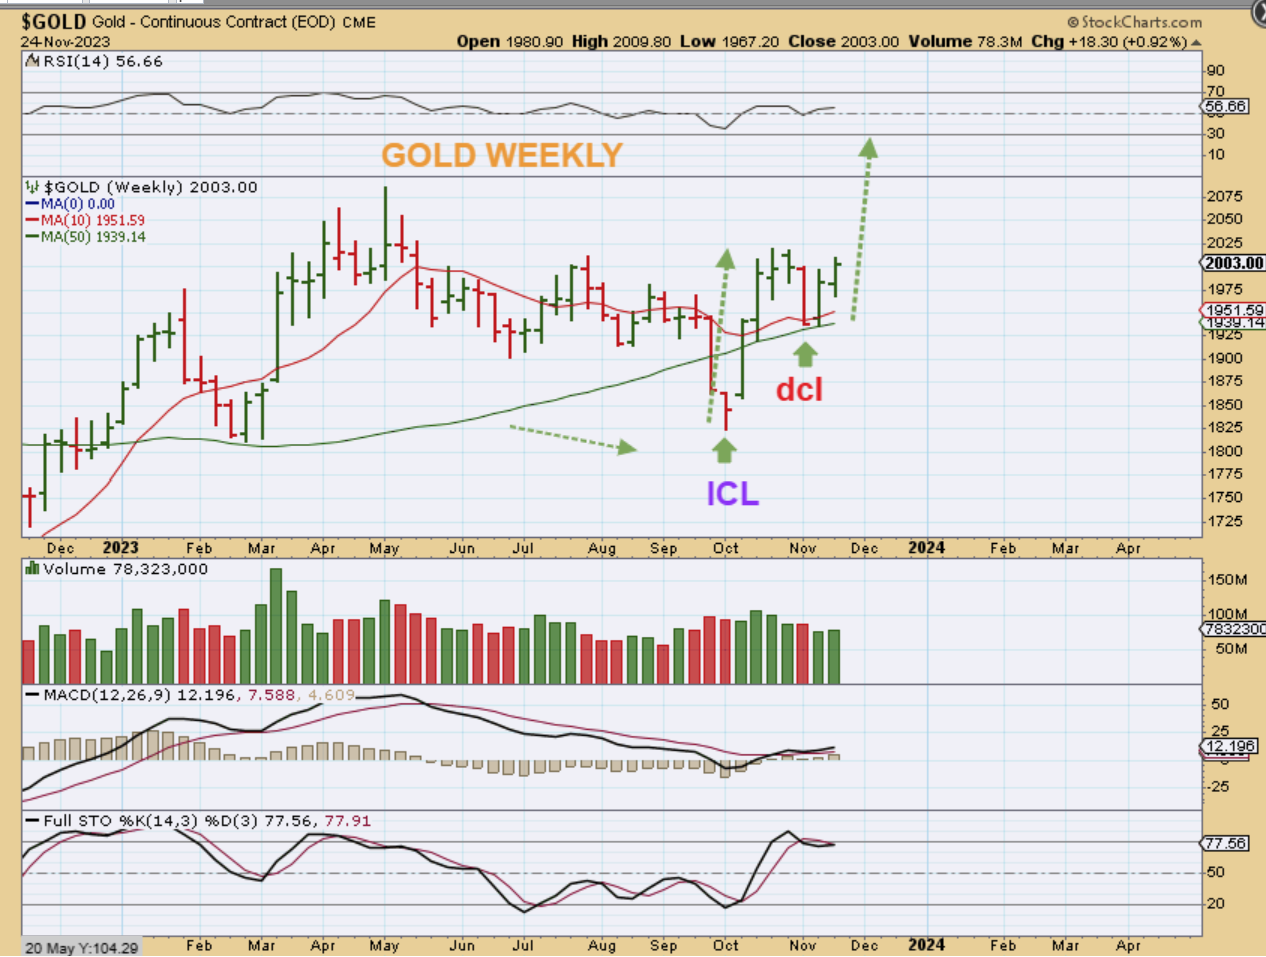
GOLD WEEKLY – The amount of energy that a massive multiyear consolidation like this can build up is big. Not only that, but after trying to break out to new all-time highs in early 2023, Gold chopped lower, but it did not reach the lower range again. We saw an ICL reversal at about midpoint in October and price now looks ready to run up to the highs again out of this recent dcl. This is a bullish set up for Gold using both Cycles and using Technical analysis. Let’s zoom in…
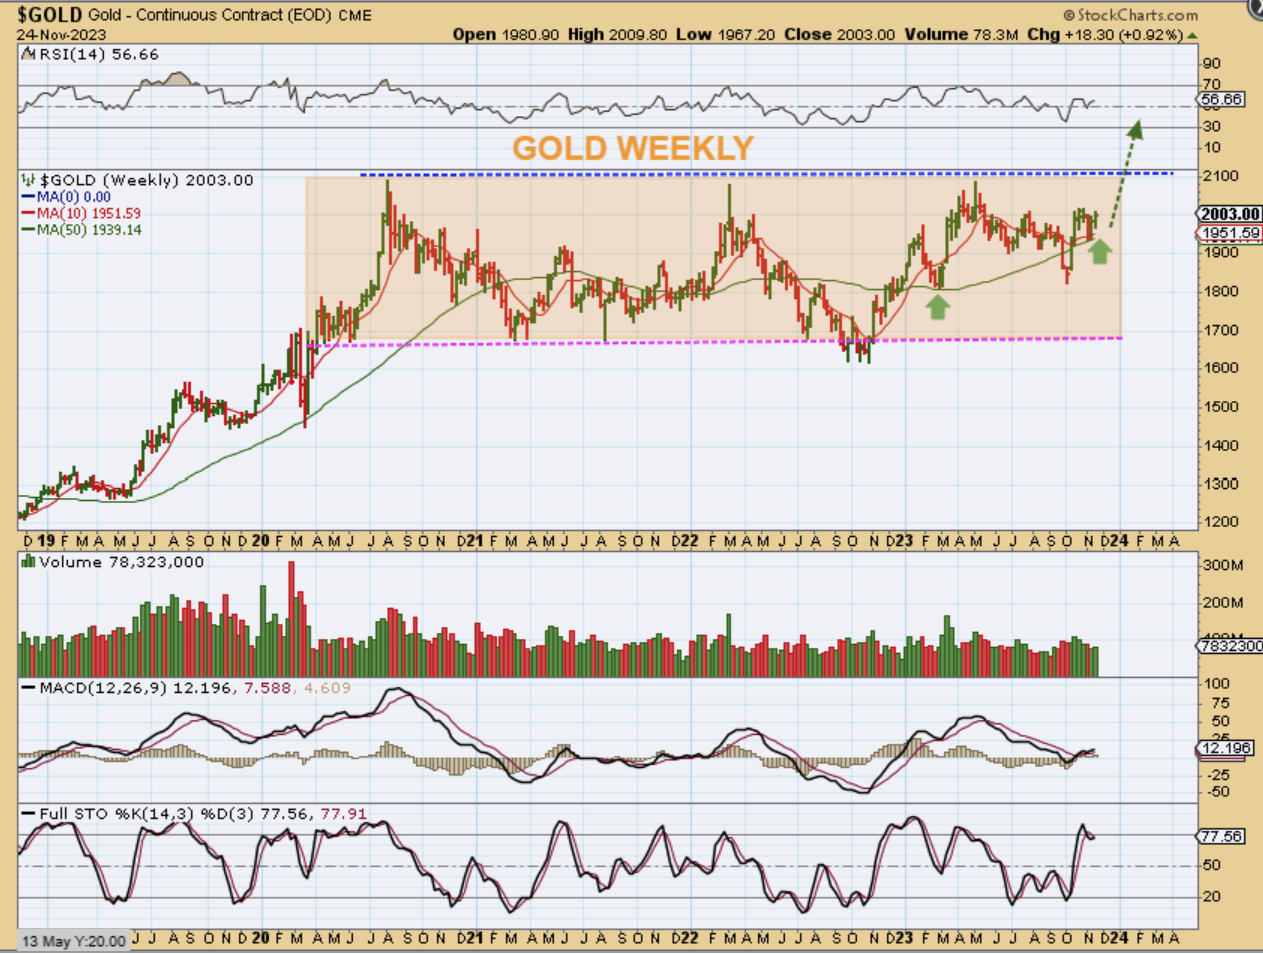
GOLD WEEKLY – So here we have a price ‘shakeout’ at the 50 week ma, and that gave us our October ICL mentioned above. Gold then ran out of that low, regained the 50 week ma, and back tested it for an early dcl at support. Gold is headed higher and could even break to all-time highs in 2023. The weekly MACD is bullishly aligned.
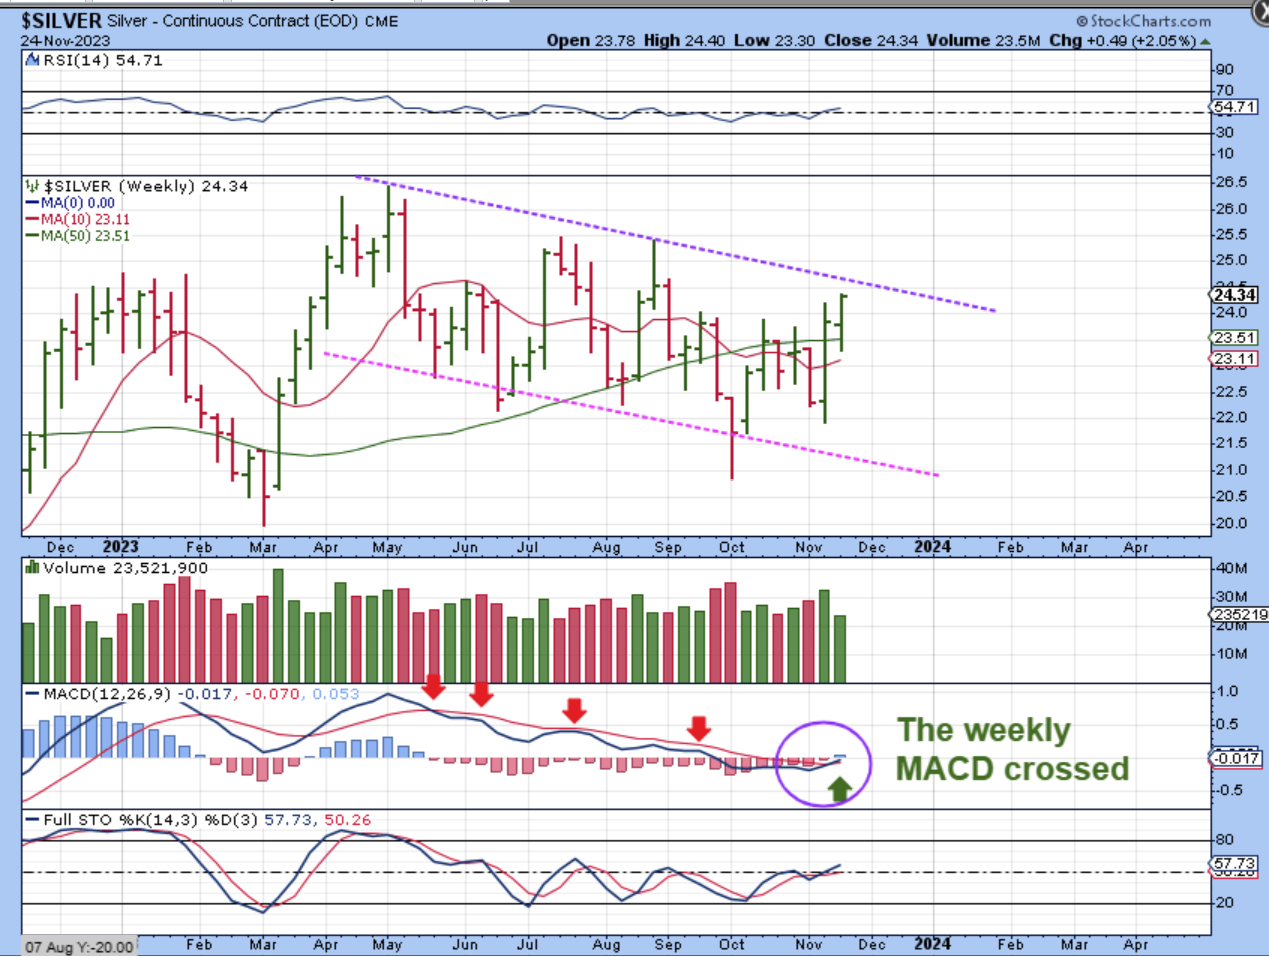
SILVER has a bullish weekly MACD cross now and will try to break out from this downward sloping channel. And the good news is that…
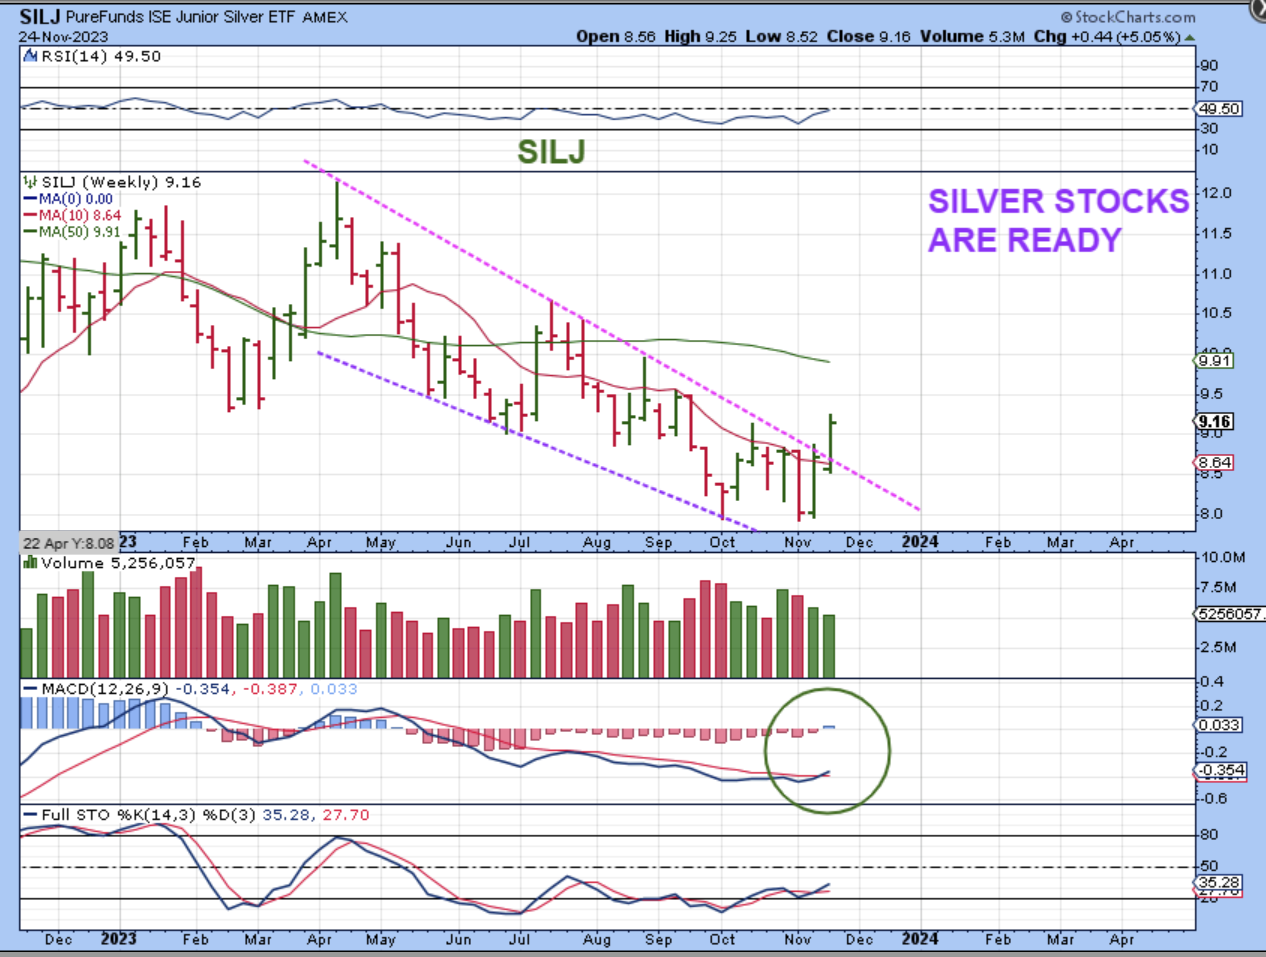
The good news is that Silver stocks, as seen here using The SILJ ETF, are no longer ignoring Silvers push higher. Silver Miners are now being bought up too, and have joined in the upward climb. SILJ broke the downtrend last week. I mentioned over a week ago that I felt Silver stocks were basing out and finally showing bullish divergence, so I said that they could be bought and added to a basket of Miners that you are holding. Most have already released their earnings reports too, so that is helpful. I will discuss a few silver miners later in the report, but this is a bullish breakout and remains very oversold.
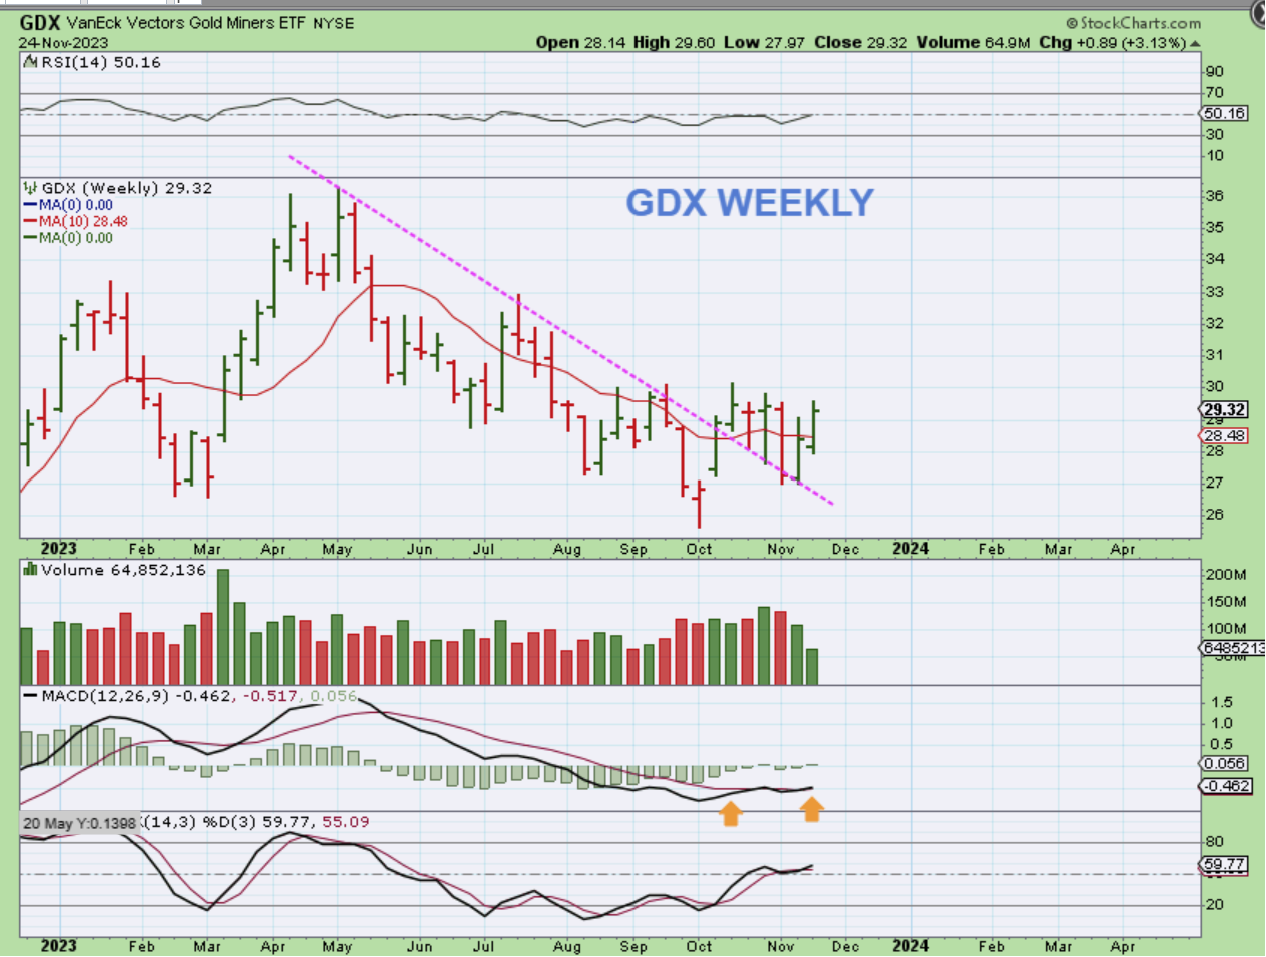
Some Miners that I have pointed out in the reports are running strong as the leaders, yet others are basing out or just starting to move higher, so with the GDX ETF we have a weekly chart of what looks to be bottoming price action. BARRACK & NEM are not leaders, but they are improving and have moved off of the lows. As for GDX, Price is still roughly 15% off of the October lows, so it is still a good buying opportunity. I will discuss several individual Miners next.
In my weekday reports I have been discussing HMY, KGC, GFI, OR, EGO, NGD (after earnings) as one that I liked as leaders and buy the dip candidates. Most are still doing very well, so let’s look at Miners.
.
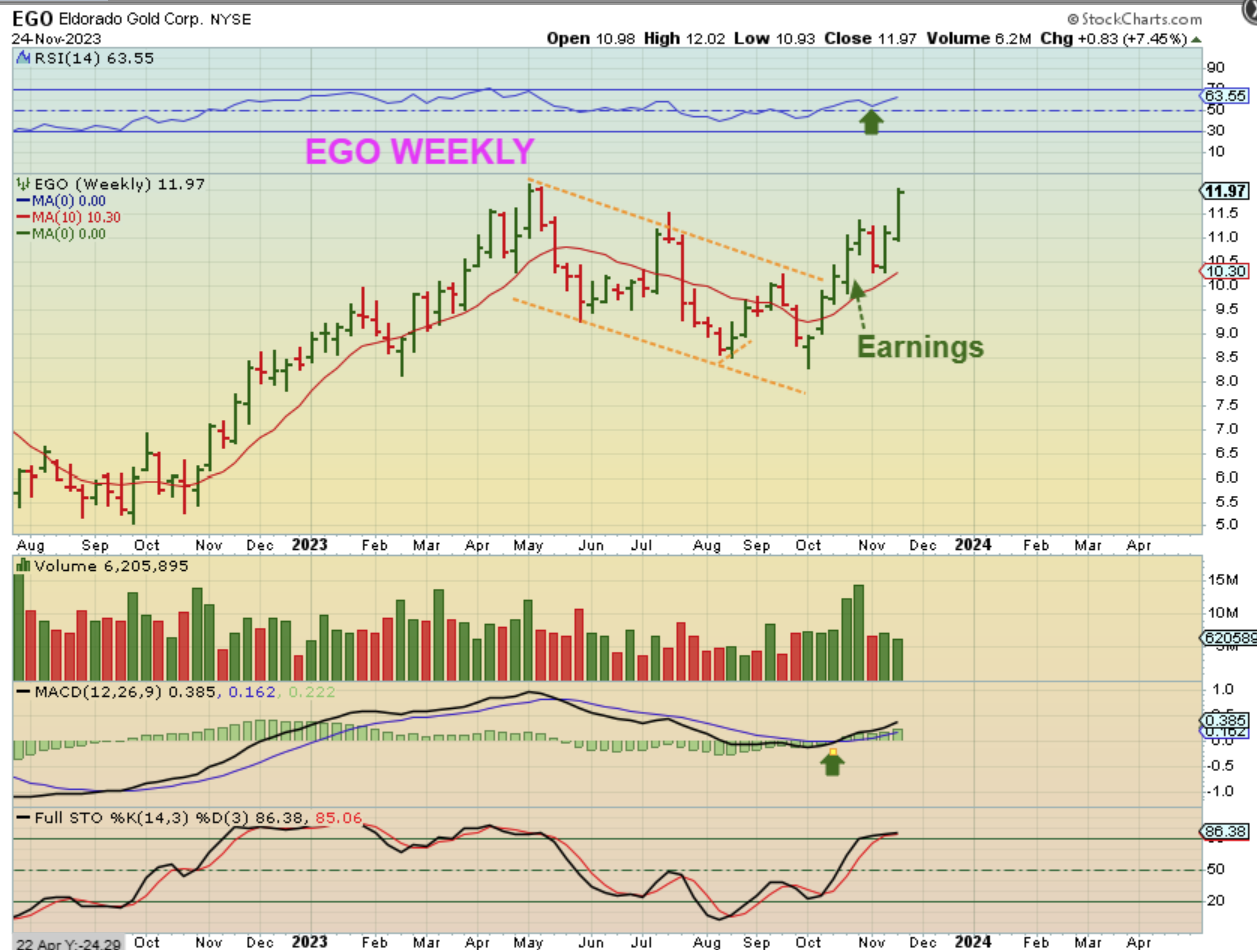
EGO has continued higher after the dcl dip, and is now already back at the highs near $12. If you have EGO in your basket of miners, it is outperforming GDX by a lot.
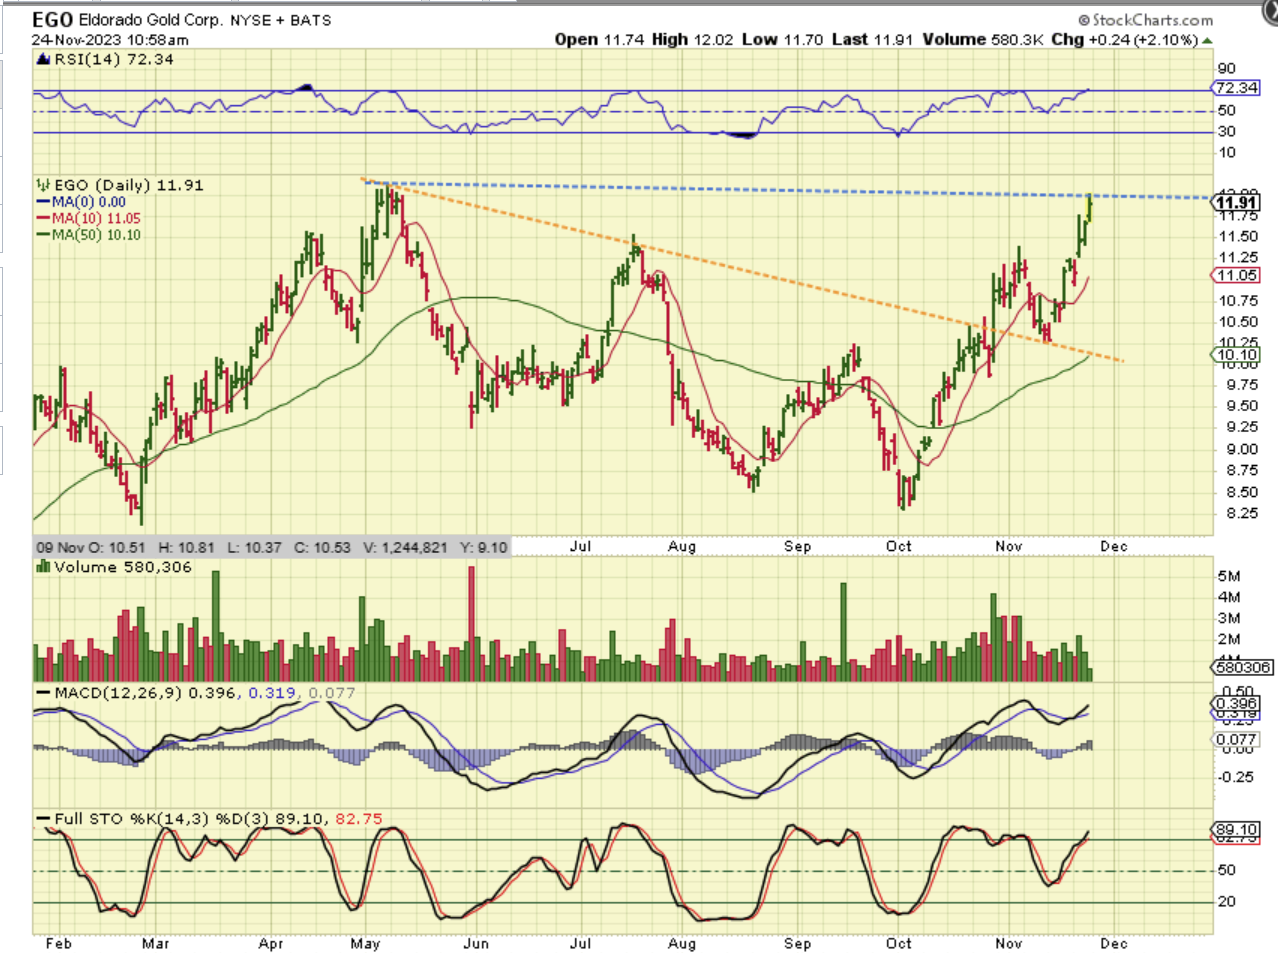
The EGO WEEKLY chart is very nice, with a move out of the Oct 2023 ICL, a large consolidation, and now a continuation. You can see that volume has increased with this ICL and that may start happening to many of the Miners (I hope) 🙂 as they gain favor.
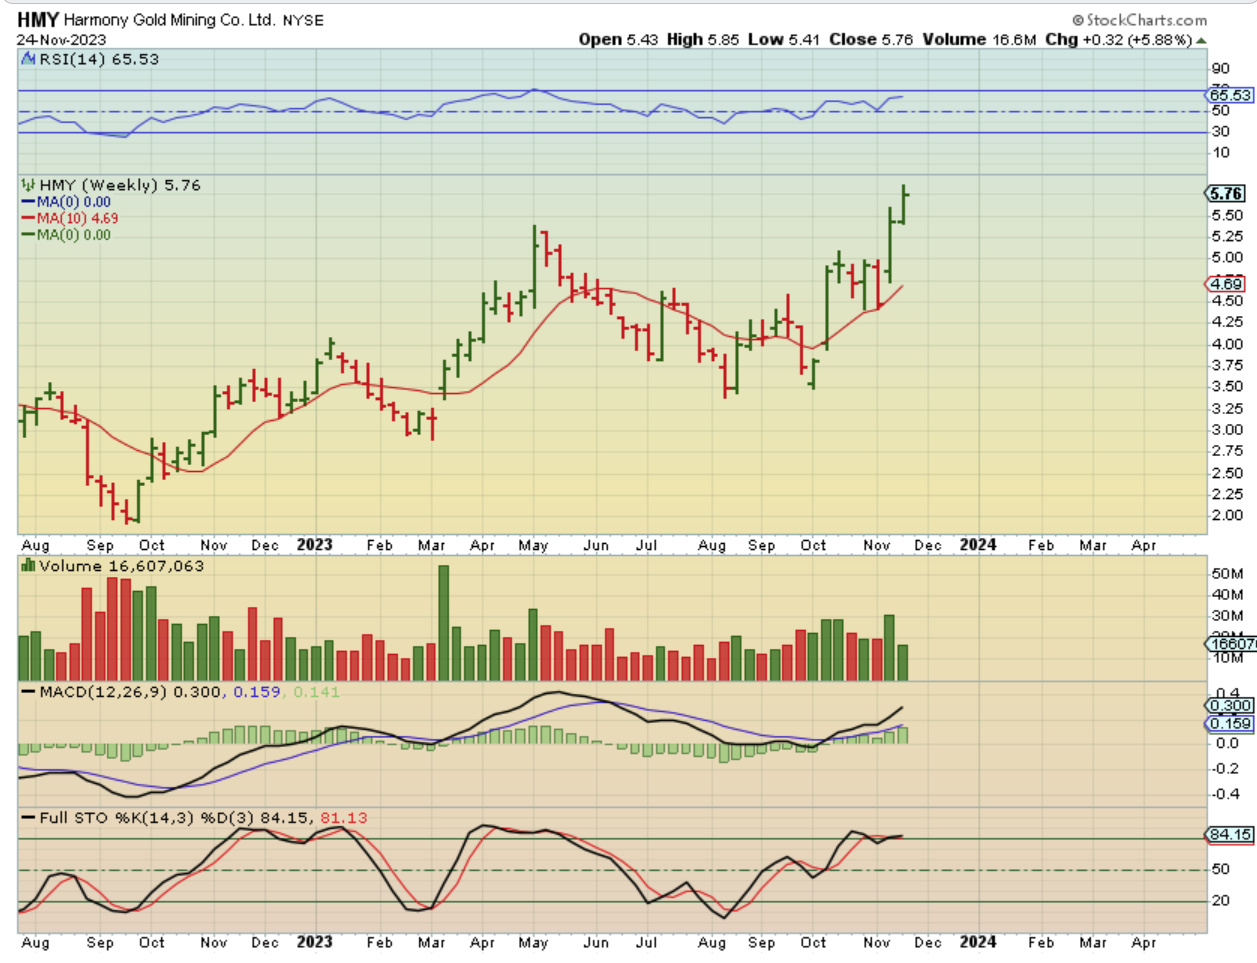
HMY WEEKLY: These are not always easy rides, since they do get choppy, but again, a basket with HMY in it is paying off too. Some of the laggards like SA, BTG, NG, SAND, RGLD, etc could begin to play catch up too, so it is good to review what the leaders are doing and how they were also a bit choppy, but the reward is in buying the dip and riding it. HMY has roughly moved from $3.50 to almost $6 since the Oct ICL (last 2 months).
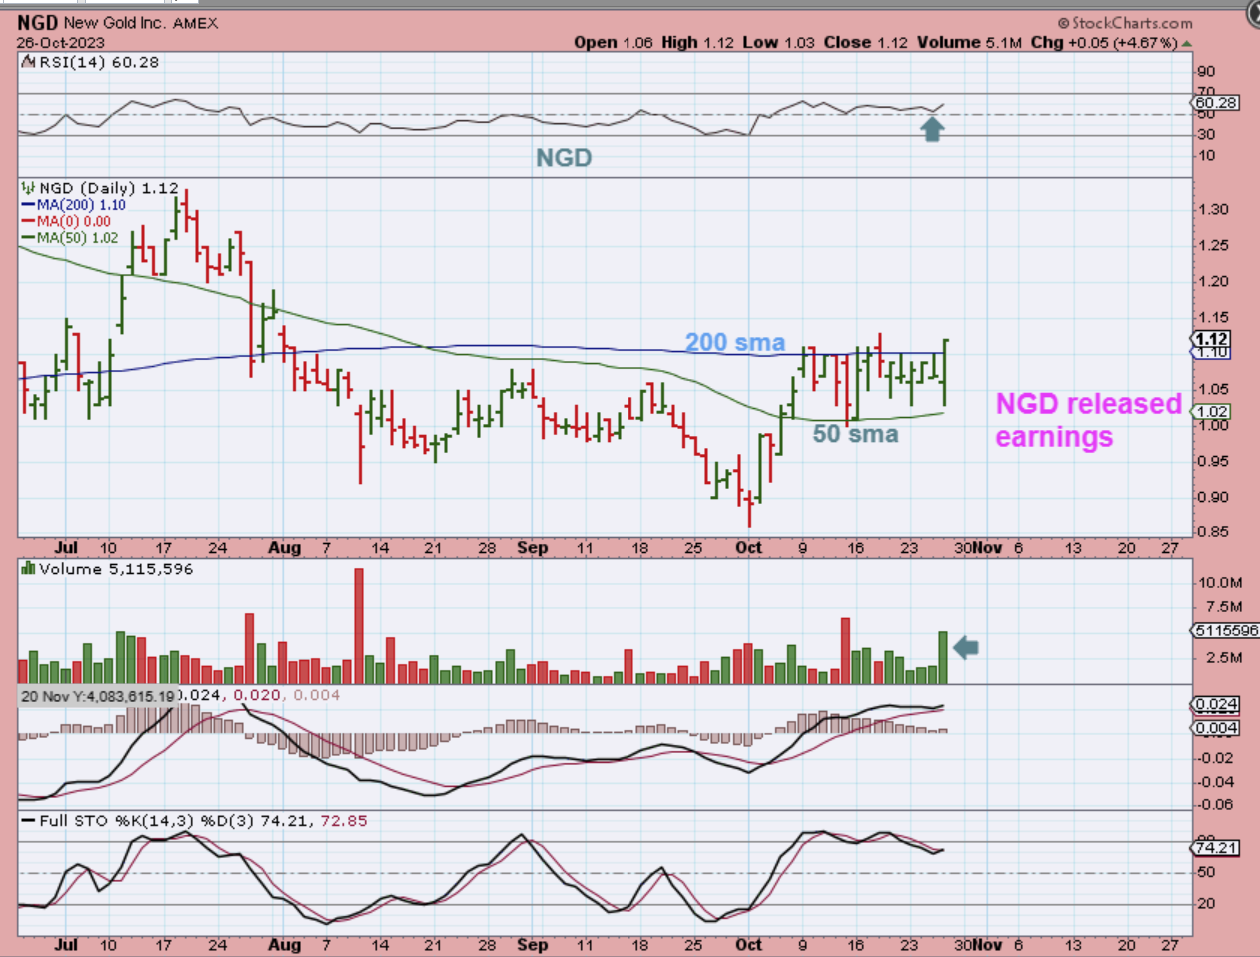
NGD started to do well recently at the ICL, so I put this chart in the report as a lagger ready to possibly run.
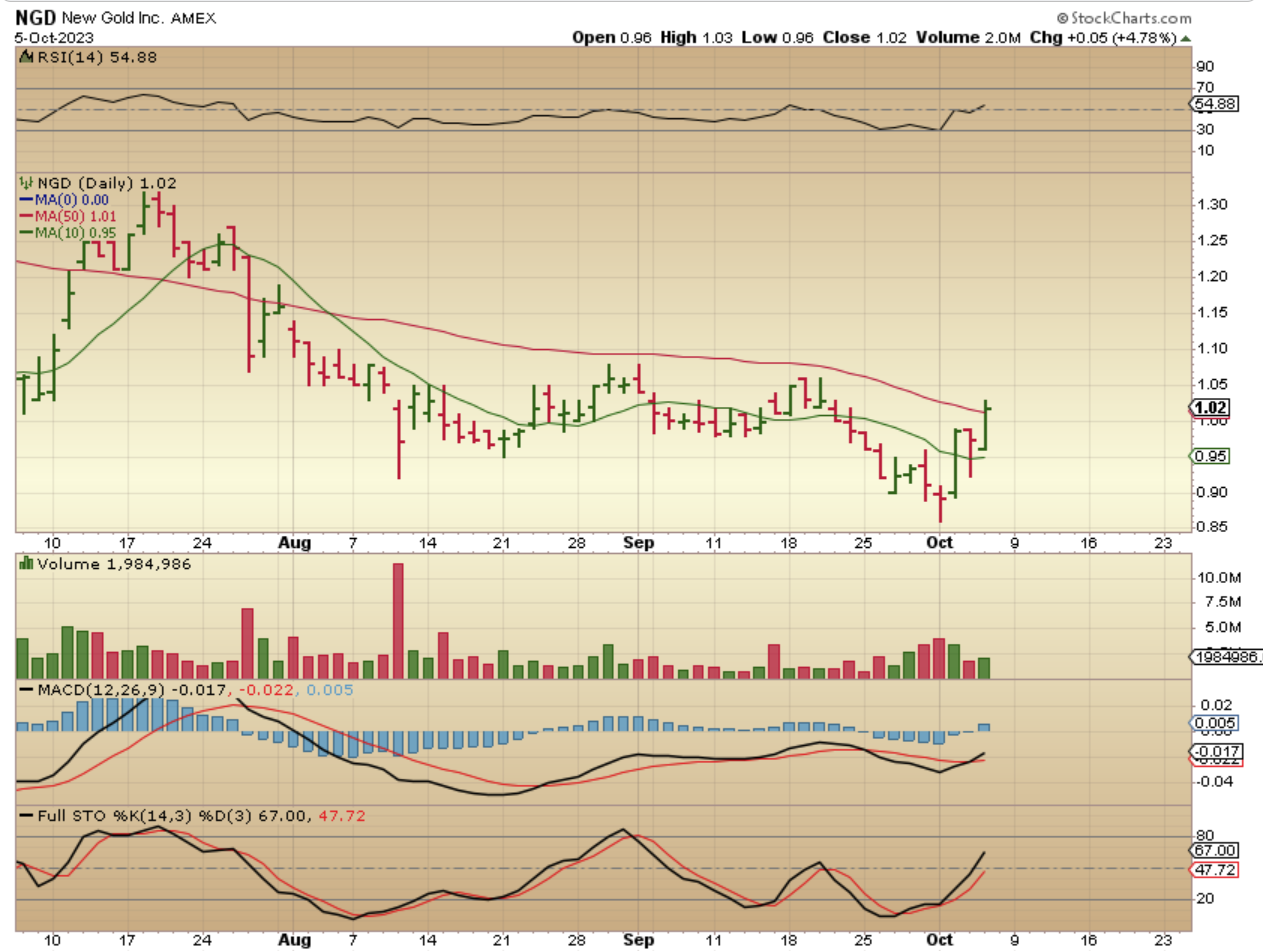
It churned along the 200sma as a buy, when they released their earnings report, so we were buying NGD around $1 to $1.10 is.
I then showed that NGD follow through as positive post earnings buying and this would now become a ‘BUY THE DIP” if we get one.
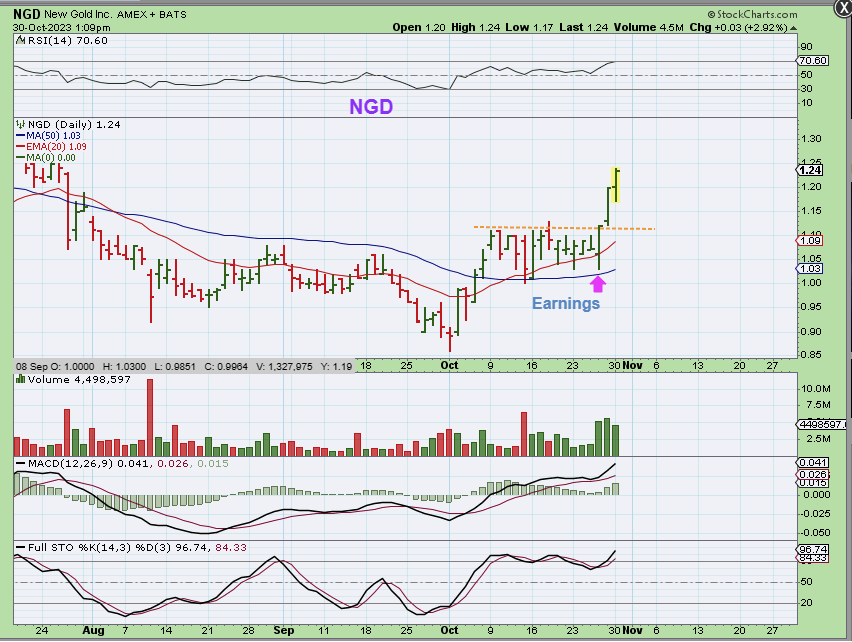
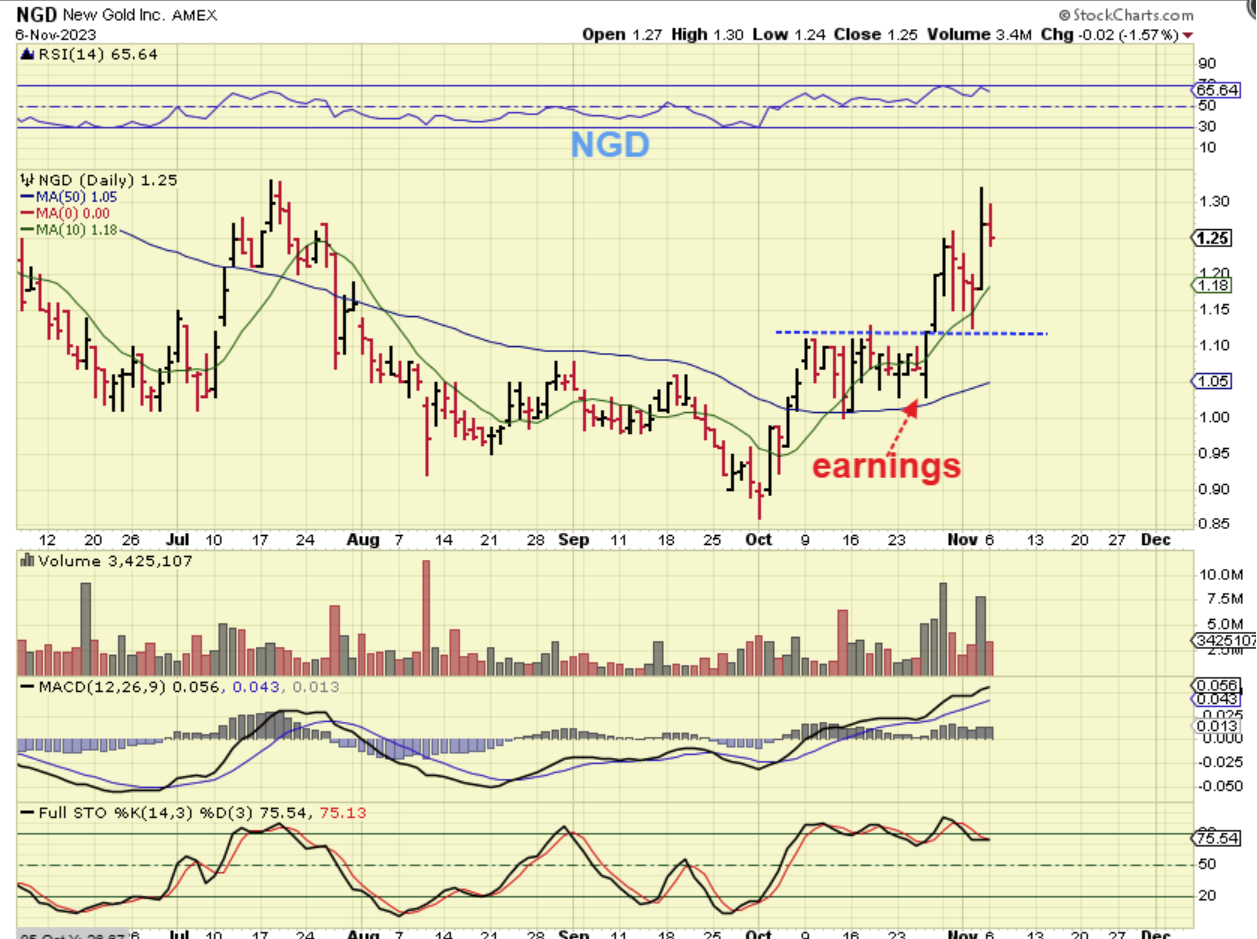
This was that buyable dip – the dcl after the ICL.
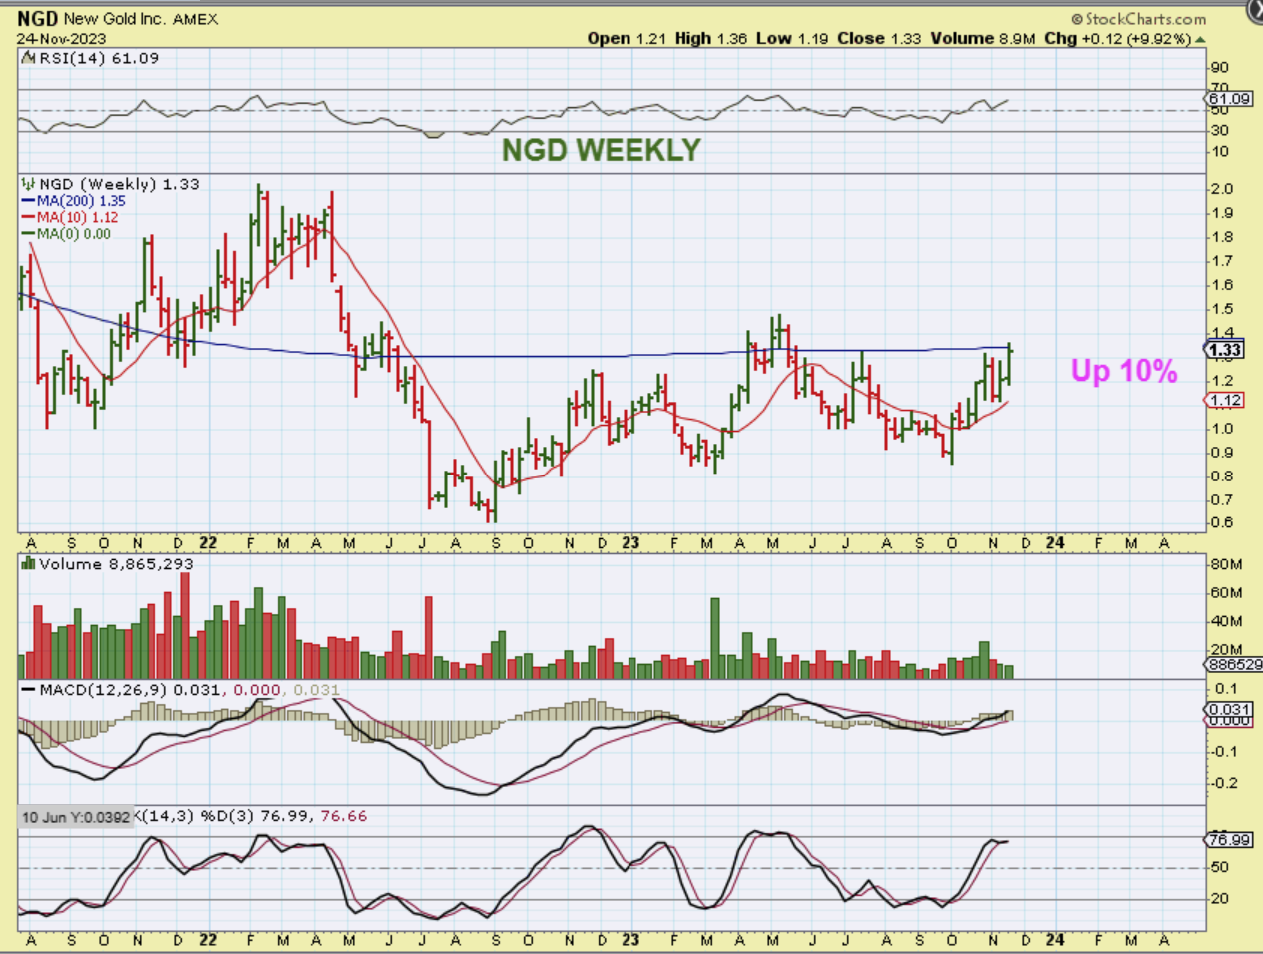
And this is THE WEEKLY NGD chart right now. Even though it rallied off of the lows, I feel that NGD is still just getting going as it tries to break this weekly resistance too. I would still consider it a buy in this $1.33 area or if it pulls back. Running back to the 2023 highs is a $1 to $2 100% move.
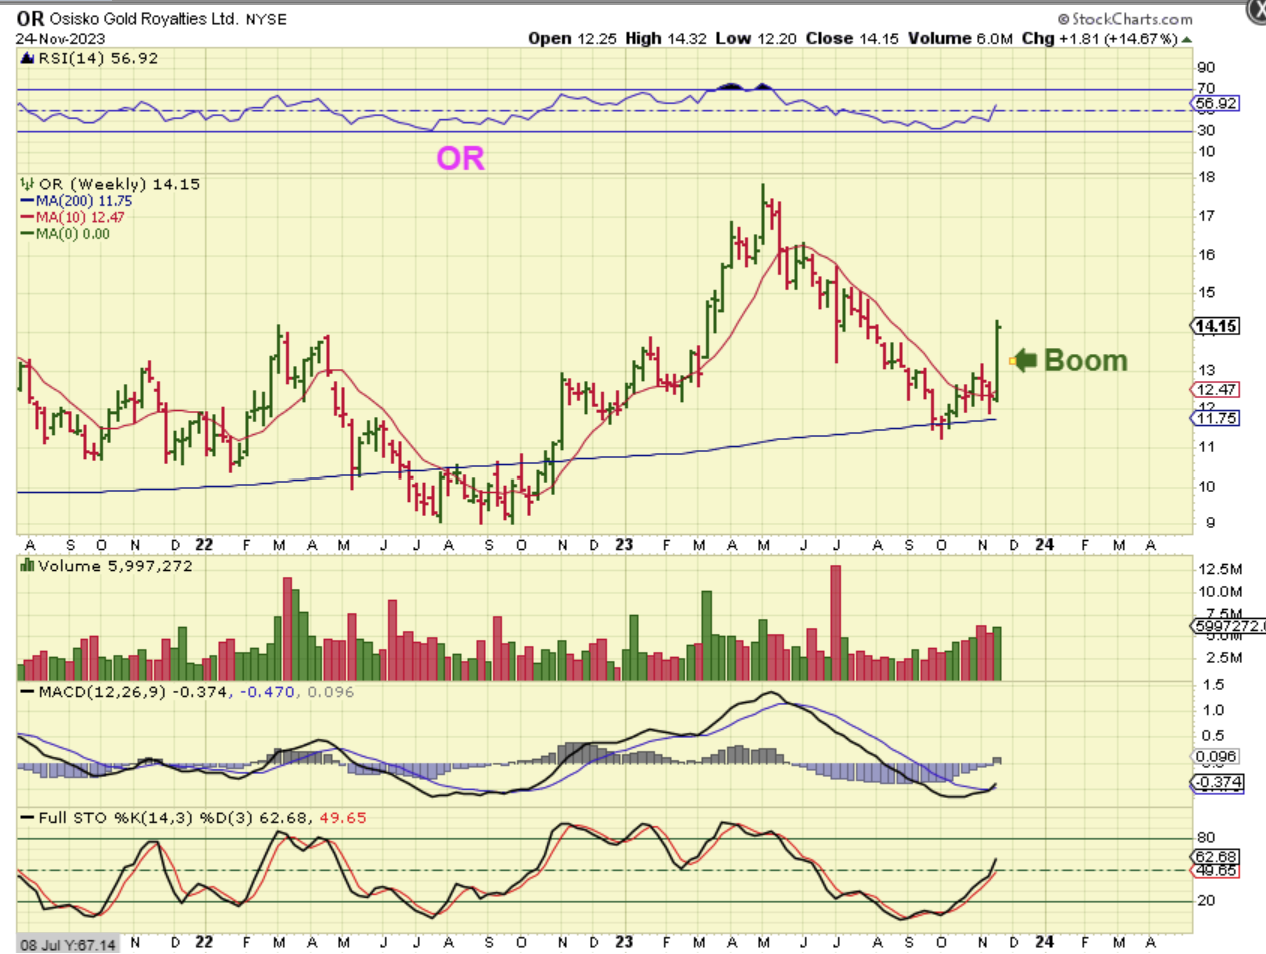
OR WEEKLY – Or was one of the stronger leaders as it rallied very nicely from $9 to $18 out of the Oct 2022 ICL, but the pull back was deep. I now see this as a back test of the 200week ma and it may start to run again. Earnings were released on Nov 8, so this was a post earnings 14% pop last week.
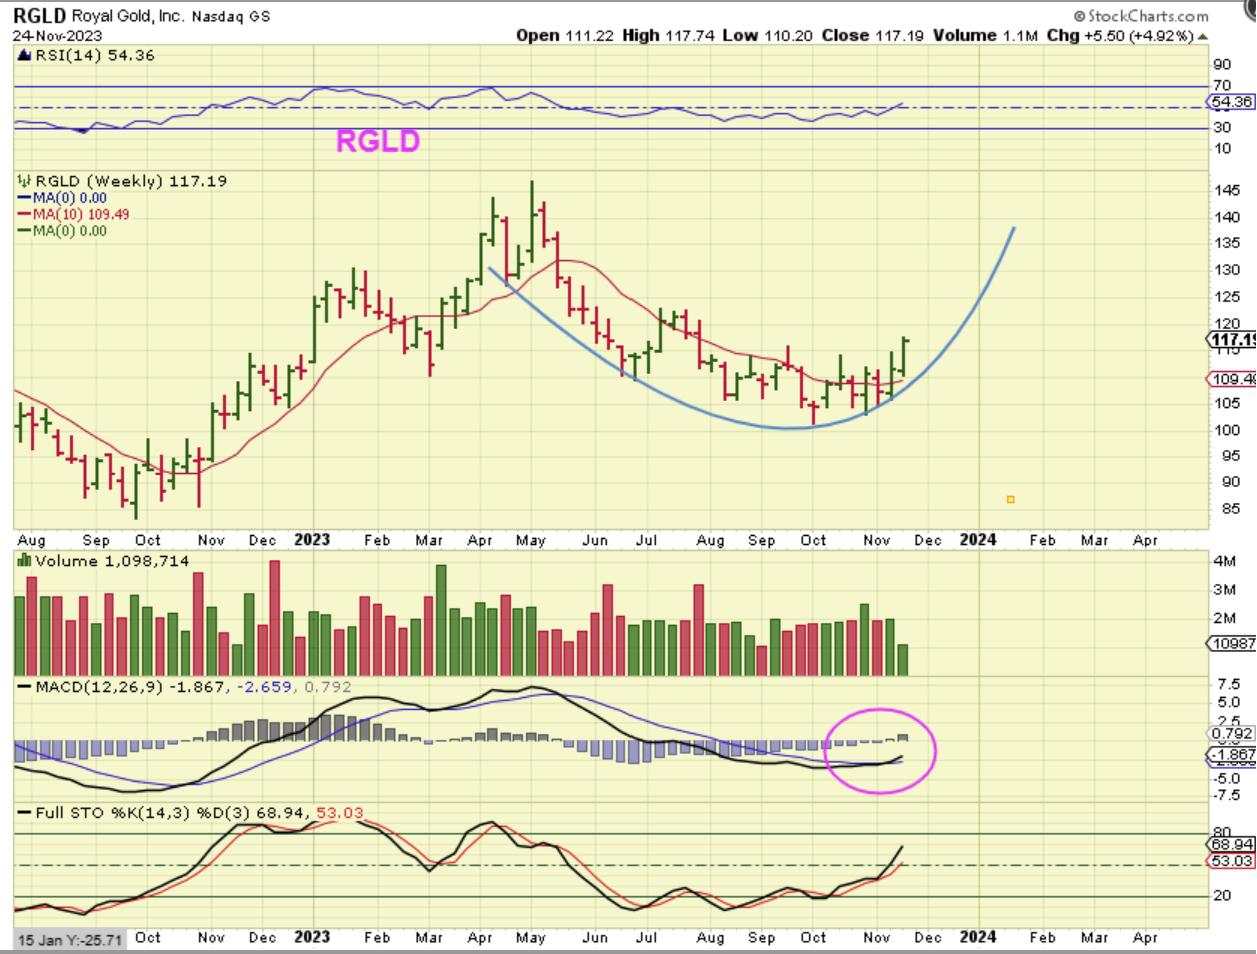
I have discussed RGLD as a bit of a lagger showing some signs of life in my reports. It looks ready to run back to $145 and beyond.
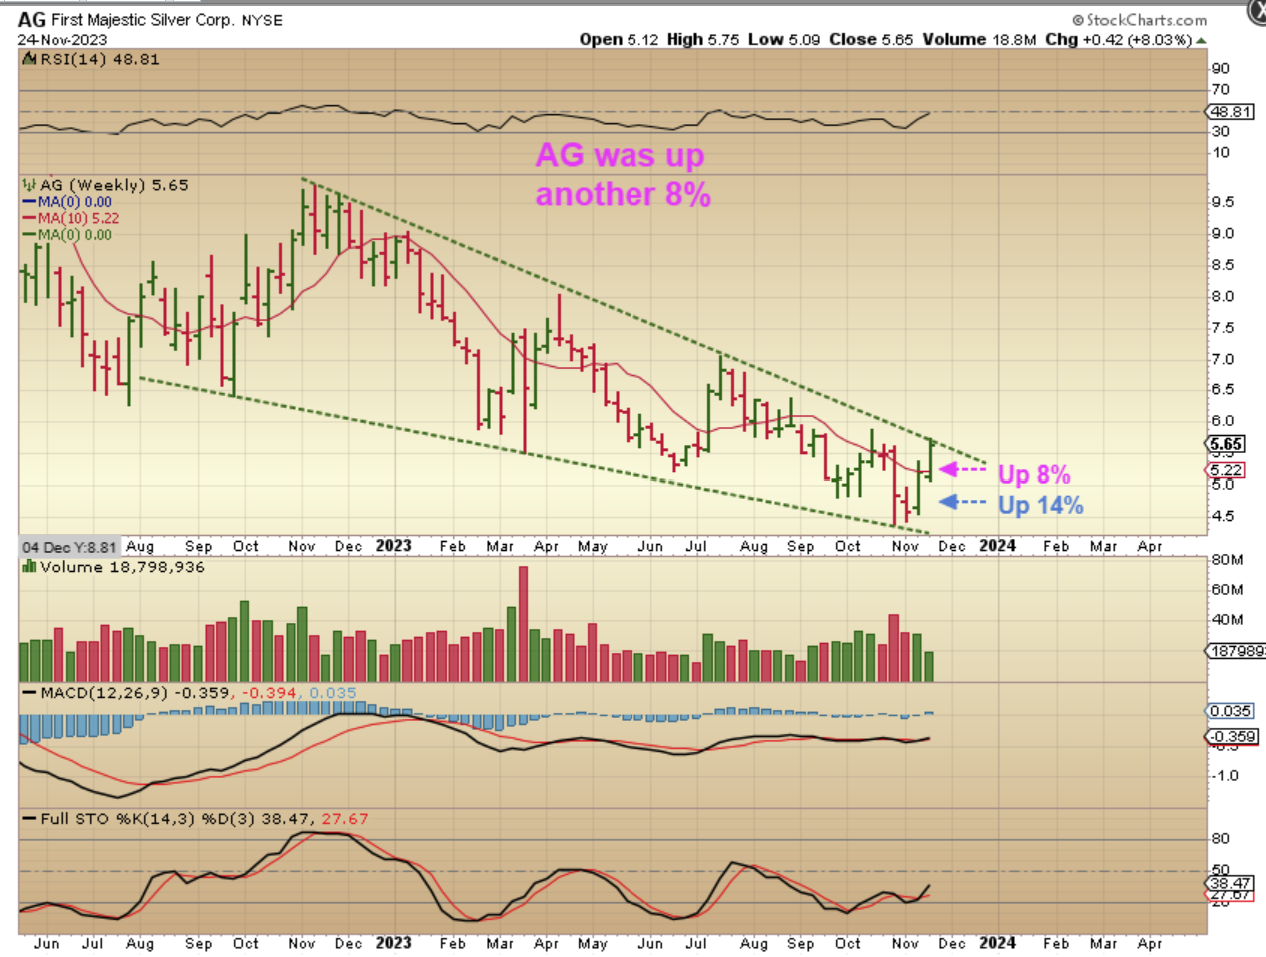
AG is a Silver miners that I have been pointing out as coming off of the lows after reporting earnings. I have used 8 charts in my reports in the last couple of weeks and here are 2 of them. This was AG on Nov 15 in a long bullish wedge, and…
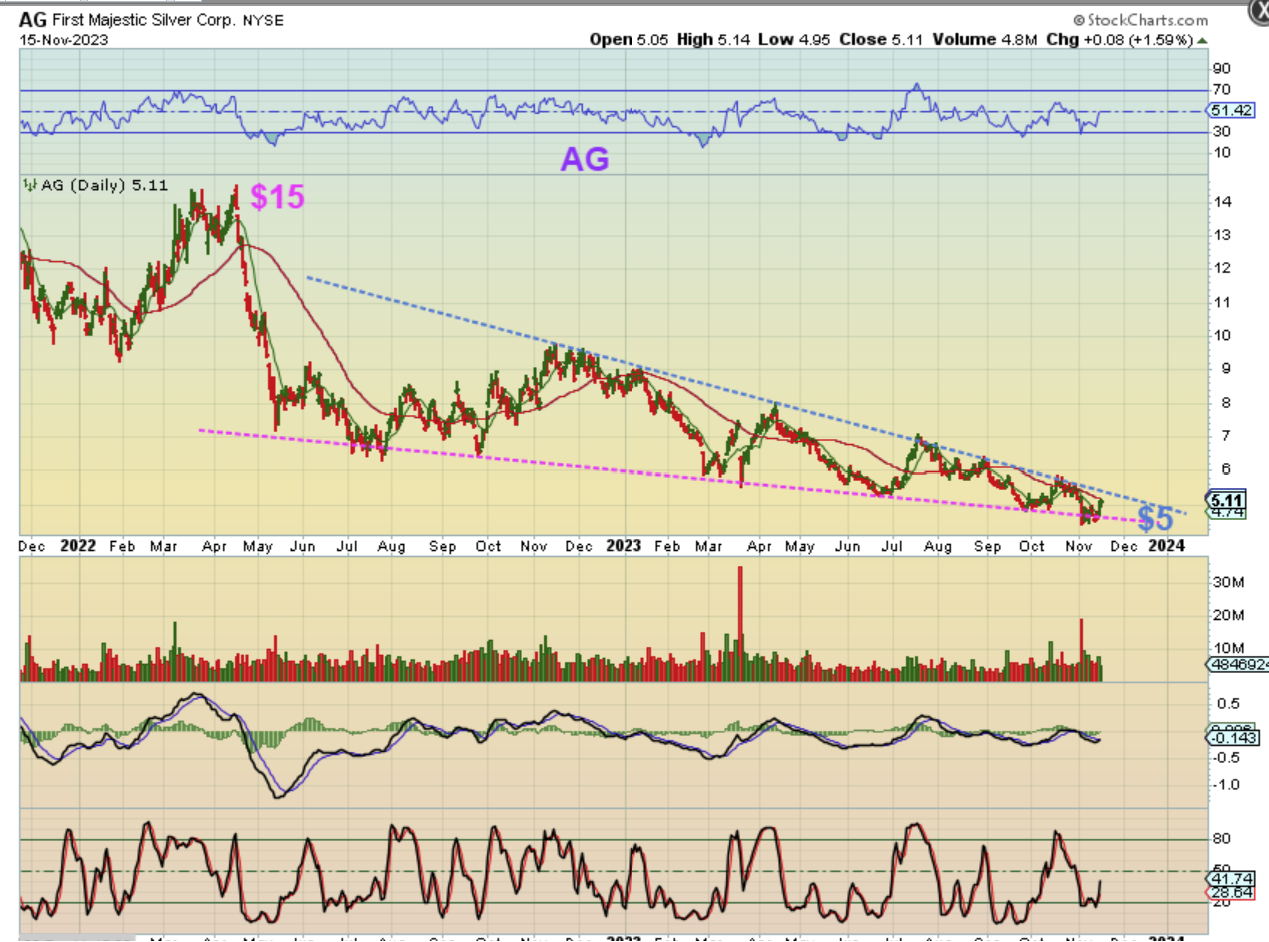
This was where I pointed out the capitulation with earnings and start of a recovery, so this was a buy in the $4.75-$5 area….
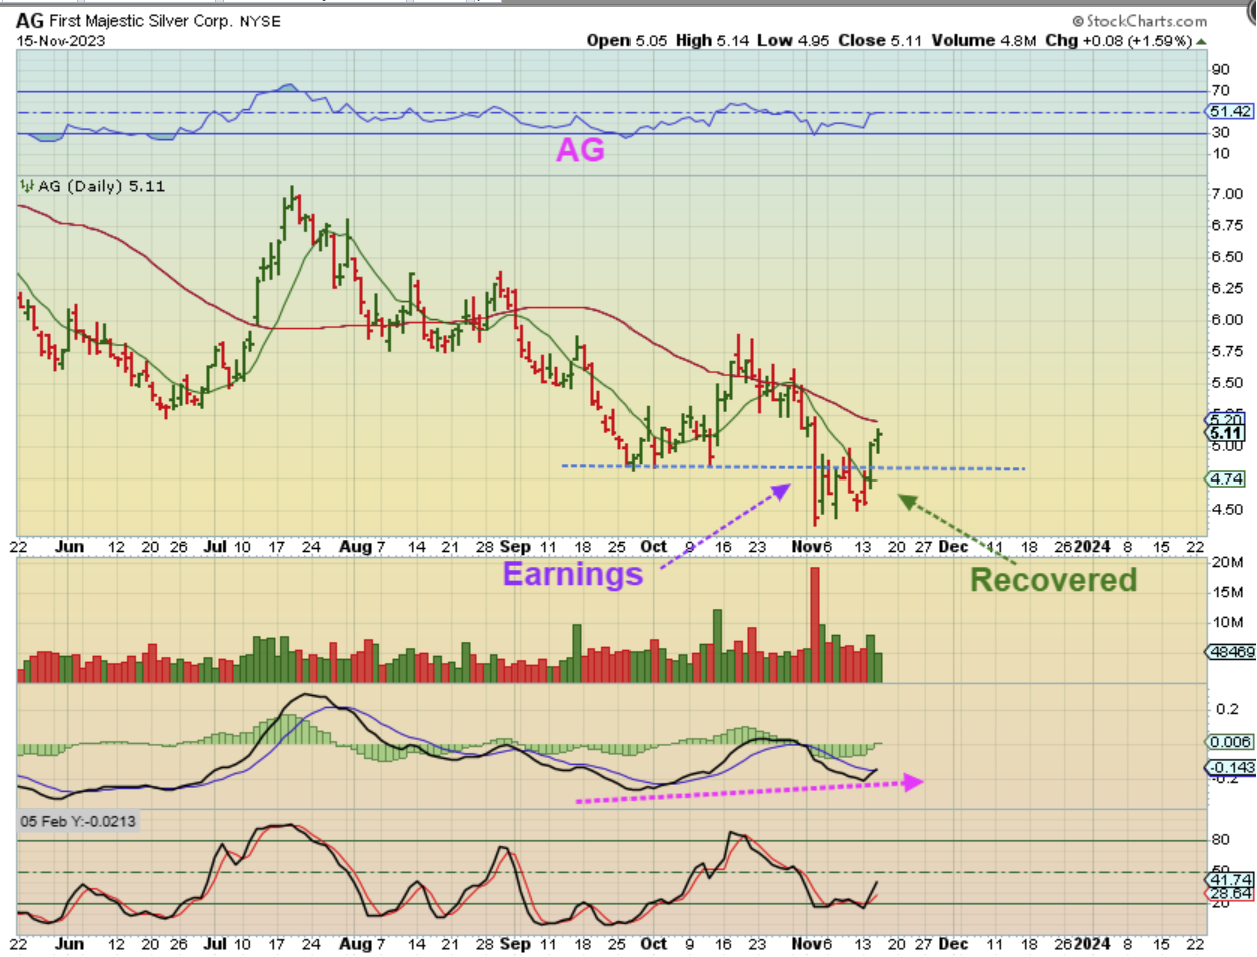
Fast forward to today and AG Is at $5.65. It is working its way off of the lows and has already moved up 14% and then 8% on the weekly chart, so even though it is up over 20% off of the recent lows, I still think that this is just getting going. If Silver blasts off, Ag could be over $10 or in the teens in the future.
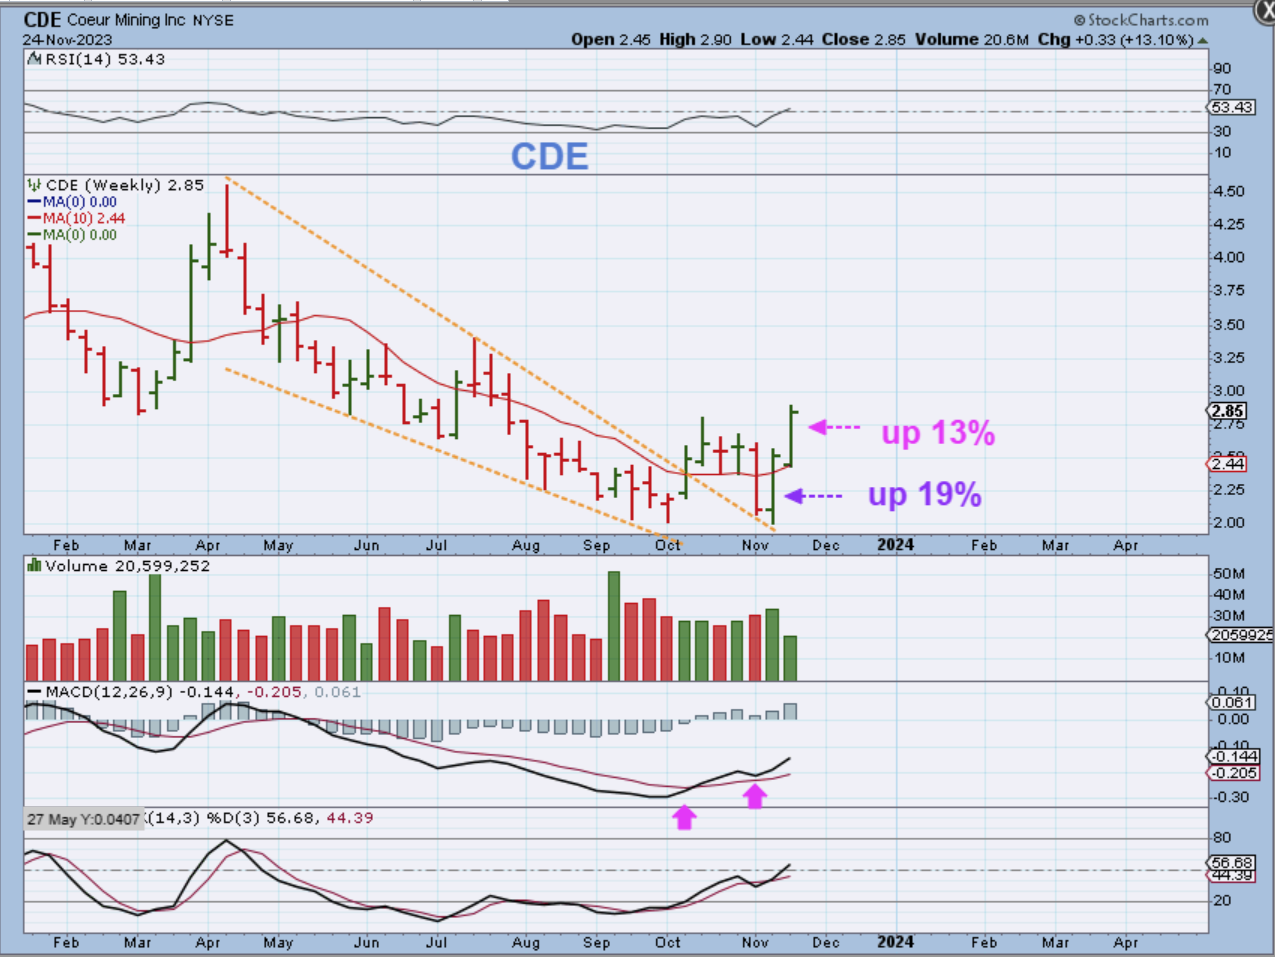
CDE has also been pushing up and out of the recent lows. After a breakout of the downtrend and back test, it is up over 30% off of the lows in 2 weeks, so the Silver stocks are starting to find buyers. HL & FSM Look very good too.
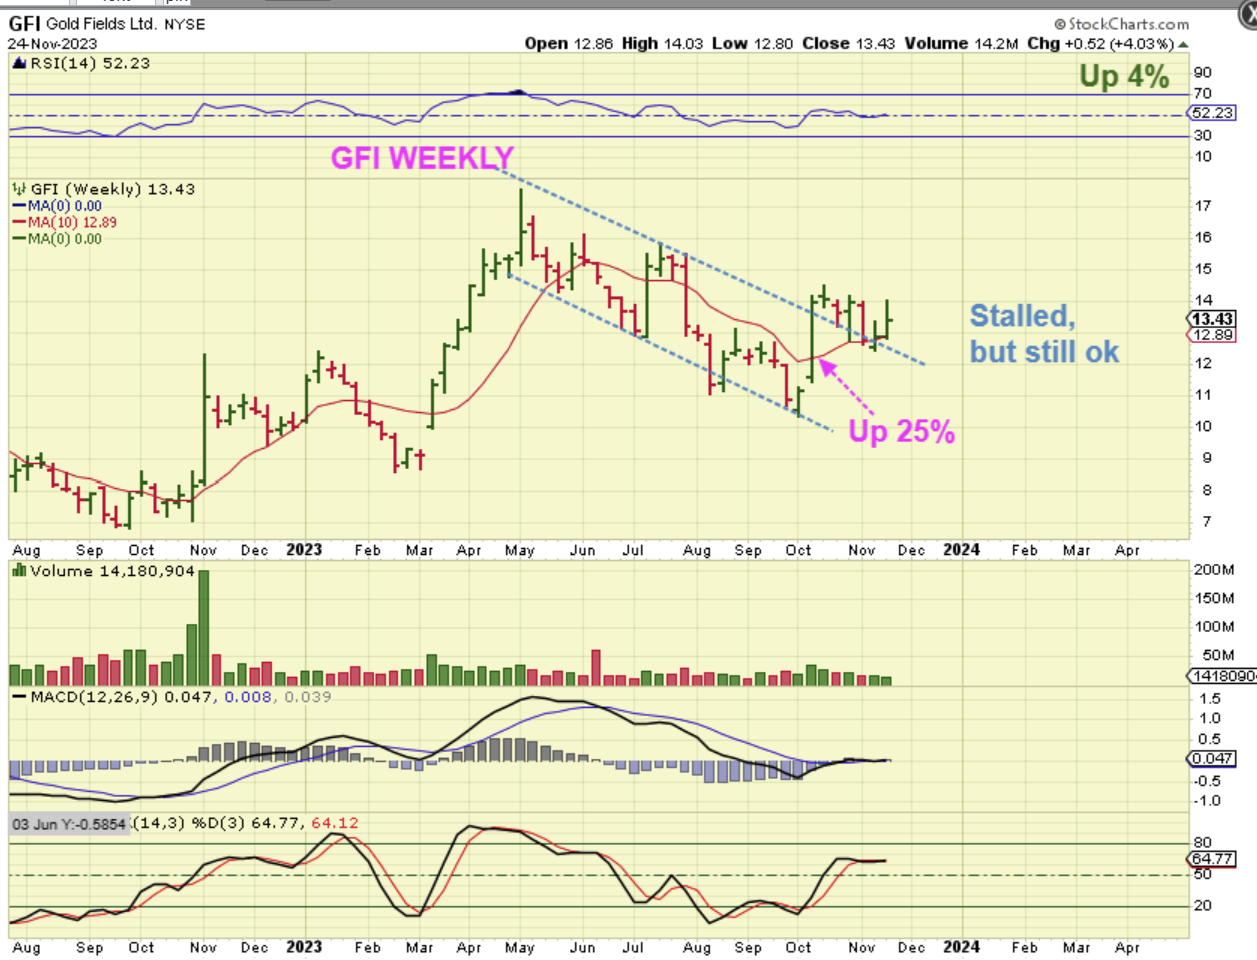
GFI was a leader in 2022-2023, but it pulled back a lot after that $7 to $17 run. It Popped 25% at the recent ICL and is now in a sideways consolidation, so this may be getting ready to run again.
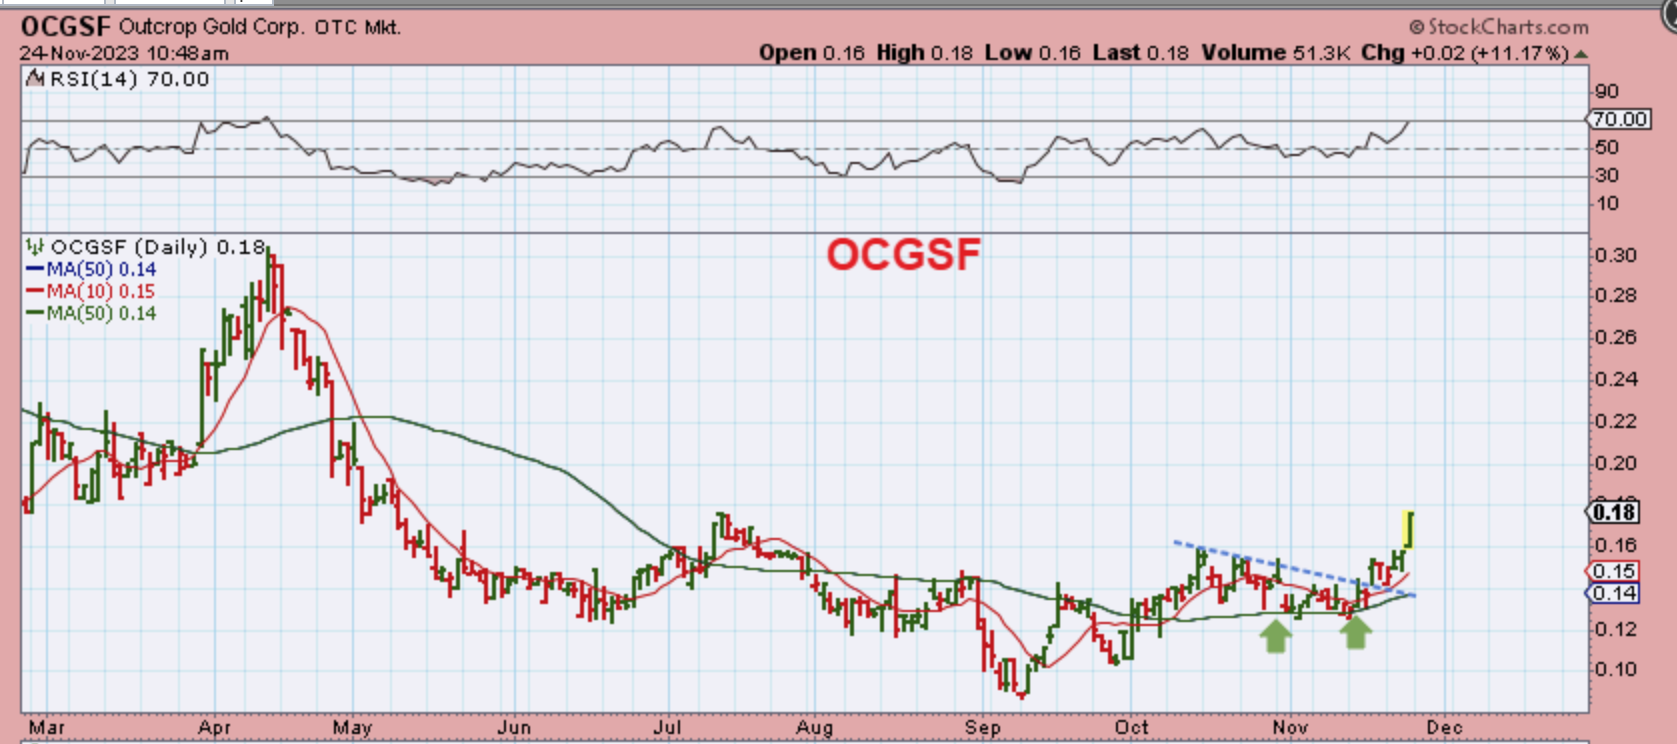
One of the junior explorers that was in my October reports and also in this Fridays report Popped 14% at one point on Friday, so I just wanted to point out OCGSF again. These can become a ‘Buy the dip’ opportunity after a run if we get them.
.
We have been enjoying bullish conditions in the General Markets and Precious metals sectors, and the weekly set ups in the weekend report remain quite bullish. Below I want to discuss Bitcoin and the Crypto Miners too.
Enjoy the rest of your weekend and Thanks for being a Chart-Freak with me!
.
~ALEX
.
I have explained in prior reports that 2024 is a ‘halving year’ for Bitcoin, and in past having years of 2020 and 2016, we had a very strong ramp up to new highs and beyond. Crypto stocks have made massive gains at those times too. That gives us cycles to work with and they do seem to run in 4 year intervals. Well, after that extremely strong ramp up, you get a bear market correction, so we saw that in the year 2022. I did not want to buy and hold in early or mid 2022, but from the time that it bottomed at the end of 2023, I then pointed out that Bitcoin had bottomed, and the lows should be in place. We traded MARA, RIOT, HUT, HIVE, CIFR, CLSK, BTBT, and so on for a while, and they did excellent again (Very choppy, but huge gains). I was expecting an ICL into the end of this year, and at this point, it looks like we may have a mild ICL in place. Where are we now? Let’s take a look.
.
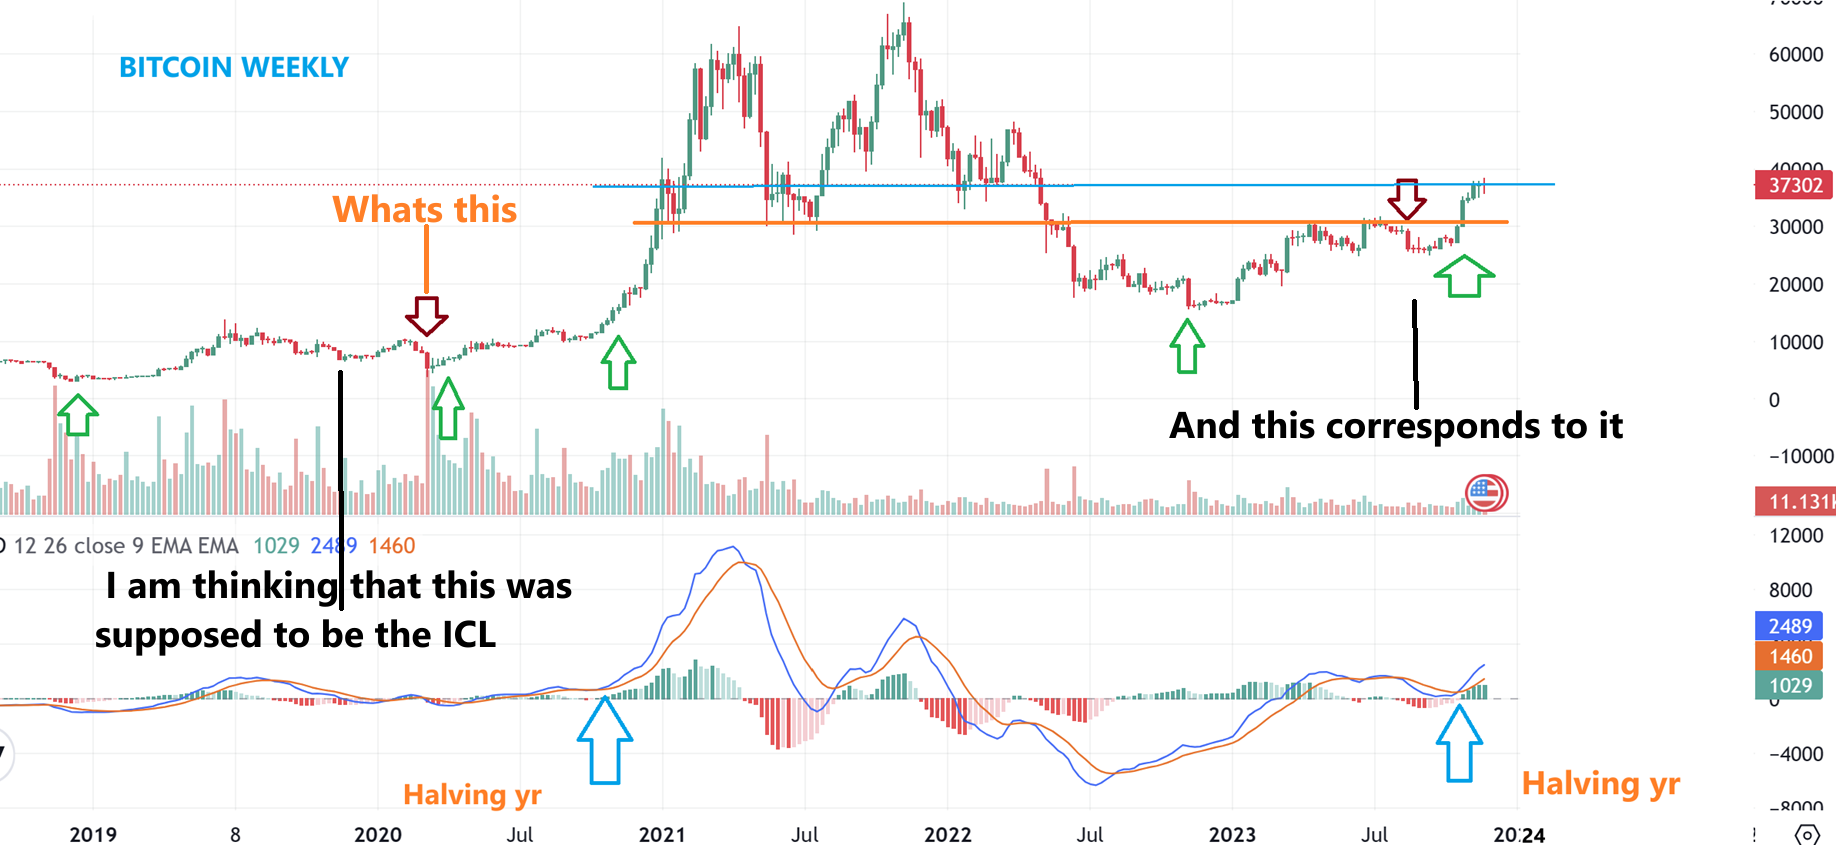
BITCOIN WEEKLY – I was looking at the 2019 run (the year before halving) and it looked like an ICL would come around the end of the year, which corresponds to Bitcoin now at the end of 2023. But then I saw a spike low in March, so that became my ICL, HOWEVER I recently realized something. Take a look at EVERY chart (SPX, WTIC, GOLD, SILVER, GDX, etc) and they all crashed, because that was the March 2020 Covid crash, when everything sold off deeply to new lows. So that is an anomaly and not something that we need to anticipate in 2024. I don’t expect it in the SPY, GDX, GLD, SLV, etc, so why would I expect it in Bitcoin? THAT MEANS that Bitcoins recent drop into the last low could be the ICL. We can look at the daily…
.
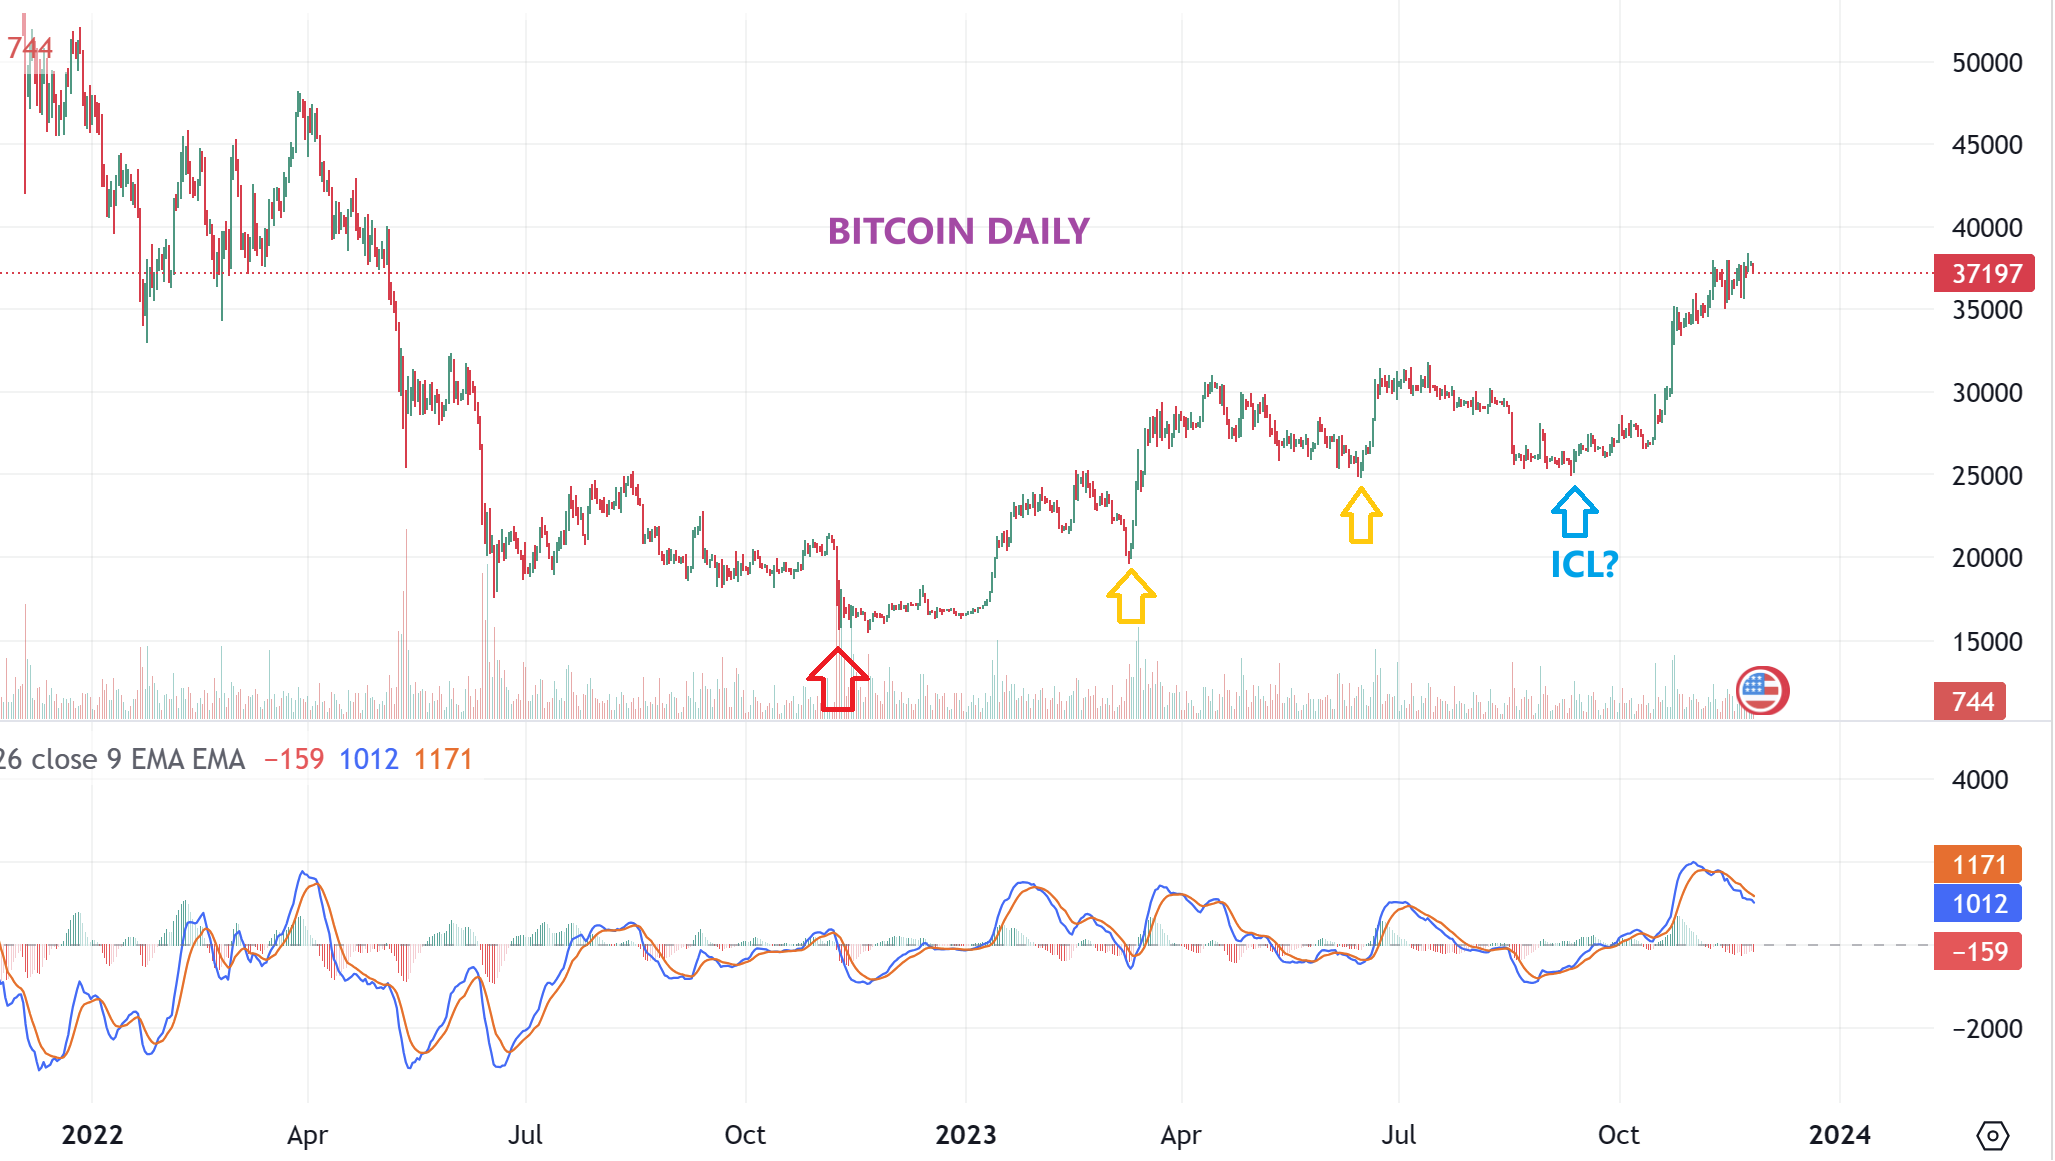
BITCOIN DAILY #1 – I wouldn’t have thought that that last blue arrow was an ICL, because it is actually still a higher low compared to the last yellow arrow. However, when I look at that ramp up out of that low? That is NOT likely to be a push higher out of a 5th daily cycle, right? A 5th daily cycle should exhibit weakness, so this looks like a push higher out of an ICL, so now let me show you what also may help us to get to that conclusion…
.
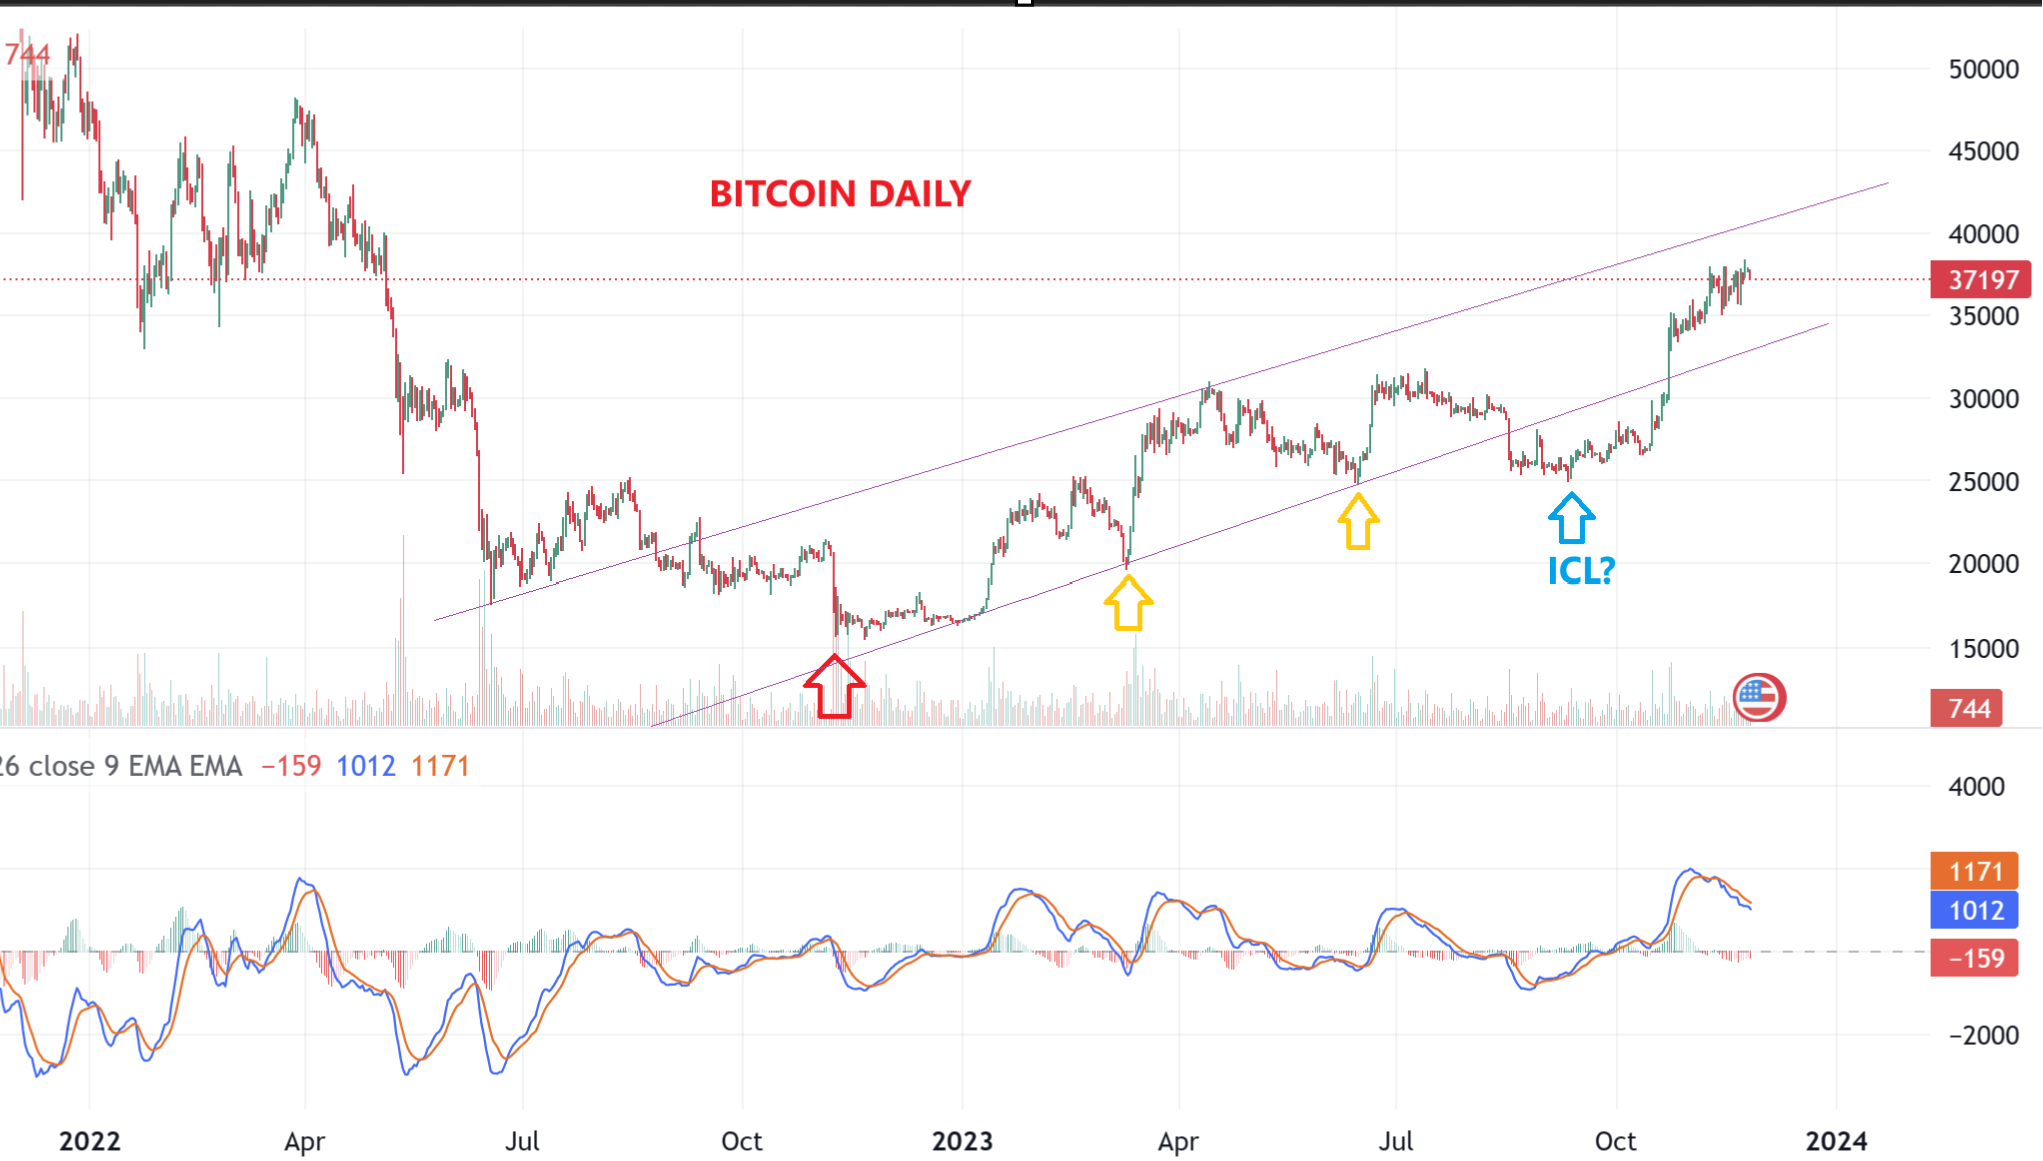
BITCOIN DAILY #2 – We had a series of higher lows that were making a trendline higher. The last drop did break the uptrend and the MACD went lower than the prior dips. After that trendline break and a swing low formed, Bitcoin ramped up sharply and many alt coins did too. This looks like an ICL. THE GOOD NEWS IS THAT AS WE HAVE BEEN MONITORING THE CRYTP MINERS IN THE DAILY REPORTS, THEY ARE BASING OUT AND JUST STARTING TO BREAK HIGHER AGAIN. I want to look at Bitcoin Monthly since we are at the end of November, and then I will discuss a few crypto Miners too.
.
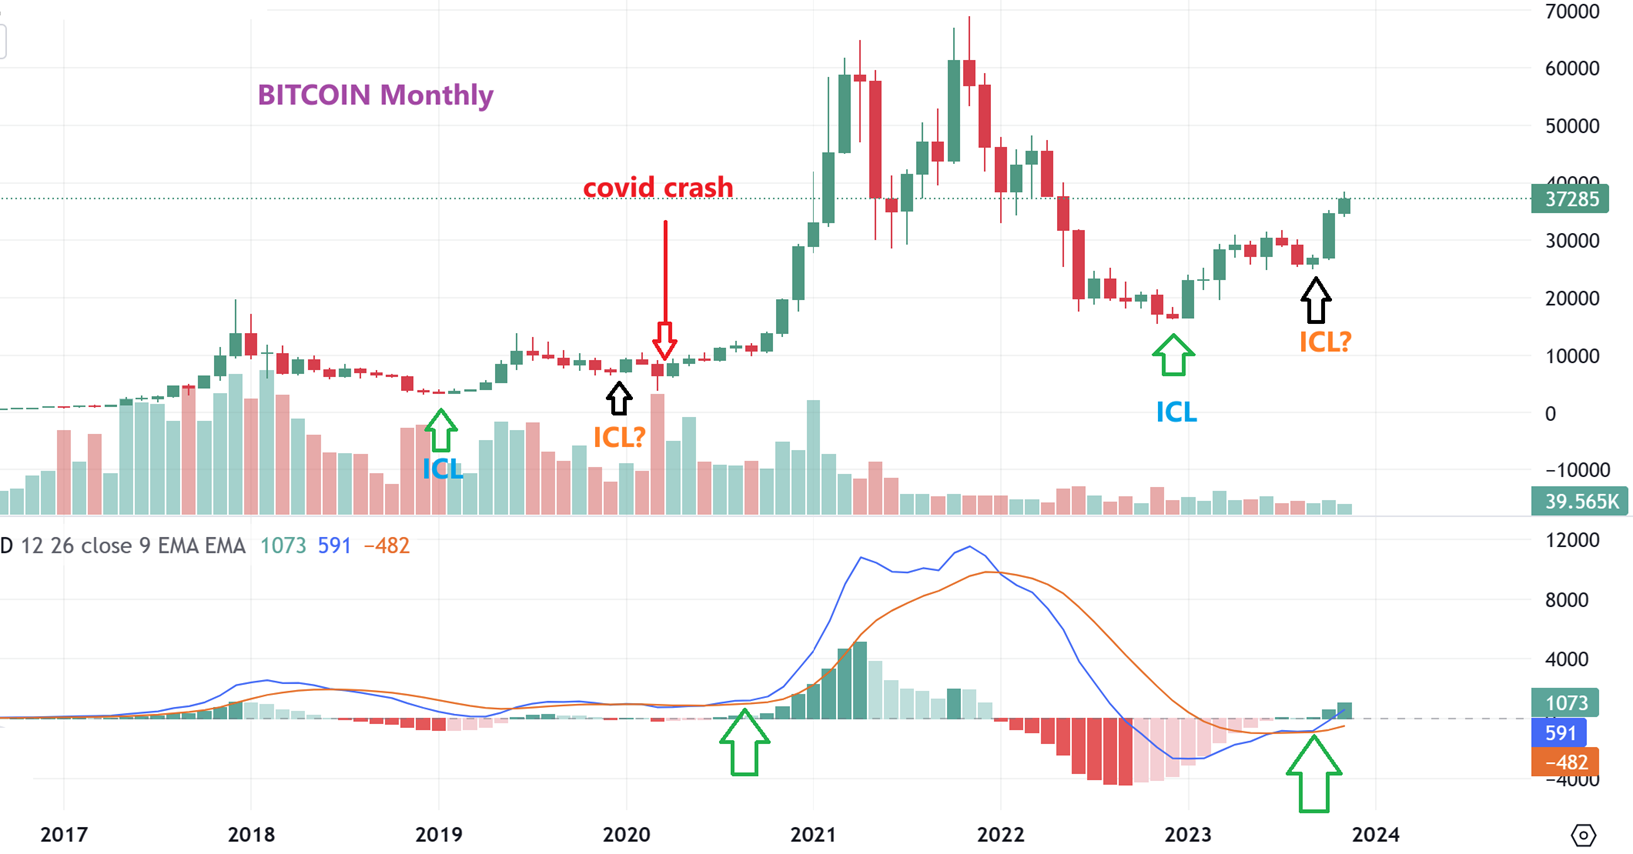
BITCOIN MONTHLY – This looks to be an obvious ICL now, right? And if this runs into 2024 with a having year? We could see great gains, so at this point I might want to buy and hold some Crypto Miners. Again, the good news is that they have been basing out and are not overly extended, even with a solid push in Cryptos. Let’s take a look and I will also cover these in our weekday reports.
.
.
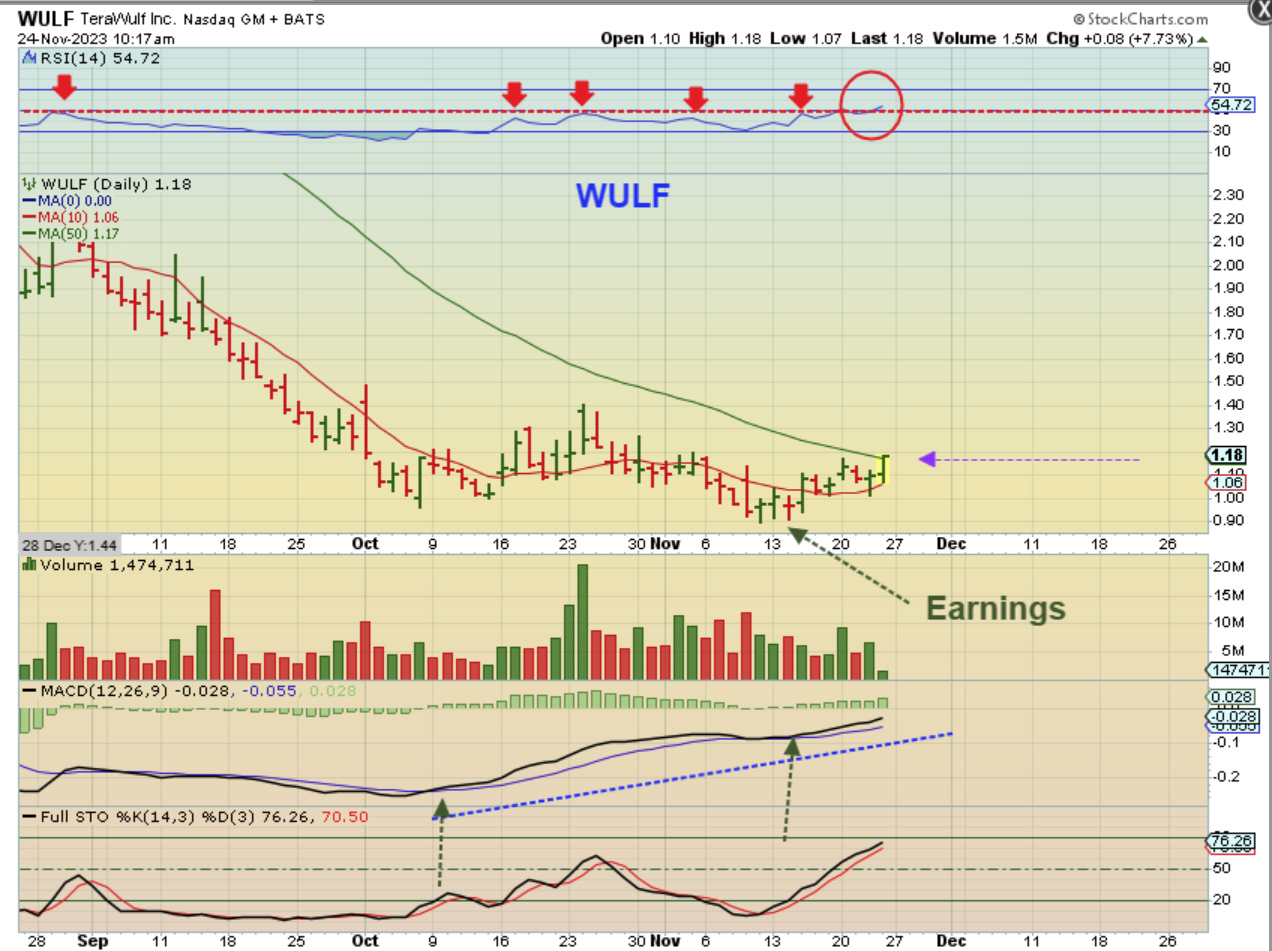
After dropping into that ICL, WULF was basing out with Bitcoin bottomed out and running higher. After WULF released their earnings it started to push higher, so I grabbed this chart and put it in the live commenting area on Friday near 10 am. It then ramped up 14%. Let me show you something else…
.
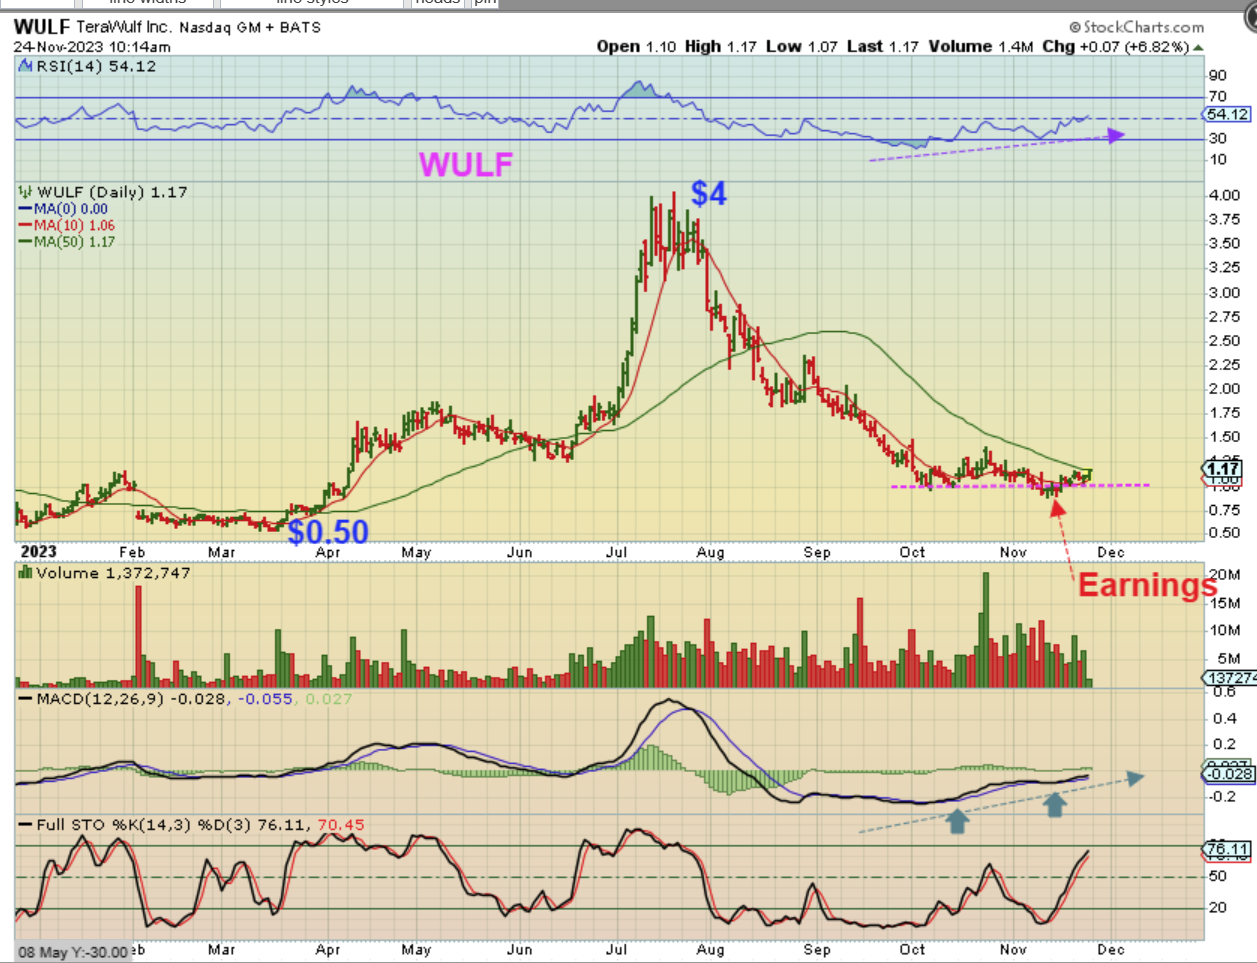
WULF ran from 50 cents to $4 this year and then sold off with that drop into an ICL. It was starting to break above that 50sma ( & did on Friday), so what if this runs from $1 to $4 or more again? I think that this can be a buy and hold.
.
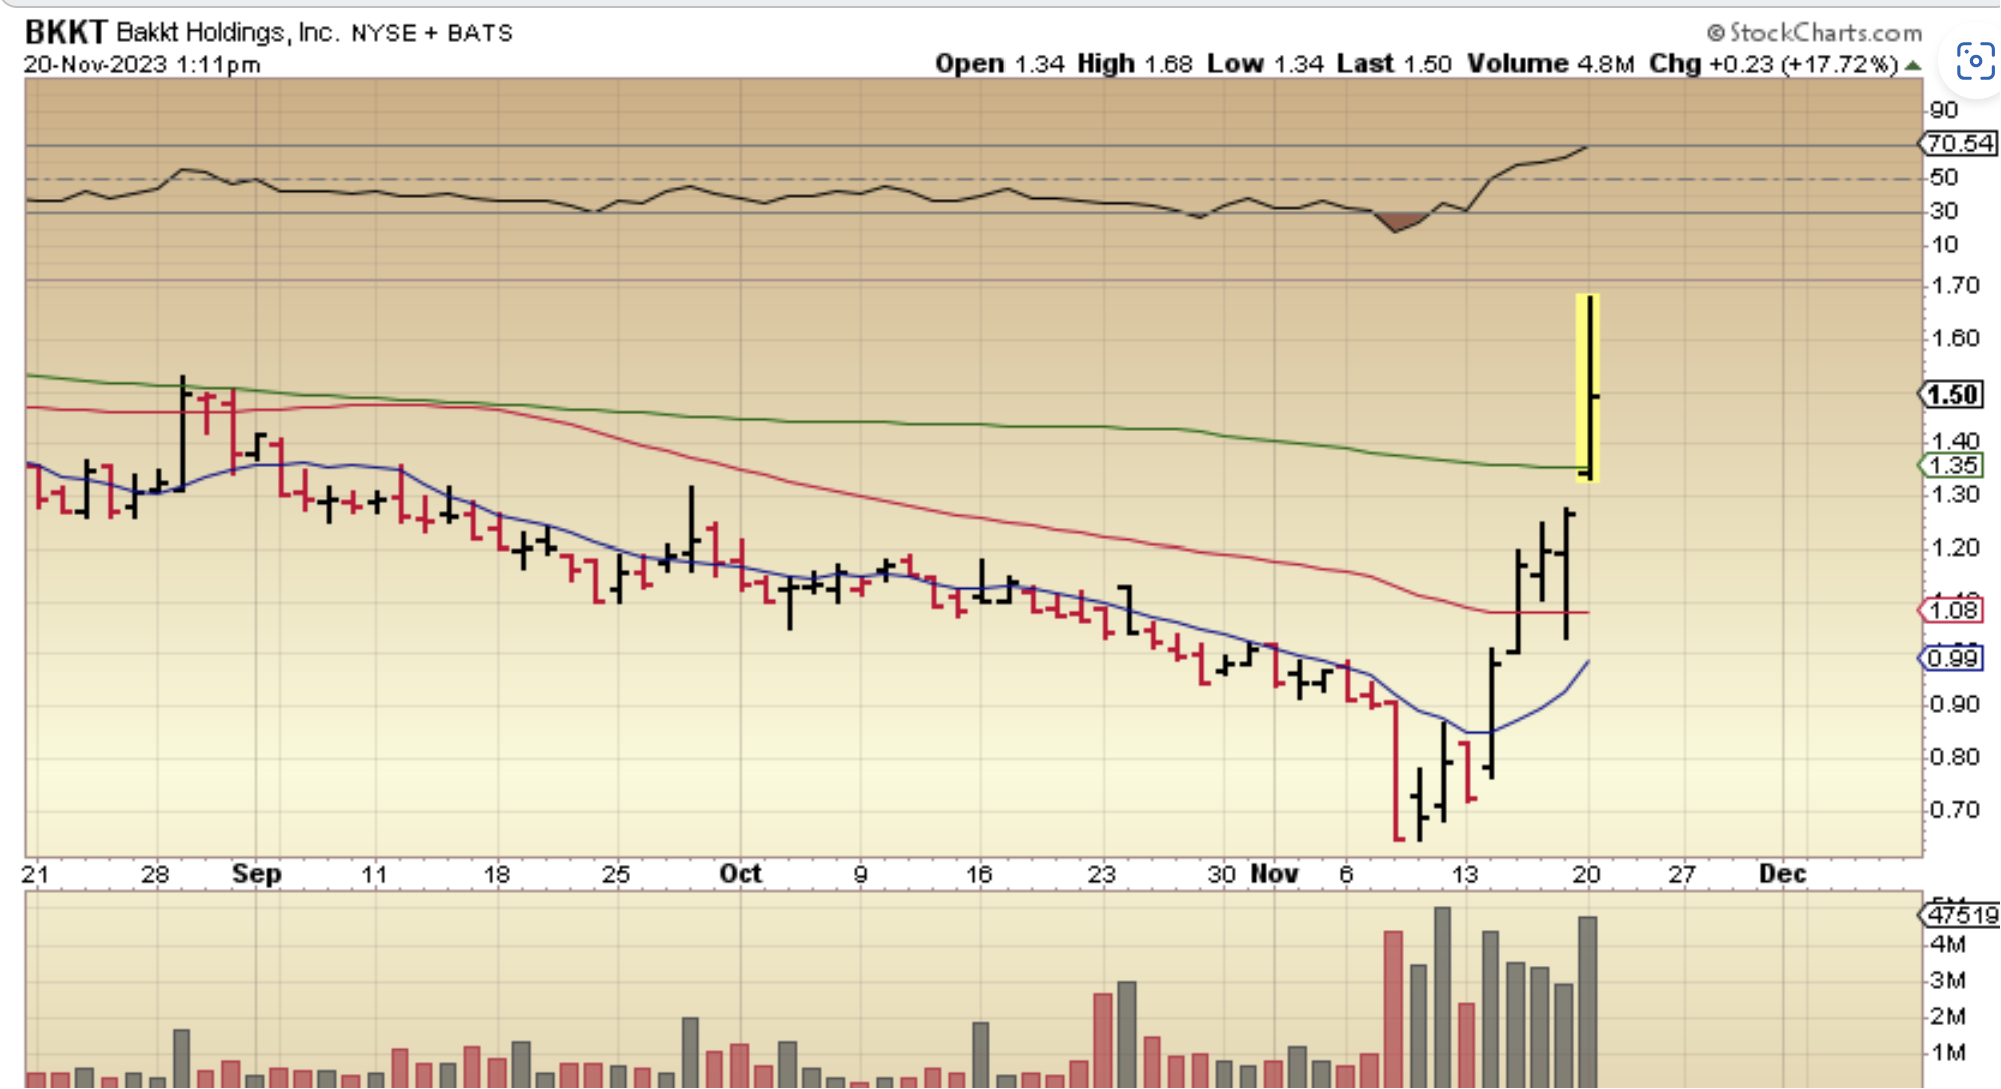
BKKT – Recently I showed how BKKT was launching higher after releasing their earnings. This is what crypto stocks can do. It was a surging for 70 cents to $1.50 and …
.
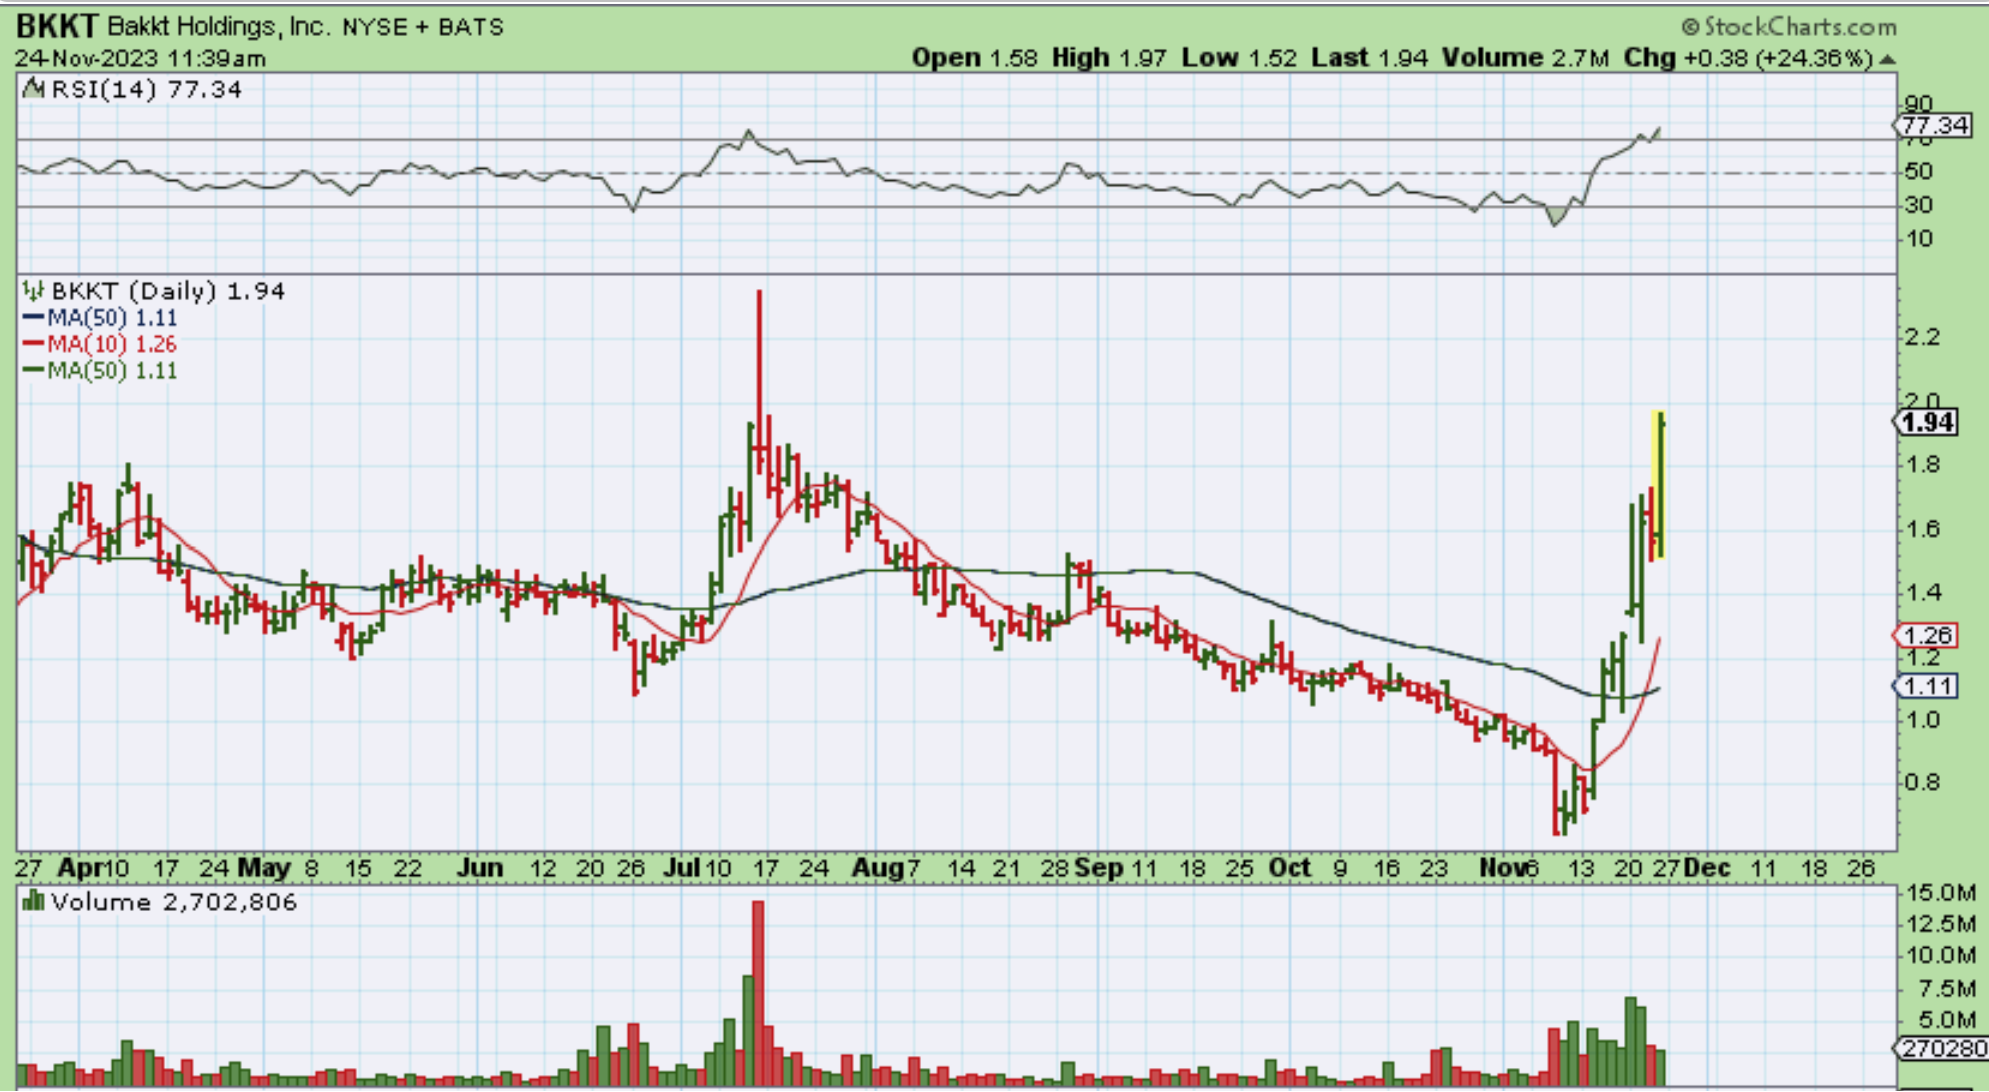
BKKT – It paused for a day and shot up to almost $2 on Friday. If it drops back it may be a buy the dip opportunity, but for now there are others to look at too.
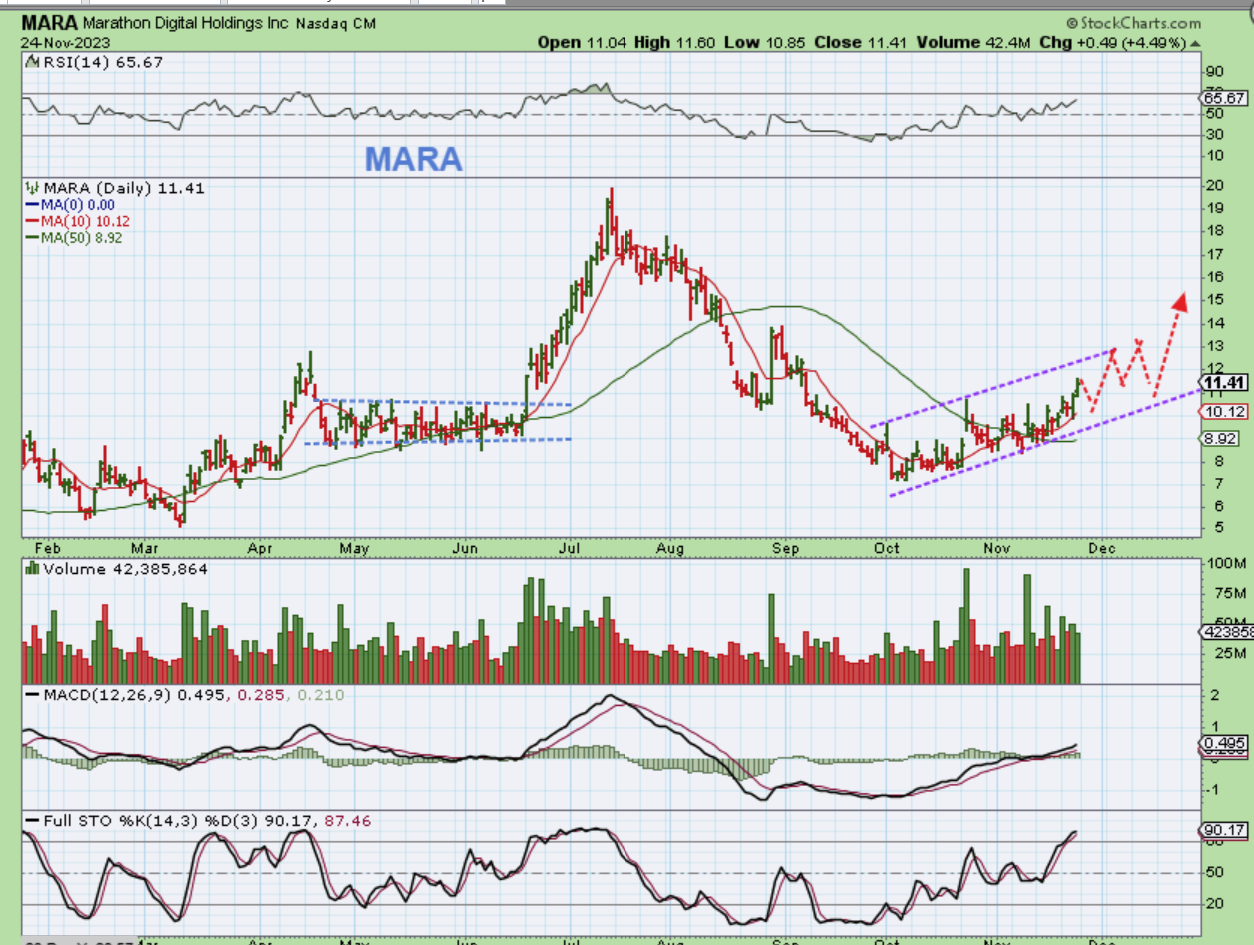
I have been pointing out the bullish base with MARA. It broke the downtrend and was tagging the 200sma with nice volume spikes and a bullish macd divergence, so it could be bought here around $10…
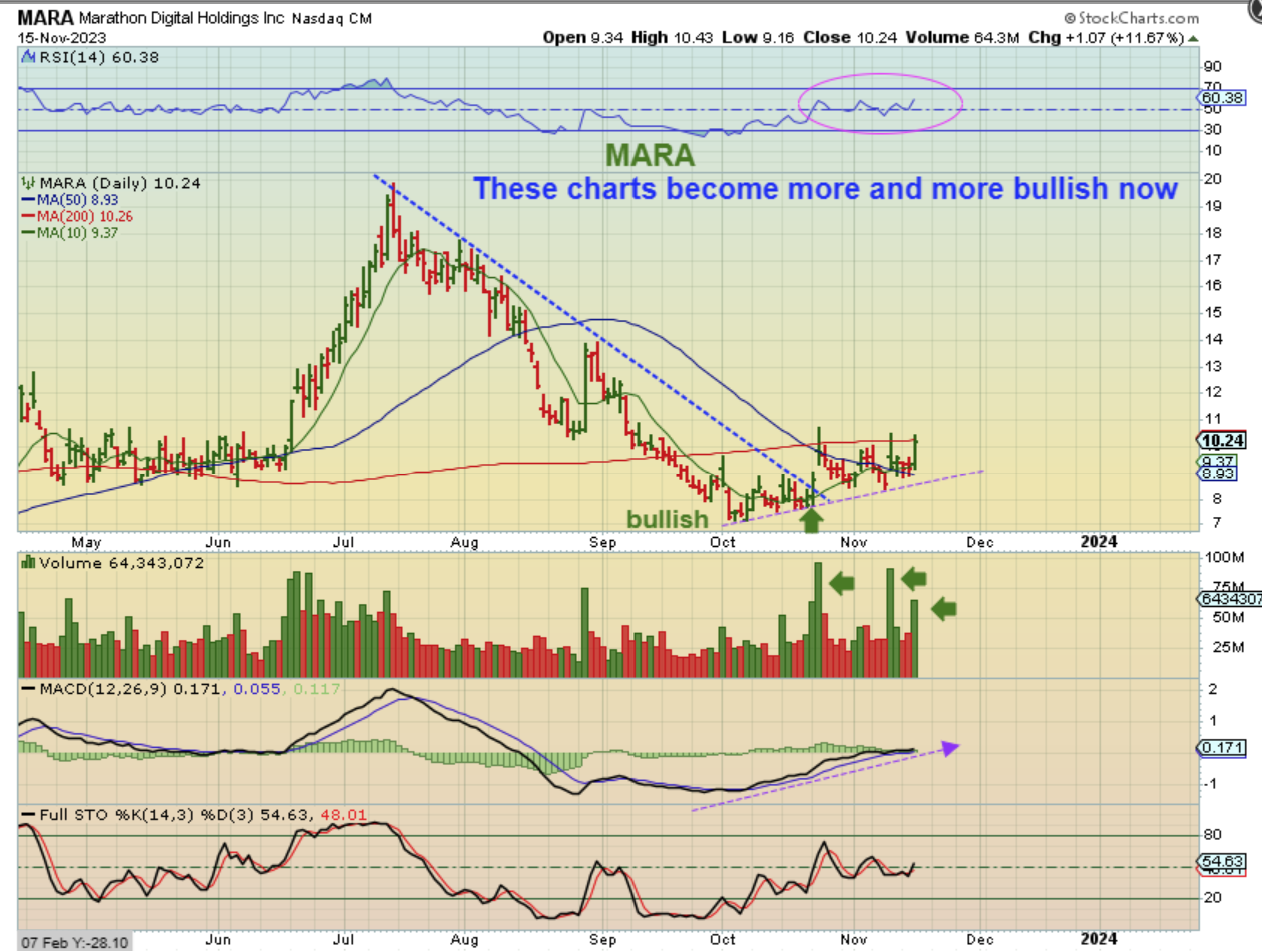
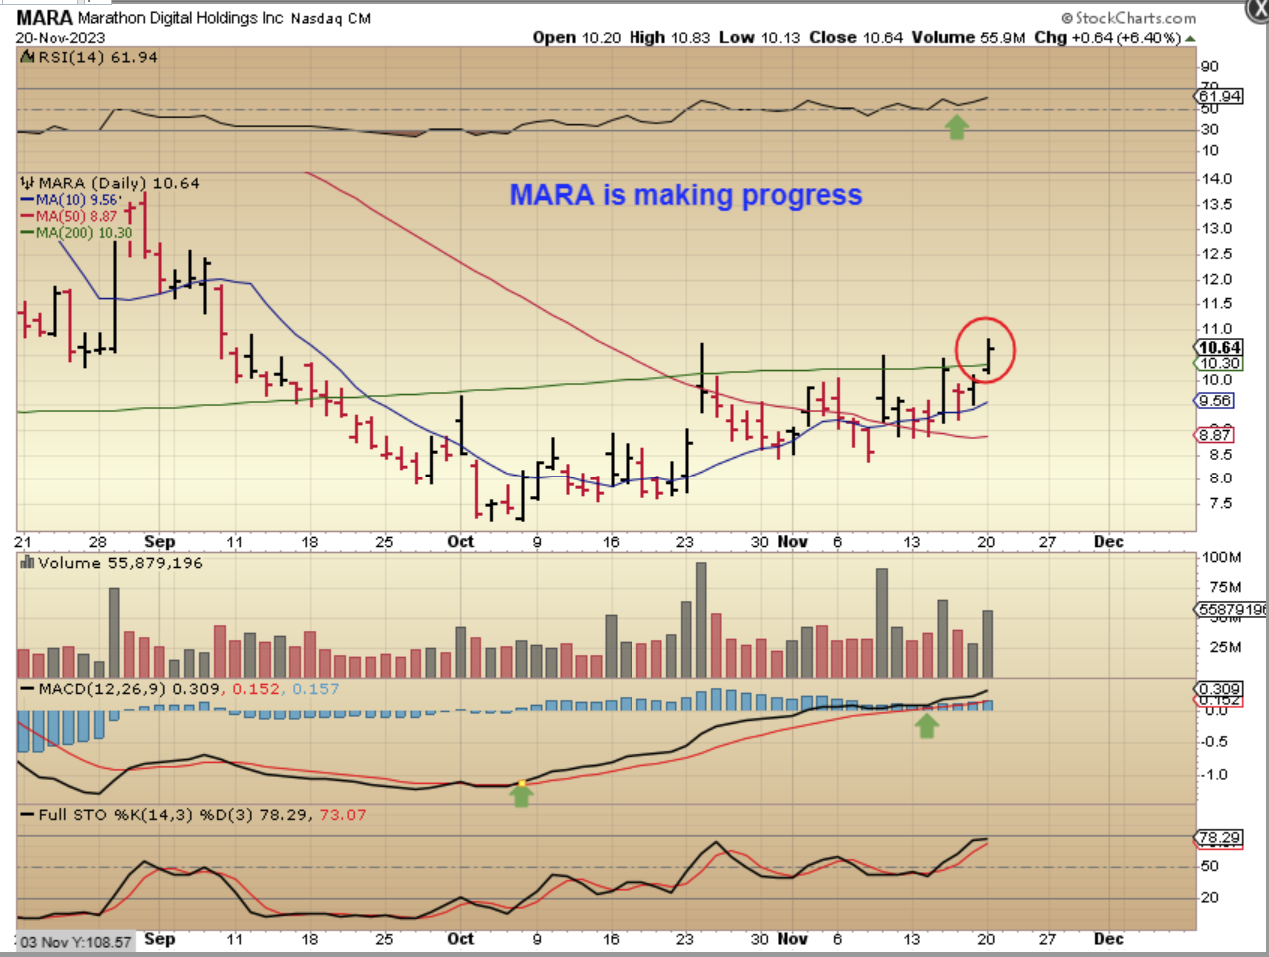
As of Friday MARA is above that 200sma and it is at $11.41. It could start trending higher as a buy & hold too. These do get choppy or volatile, but the set ups are bullish.
.
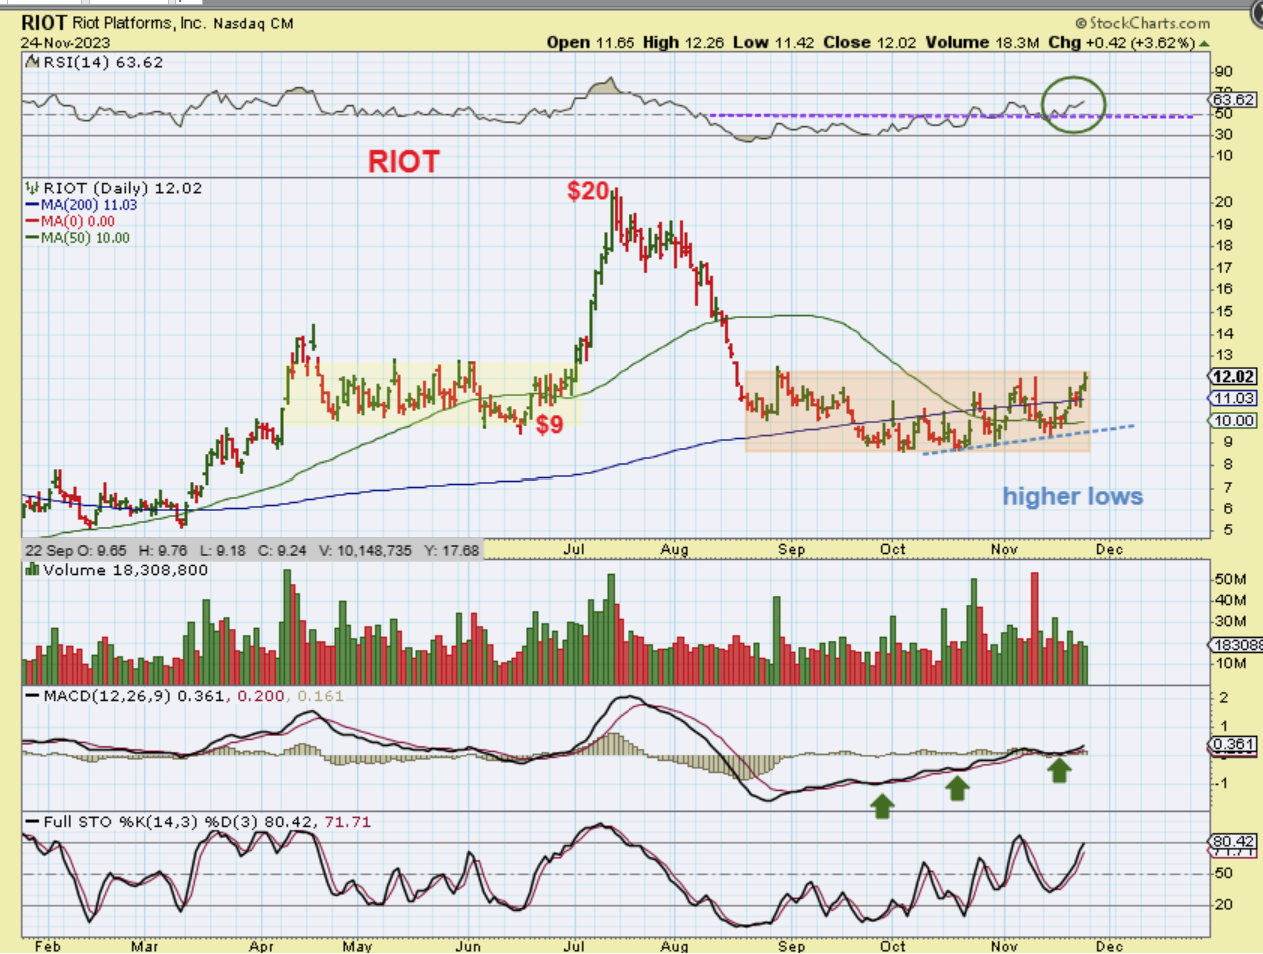
RIOT: We’ve been discussing RIOTs base as it bounced around in the $9-$11 area too. It has also now broken out above the 50 & 200sma. In June it ran from here to $20plus. Again, that bouncing action can make these hard to buy and hold, but if Bitcoin has an ICL in place, these could be much higher in the future! A small basket of Cryptos, or a few individuals that released earnings already could give you some nice gains.