Wednesday November 29th
If you were invested in a basket of Gold Miners or Crypto Miners, as has been recommended here at Chartfreak, then yesterday was a really nice day, maybe even a great day! The good news is that we are only on day 12 of a second daily cycle with Gold and I also see Bitcoin as early in its’ daily cycle, so Buy & Hold could lead to some more nice gains. Let’s take a look….
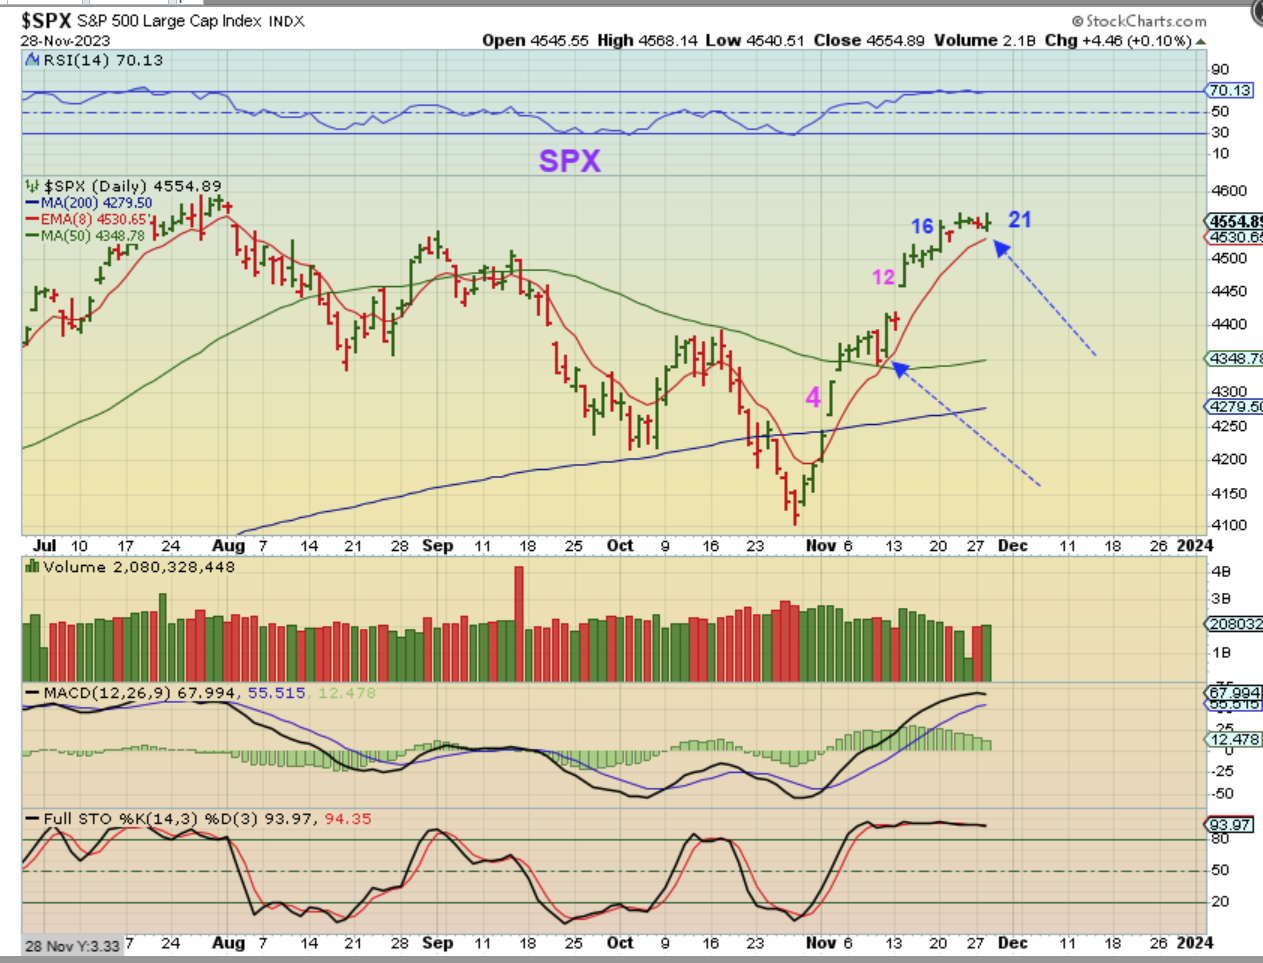
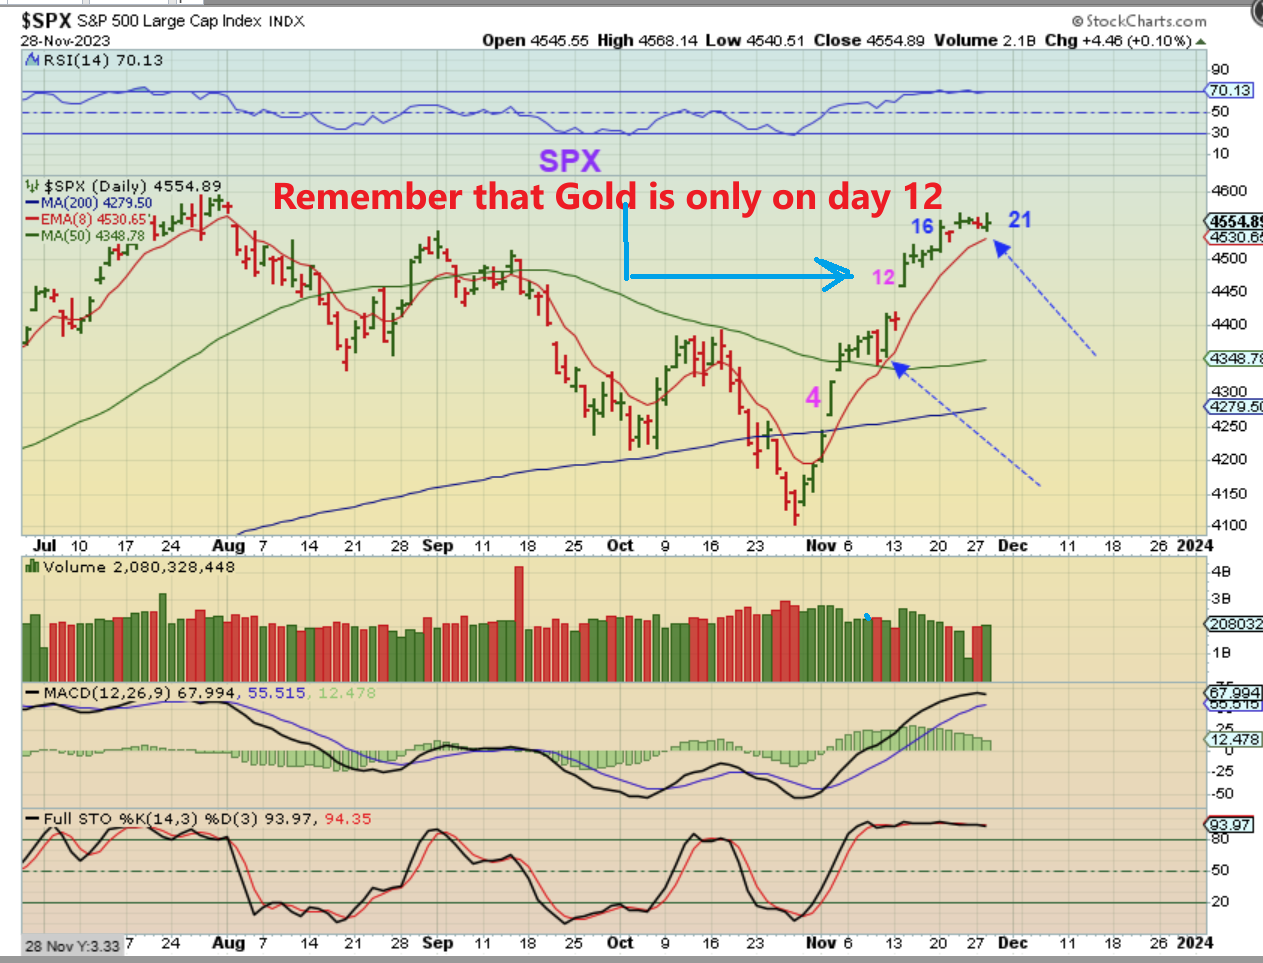
The SPX rallied hard into day 16-18 and now it is chopping sideways as it is consolidating those gains. The 8 ema has been a support area on prior bull runs, and we are still above that area.
.
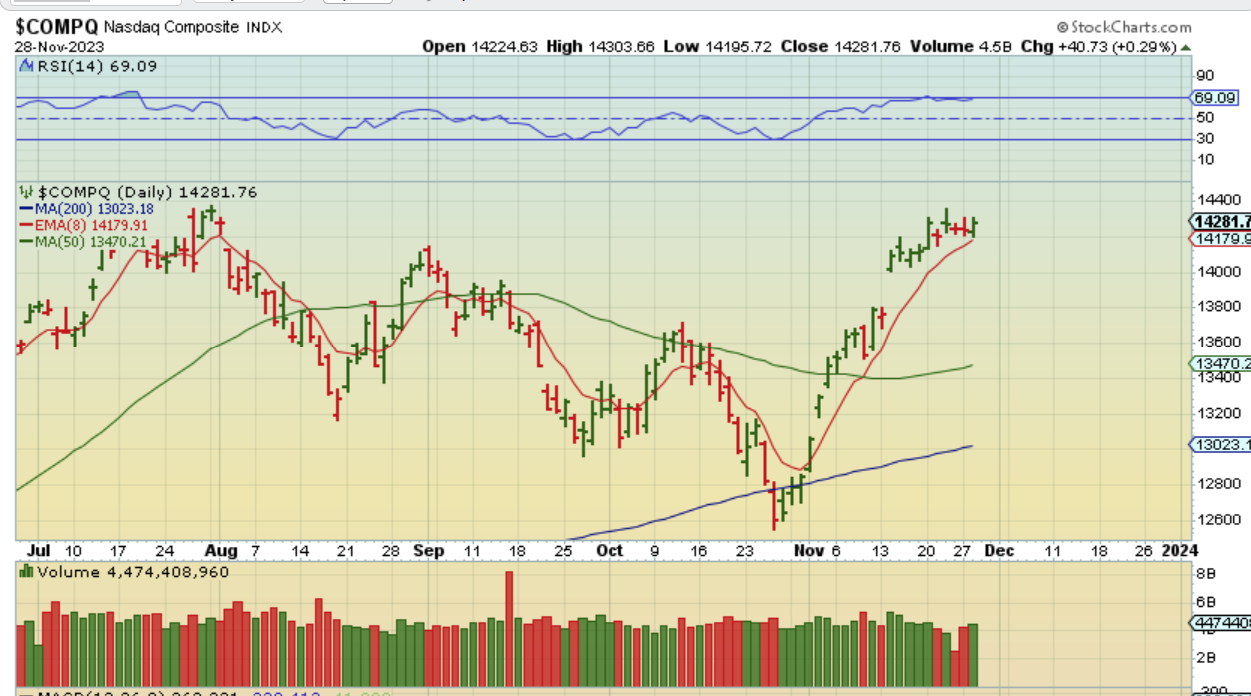
NASDAQ – We see the same bullish price action here. If you are trying to avoid losses, you could use a stop under the 10sma, and this can still run higher or start that dip into the next dcl. Either way, the price action described is normal and then I’d expect another bullish run, so a simple BUY & HOLD strategy works from the ICL buy too.
.
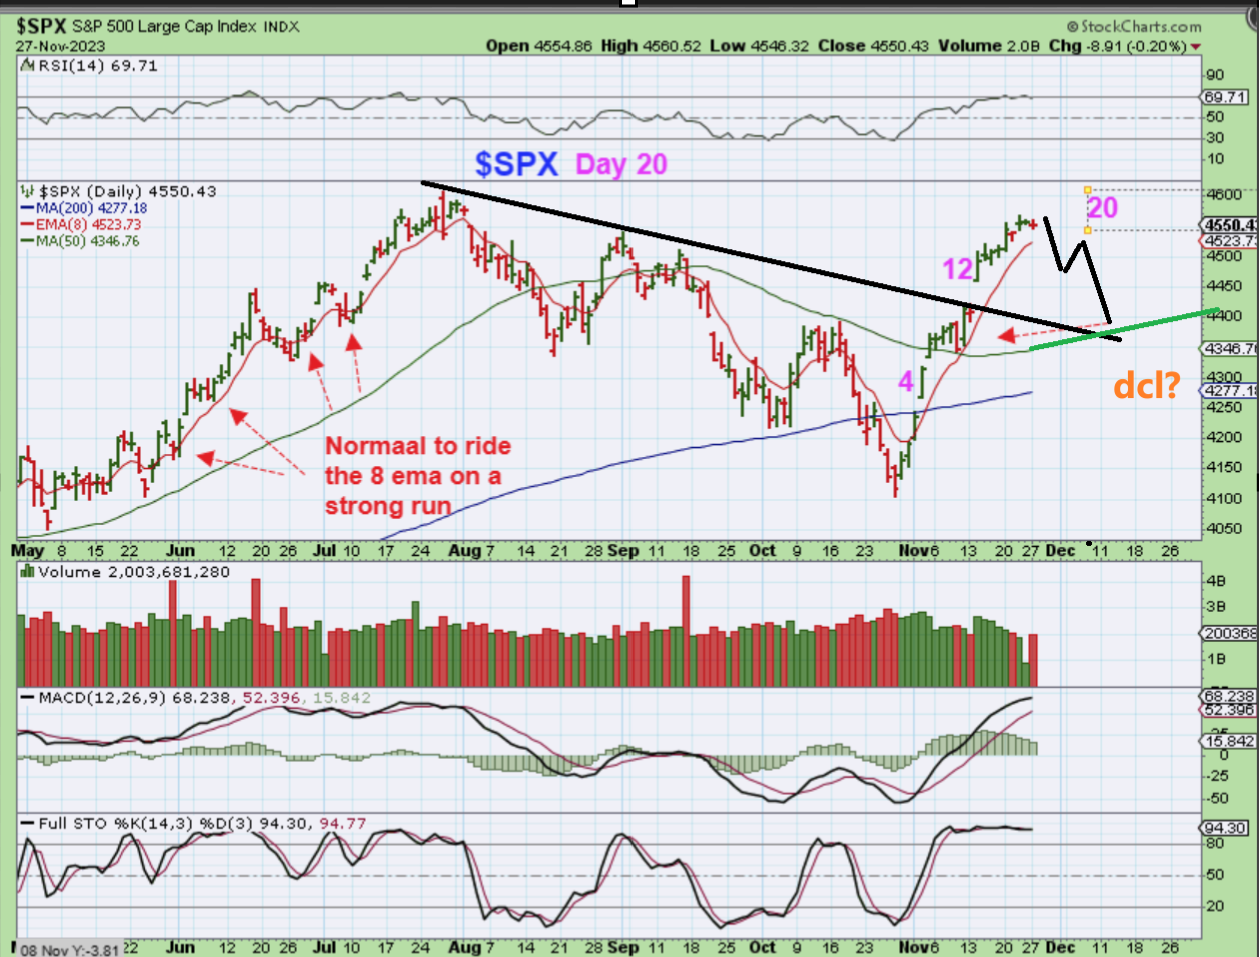
YESTERDAY I MENTIONED HOW A PULLBACK COULD UNFOLD (Though it may just run higher).I said…
SPX – A dip that started now could drop all the way down to back test the day 12 breakout and the 50sma as shown. The markets have been strong so I almost don’t expect this scenario, but I just wanted to mention it since it is a valid possibility.
.
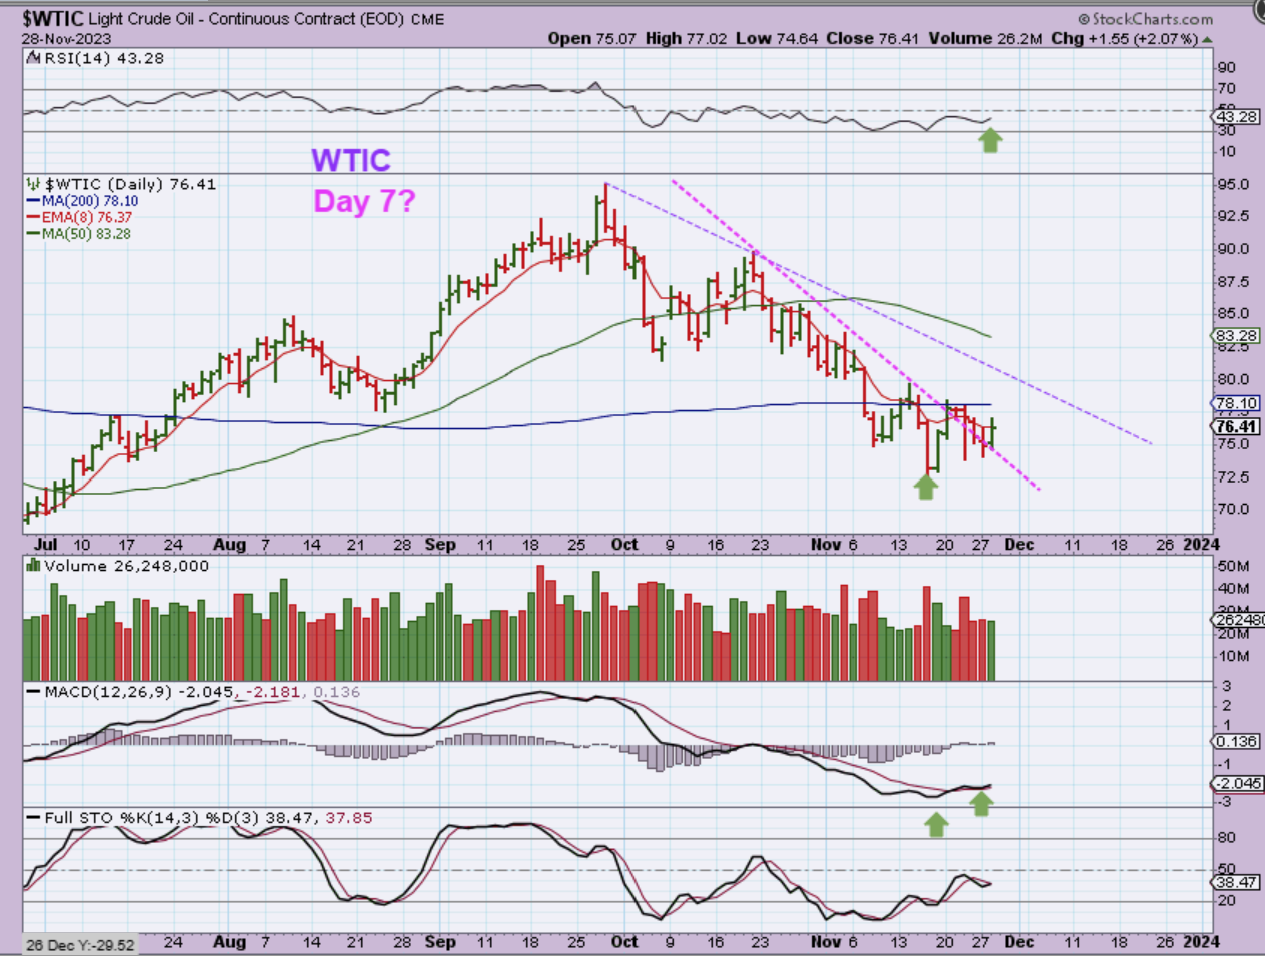
WTIC – Oil should be bottoming and it did try to push higher again yesterday. I have discussed that 200sma as further confidence that Oil wants to run higher.
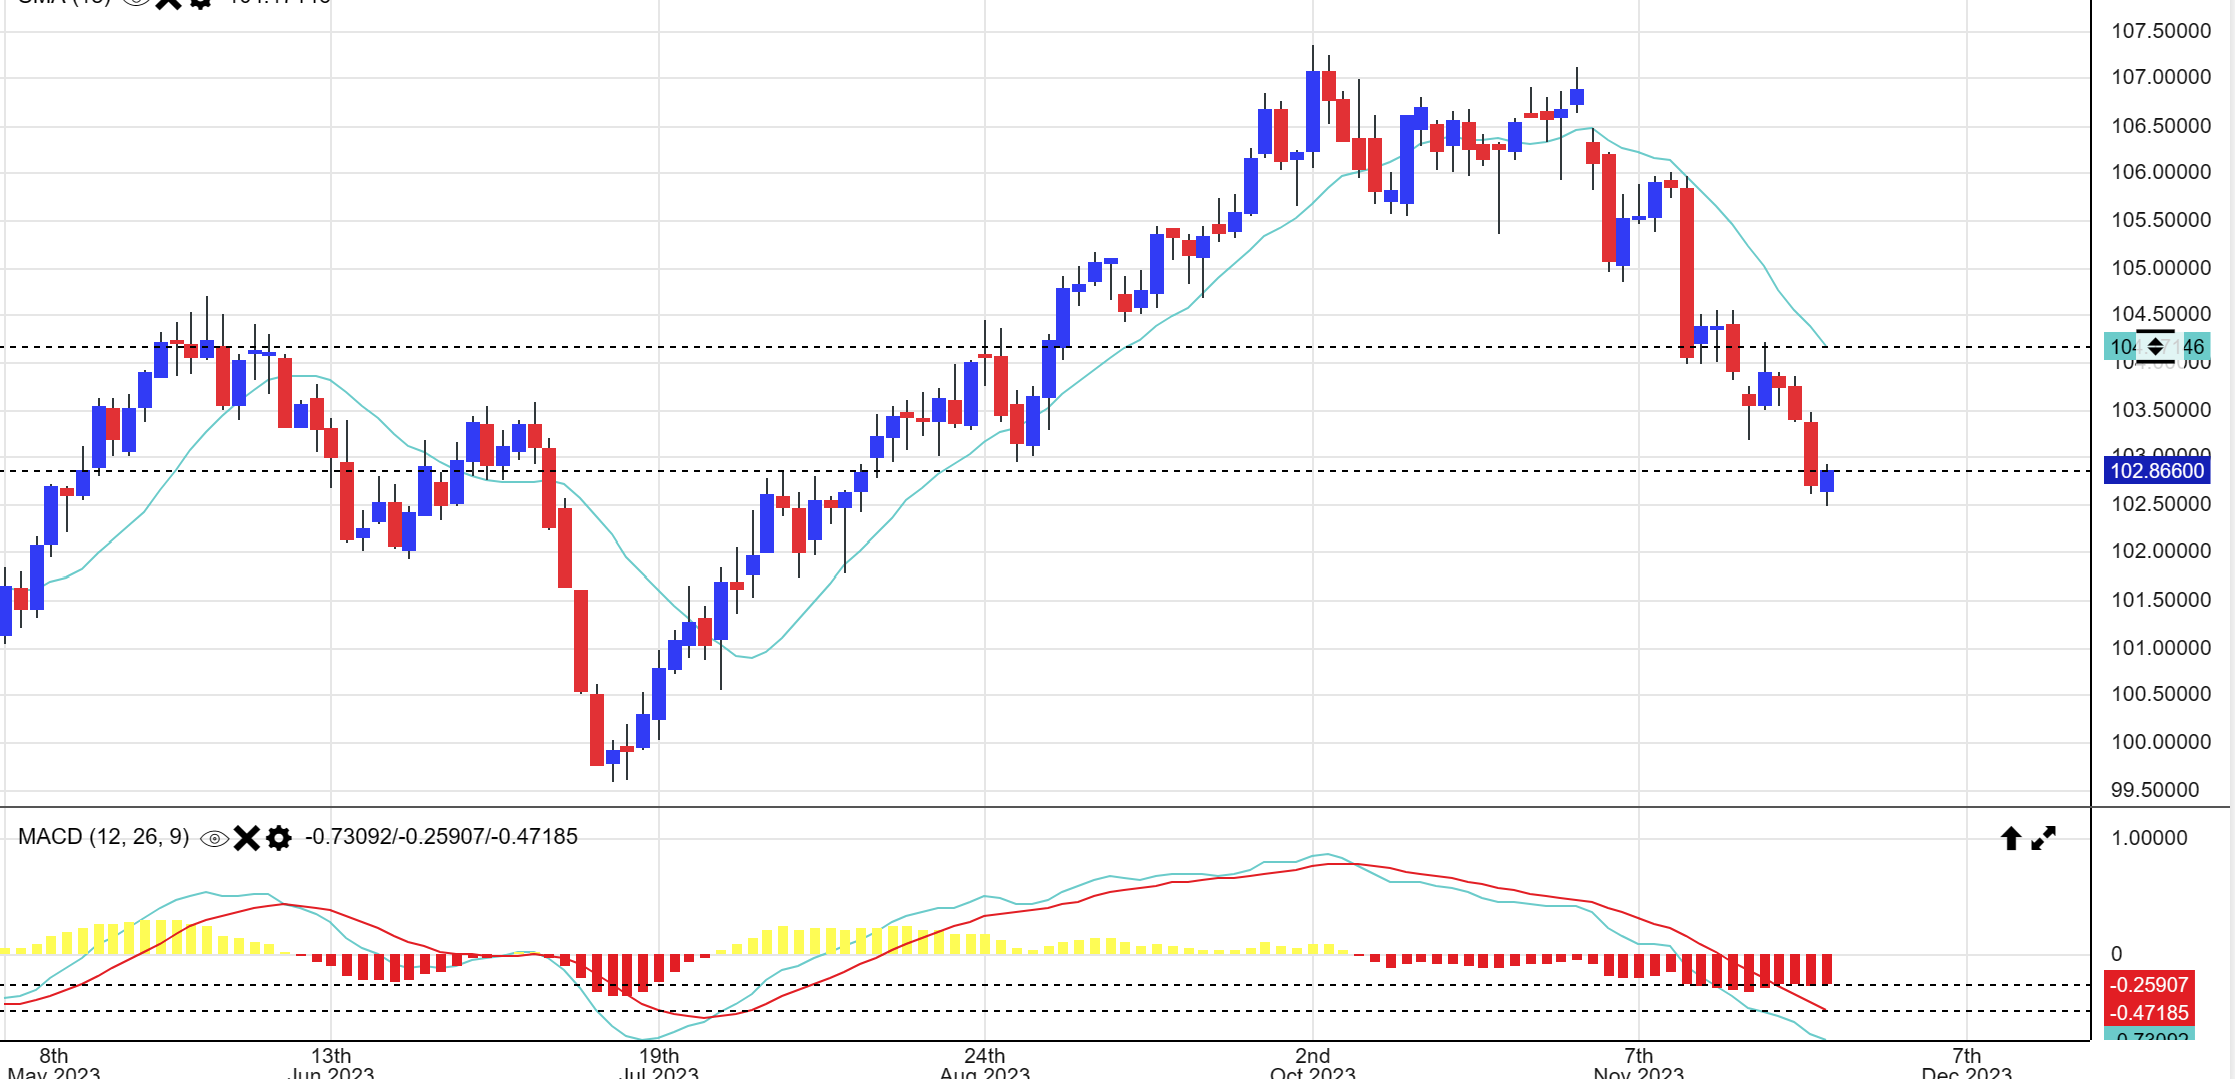
This is The USD live at 6 am ET, so that last ‘blue’ candle is The USD trying to bounce on Wednesday. The point is that it is rolling over as expected and yesterday was a pretty big red candle. That certainly helped push Gold higher. IF THE USD bounces today, Gold may pause, but trust me, this could bounce in the morning and sell off later too.
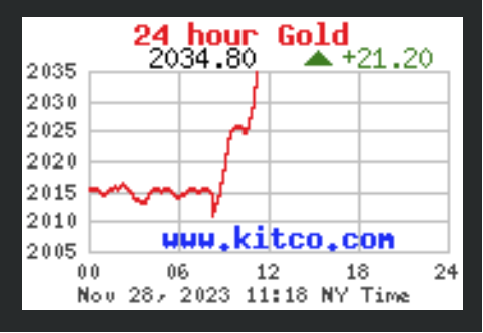
What I liked about yesterday was that GOLD started higher after a quick drop in pre-market and then it just kept rising all day long. I captured this at 11:18 a.m., and you can see that Gold rallied, paused, and then started a 2nd leg up. Gold ran up roughly another $10 from here and the Miners followed that path.
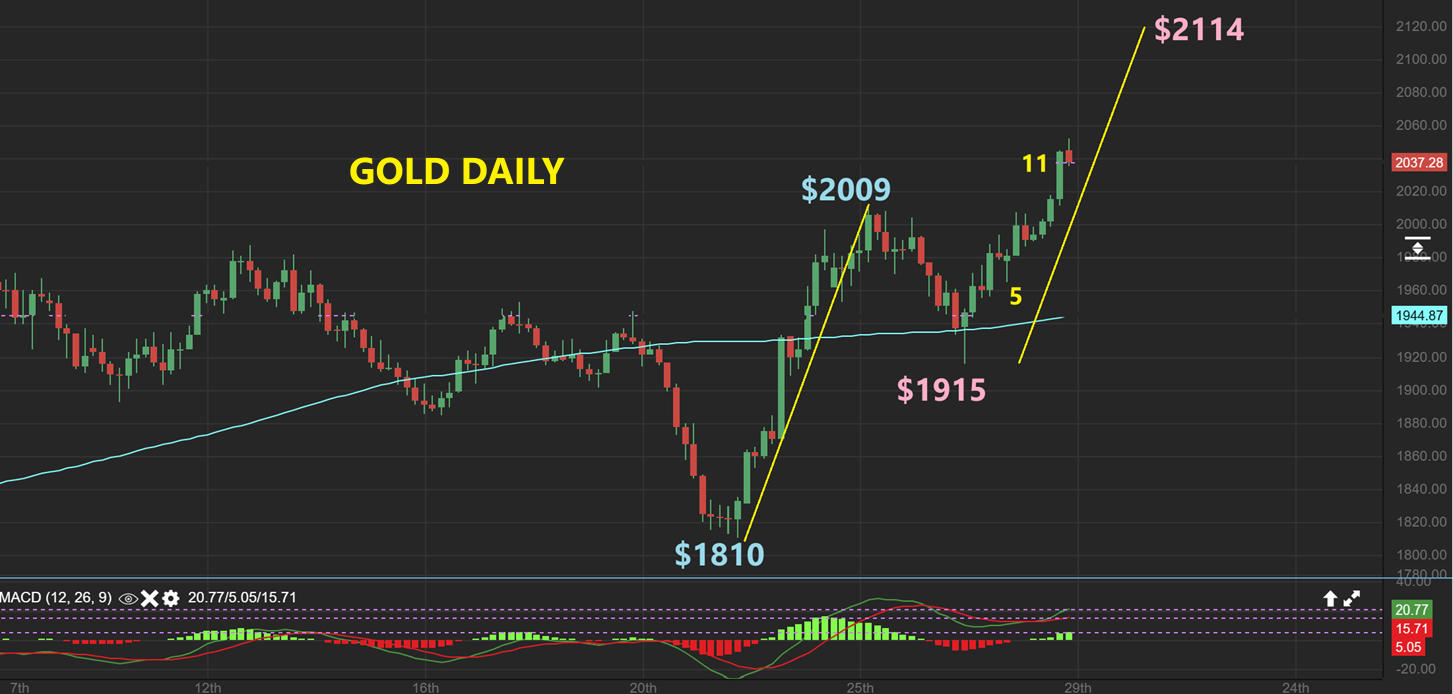
Gold Live 6 am ET: The red candle is what we have so far on Wednesday morning, which is ONLY day 12 for Gold:
If I do a ‘measured move’ on this breakout in GOLD, or an ‘A-B = C-D’ measure, it reaches a minimum of $2114 (New all-time highs). Again, this is only day 12 and that move is very possible. Let me show you another helpful visual…
.
REMEBERING THAT GOLD IS ONLY ON DAY 12, WE CAN LOOK AT THE CURRENT BULL RUN ON THE SPX: Day 12 was a large push here too, and price simply paused and continued higher. There were no large pull backs.
.
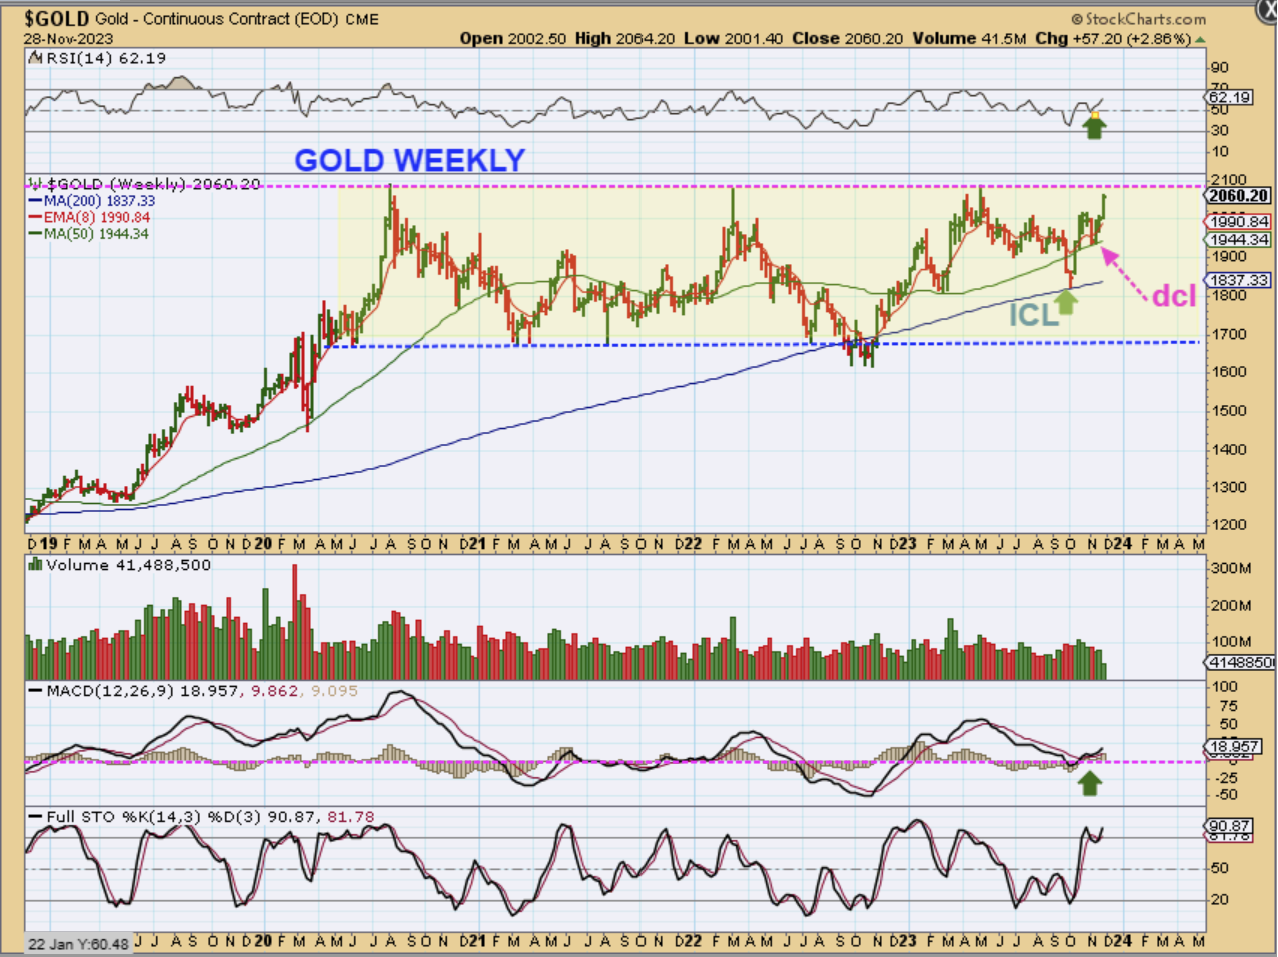
I wanted to go back to the Weekly view for GOLD.
This is only as of Tuesday, but we do have quite a nice surge toward the highs already. Our ICL reversed Bullishly at the 200 week ma, and our DCL reversed at the 50 week ma. This is early in the Intermediate Cycle and everyone that called this a ‘triple top’ is now wondering what they missed? 🙂 We were expecting this the whole time, as we expected the 3 yr cycle low or a big drop in the USD, and we have been positioned to benefit.
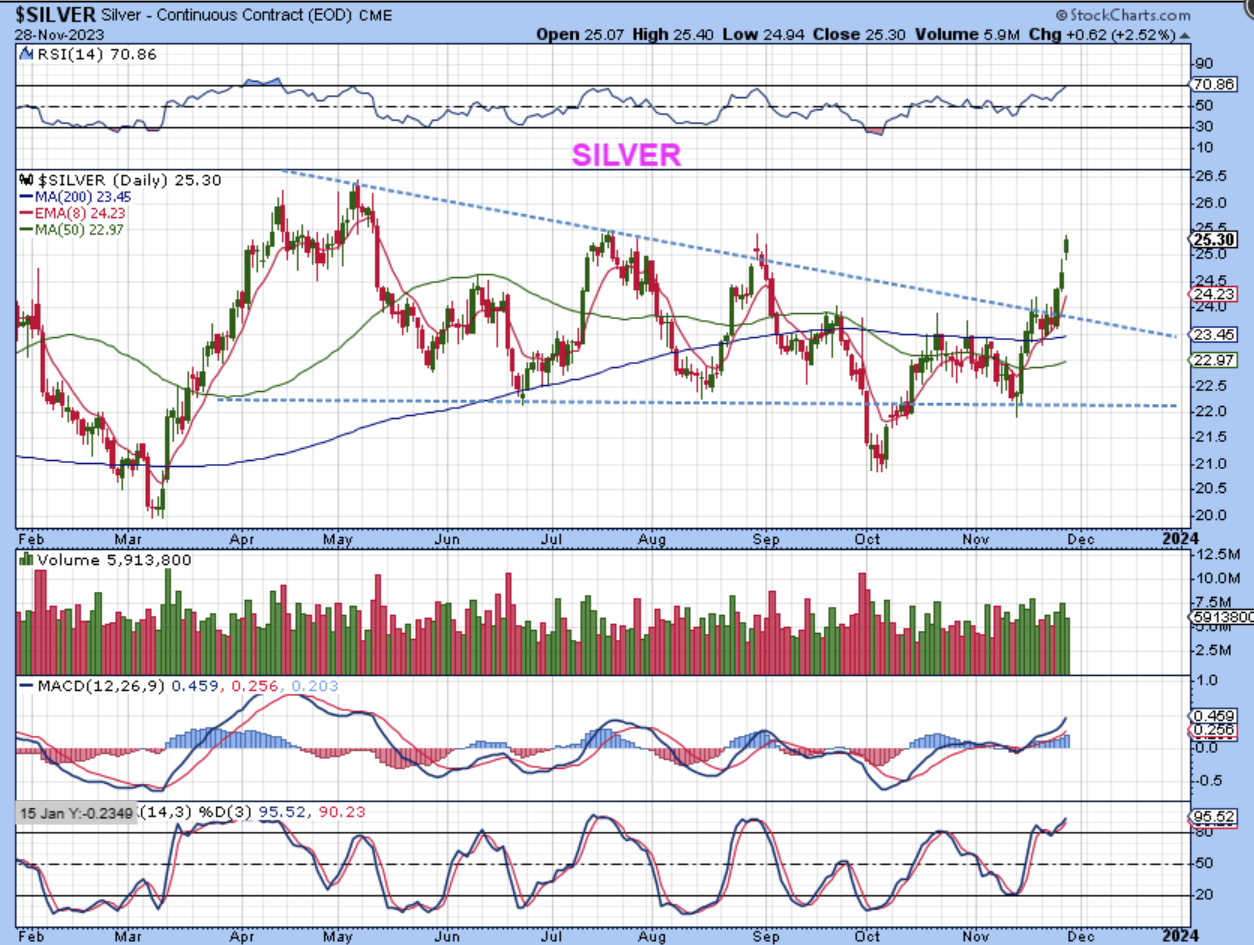
SILVER broke out from that downtrend and is on its way higher too.
.
THIS IS WHAT I WROTE IN YESTERDAYS REPORT ABOUT THE MINERS:
.
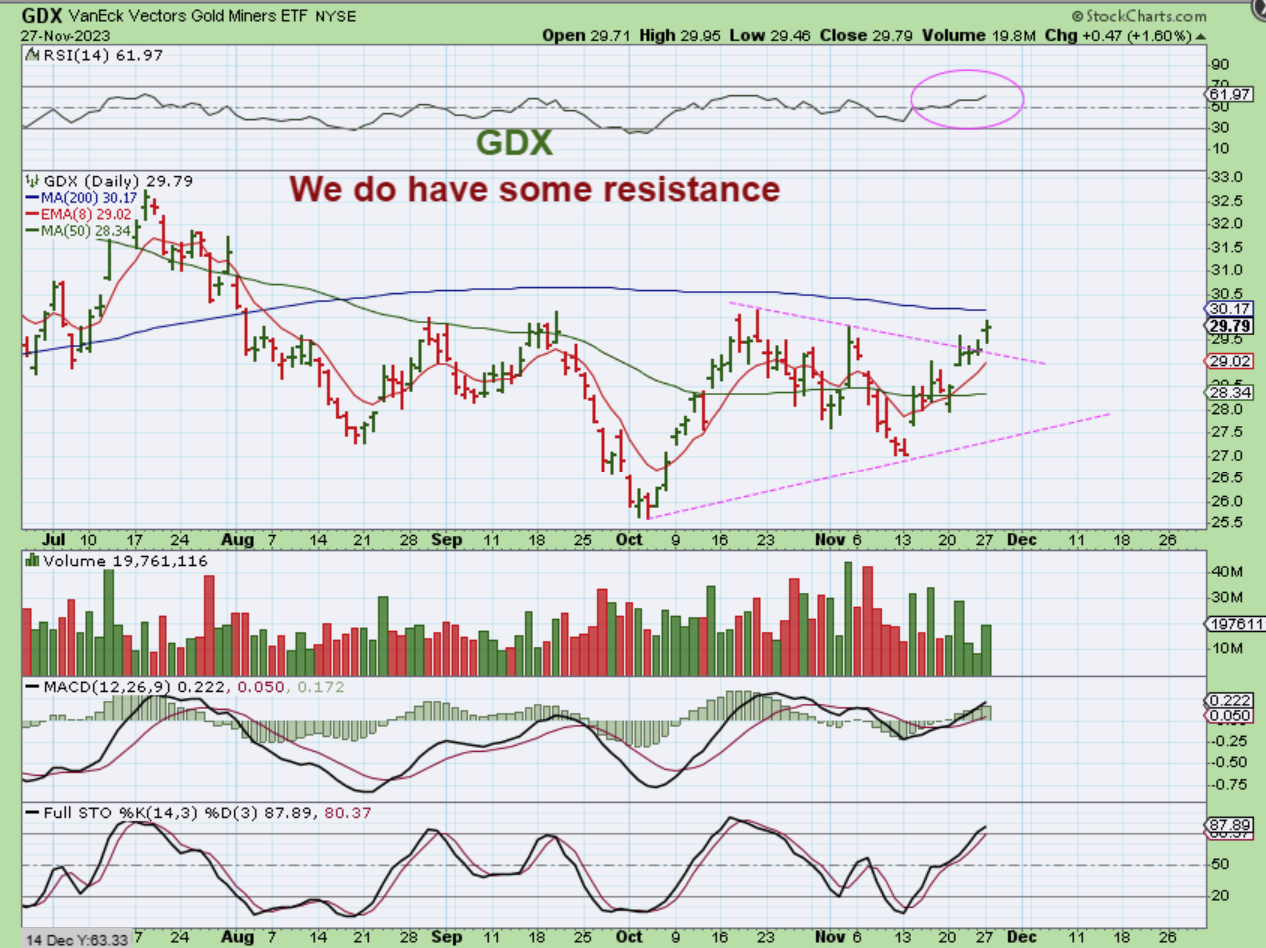
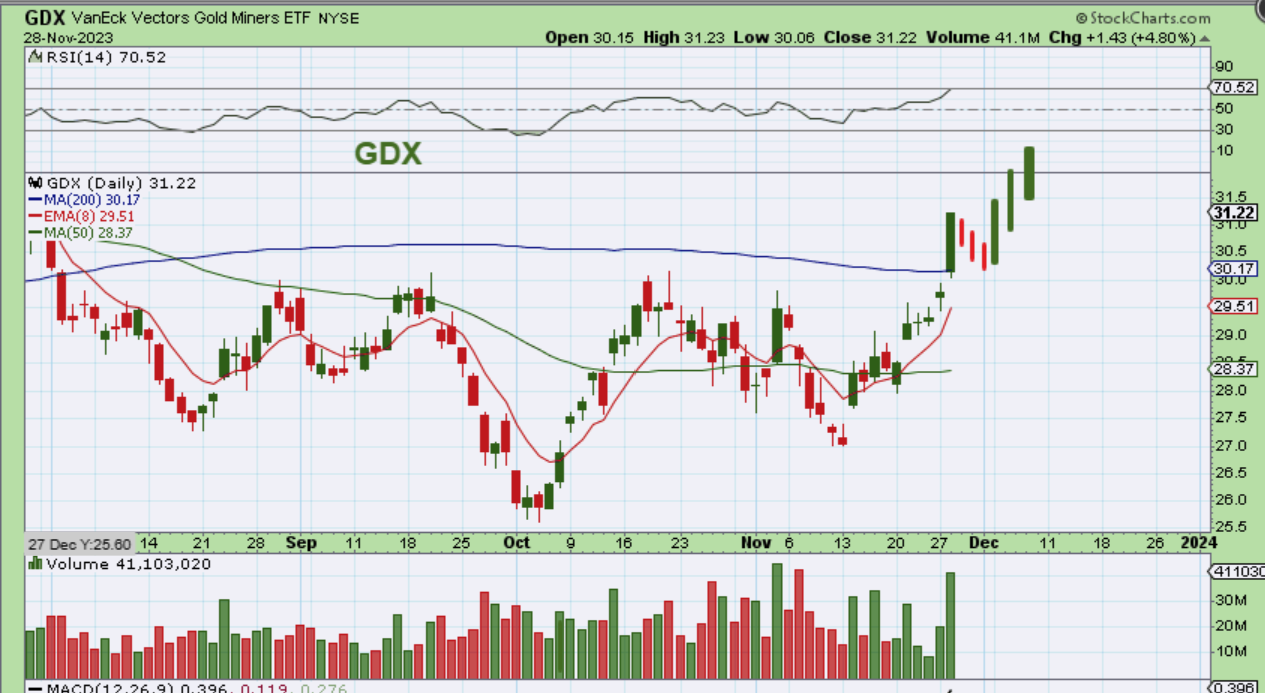
GDX did a bit of a pop and then formed a doji, but it also broke a small downtrend with yesterdays gap open. We do have the 200sma overhead, so I would expect to see price up there soon. We have chopped sideways so it could simply burst right through it, or it may also churn sideways and build energy for a breakout. The set up is Bullish, but this chop will put some people to sleep. 🙂
.
Well, if that chop was putting some people to sleep, THIS was a real wakeup call!! 🙂
.
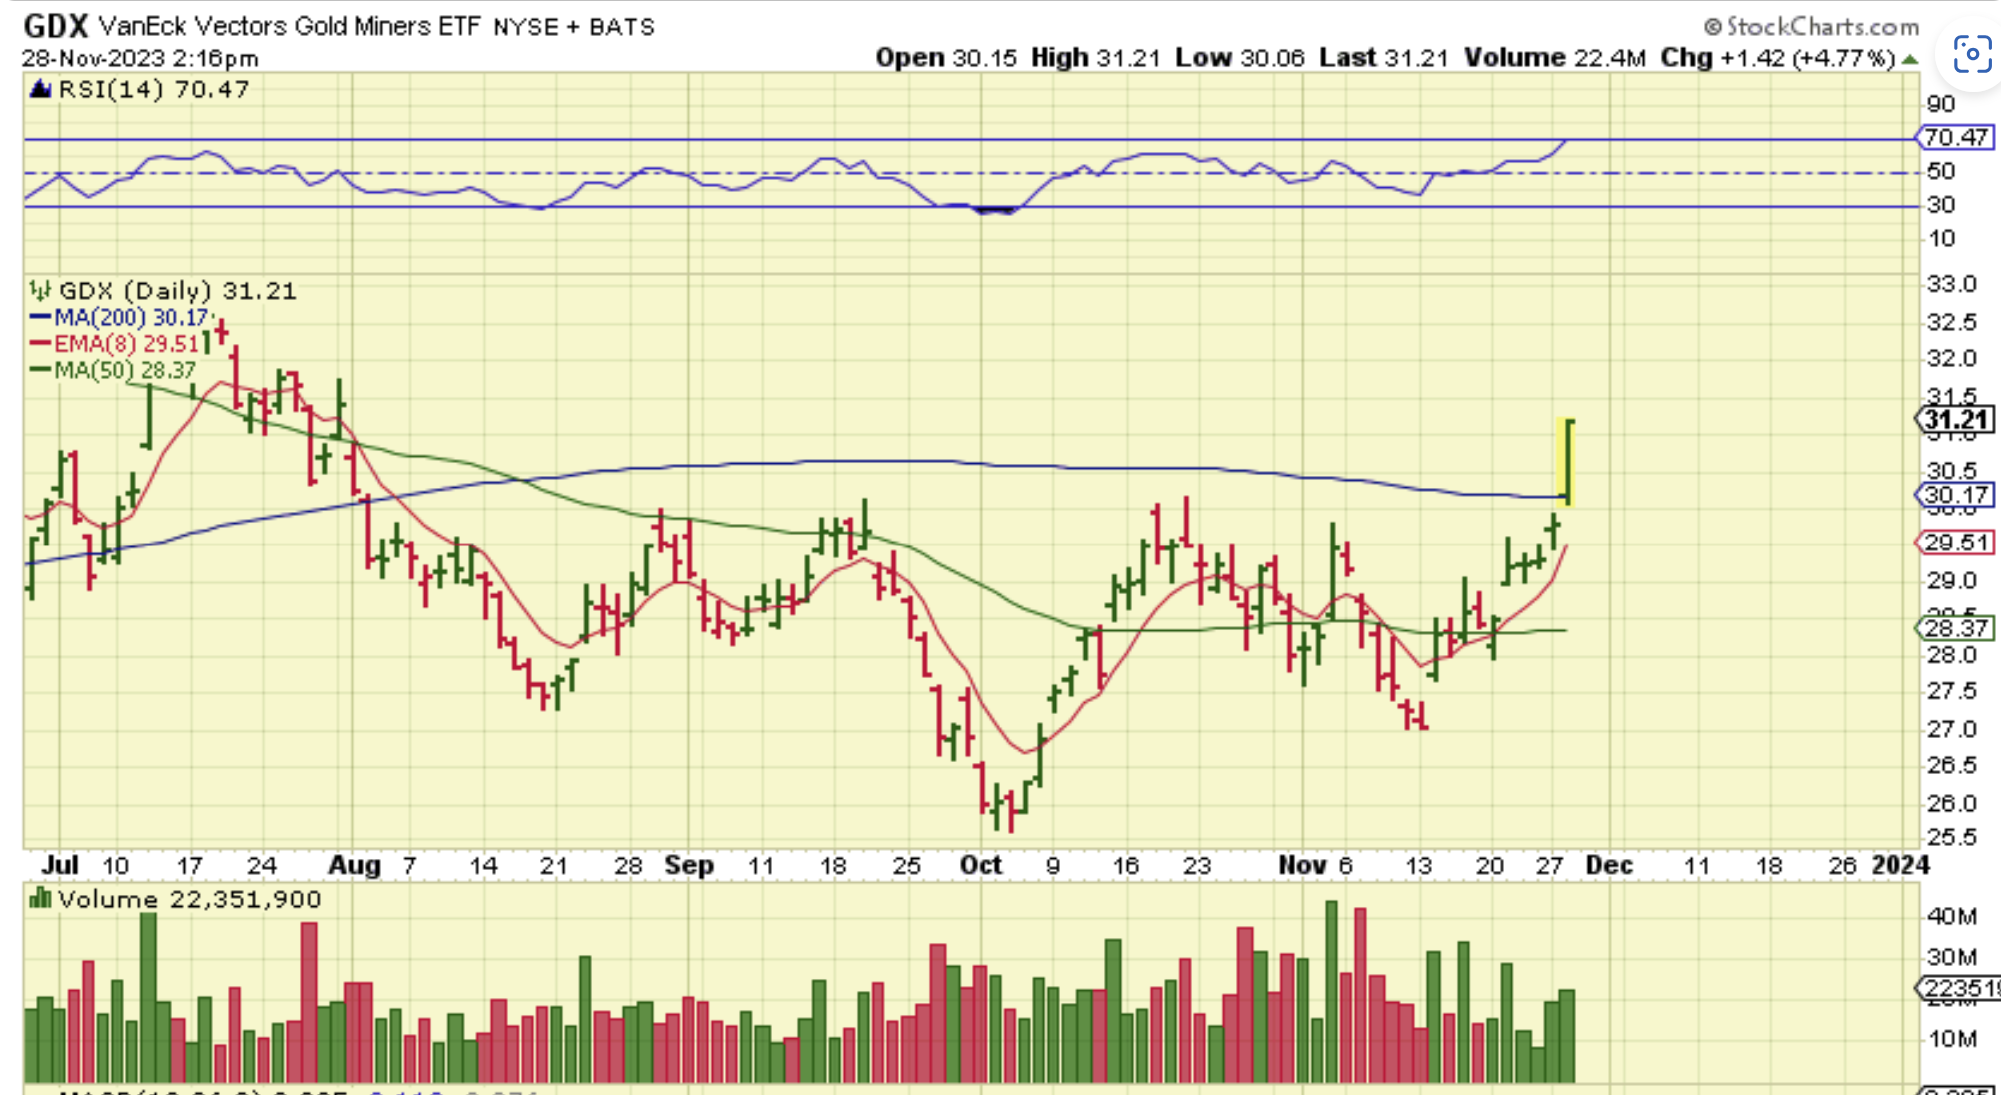
This is what we had as of 2:16 p.m. ET yesterday. WOW what a beautiful statement by The GDX ETF. This breakout at the 50sma meant business and all of that chop over the past couple of weeks means nothing now (unless it caused some to sell their positions too early).
.
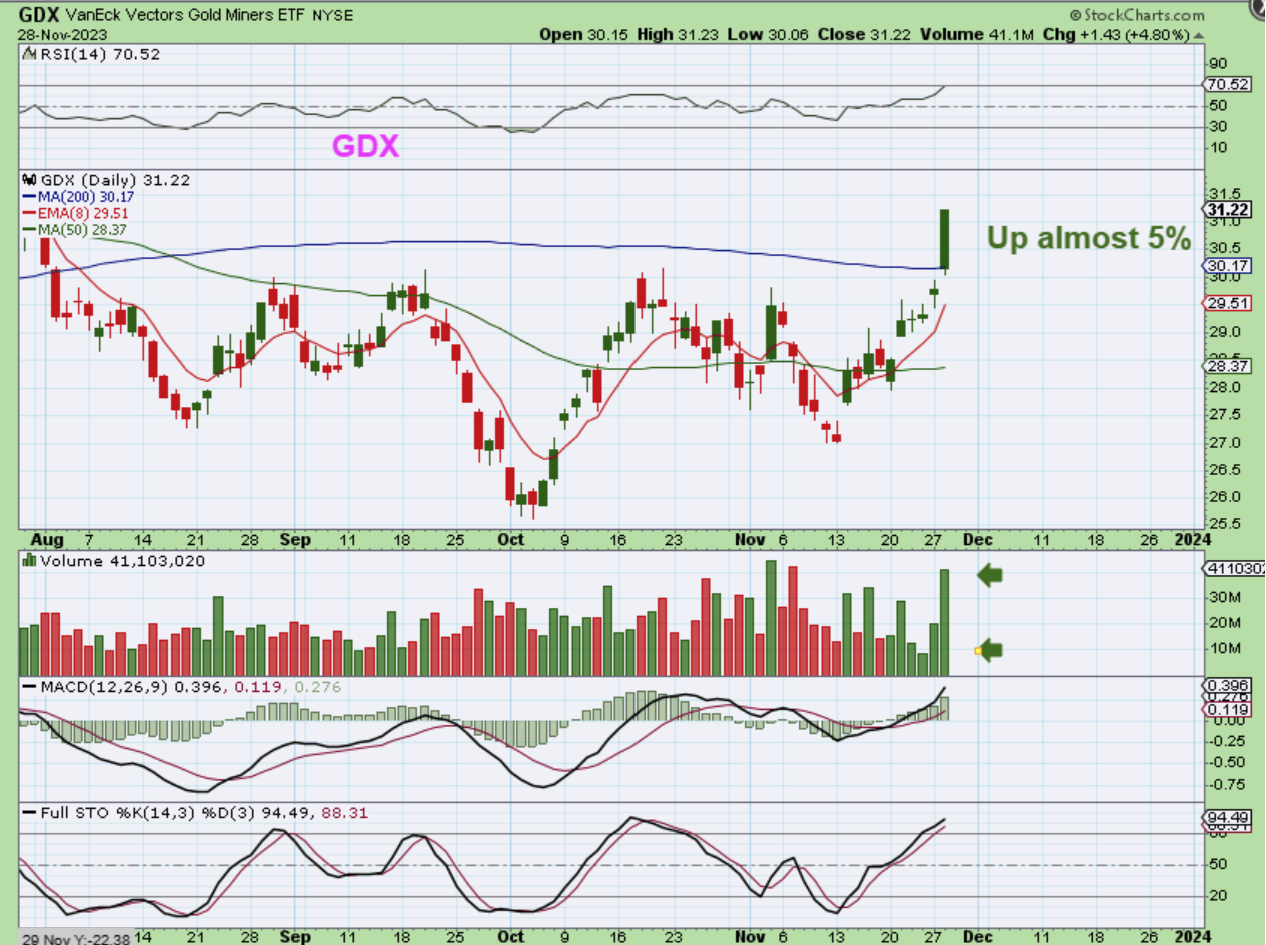
GDX was up almost 5% and look at that volume! I’m sure that everyone is wondering what will happen next? Well, I am going to tell you : This will continue higher, but there are always a couple of paths that it could follow, right? So I’ll show you the 2 most likely paths.
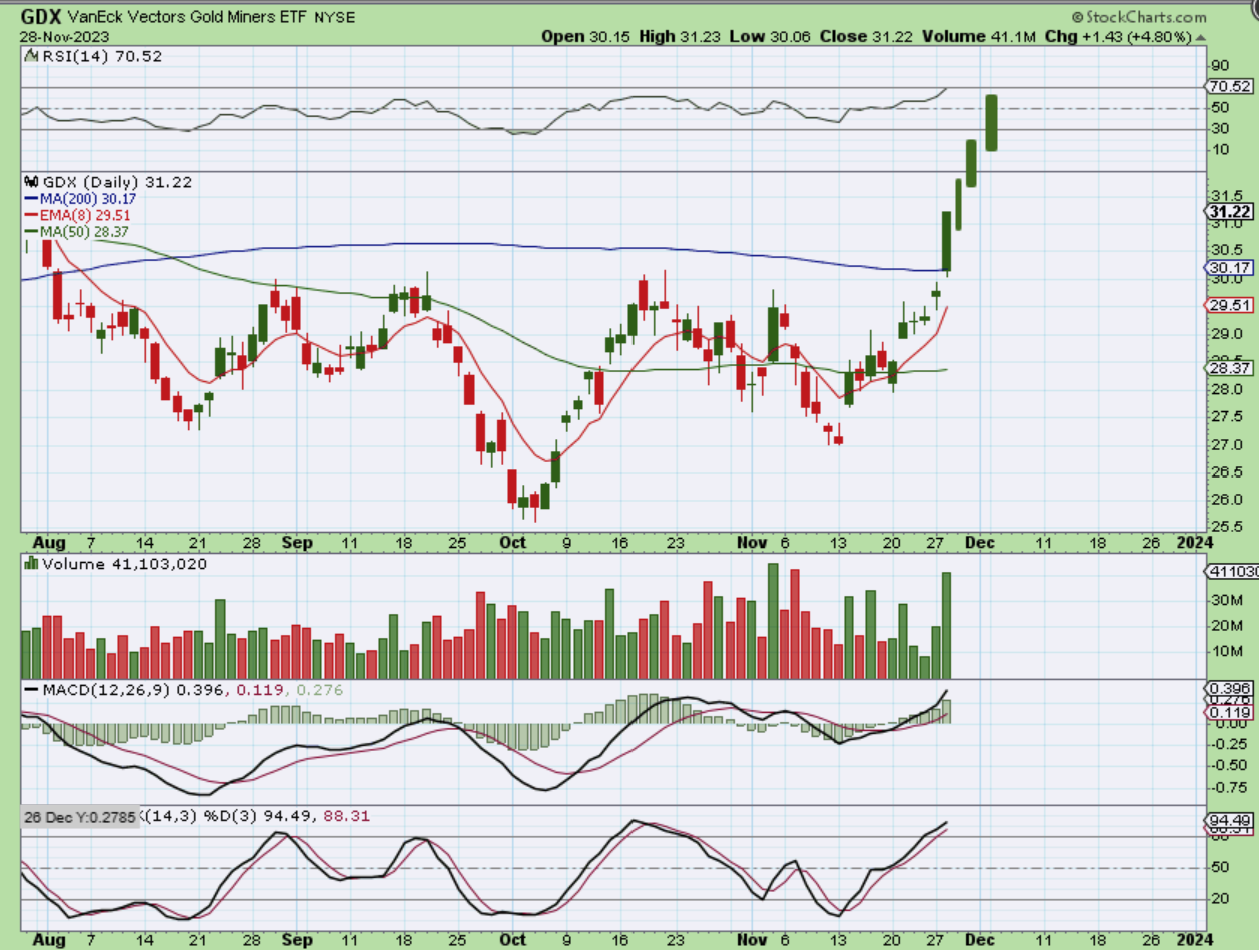
For people that sold during the recent choppiness, that could be a lock out move that has them wondering how to get back in. If it just runs away, they will be left behind, and that move COULD look something like this. OR…
.
OR
.
THE GDX COULD SHOW THEM MERCY AND ALLOW SOME BUYING IF THEY DARE TO BUY A DIP:
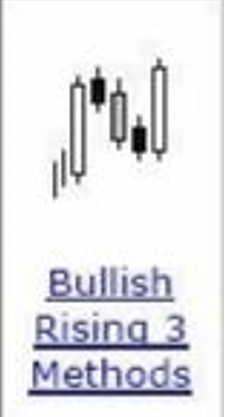
This is a very common ‘Continuation pattern‘. After a strong surge it stalls and dips for a couple of days, and then when people get bored or even sell their positions in fear of further selling -it just takes off again. THIS PATTERN IS VERY COMMON.
.
So I have drawn that pattern here for you on The GDX. IF YOU SEE THIS, it is not ‘weakness’ or a sell, it is a 1/2 cycle dip and should be viewed as a continuation pattern.
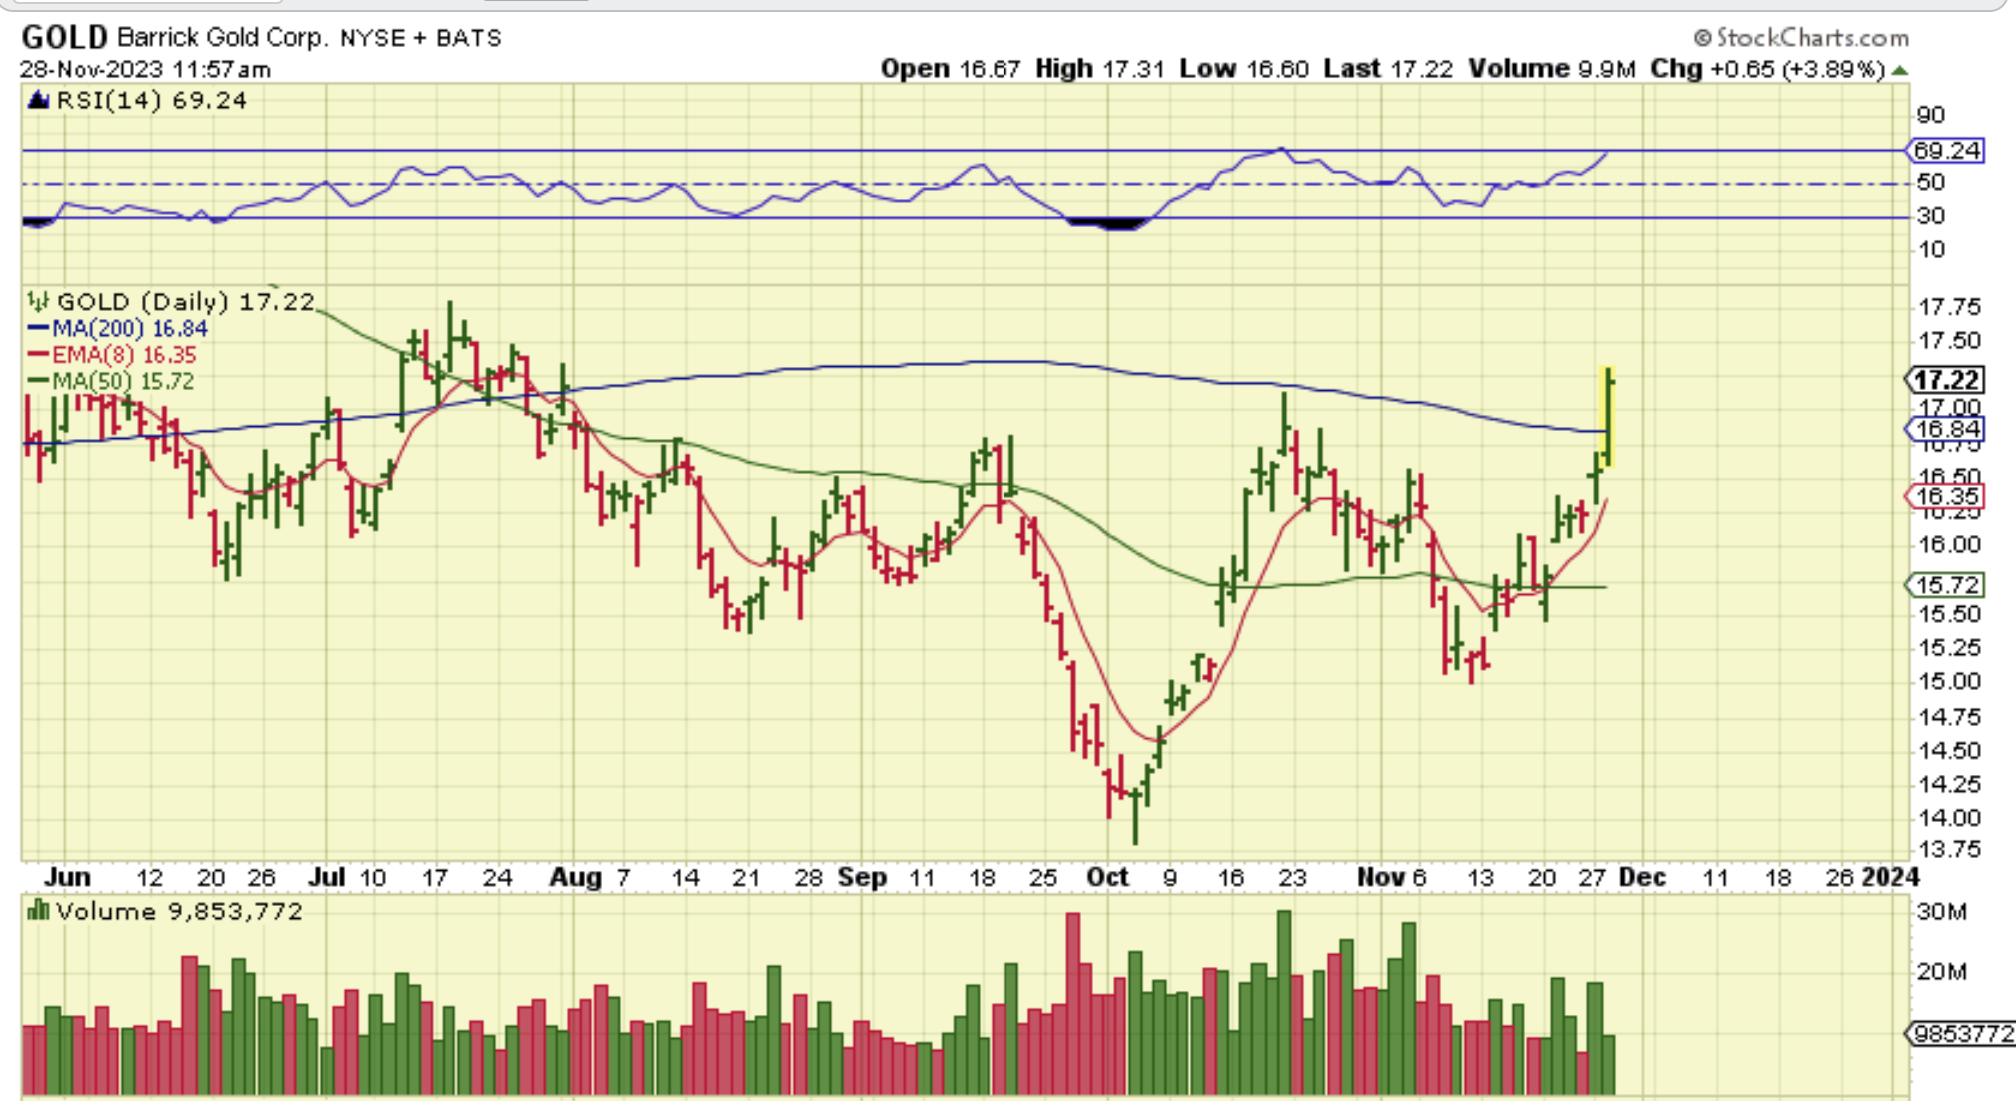
I grabbed this chart of BARRICK midday, because I had been saying that we needed NEM and BARRICK to get moving to help the GDX. This was that move unfolding.
.
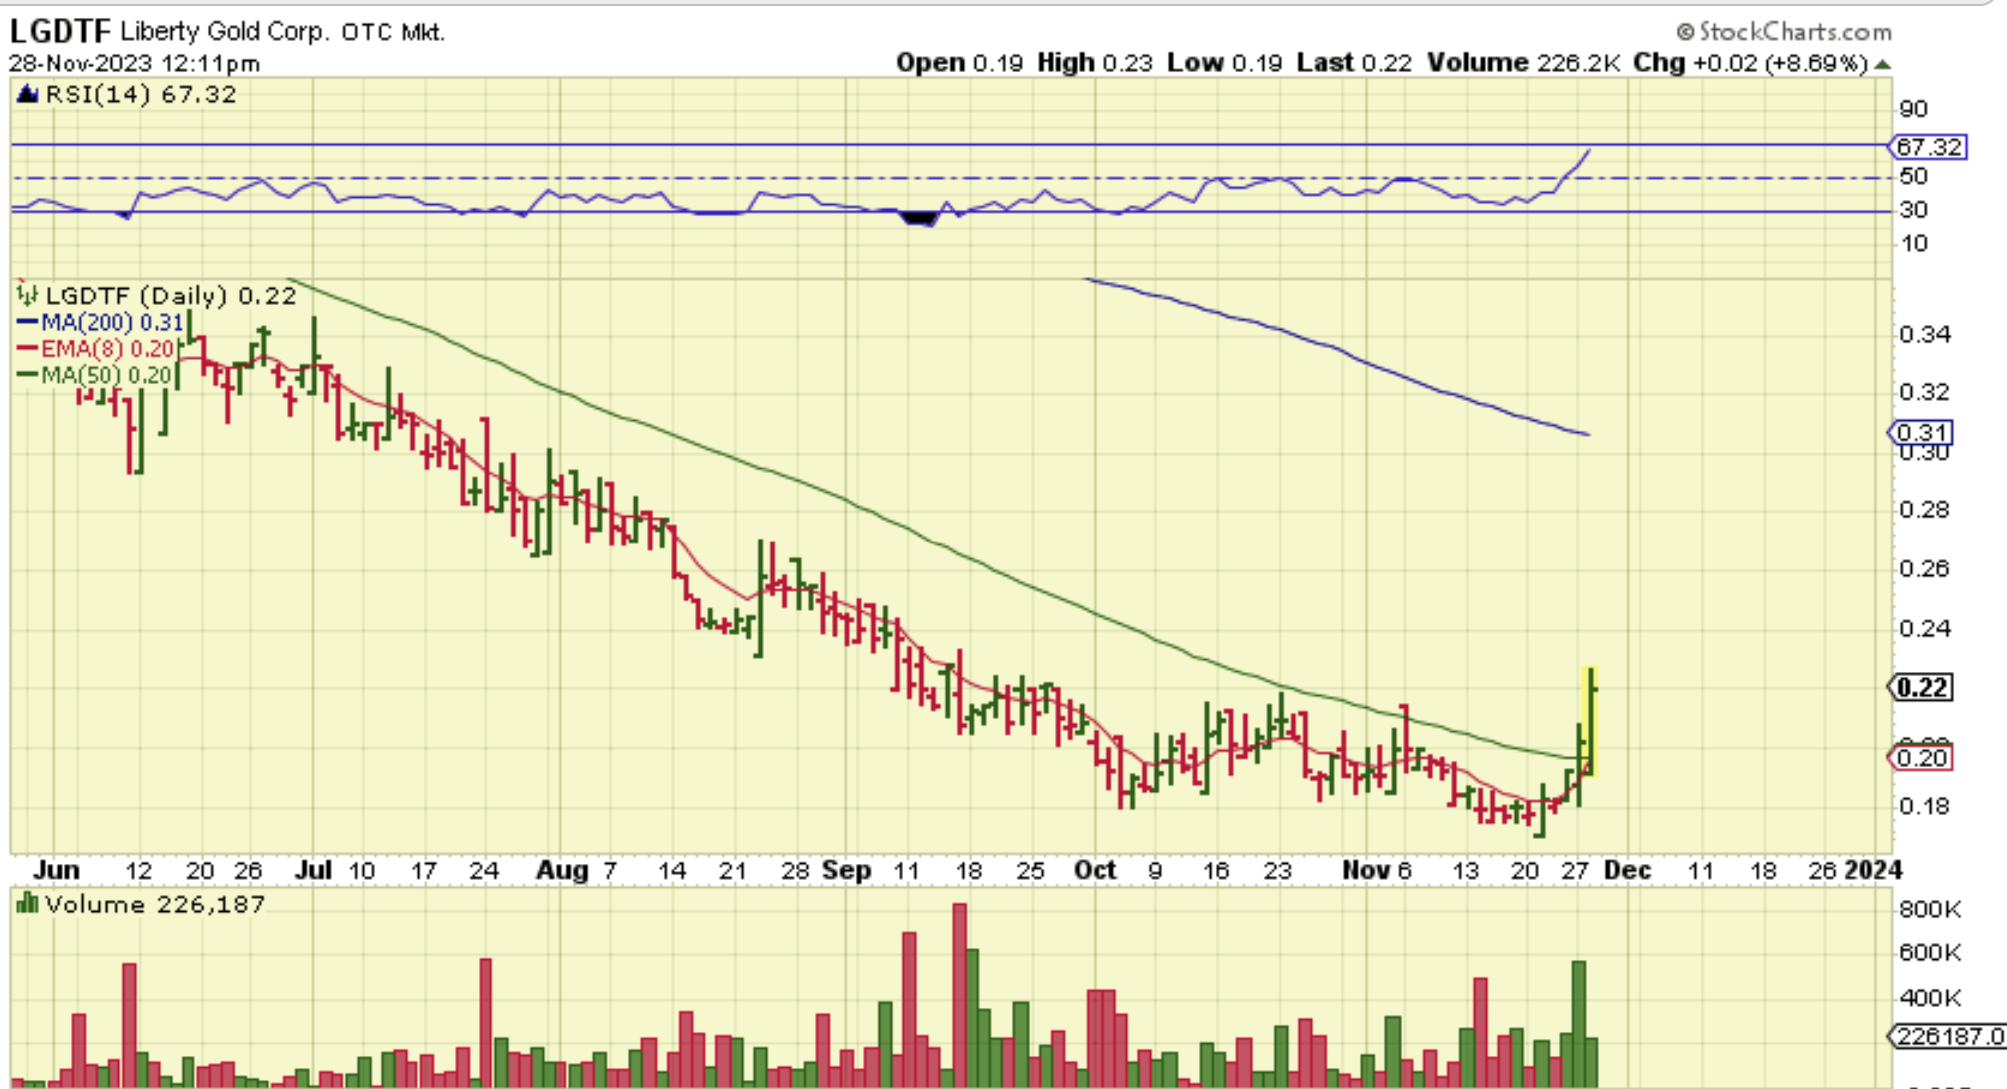
I have been pointing out that finally many of those ‘lagging juniors and explorers’ that are still near the bottom have been rising up off of the lows now too. LGDTF has actually had a pretty nice 5 day move, and it may just be getting started.
.
What an excellent day Tuesday was! Now we just have to see if we get the follow through run higher non-stop, or do we see a pause like I drew in the GDX Chart, before a continuation? Time will tell, but this is playing out exactly as hoped for with yesterdays surge above the 50sma for the GDX and GDXJ. I am still expecting Gold to break out to new all-time highs in the future, so hang on for the ride, and we’ll buy the dips if we get them. Enjoy your Wednesday trading!
.
~ALEX
.
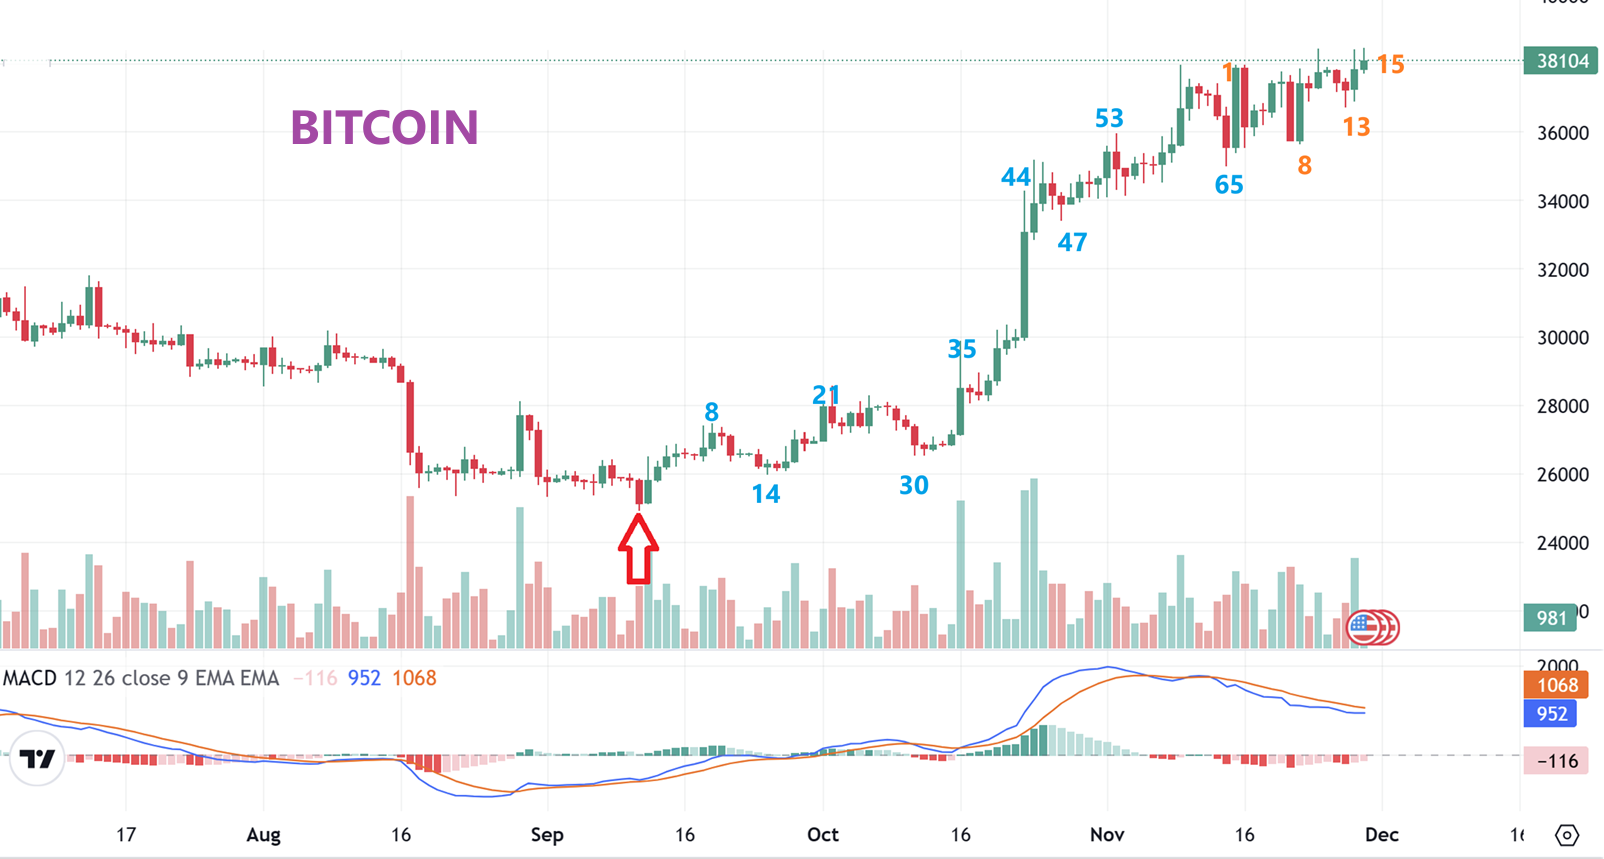
BITCOIN -In a recent report I discussed that the ICL looks to be in place and I have been saying for a couple of weeks that Crypto Miners are now bullish bases and starting to run. So I want to show that current count that you would see using 30 days or 60 days ( I use 30 as a 1/2 cycle dip, and roughly 60 days for a first daily cycle.
With this count we are only on day 15 of 60. That tiny move yesterday caused many Crypto stocks that we have discussed to launch.
.
I have mentioned buying & Holding a basket of Miners like MARA, RIOT, BTBT, CLSK, etc over the past couple of weeks. Well, This is a ‘Bitcoin Miners ETF’ that ‘Toastman’ mentioned in the comments. I have not traded it, but it looks fairly safe and the chart actually looks just like a few of the miners. Note: IT does have Big swings too, so for those that hate risk or volatility or big swings…you may wish to avoid this.
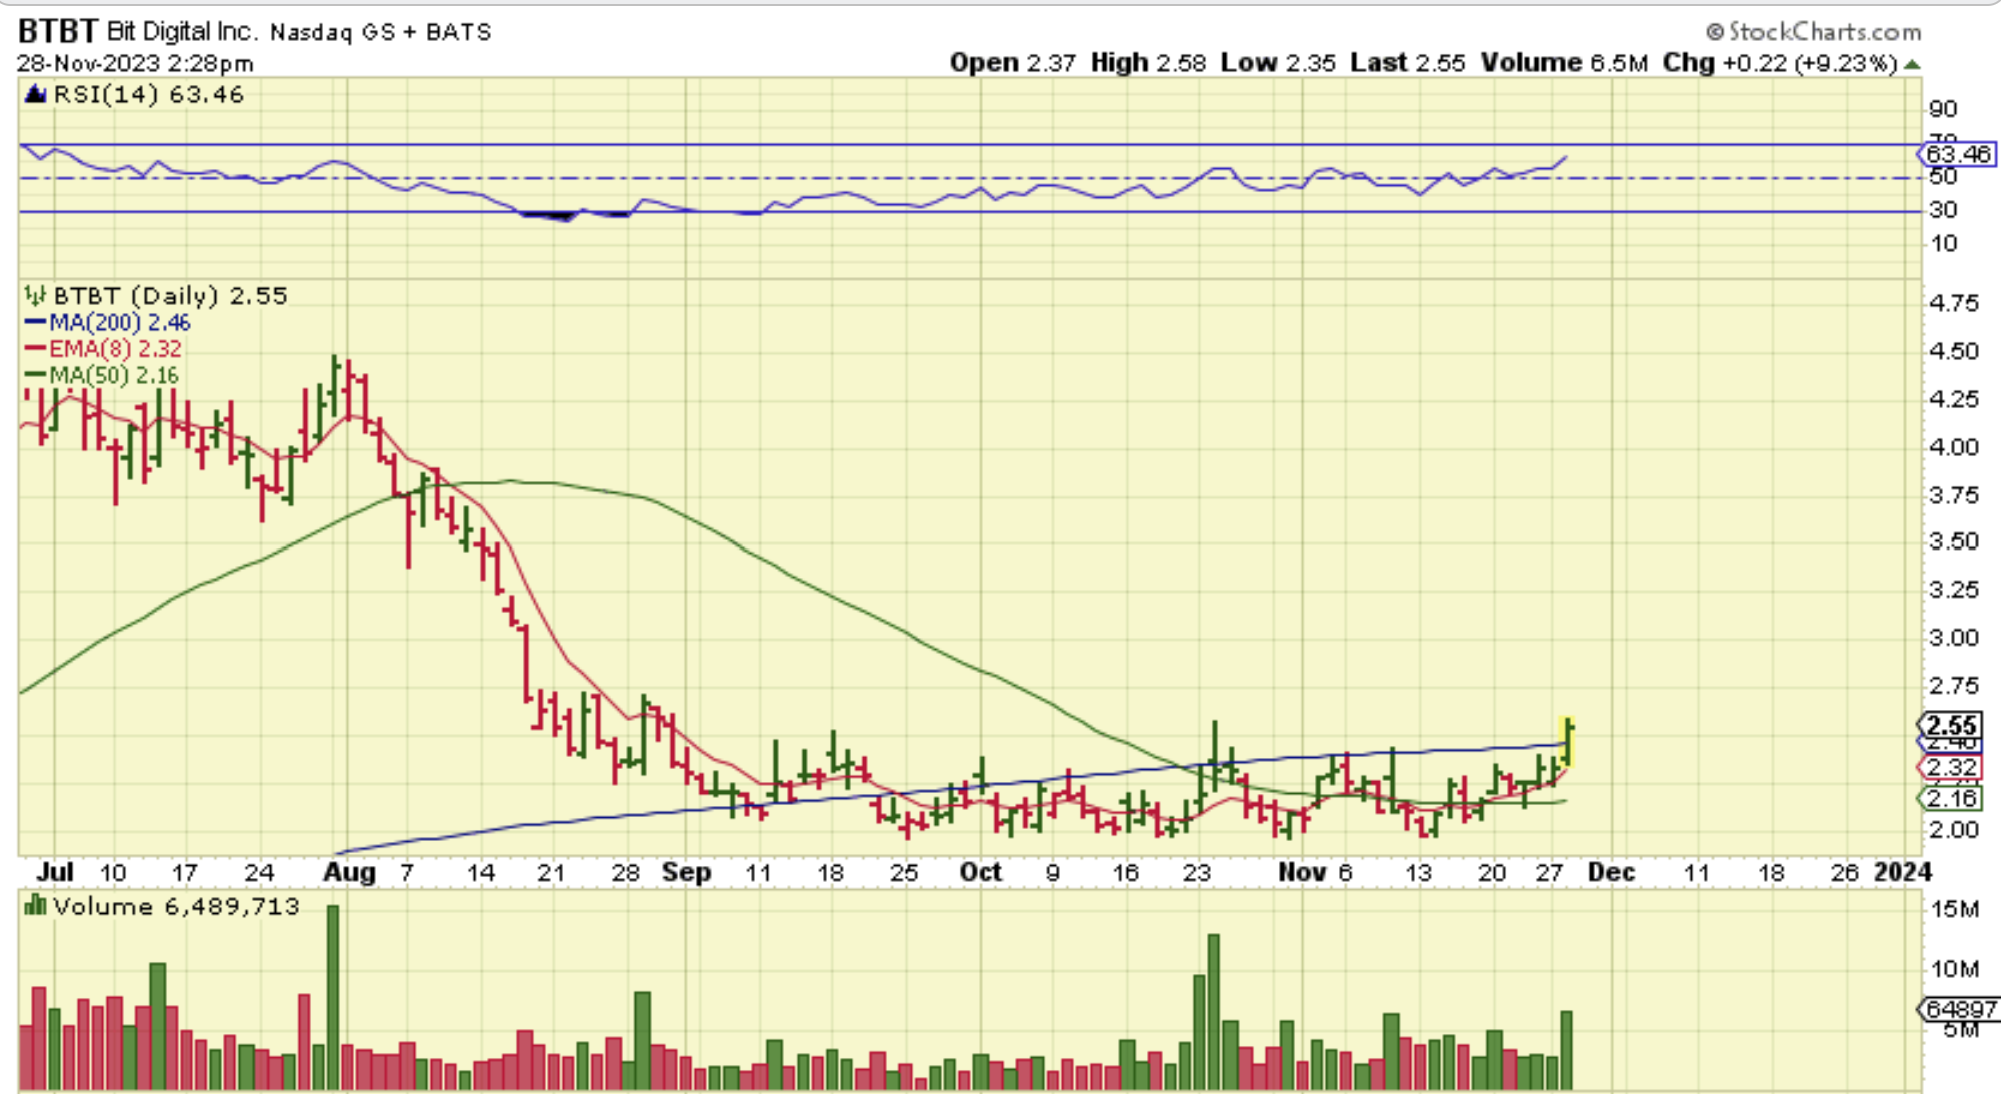
WGMI – I was surprised at how this chart looks exactly like BTBT and a couple of others charts. Look at the 50 & 200sma here, and then we’ll look at BTBT.
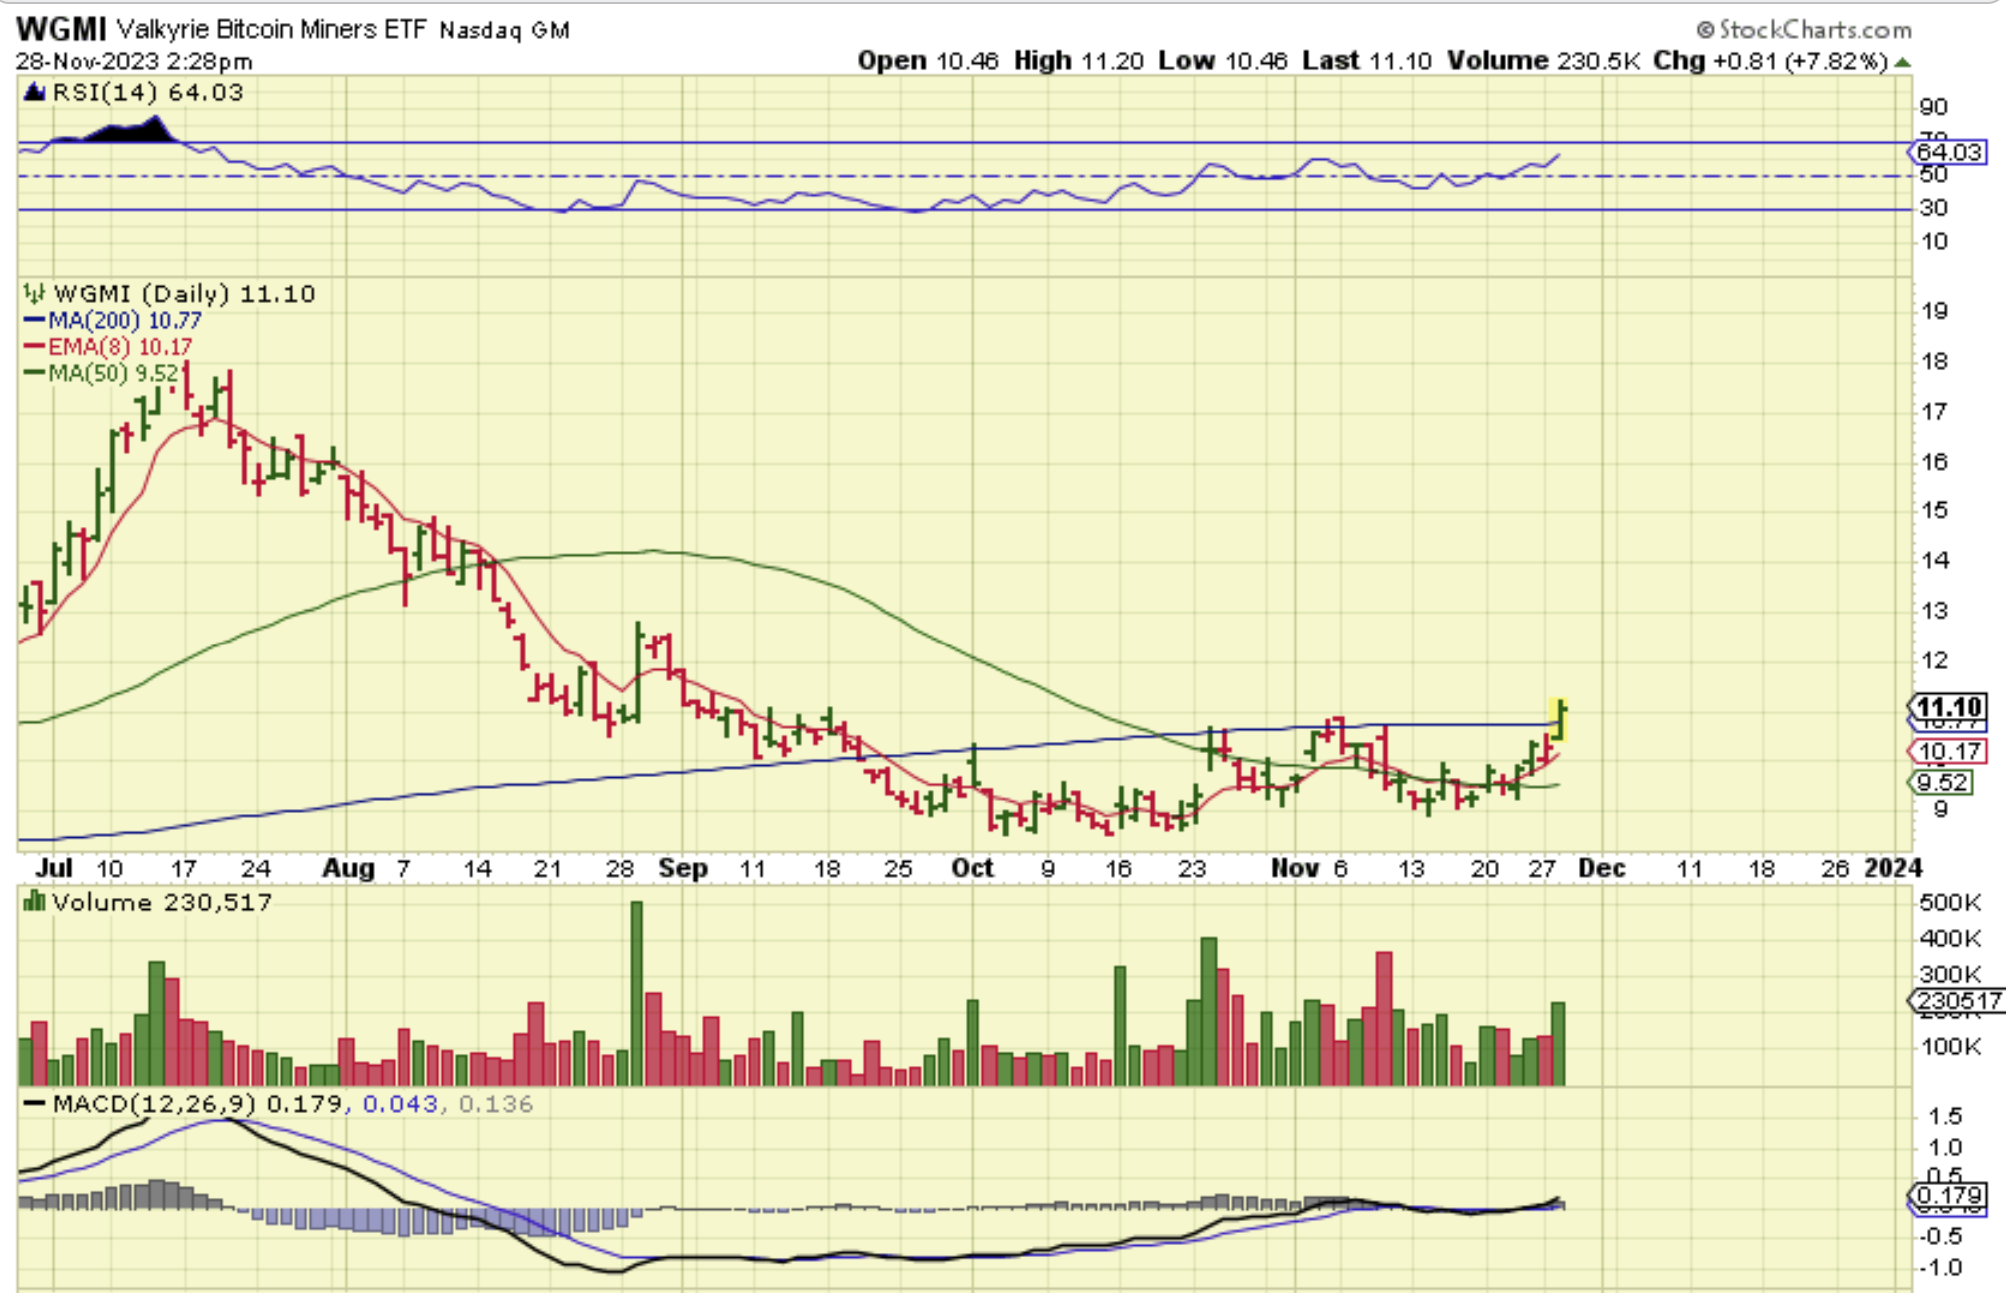
BTBT – Is like the twin of WGMI. Others look like this too and they are bullish, so buy the etf or buy a basket and you may do very well if these are ready to run ( & I Think that they are).
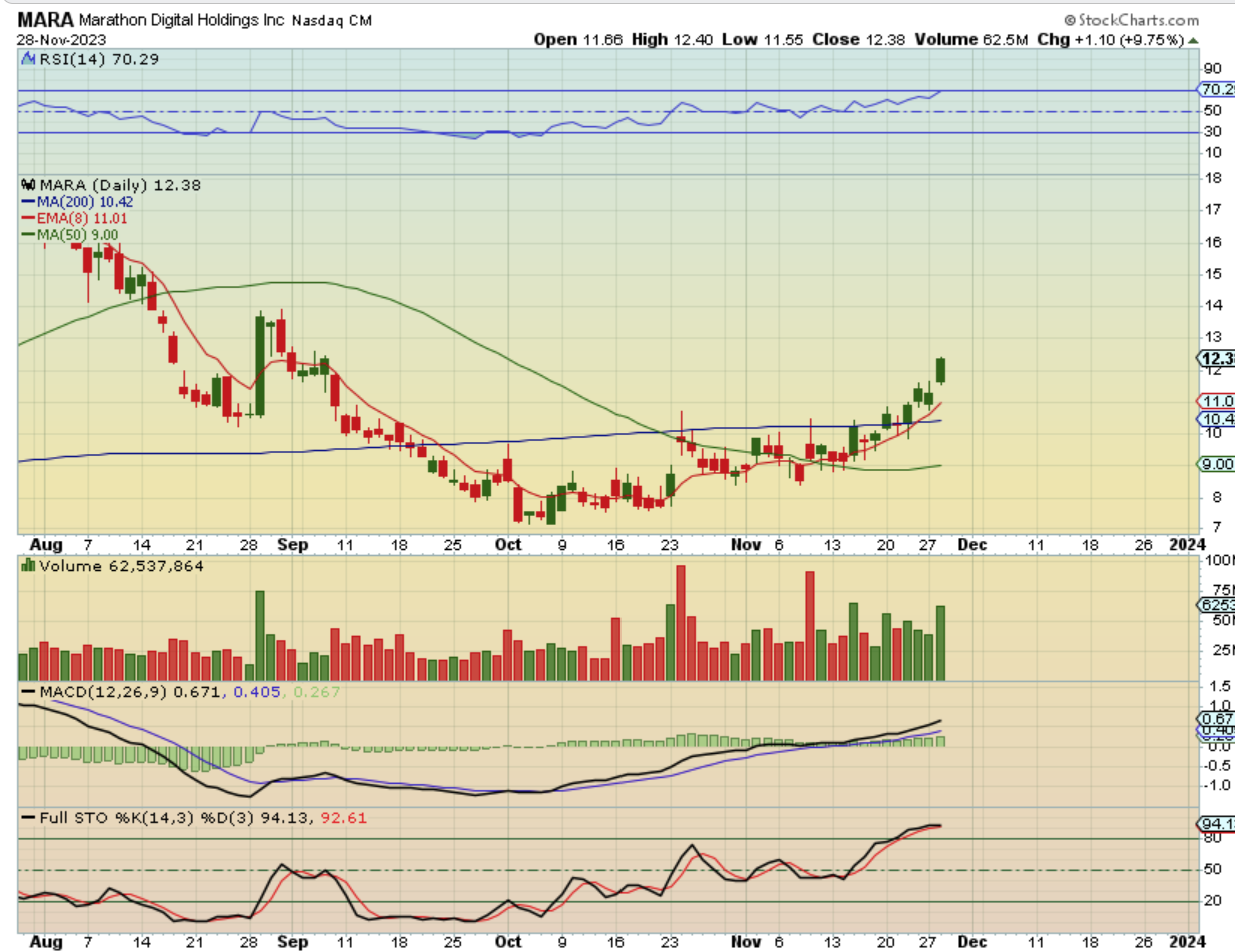
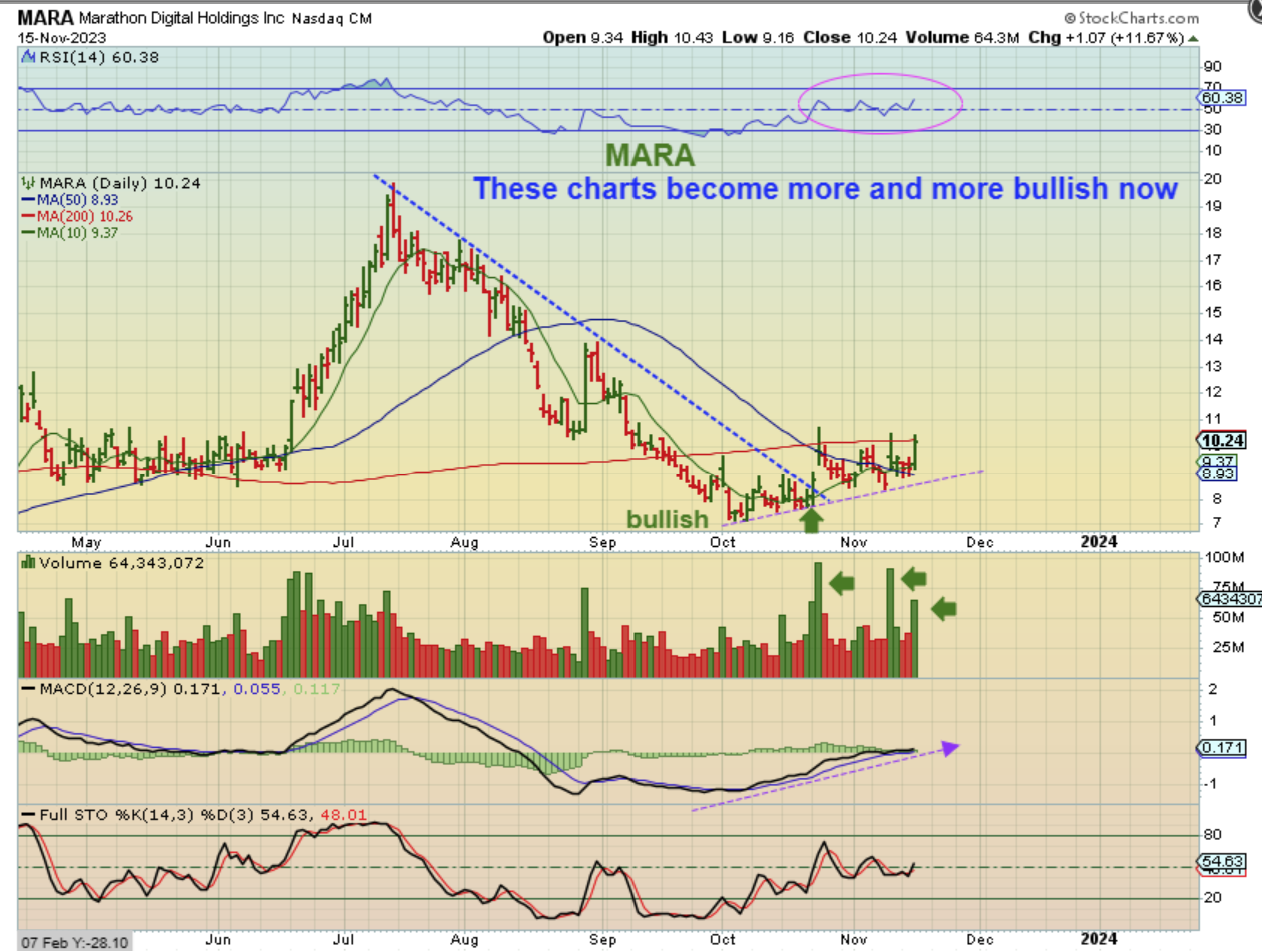
I have been mentioning these bases and saying to buy a basket or a few like MARA, RIOT, CLSK, IREN, etc.
This was MARA on Nov 15 pushing with volume against the 200sma. Still a buy in the $10 area.
Roughly a week later, still a buy, still acting bullishly.
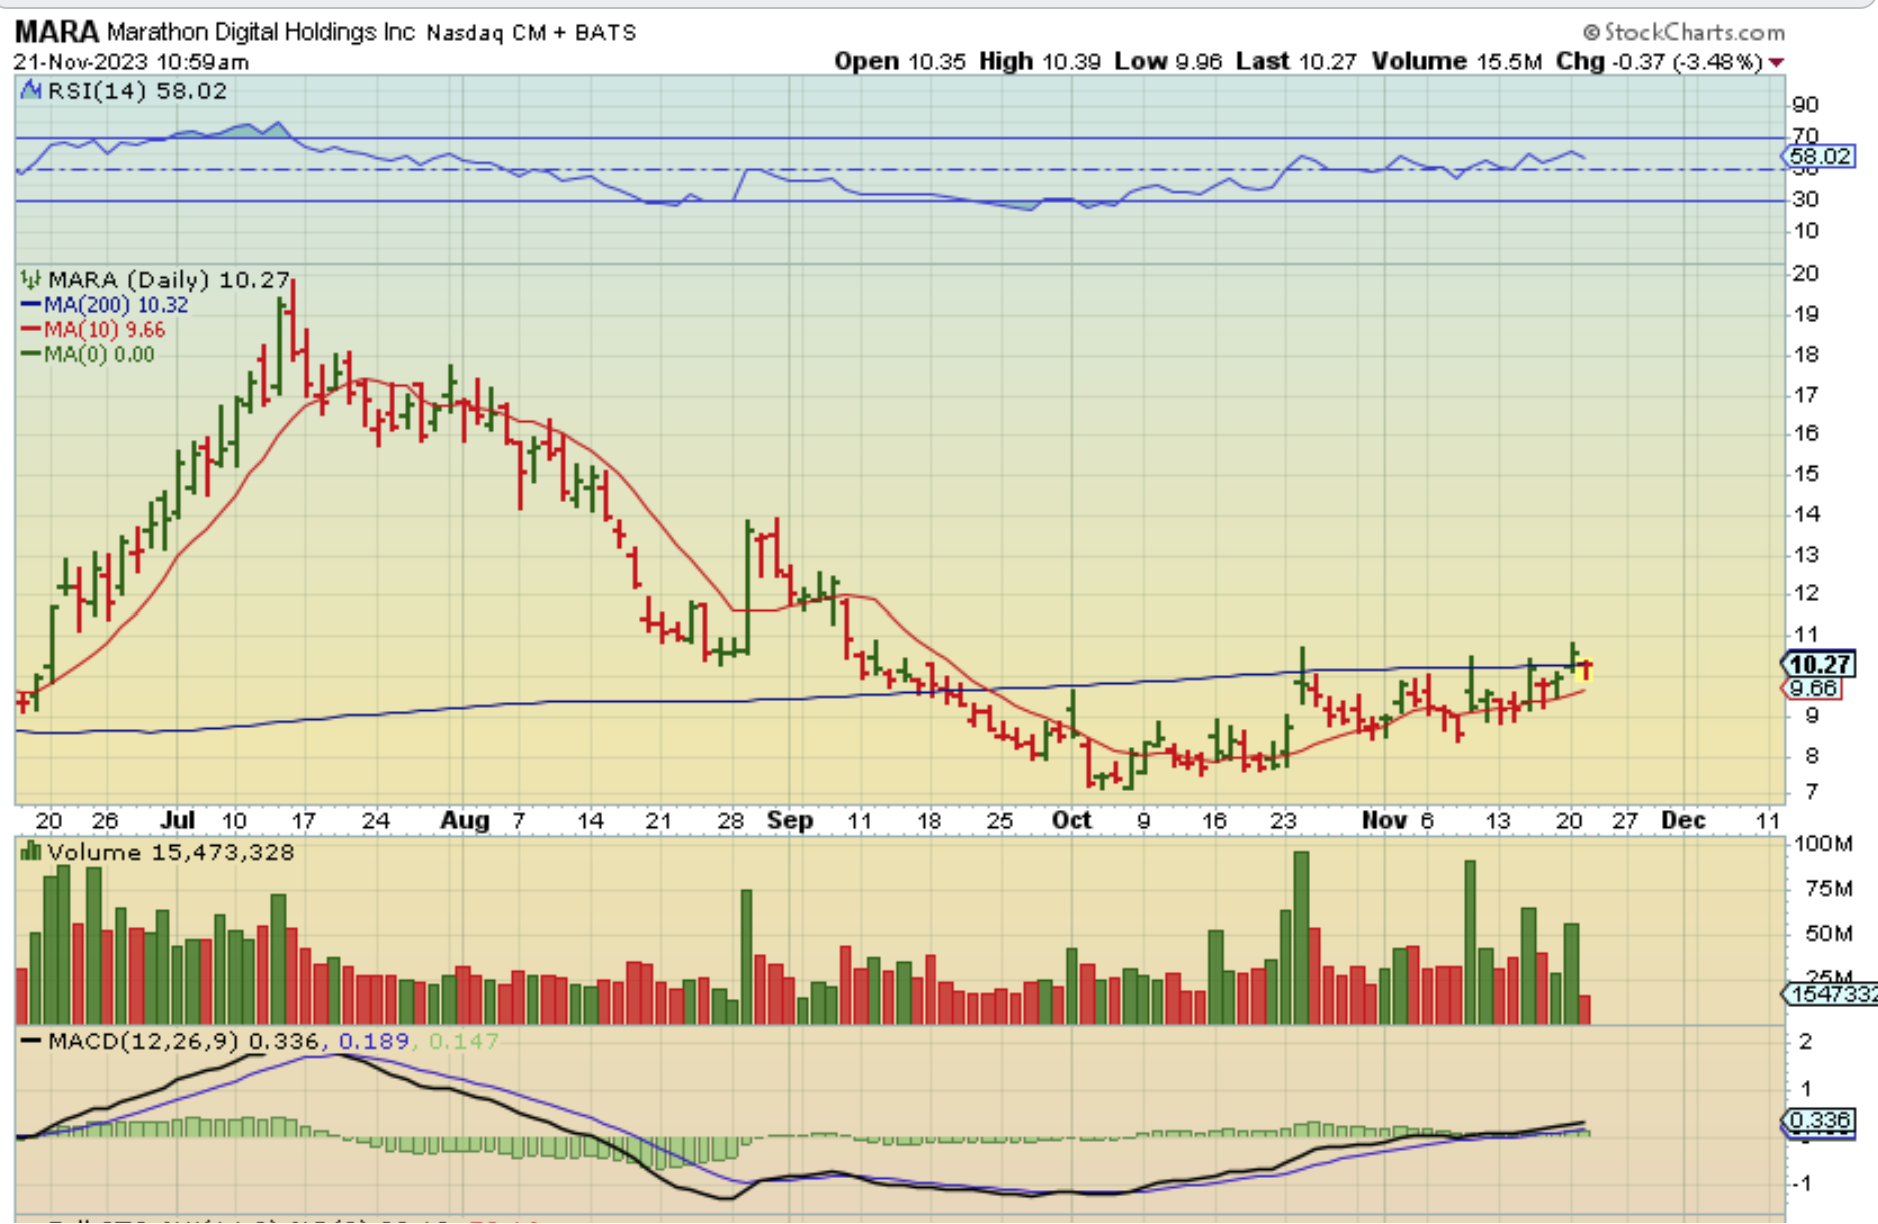
,
MARA, RIOT, IREN, CLSK, etc ran yesterday – If Bitcoin is going higher, these should continue higher too. MARA is now at $12.38 and these look to be starting a run.