Wednesday November 15th
.
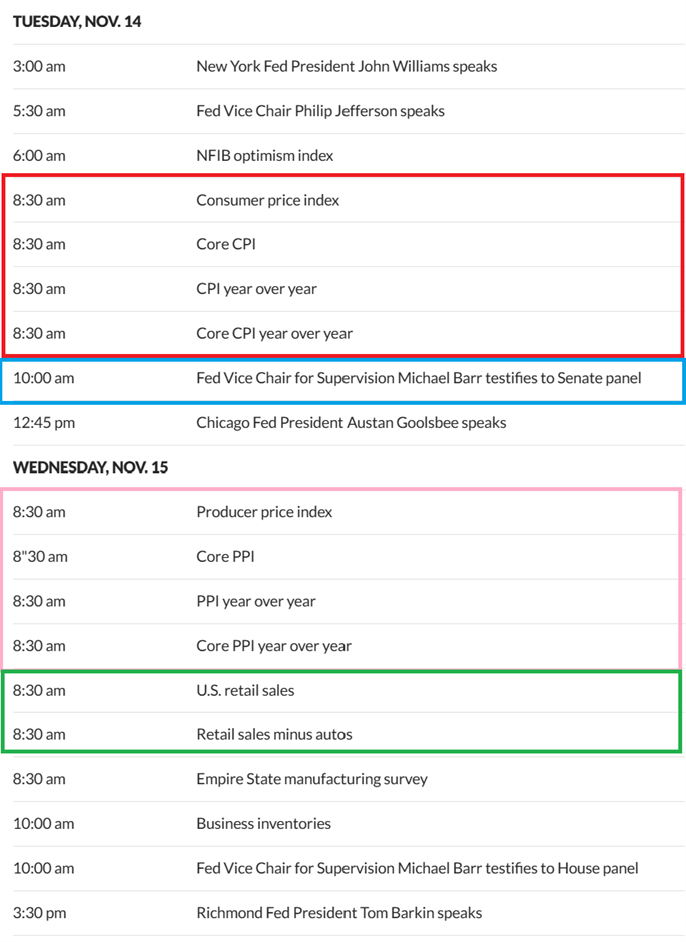
Yesterday I mentioned that we had some Economic Data that could move the markets, as seen on this schedule. I said that The CPI is related to inflation and that could affect Precious Metals and The General Markets, since the Fed uses those numbers to gauge the need for future interest rate hikes. 8:30 am ET is the time to watch the futures for any changes. Well, The markets took off higher very quickly and they just kept on running in pre-market hours. Both sectors gapped open higher at the open too. As you can see, today is the PPI, which also can affect the markets in a similar manner, and push things even higher. I won’t be surprised if the opposite happens, because a dip after a big gap open is always a possibility, but these markets launched yesterday and we could very well see follow through today. A dip would be a buying opportunity for sure. Let’s take a look at the charts and discuss the set up.
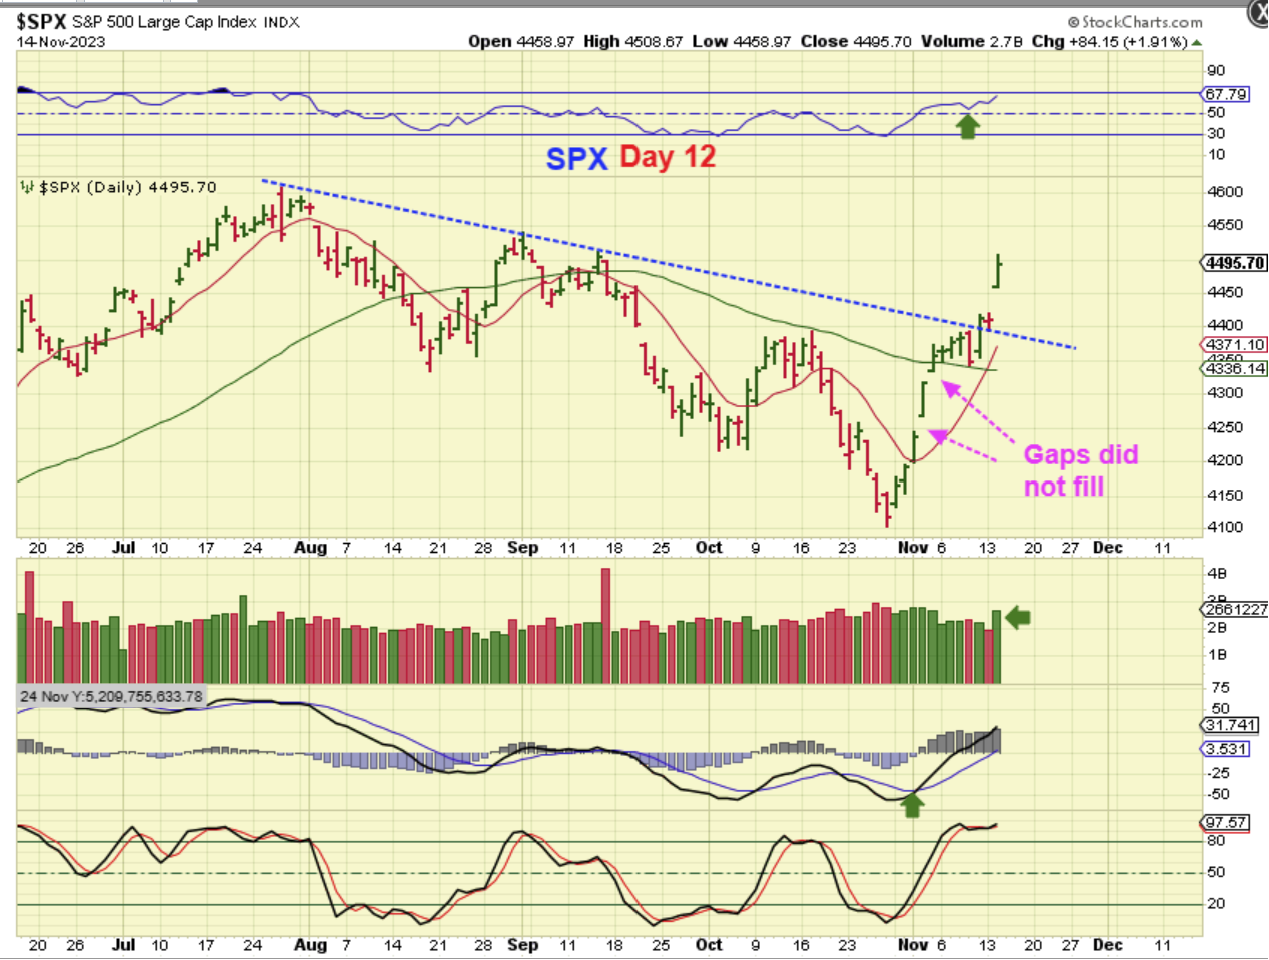
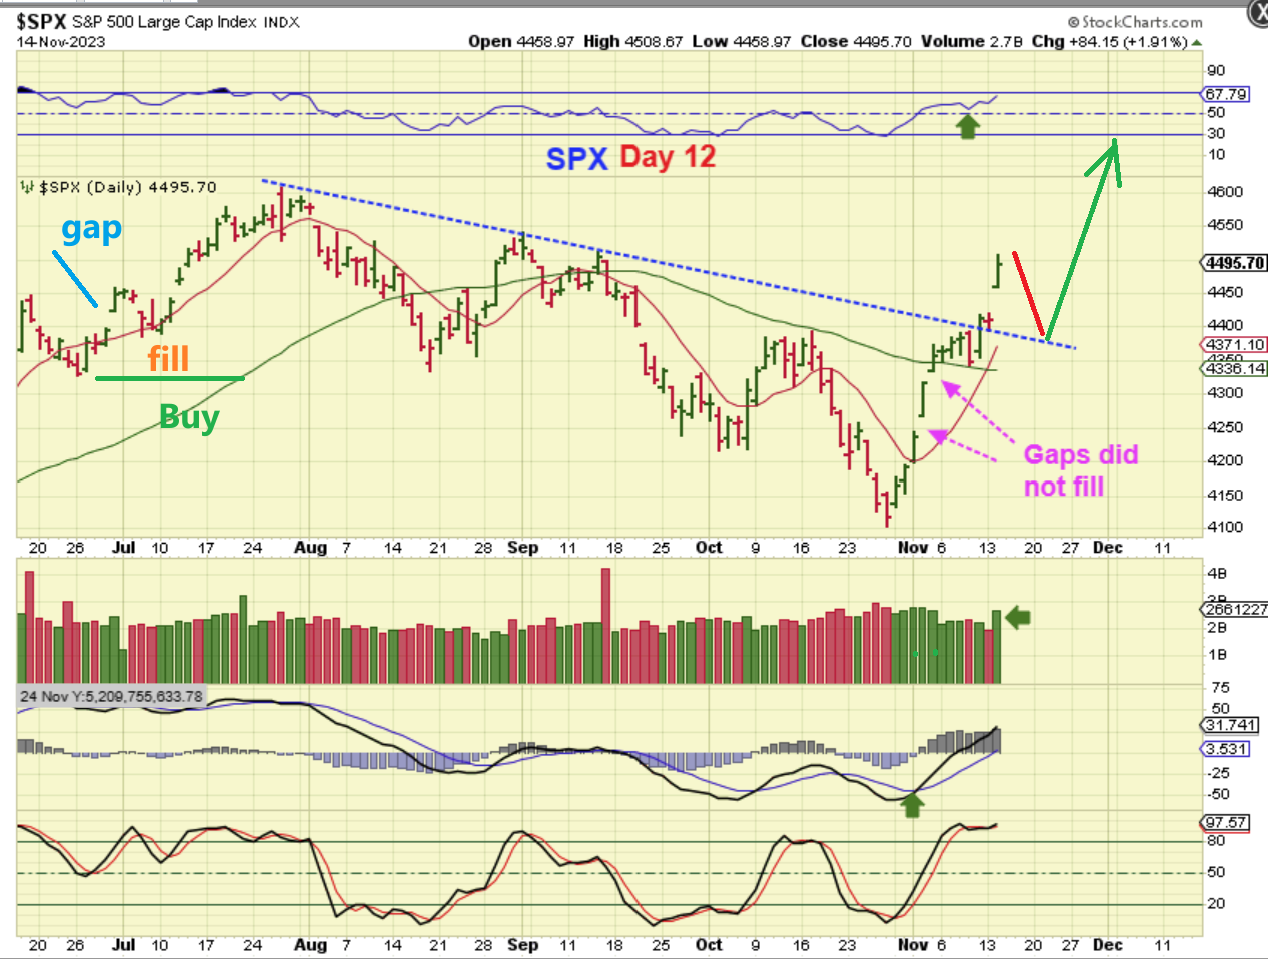
SPX – This is the CPI Market ‘gap open and surge’, and these markets are definitely continuing that strong bull run out of the ICL for the end of 2023. Unfortunately, I cannot tell you exactly what will happen on a day to day bases, so we don’t know exactly what will happen on Wednesday. The gaps that formed the day 4 & 5 surge never closed, right? So this powerful gap may or may not fill either. IF it DOES fill…
.
IF THAT GAP DOES fill, it could be similar to the gap fill in June pointed out on this chart down to the 10sma. That should be a buying opportunity.
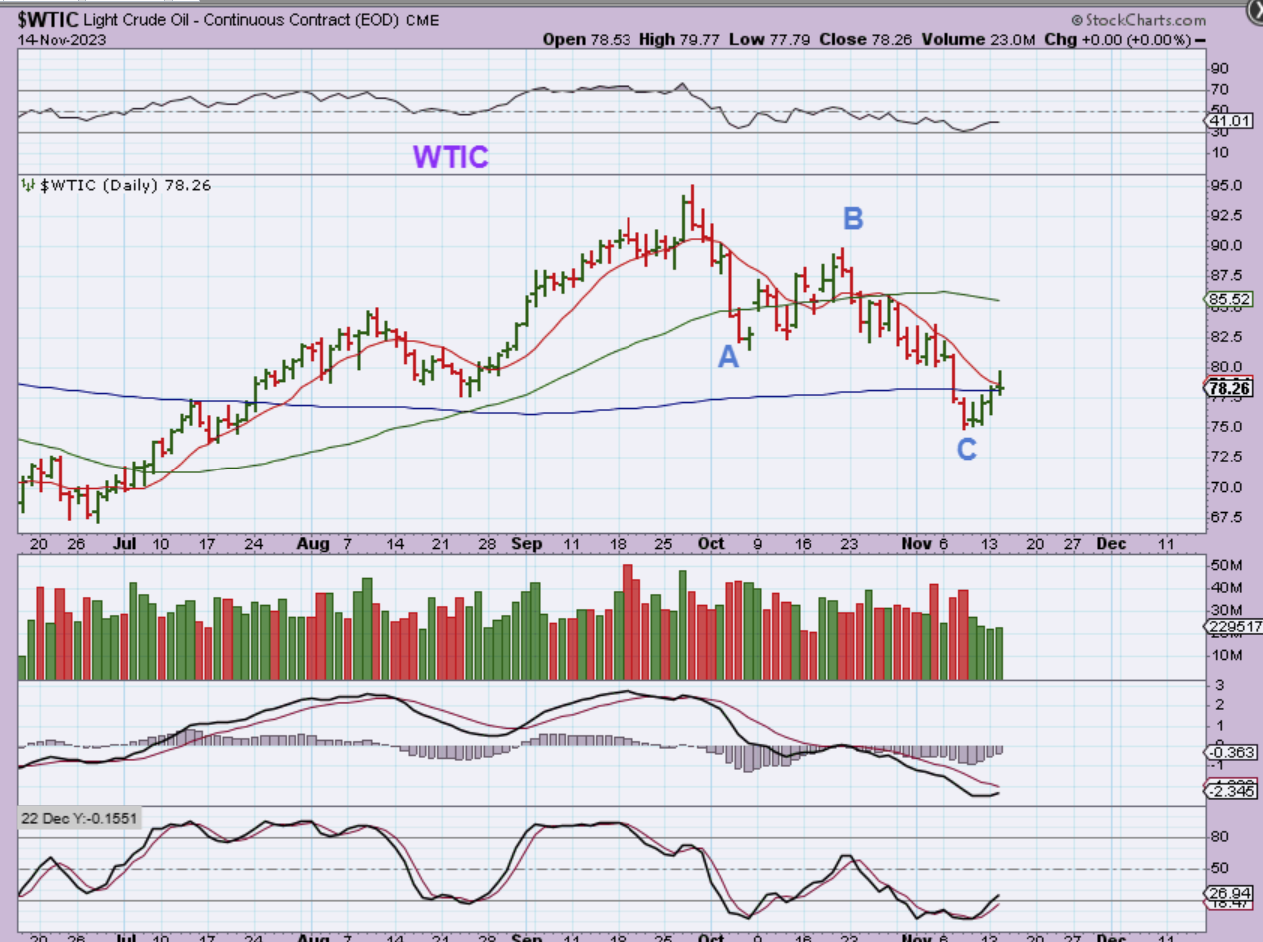
WTIC – Oil popped and dropped, but it is moving above the 10sma to confirm a swing low and DCL, possible ICL.
.
This is what I had in yesterdays report:
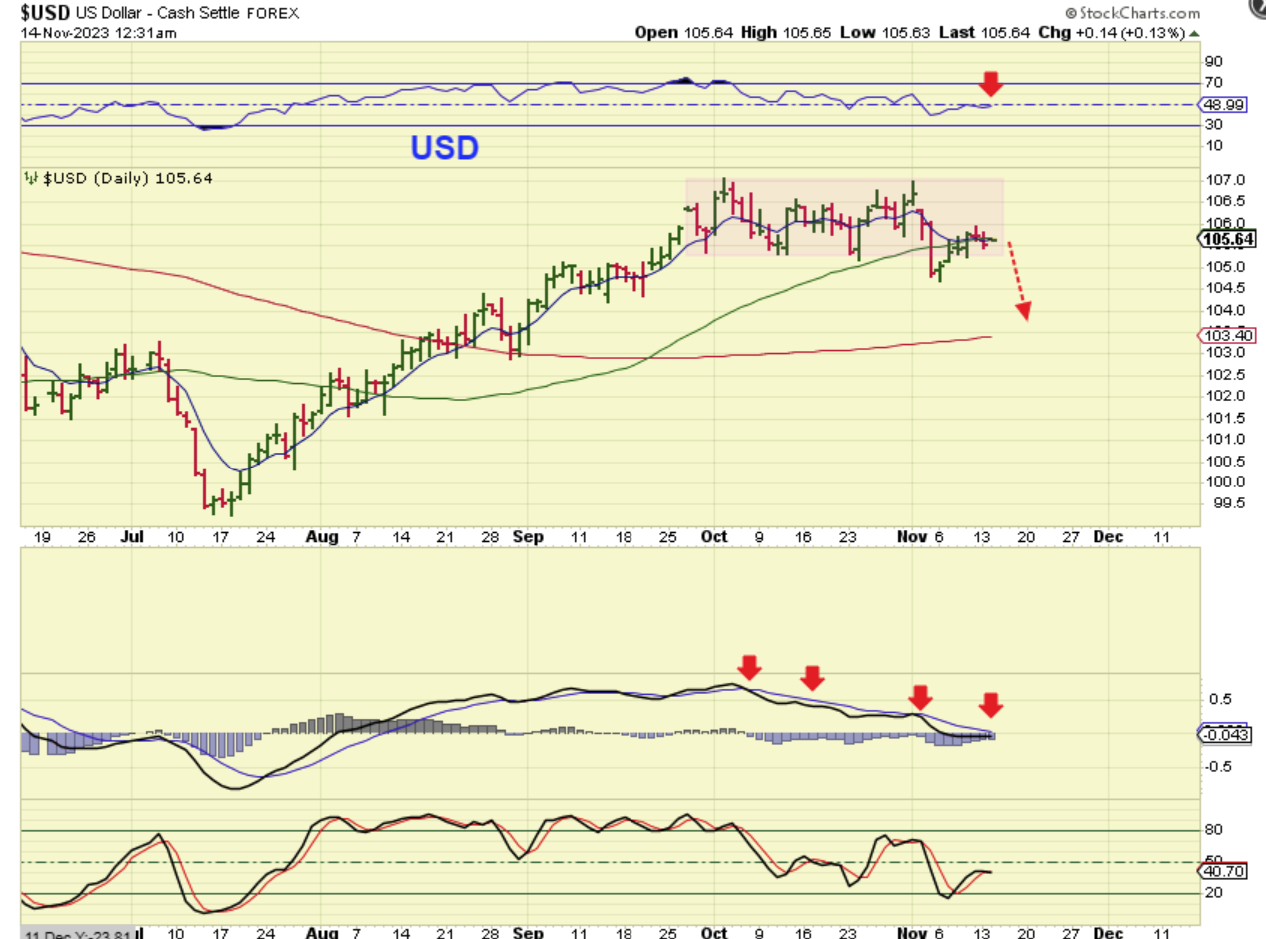
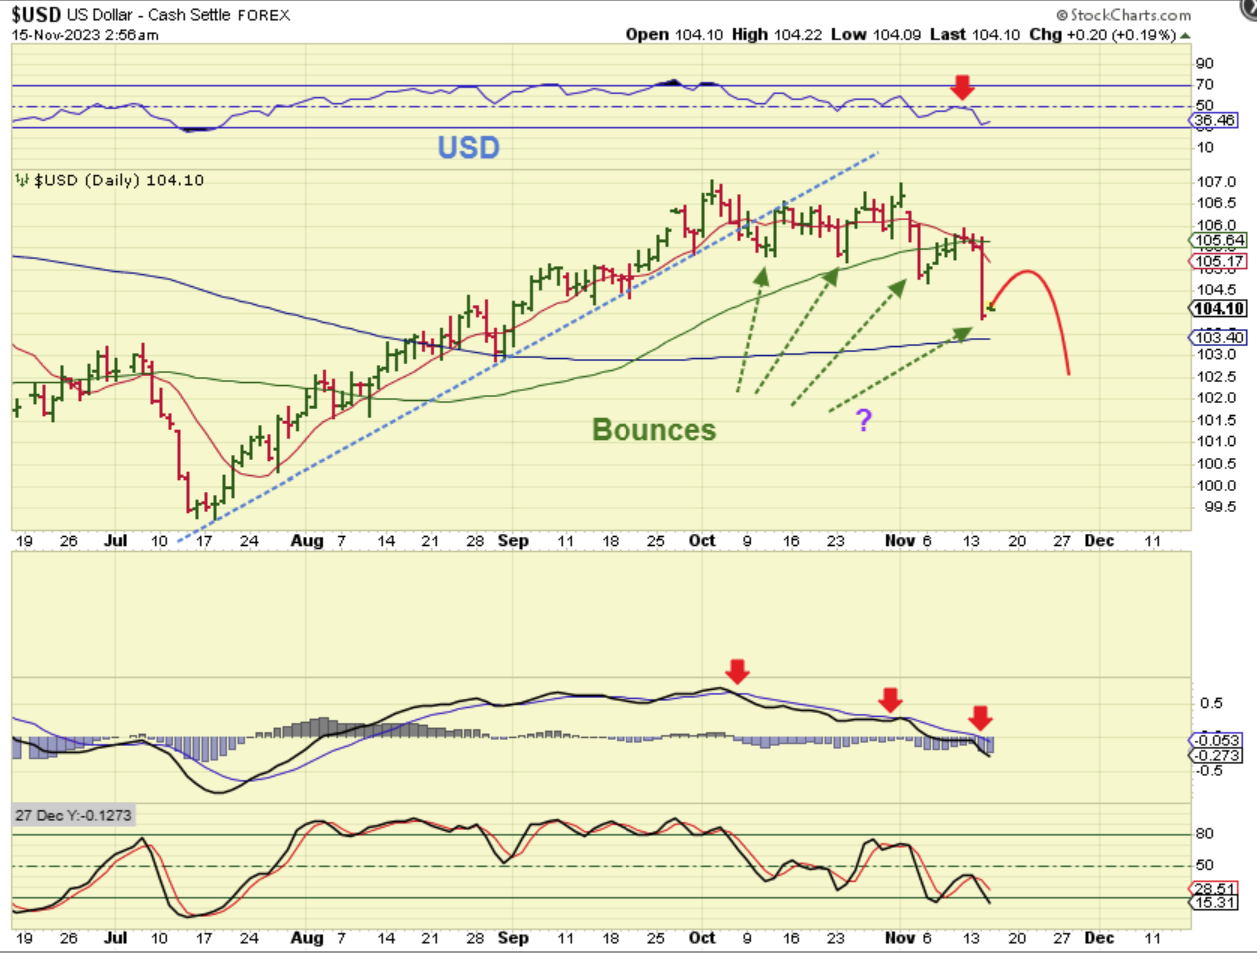
I am still expecting The USD to roll over, and it is chopping sideways at this congestion area and along the 50sma. The MACD remains weak so far.
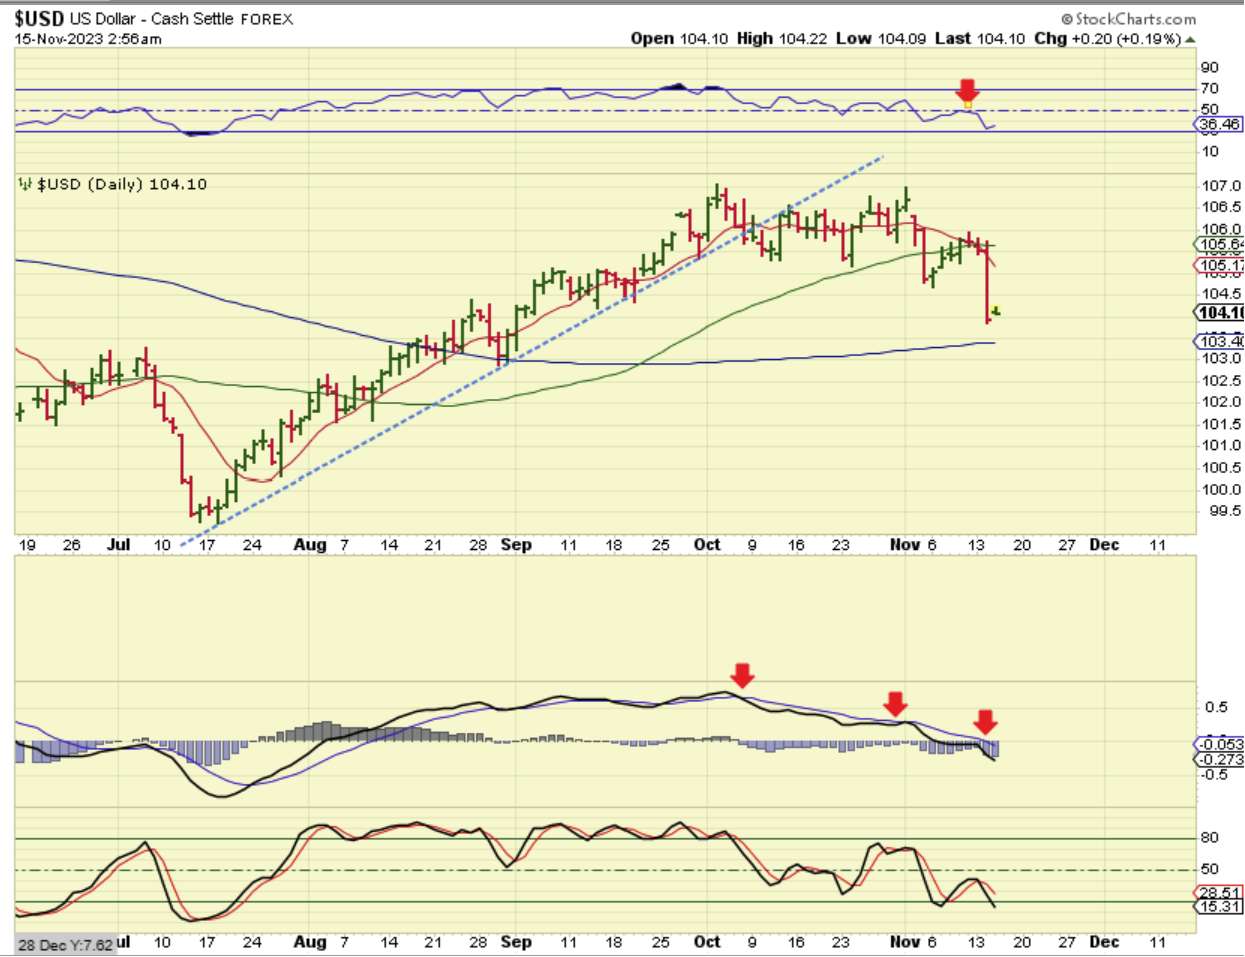
The USD dropped so much that it looks very much like my chart from yesterday. This can just drop further, but what if it bounces because that was such a big 1 day drop? Well…
.
We have been seeing a strong ‘1 day drop and then a slow multiday bounce’, so this looks like a Drop, Bounce, Drop, Bounce, Drop pattern so far. If this bounces Gold could pull back and offer a buying opportunity, but to be honest, I think that at some point Gold is just going to run and leave people behind too.
.
IN THE WEEKEND REPORT:
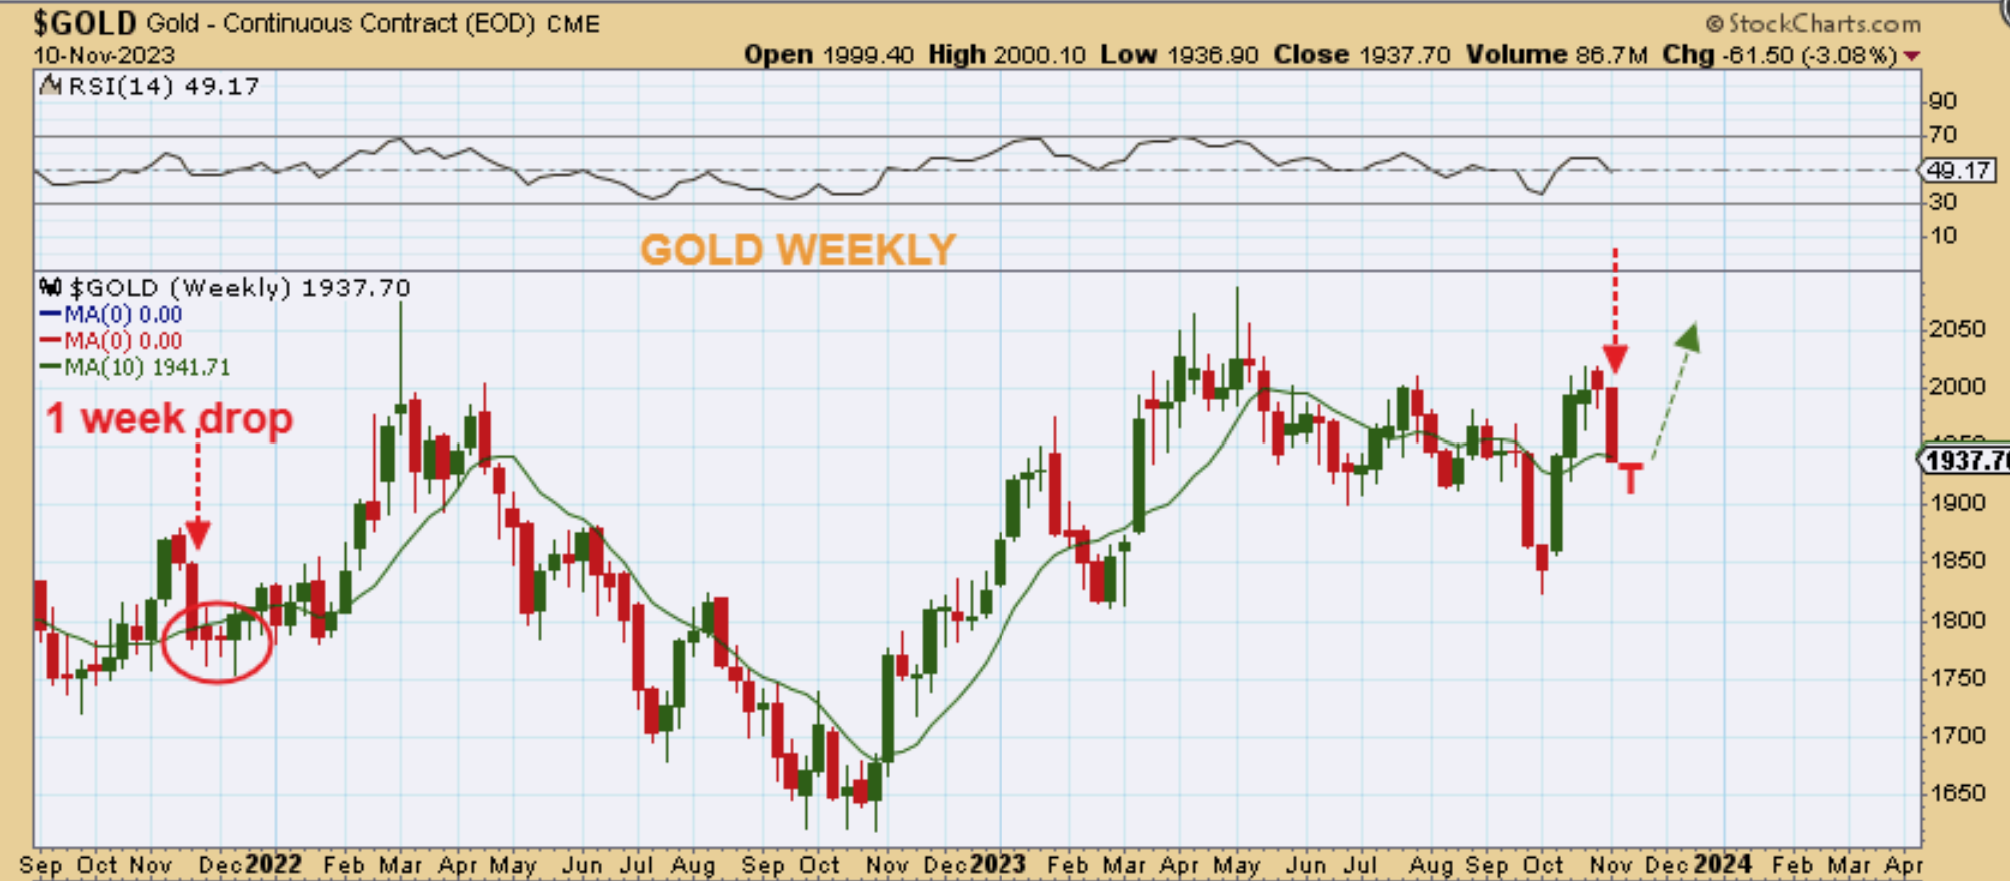
GOLDWEEKLY – I Expected a dcl this week, and you may recall that I drew a ‘T’ bottom, thinking that maybe we’d make a new low this week, but reverse shortly after that. Now ith Monday and Tuesdays trading, that reversal is in place. Lets look…
.
GOLD dropped to back test the 50 & 200sma and I mentioned that as much as we sometimes hate the drop, it is normal price action in a bull run. In fact…
.
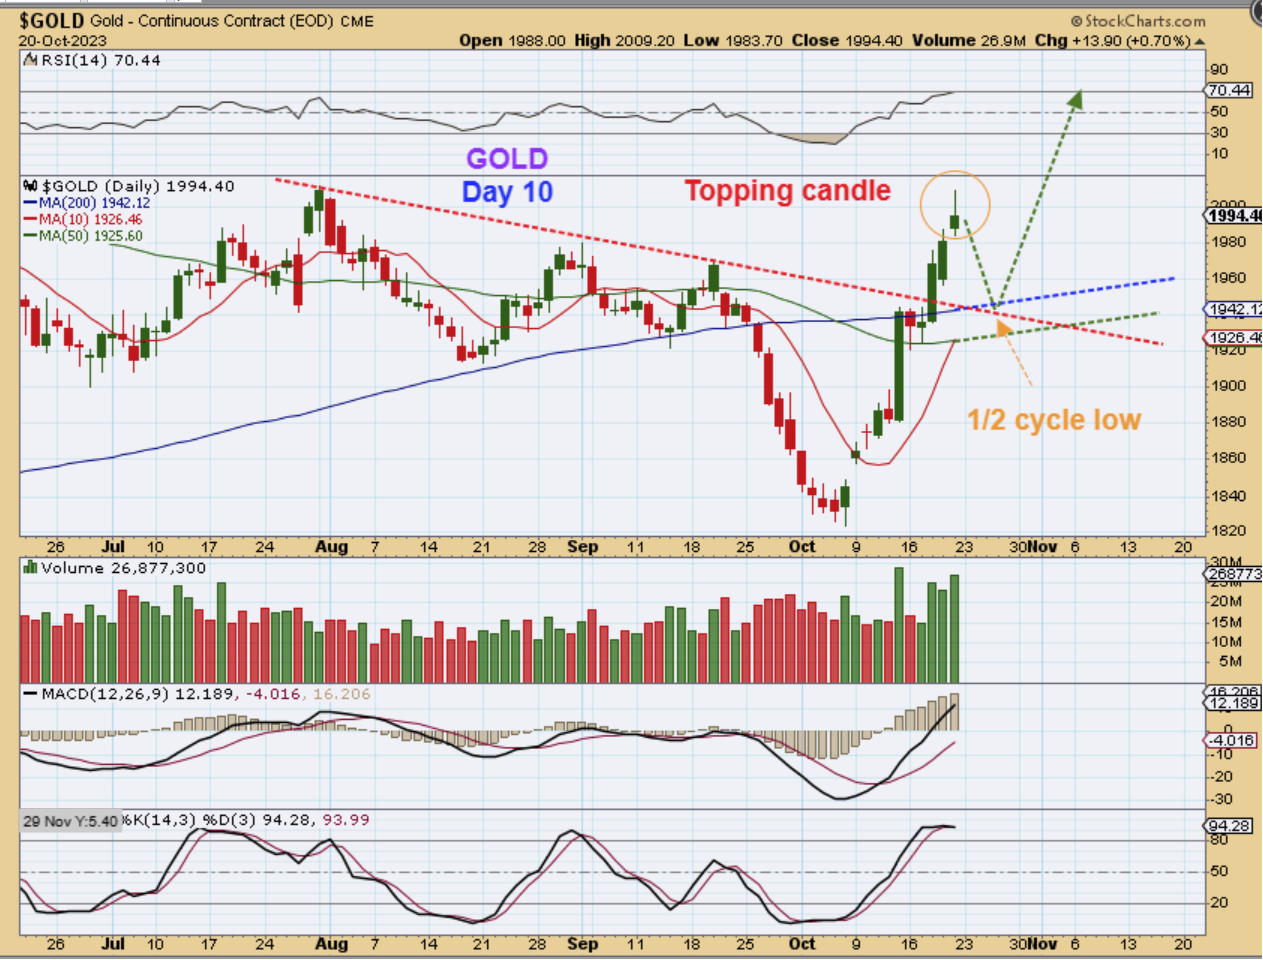
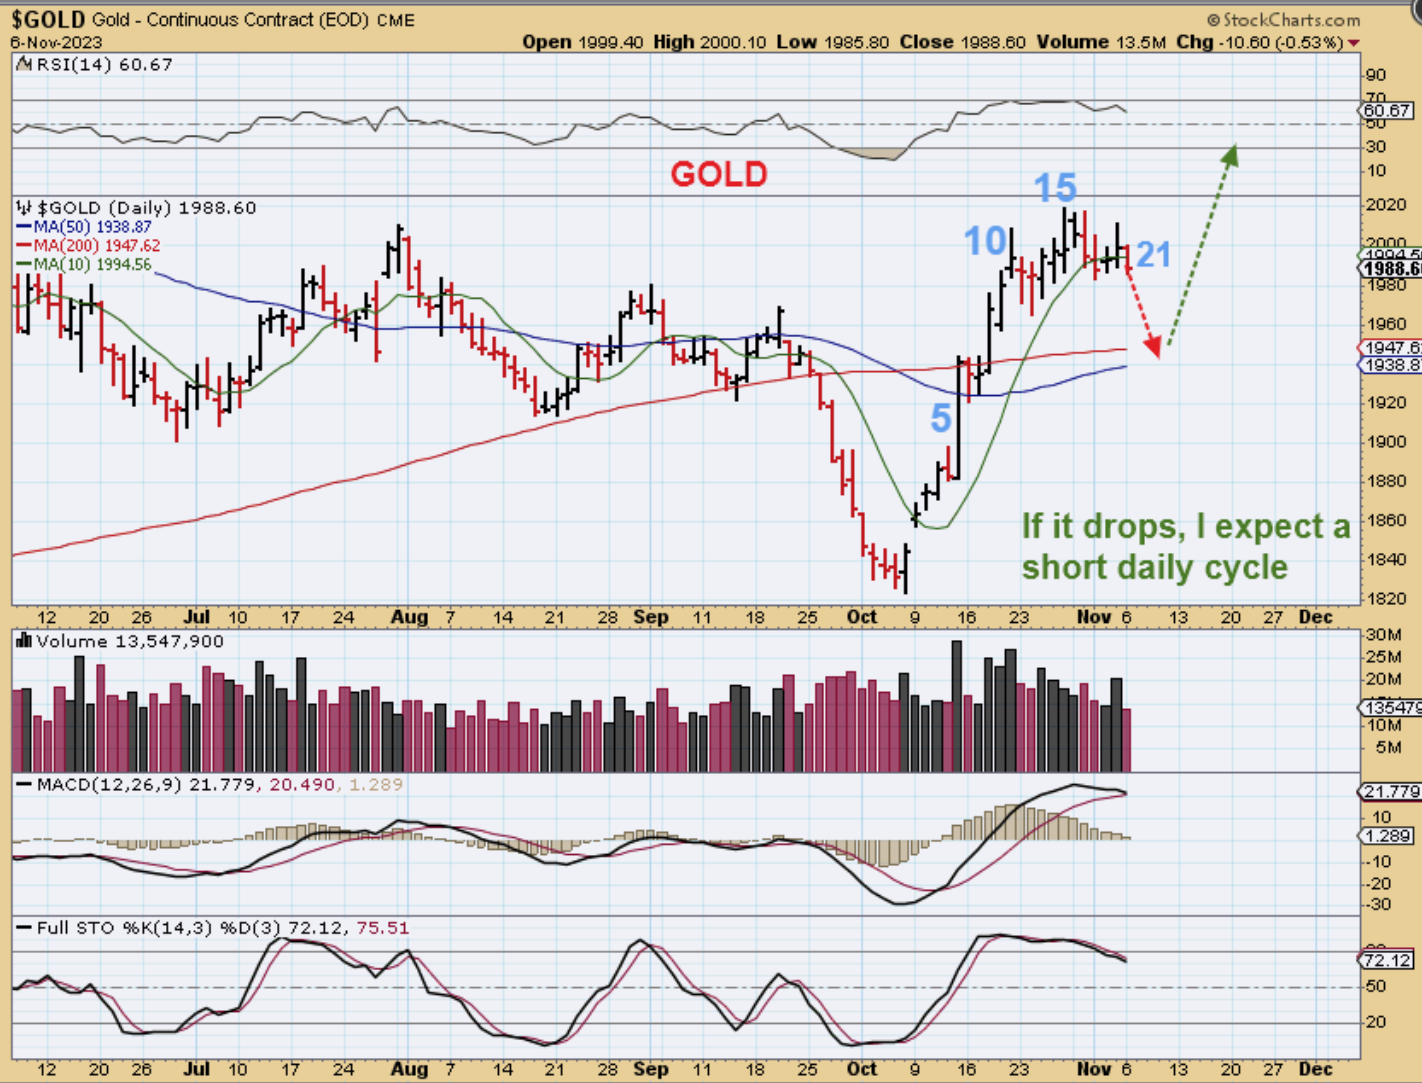
Back in October when Gold was only on Day 10 I mentioned that we could see a drop as a 1/2 cycle low. That is how normal this drop would be using technical analysis. And…
.
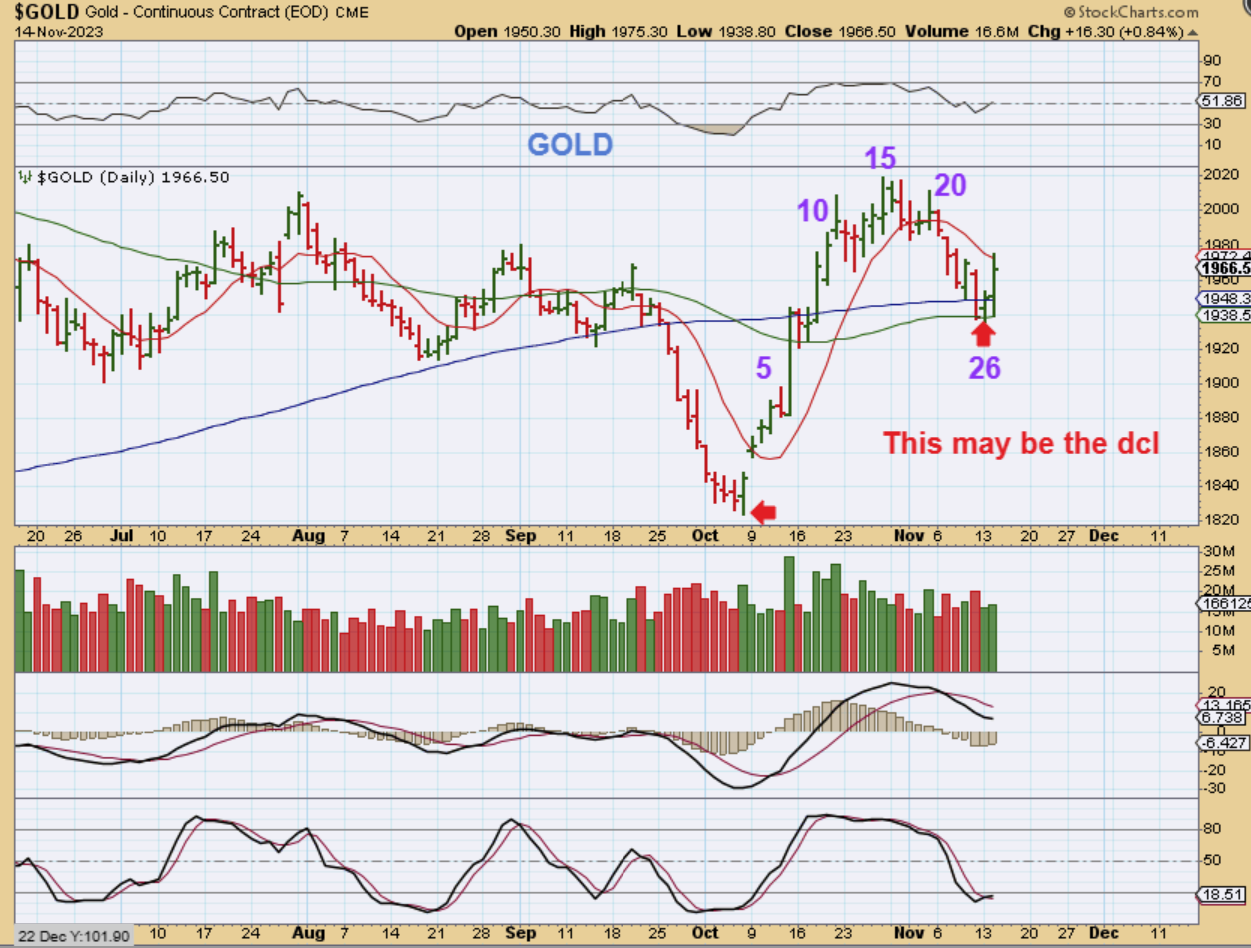
On November 6 so much time had gone by and Gold was still just chopping at the top, so I again mentioned to watch for a dip in this area. I then said on this chart that if we drop now I would expect a short daily cycle. Now we dropped so…
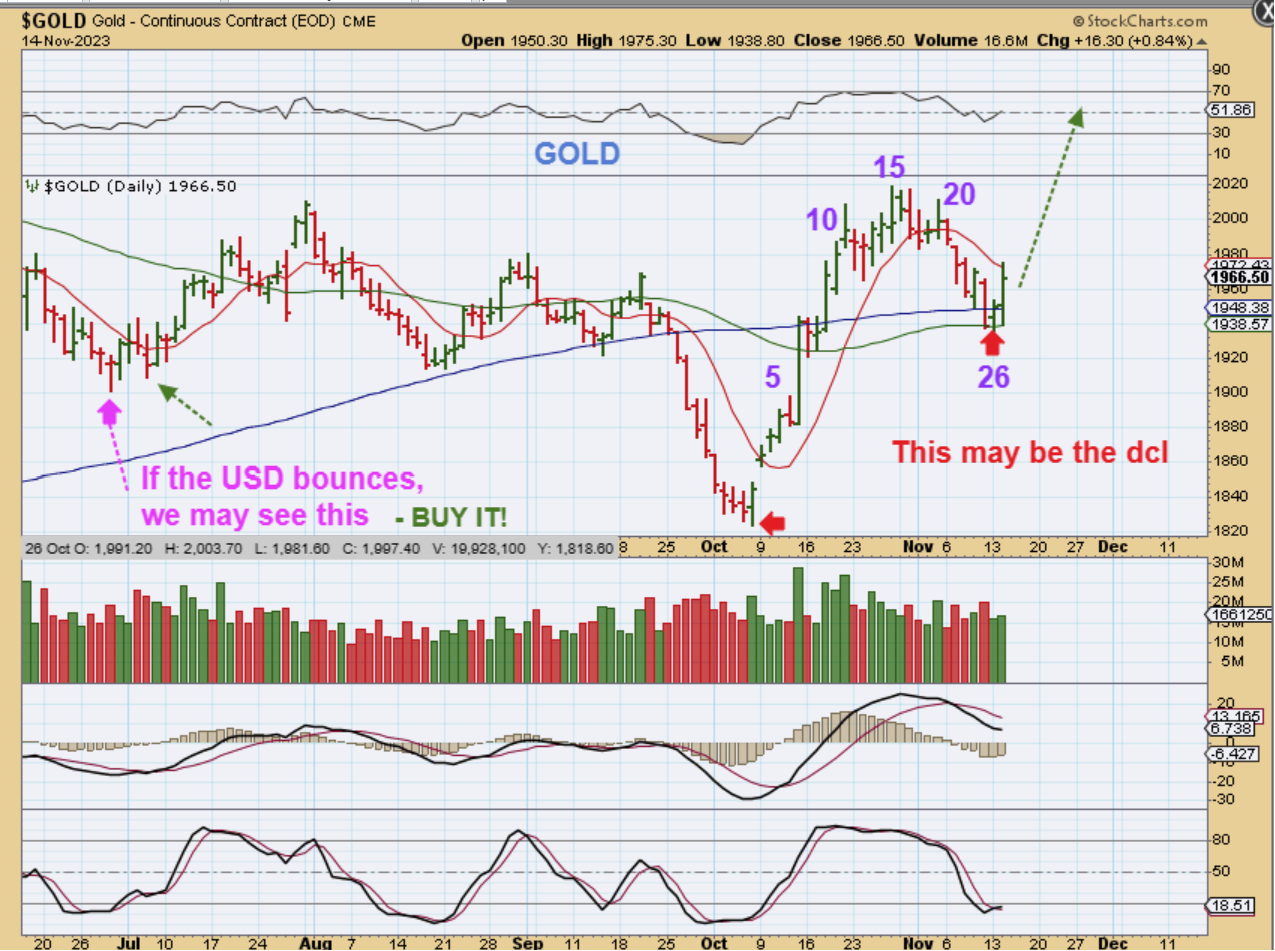
We could be seeing that early DCL that I mentioned at day 26 now that a swing low formed. After the CPI Numbers were released Gold and Silver took off and the USD rolled over. This swing low that formed (unconfirmed by the 10sma so far) very well may be the start of the second daily cycle and we would have a day 26 dcl. Tuesday would be day 1 of a new daily cycle. In technical analysis, this would have been a buy at support with a stop.
GOLD could just follow through higher or if that USD does that Bounce, drop, bounce dop , and bounces 1 more time, Gold could do what we saw in past swing lows (a small curl down before running higher). Either way, this second daily cycle looks like it will be the strong run to break out to all time highs. THAT is what we have been discussing all the way back to October of last year (2022). Golds major bull run and rally into all time highs.
.
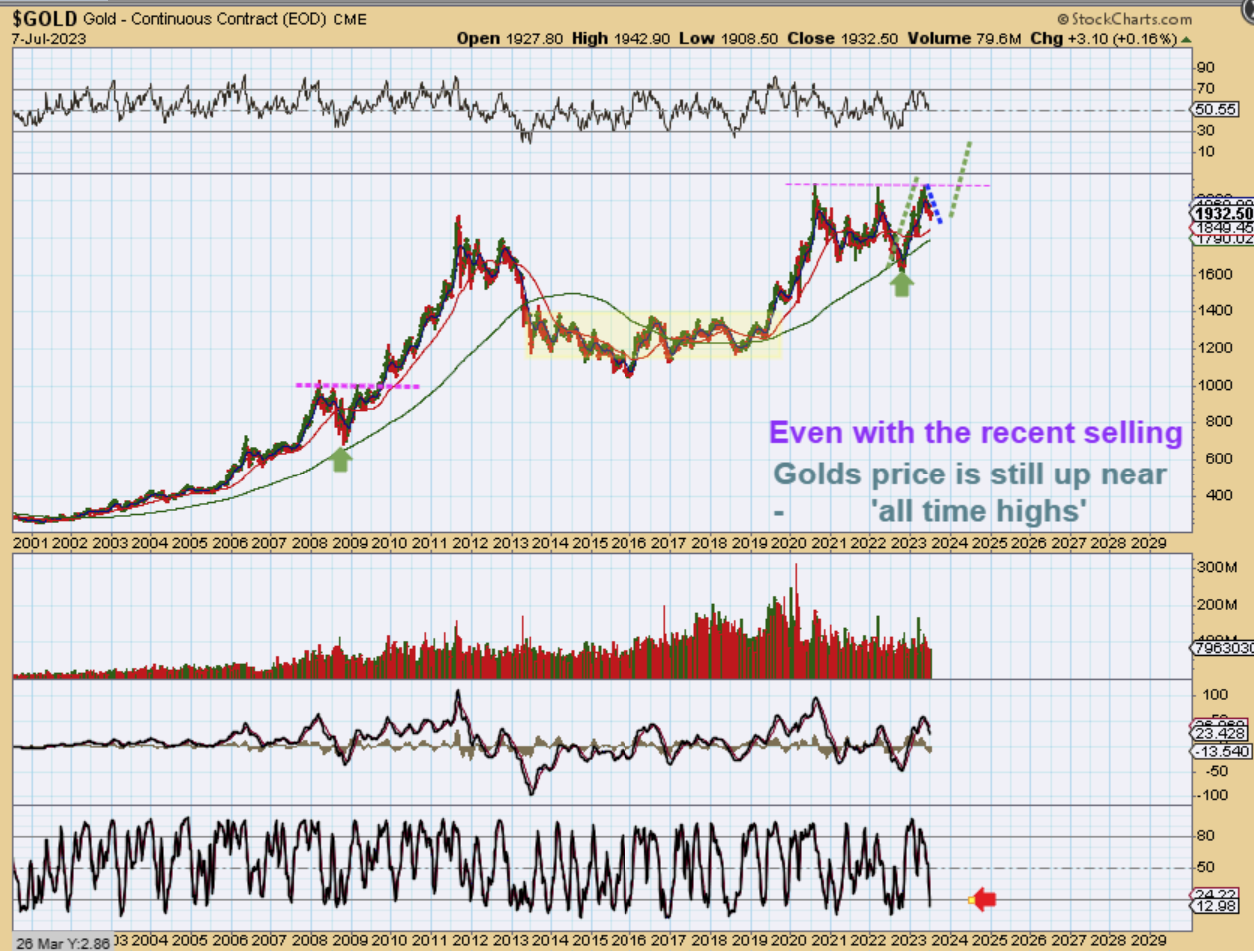
THAT is what we have been discussing all the way back to October of last year (2022). This was my Gold chart from July of this year and we discussed over and over again that Golds major bull run and rally into all-time highs was very possibly going to continue into the end of this year.
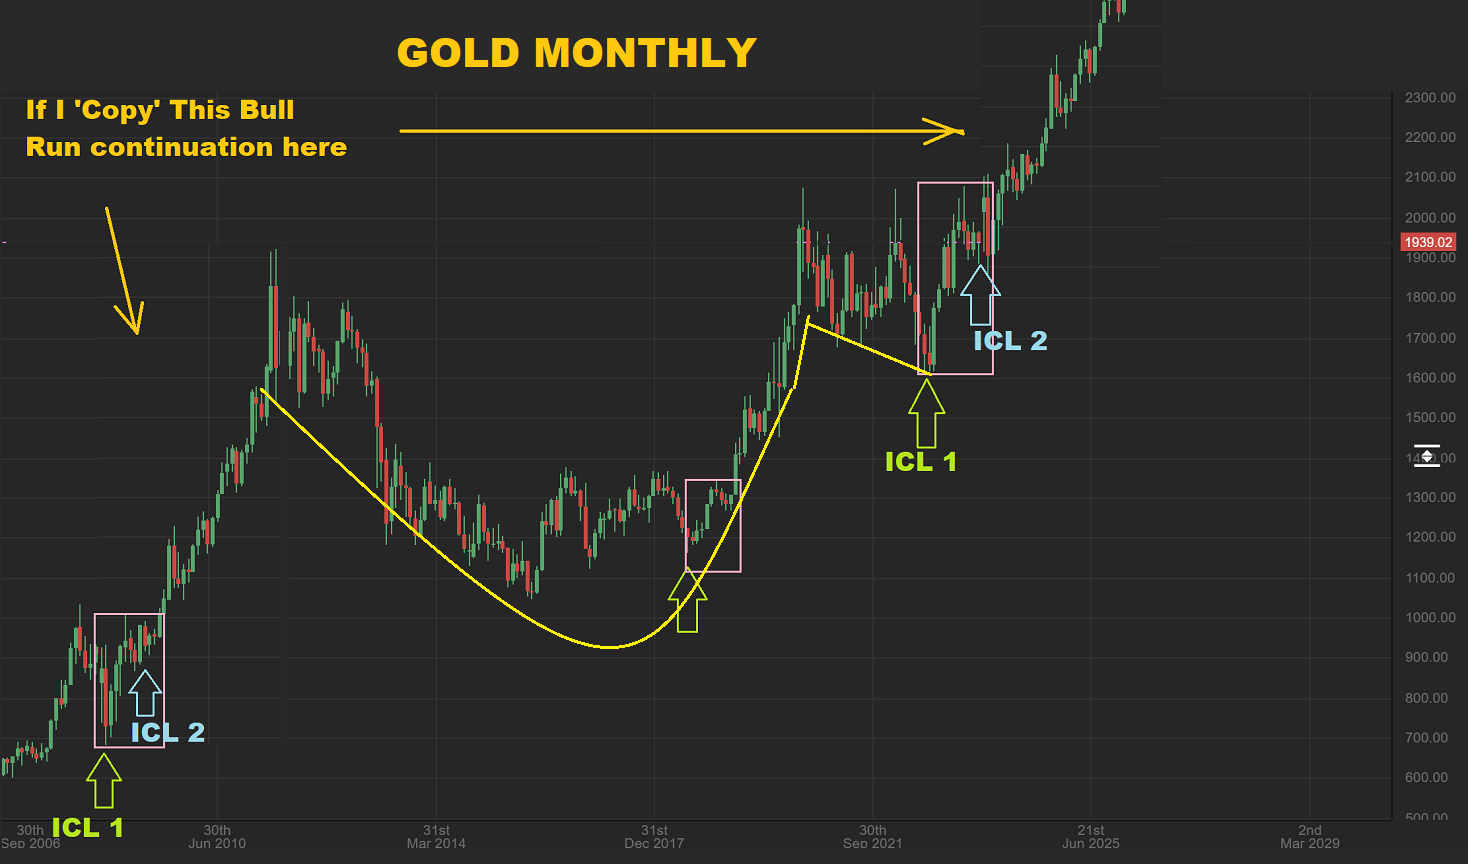
And I have compared all of this chop with the sideways chop at the highs in 2008, before a strong rally took off higher for years. I copied & pasted that 2008 run onto Gold recently with this monthly chart. I just want to keep reminding everyone of this as it plays out, because we still have plenty of doubters out there in the twitter world that think that Gold has to drop back to the lows for MAX PAIN. We have been watching ICLs form within a year of Gold prepping for this breakout to all time highs and I think we are now quite close to that time.
.
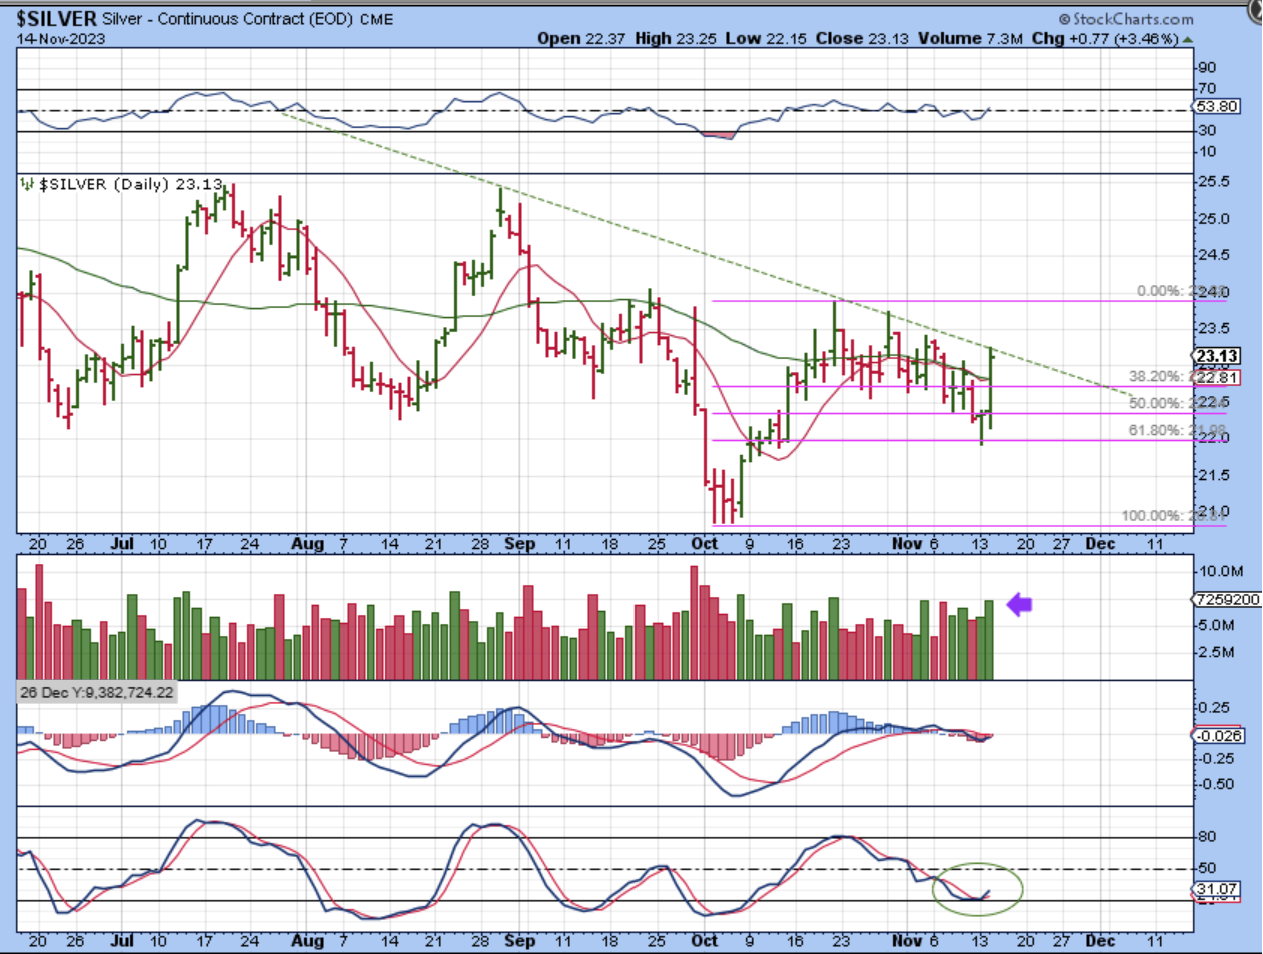
SILVER surged about 3.5% to a downtrend line. It had pulled back to the 61.8% Fib level, and that is normal or acceptable in a bull run too. The good news is that FINALLY, many Silver stocks were up 6-10%, rather than just 2% like past Silver surges. They may be ready to play catch up, since many are still near recent lows.
.
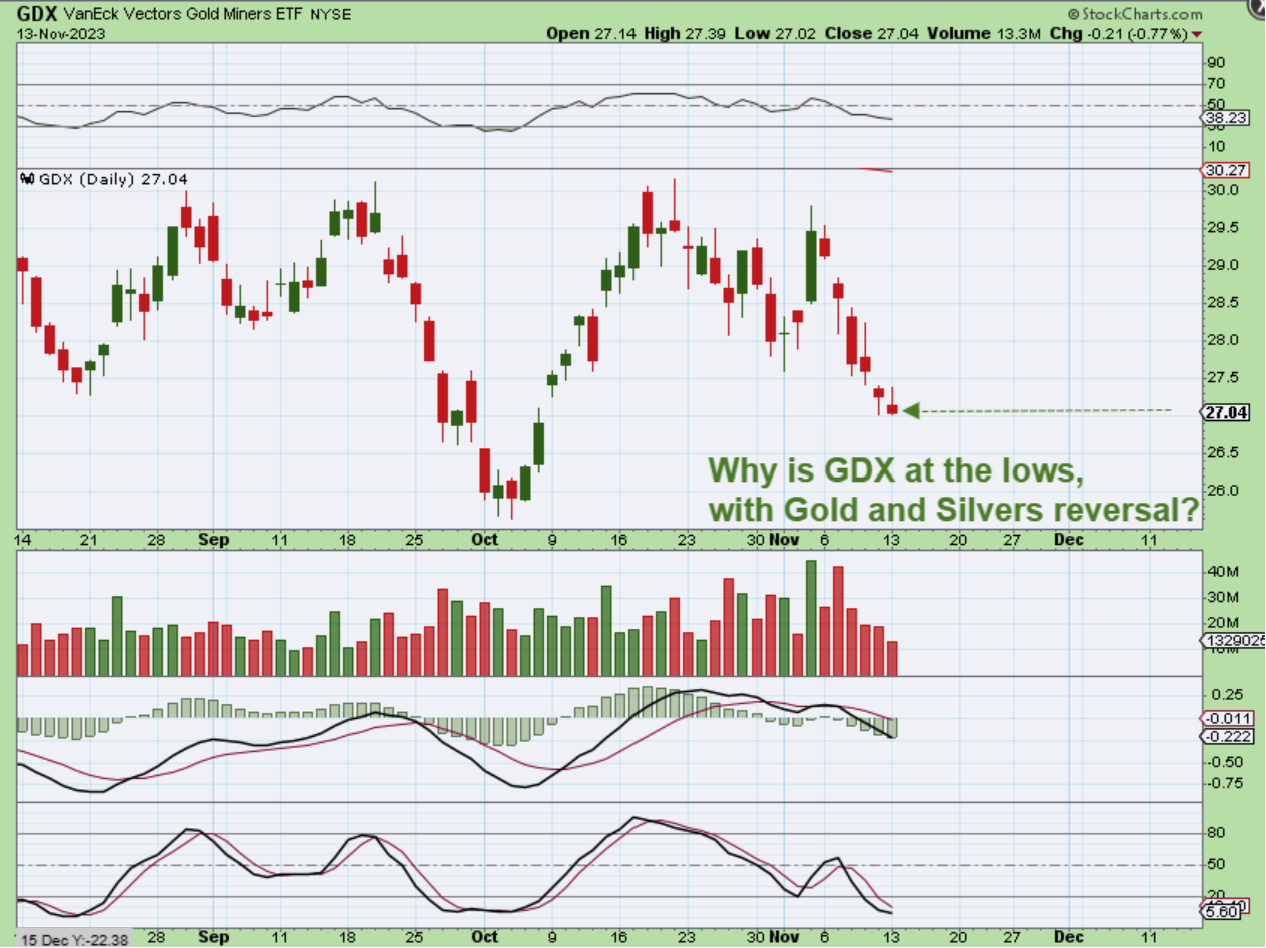
On Monday Gold & Silver looked great, but GDX closed red. I showed you a possible bullish gravestone doji. I said:
.
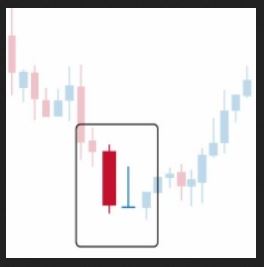
In the past I have mentioned that when we get a sell off that ends with a pop and drop like this, it could be a …
.
In the past I have mentioned that when we get a sell off that ends with a pop and drop like this, it could be a Gravestone Doji. That is bearish looking, but they actually signal a change to the downtrend, So I guess now we’ll have to see what those CPI Numbers do for the Miners.
.
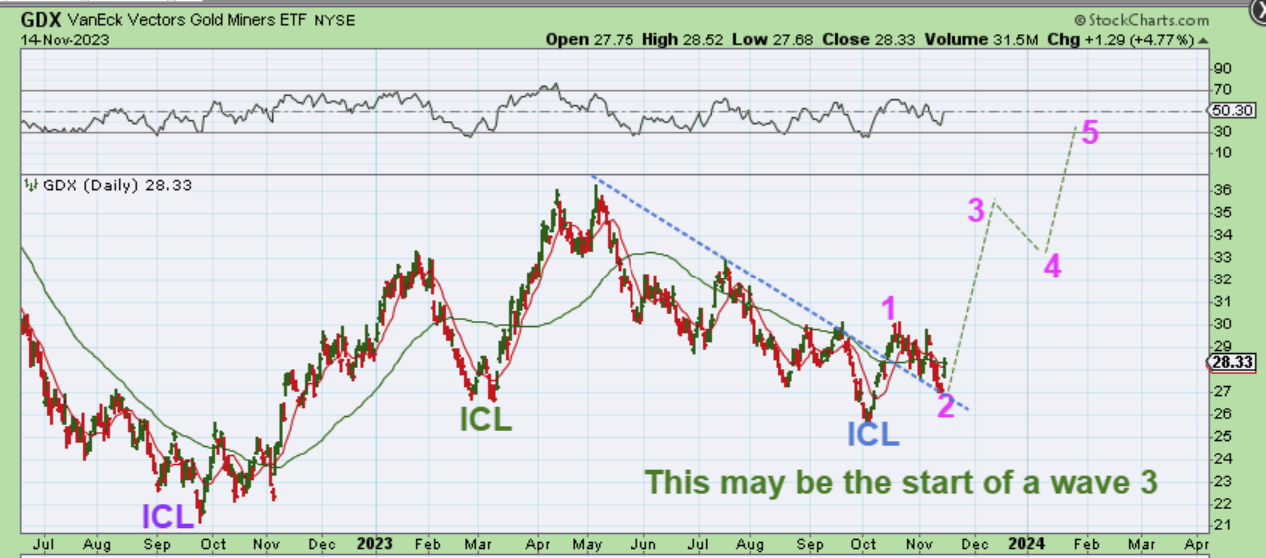
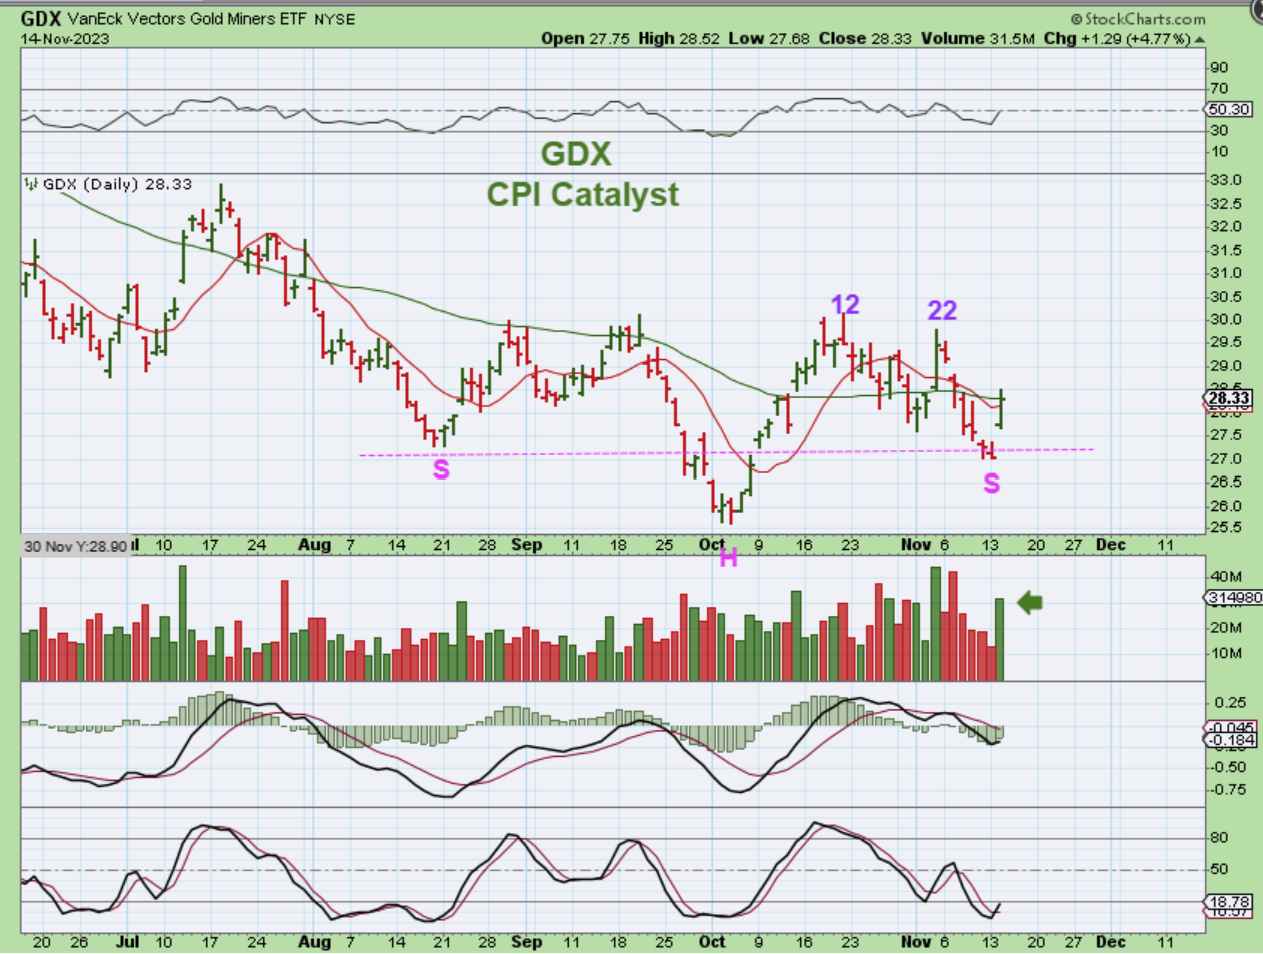
This is what the CPI Report did for the GDX.
The GDX ETF gapped open and closed up almost 5%. Again, I can’t tell you what this will do day by day, but it remains a bullish set up. The inverse H&S is still valid looking and we may be seeing the start of that next run higher. Remember that…
.
Remember that with an ICL in early October, we can now be starting the 2nd daily cycle or a wave 3, which can be the stronger leg out of the lows. As you can see, even in technical analysis this was a normal breakout and back test that caused all of that panic in Miners. People still fear the miners and hate the miners, the perfect recipe for a rally.