Tuesday November 14th
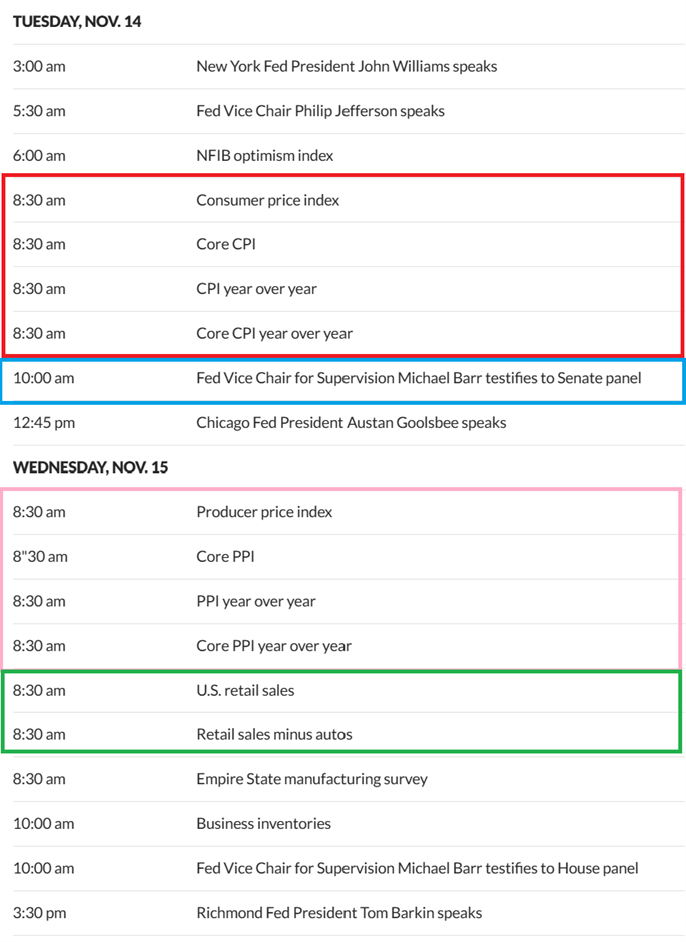
We do have some Economic Data that could move the markets today, as seen on this schedule. The CPI is related to inflation and that could affect Precious Metals and The General Markets, since the Fed uses those numbers to gauge the need for future interest rate hikes. 8:30 am ET is the time to watch the futures for any changes.
.
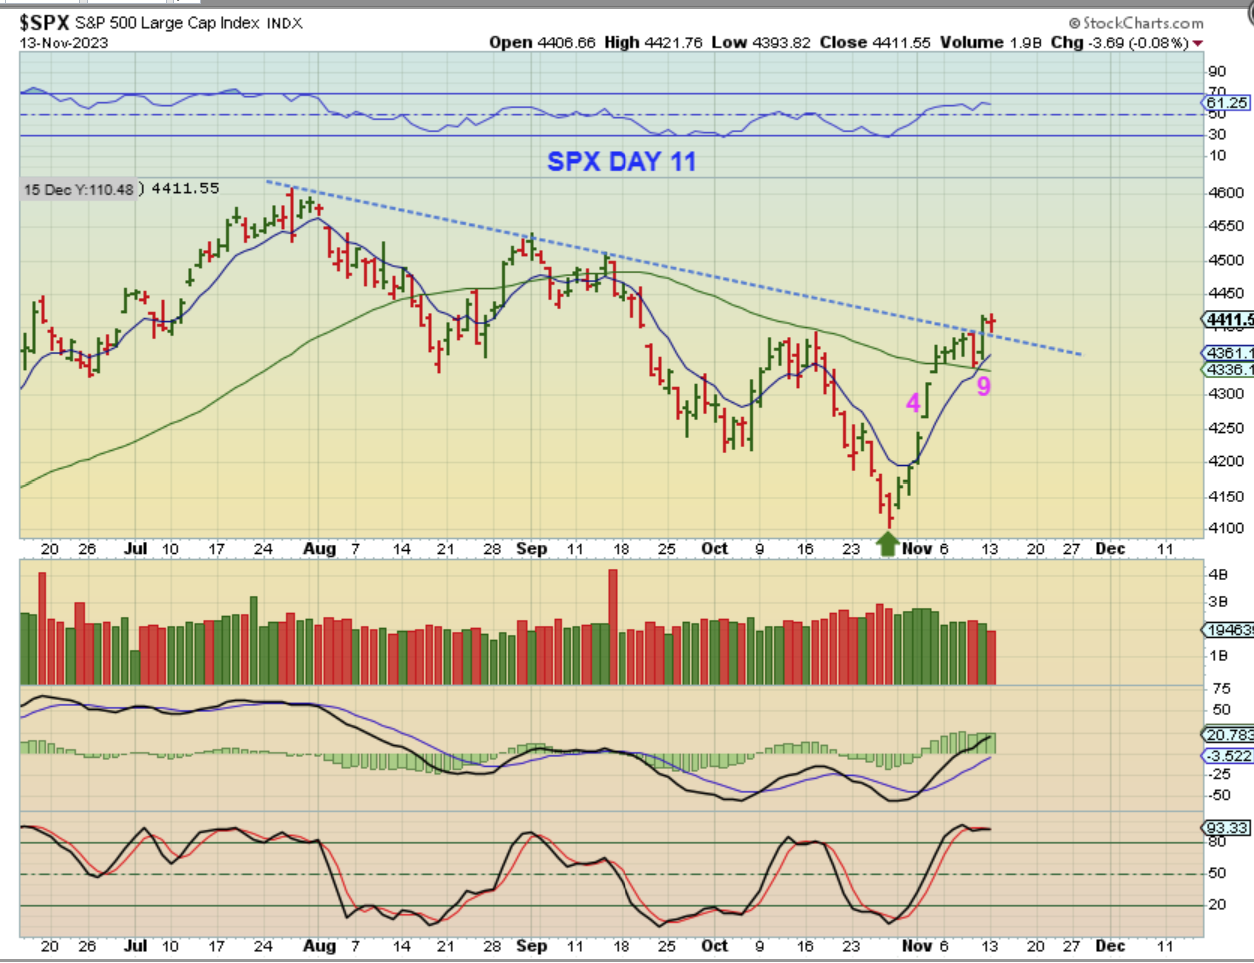
The SPX held up above that trendline break after a brief dip lower.
.
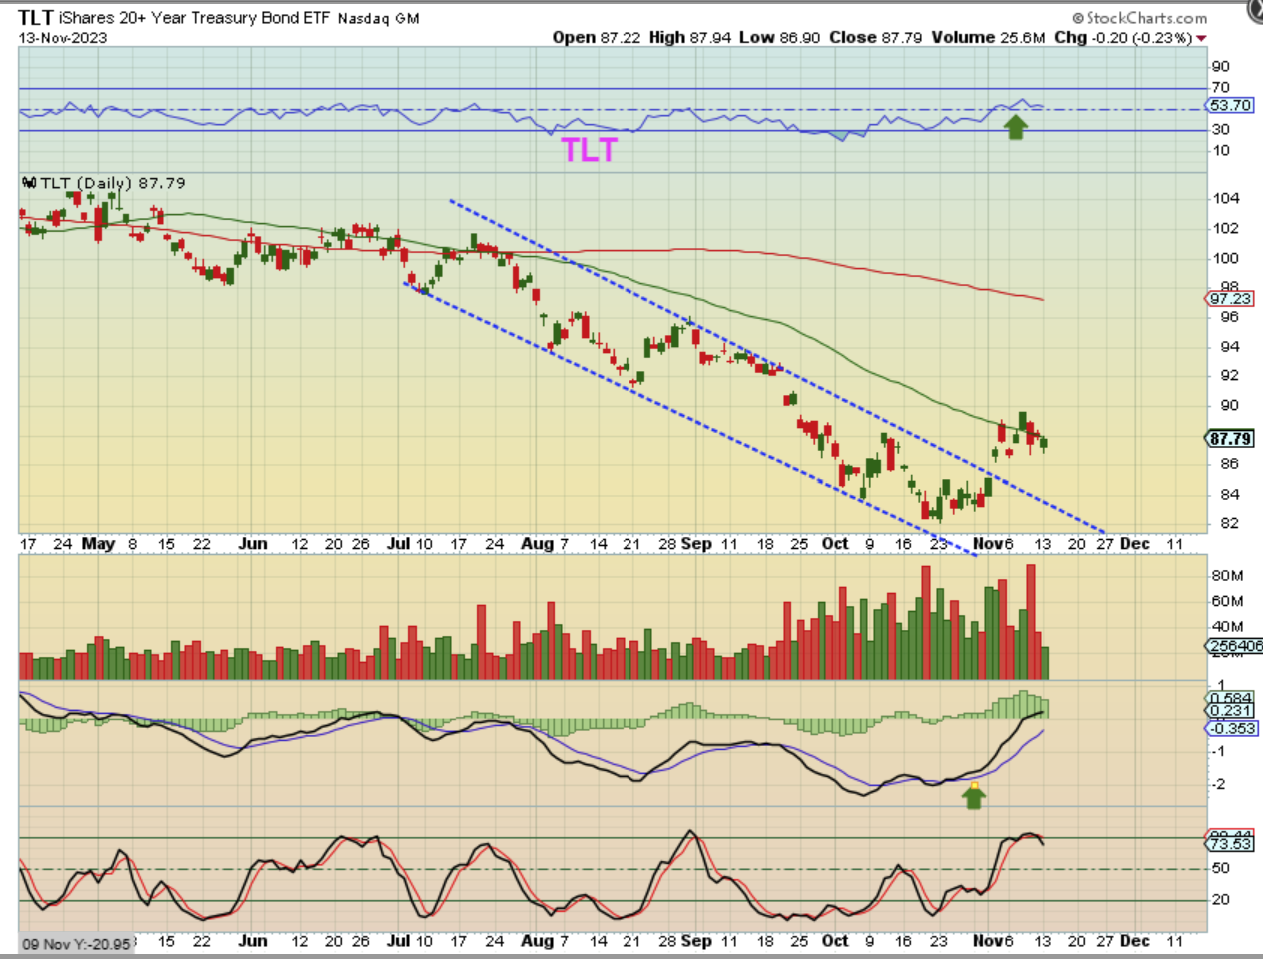
The TLT has chopped sideways since bullishly breaking from the down trending channel.
.
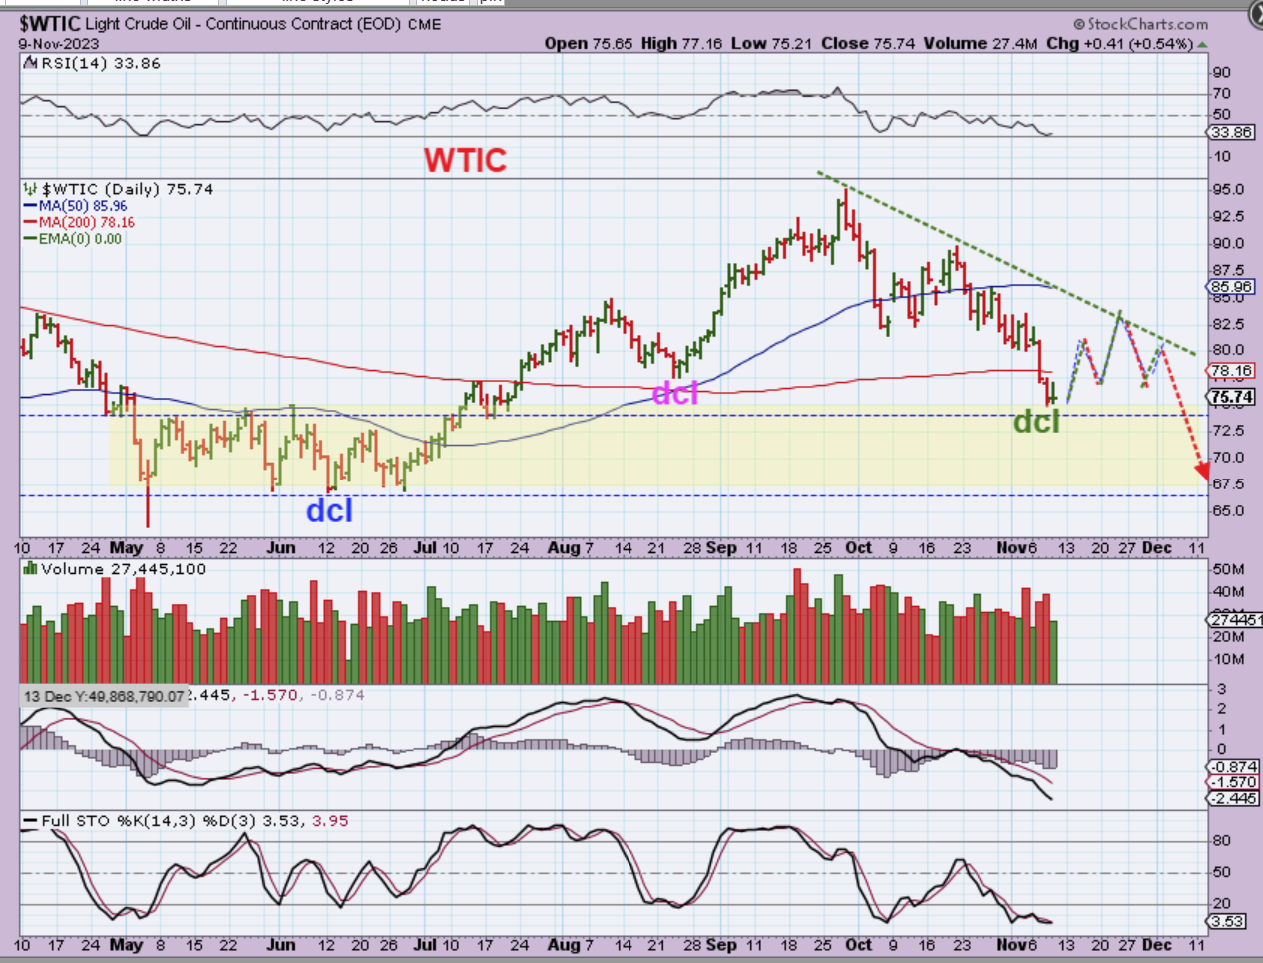
LAST WEEK I mentioned with this chart for The WTIC that I now suspect that Oil has put in the dcl on day 54, with a slight break of the 200sma. This COULD be an ICL, but I am thinking that we still have one more daily cycle lower to drop into the ICL, so I drew in a small bounce and then a continuation lower.
.
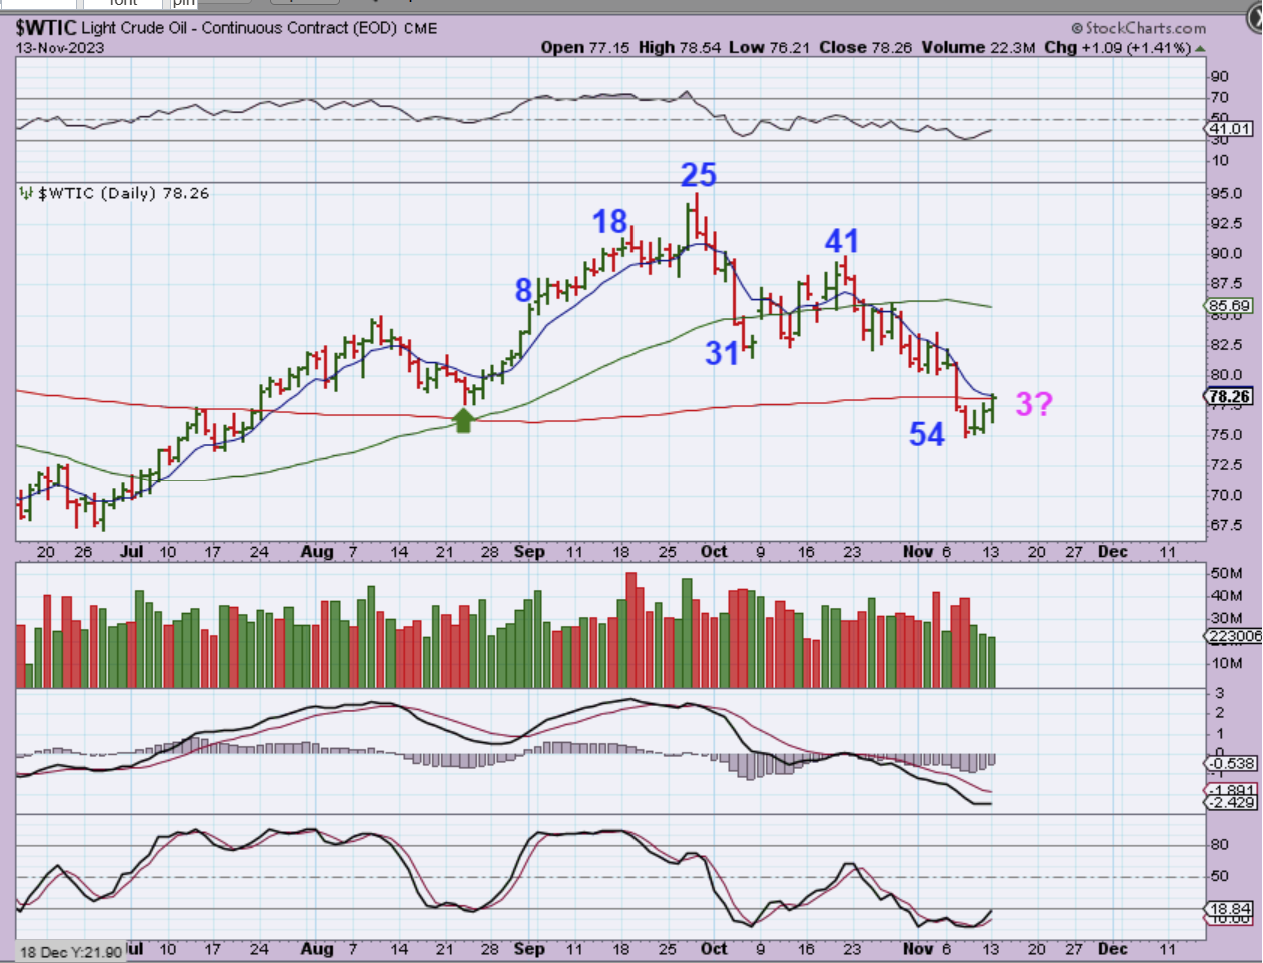
WTIC – So Oil continued the bounce on Monday, and this should be day 3 of a new daily cycle. I am thinking that it will recover that 200sma and then move toward that 50sma and downtrend line (shown in the chart above). COULD THIS BE THE ICL? It might be an a-b-c down into an ICL, but it also may need 1 more daily cycle. That means that if anyone wants to trade this move with UCO or USO, they can do that, but I would be cautious when it gets to the 50sma. If it breaks out above the 50sma, we have an ICL in place here, if it rolls over, it has further to drop.
.
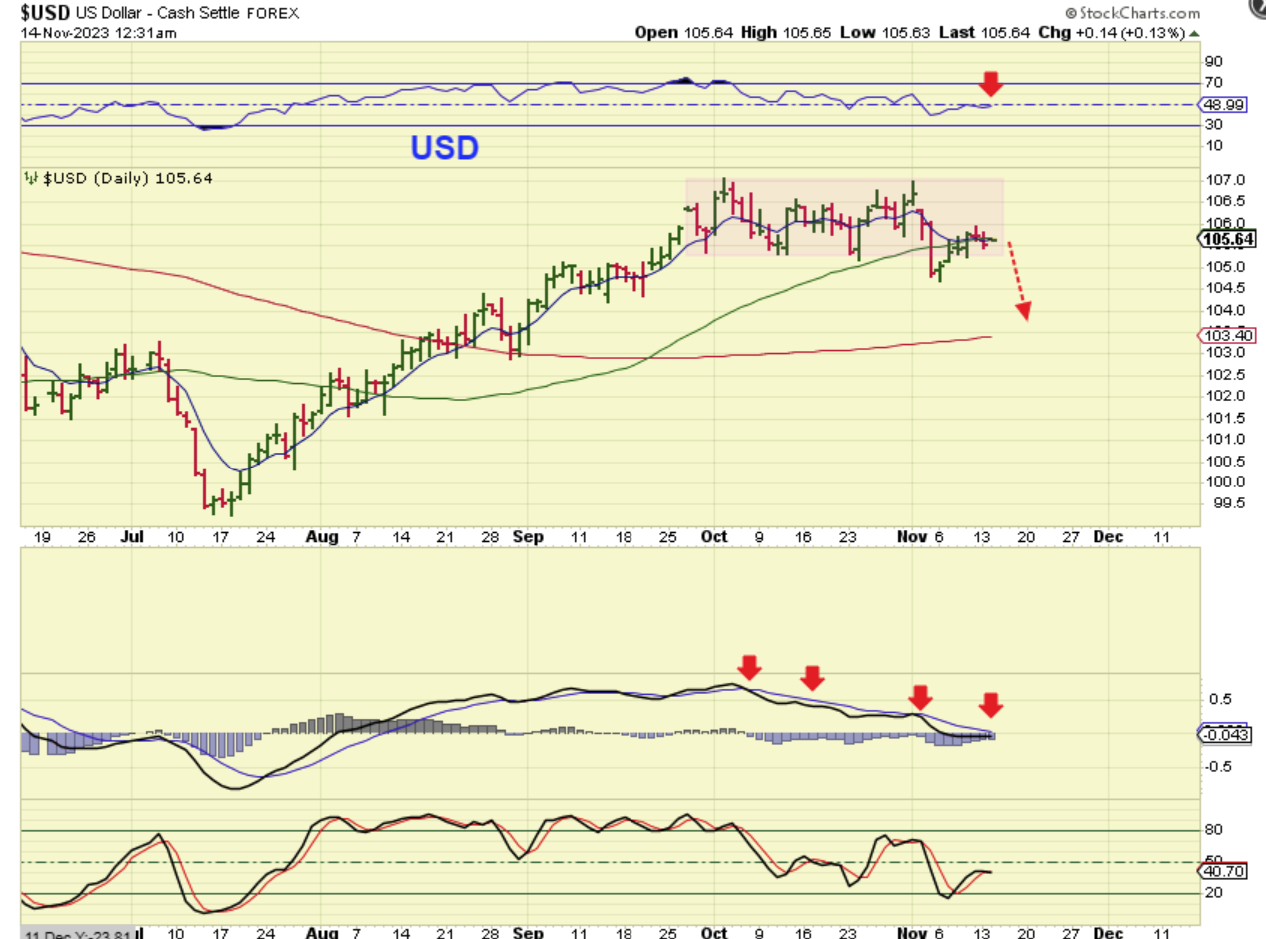
I am still expecting The USD to roll over, and it is chopping sideways at this congestion area and along the 50sma. The MACD remains weak so far.
.
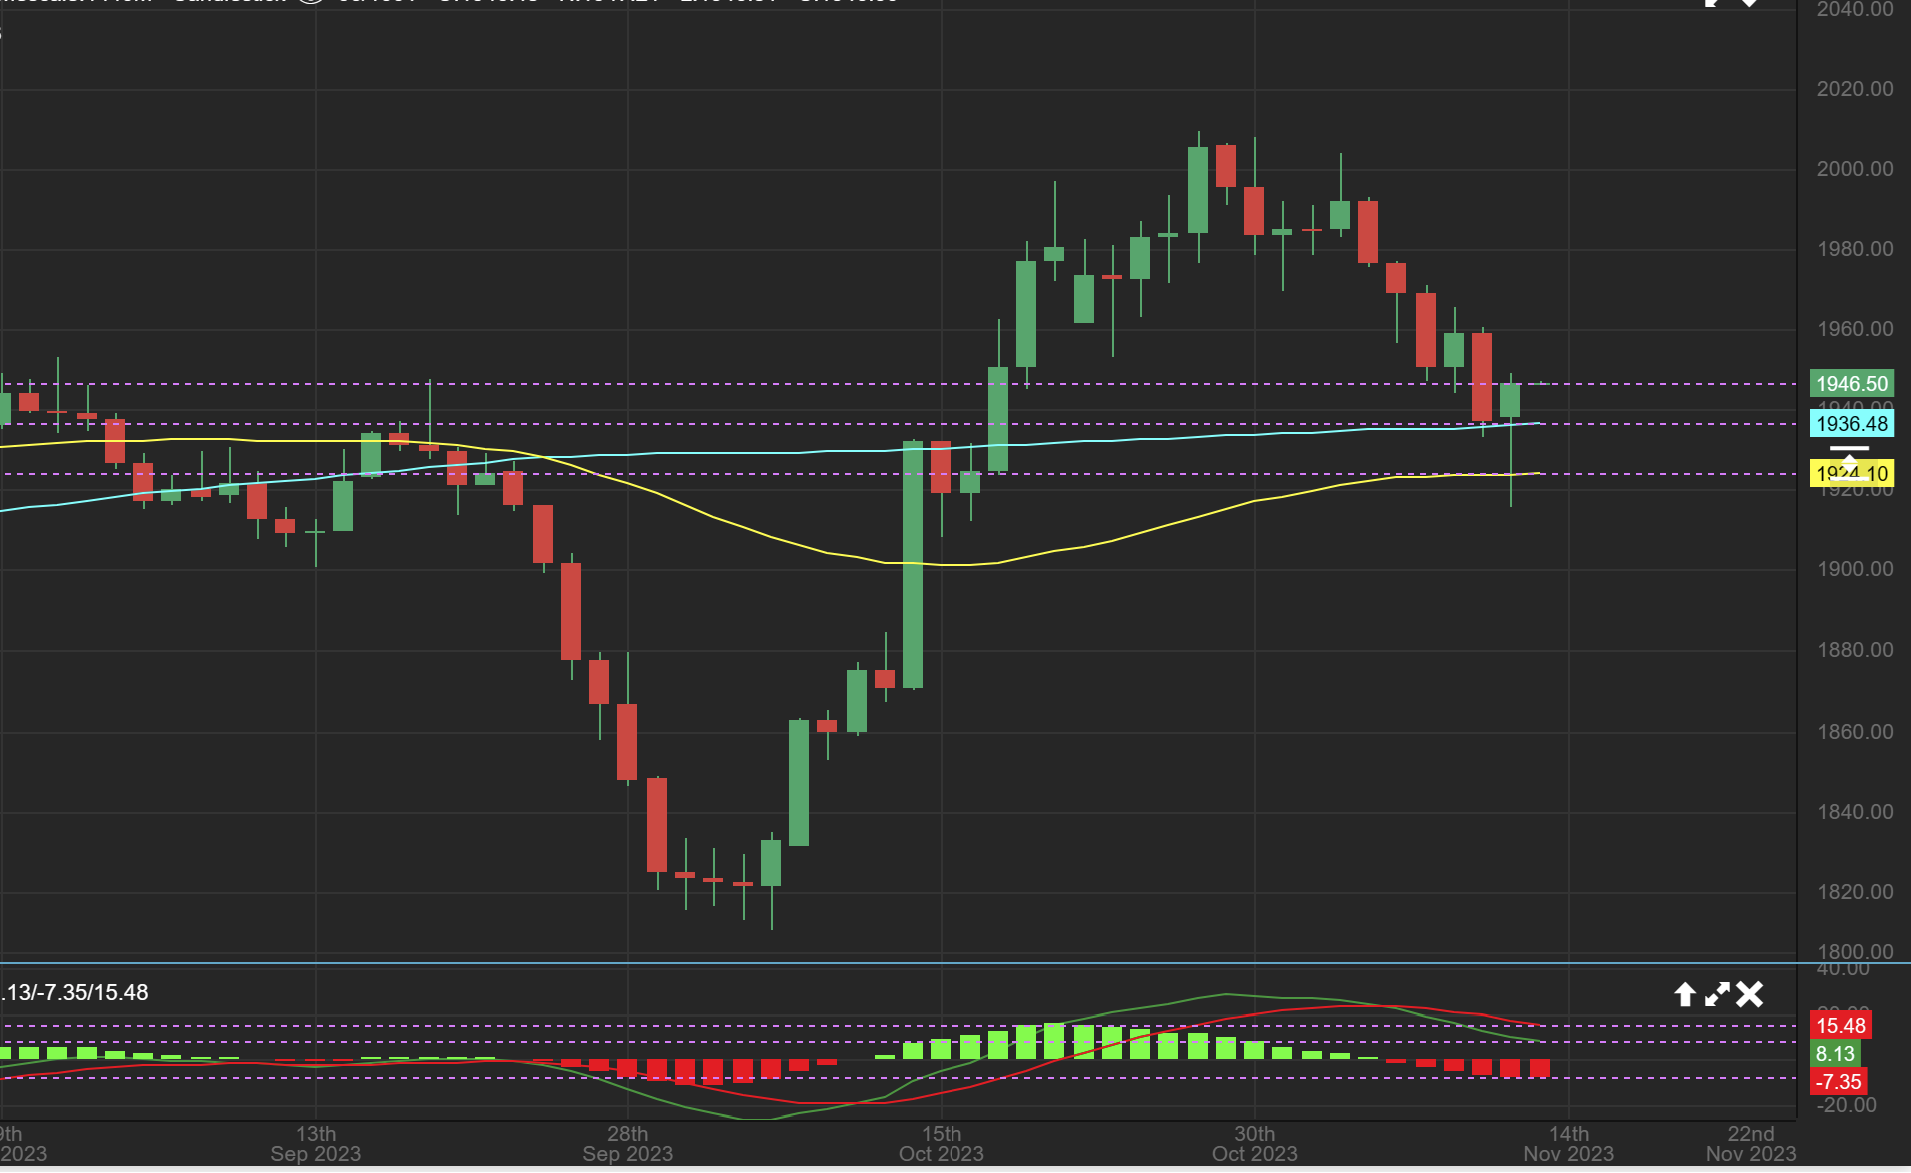
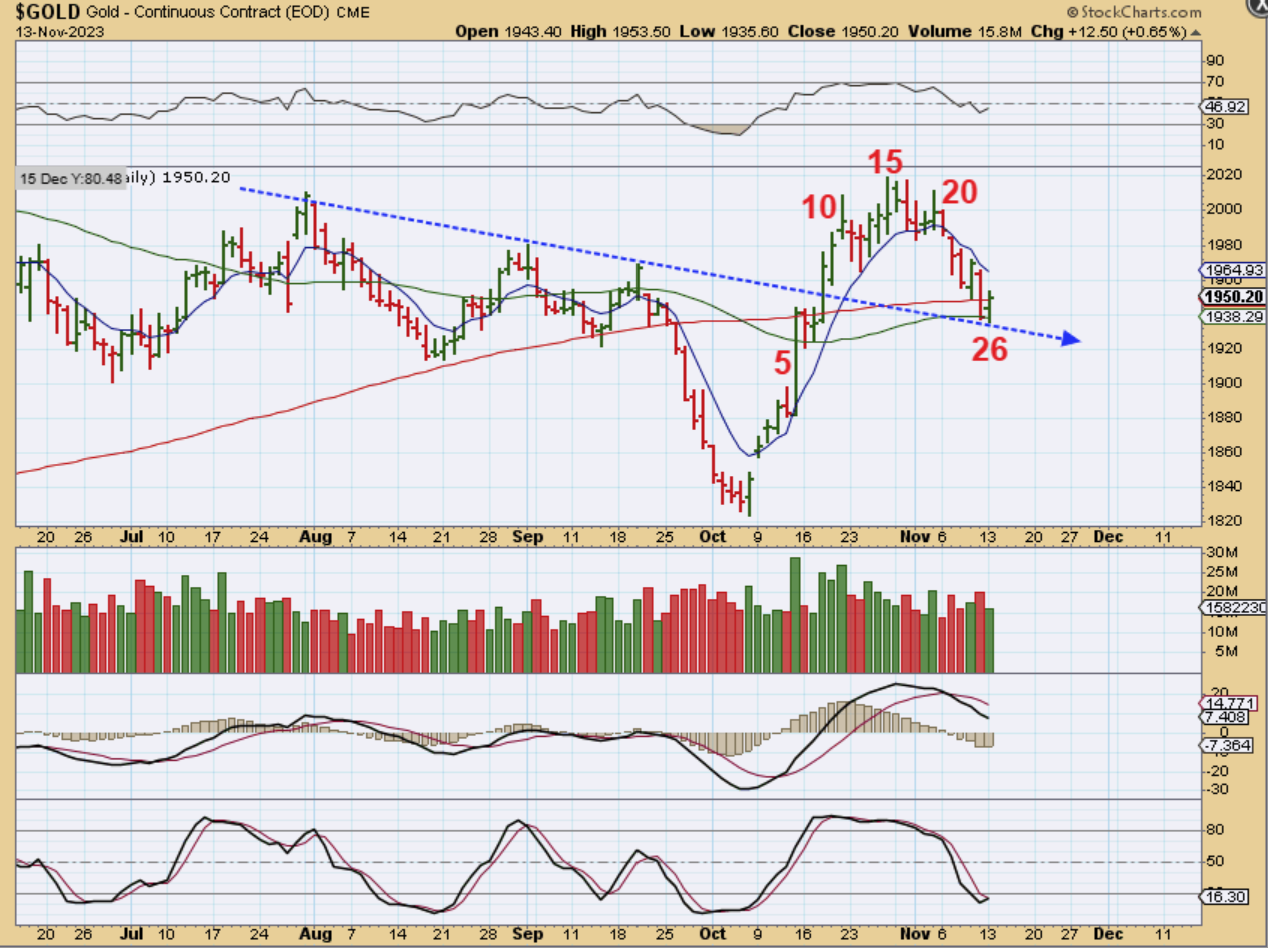
On Friday GOLD plunged $32 and I pointed out the next Fib Numbers that I wanted to watch for. I just want to mentioned that Spot Gold hit $1915 on Monday pre-market and then Gold bounced back as the day moved forward.
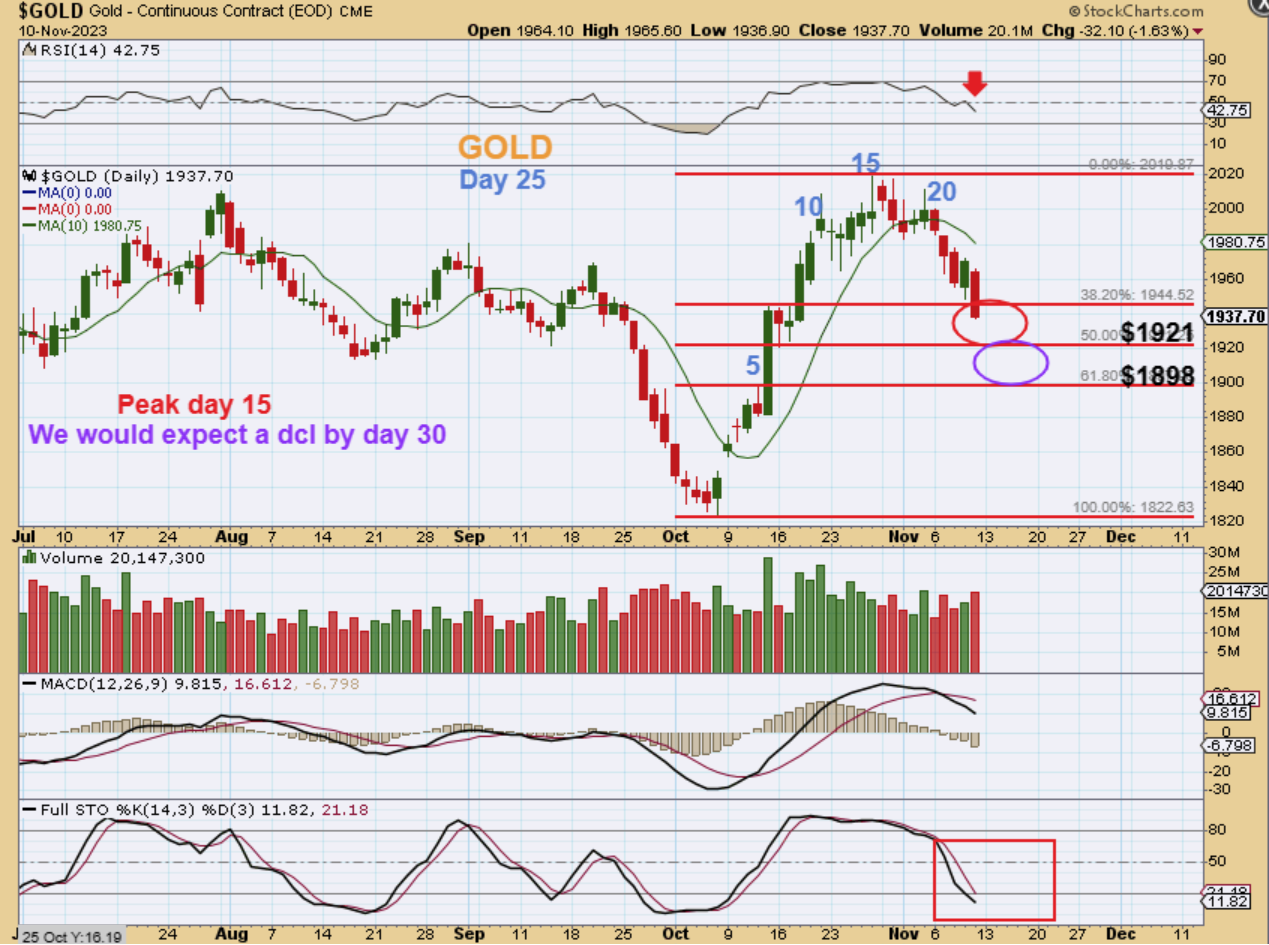
GOLD – So I Expected a dcl this week, and you may recall that I drew a ‘T’ bottom, thinking that maybe we’d make a new low this week, but reverse shortly after that. Again, on Monday…
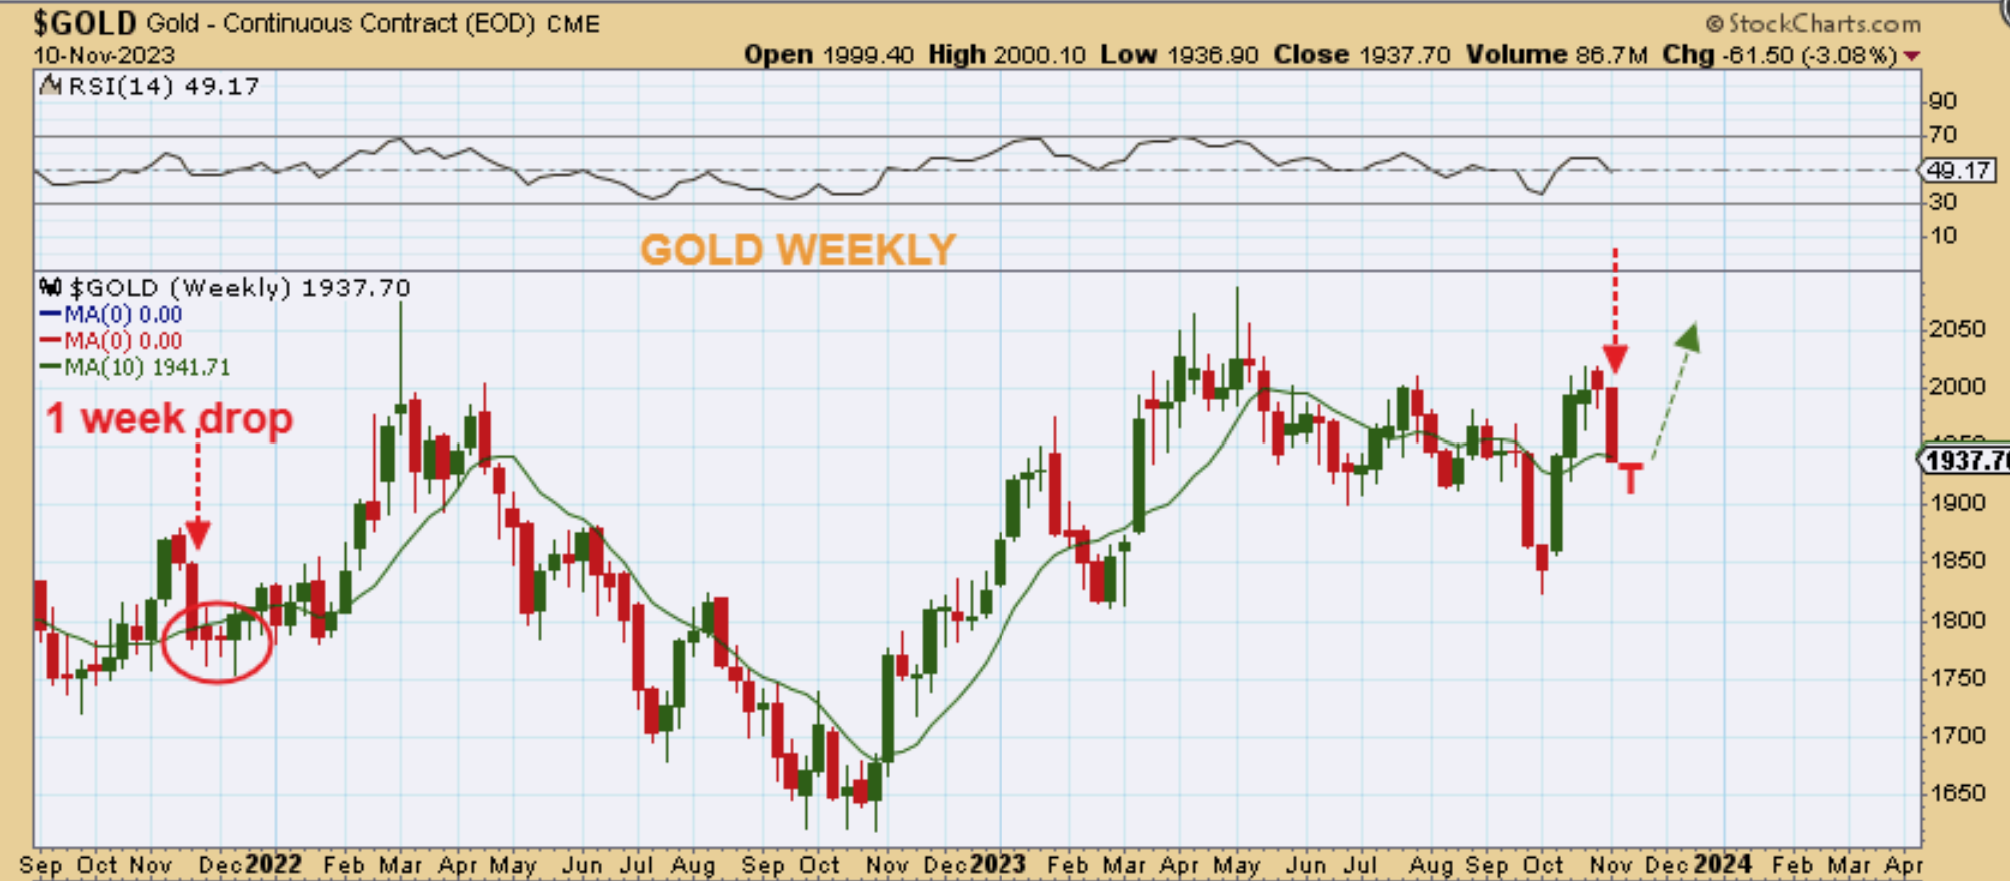
GOLD did drop to a new low at $1915, slightly breaking below the 50sma and recovering with a solid looking reversal candle. This action would give us that ‘T’ that I mentioned if it holds as the lows this week.
.
So we now have GOLD with a drop and a solid reversal in place on Monday, day 26. This is a little bit early for a dcl lately, but we have actually seen day 28 dcls in recent bull runs, so this very well could be a R.T. Daily cycle with a dcl in place. Gold has reached oversold, so let’s see what those CPI Numbers do for Gold at 8:30 am Eastern Time. THIS MAY BE A REVERSAL LOW AND THE END OF THE SELL OFF.
.
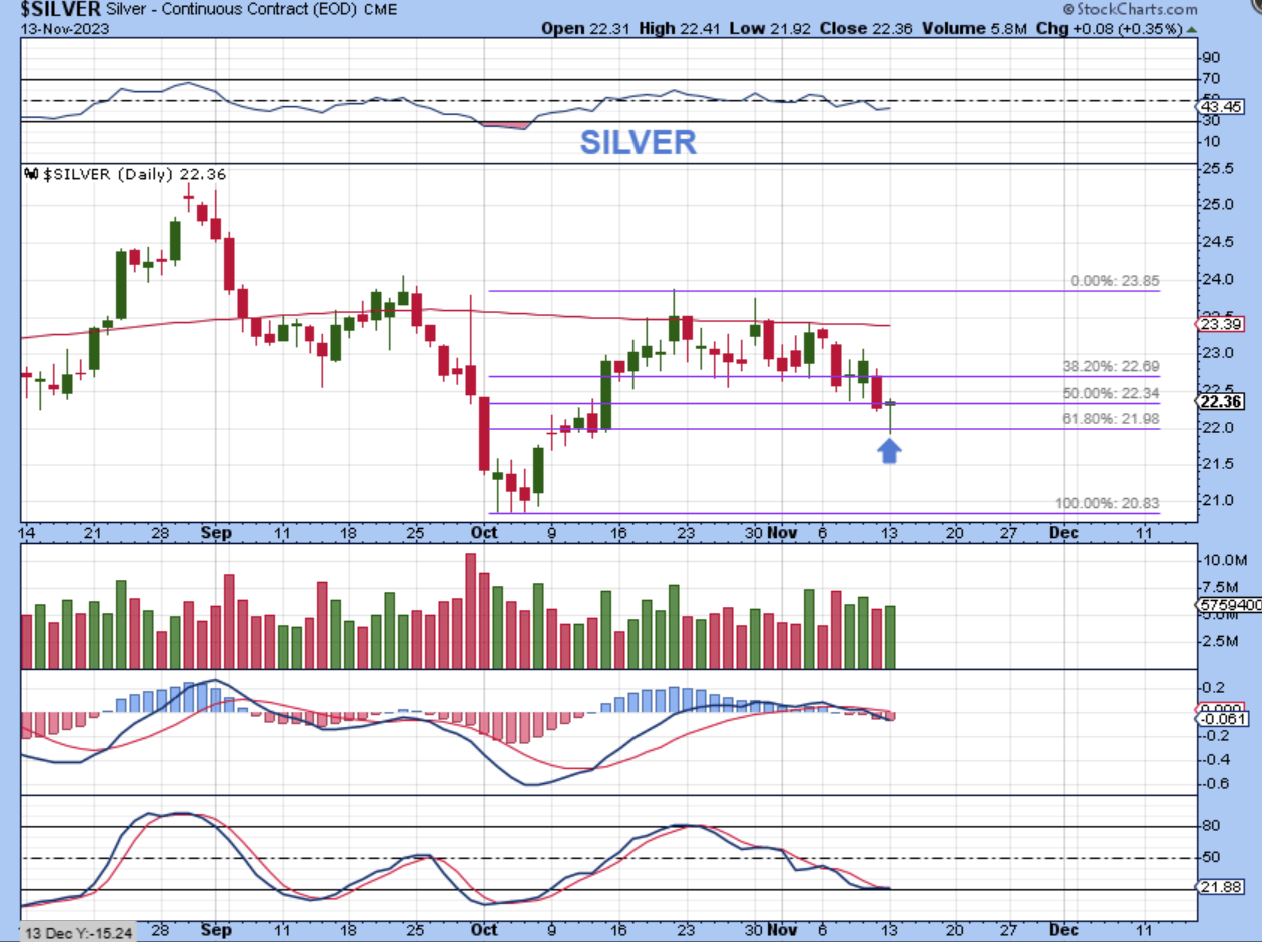
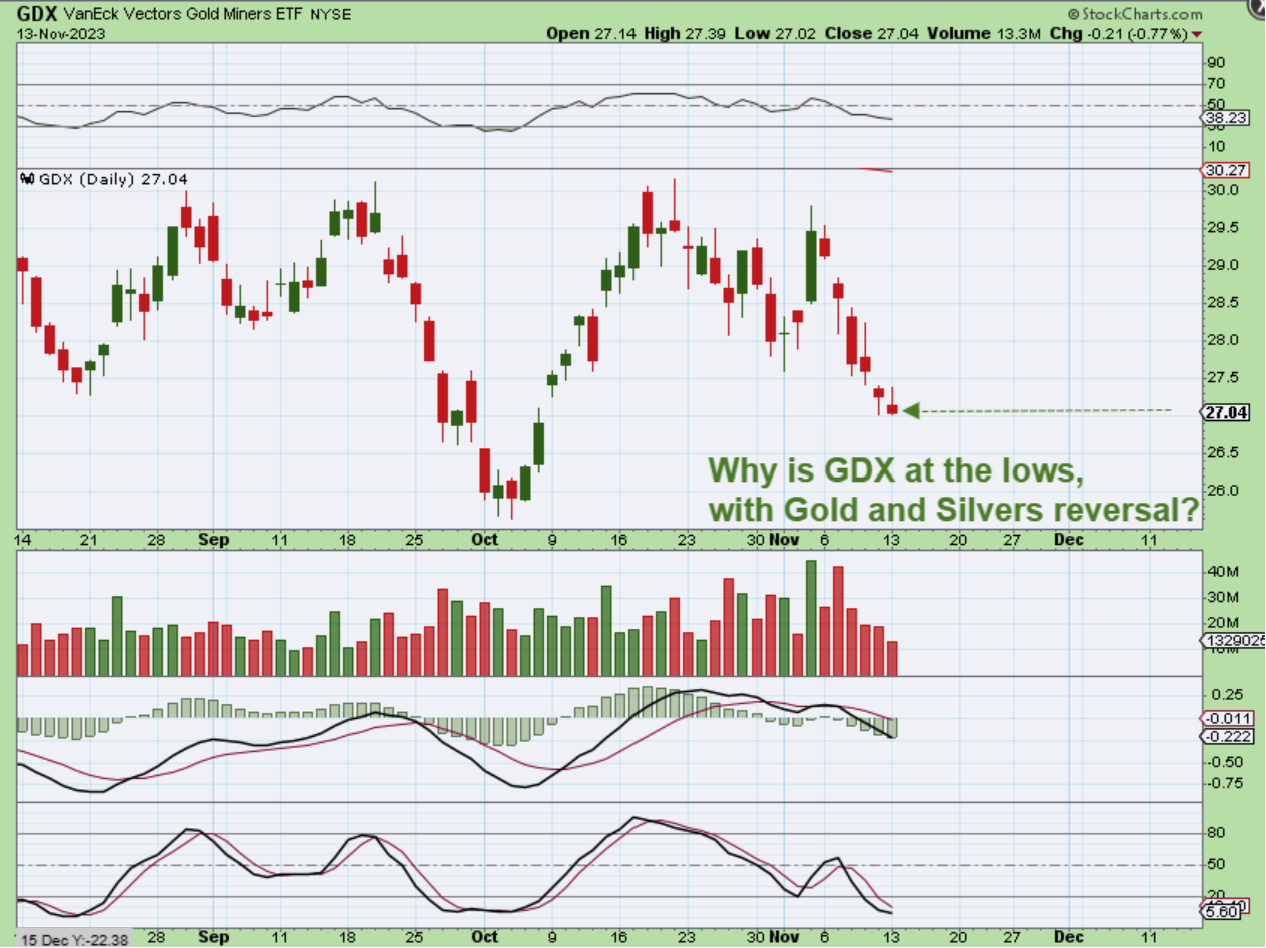
SILVER also dropped and put in a reversal candle. That was a 61.8% Fib level that was tagged when Silver reversed, so you can see that Gold and Silver actually look like bullish reversals. This looks great, except for the Miners 🙁 🙁 🙁 Yes, Miners actually closed at the lows and did not put in a reversal candle like Gold & Silver, so let’s take a look.
.
As you can see The GDX did a Pop & Drop and closed at the lows. This is not what we would expect with a Gold and Silver reversal, but can it be viewed as Bullish at all? Well, it could. How?
.
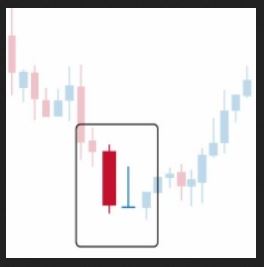
In the past I have mentioned that when we get a sell off that ends with a pop and drop like this, it could be a …
.
In the past I have mentioned that when we get a sell off that ends with a pop and drop like this, it could be a Gravestone Doji. That is bearish looking, but they actually signal a change to the downtrend, So I guess now we’ll have to see what those CPI Numbers do for the Miners.
The General Markets remain bullish, Oil has bottomed with a DCL (maybe an ICL), and I am expecting the USD to roll over and Gold & Silver both put in a nice reversal candle on day 26, within the timing for a dcl. Let’s watch what happens after 8:30 a.m. for starters, to see if that Gold rally out of the ICL is ready to resume higher. Enjoy your Tuesday trading!
The General Markets
.~ALEX
.
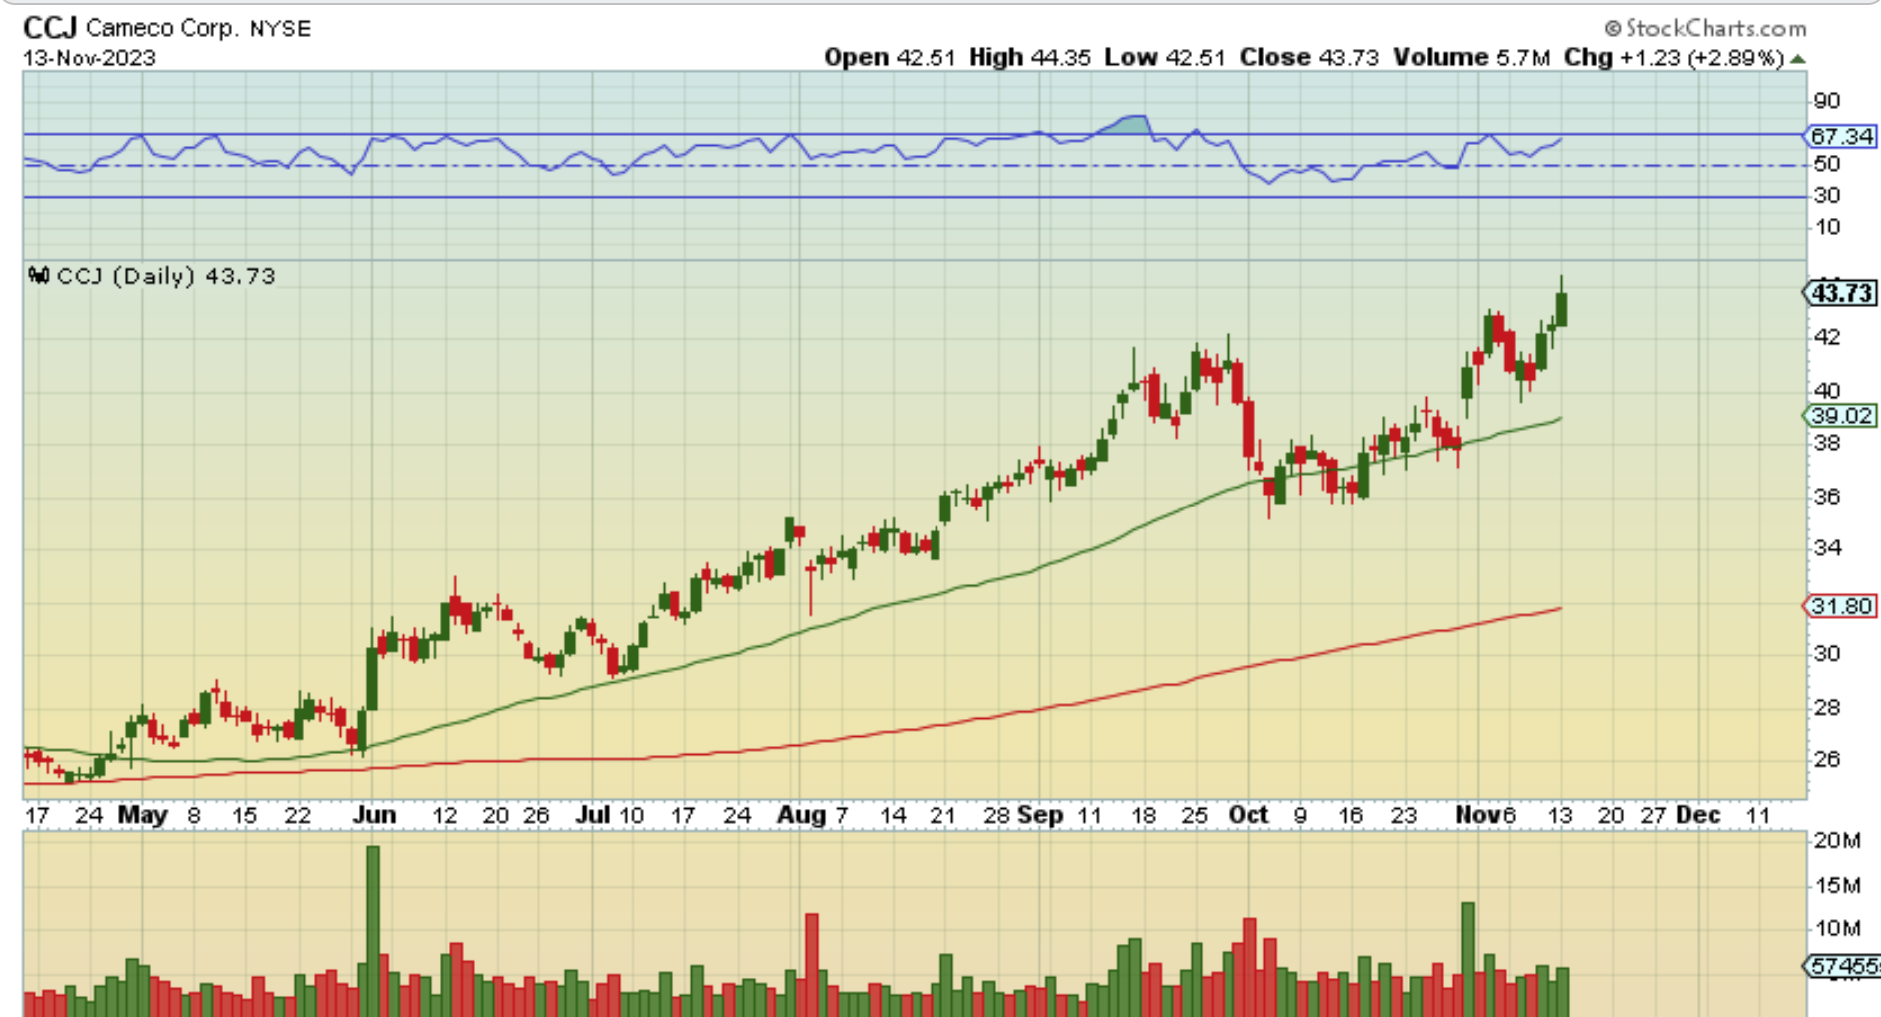
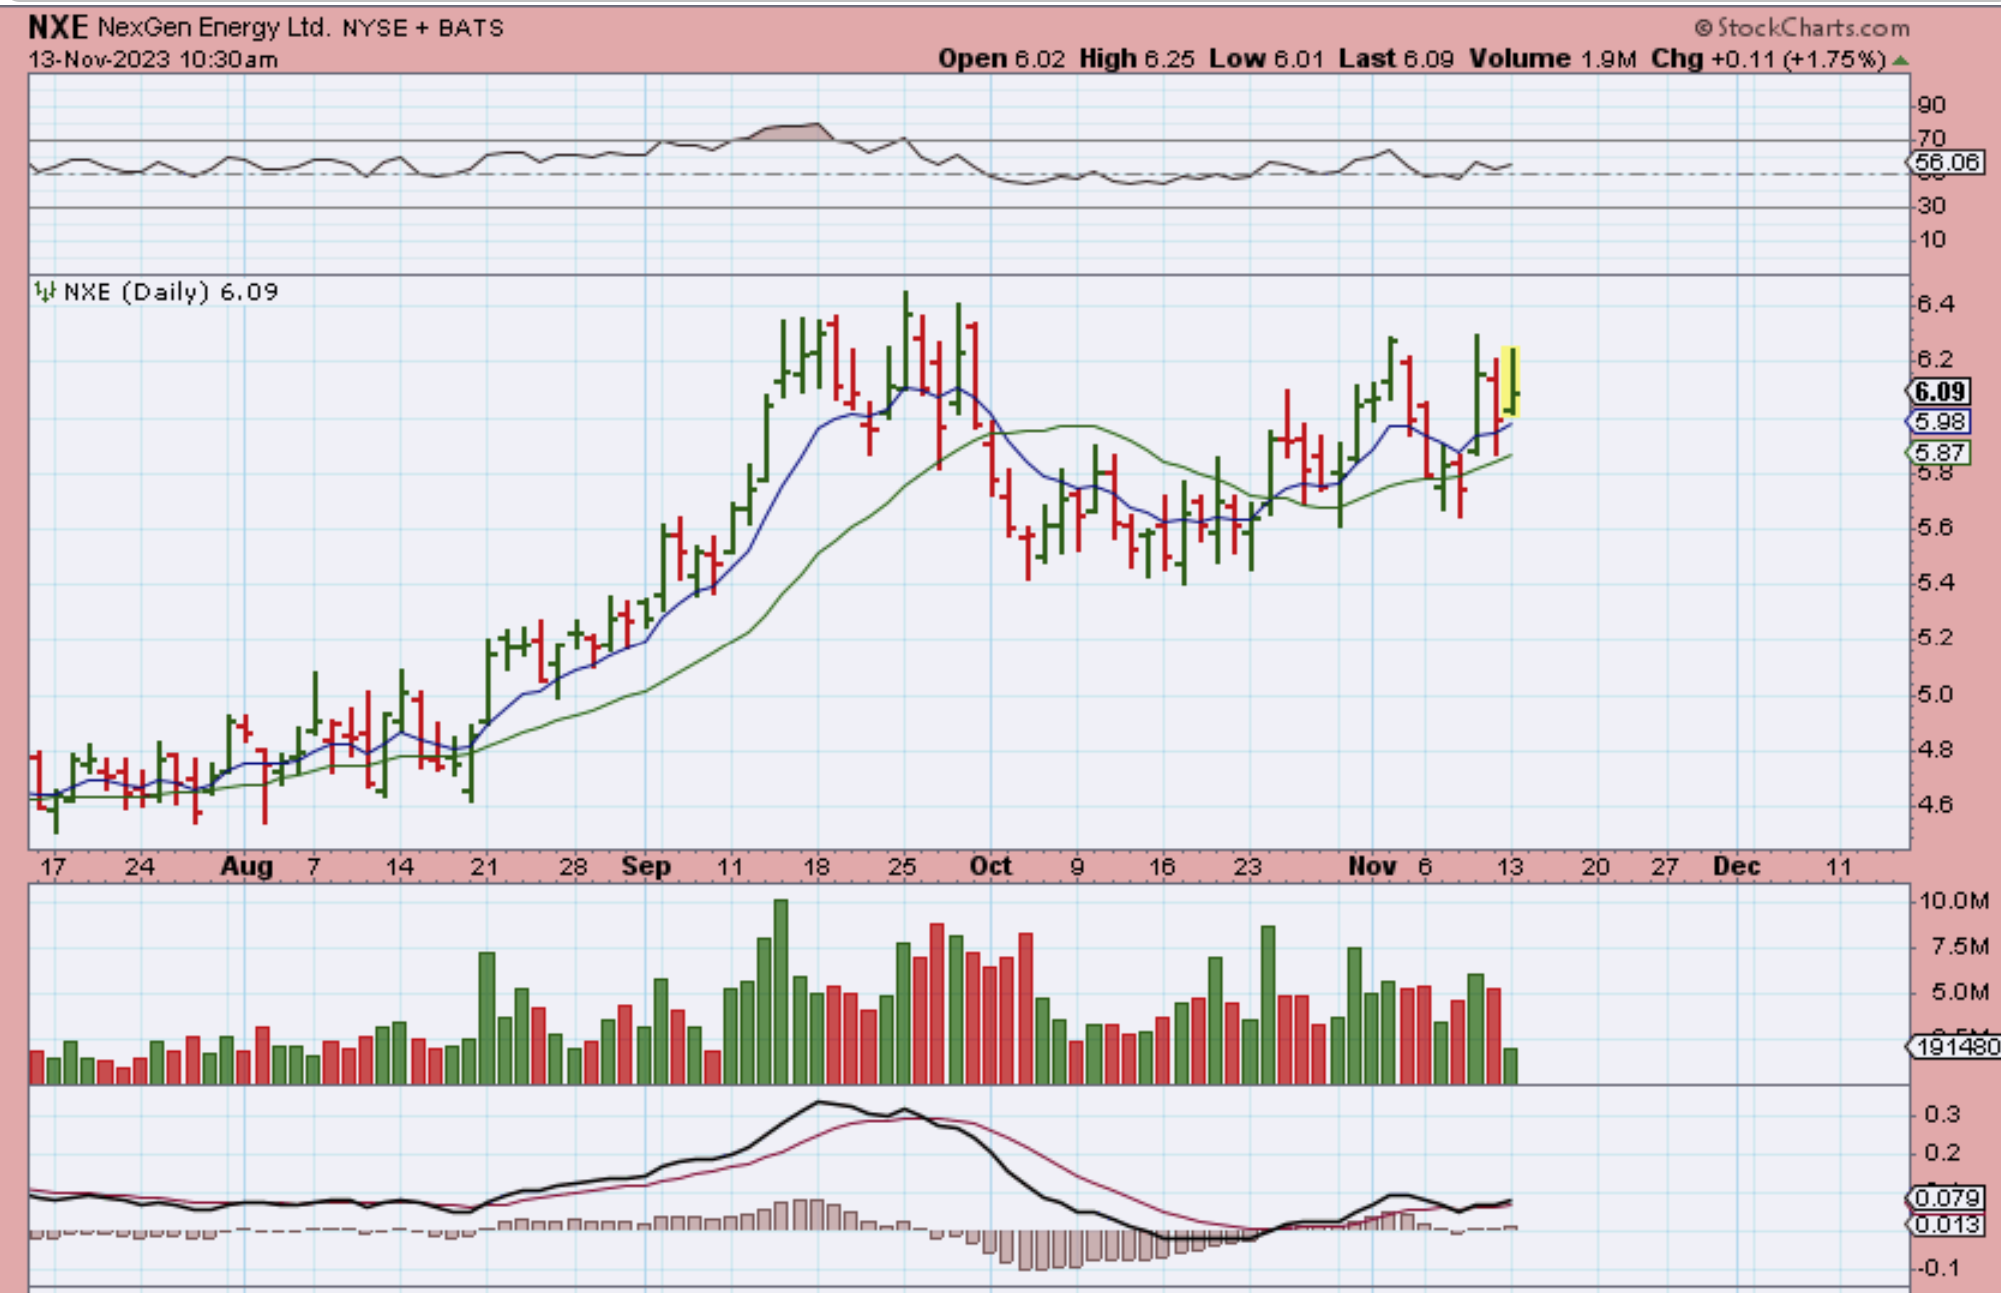
I wanted to point out again that it still looks like all of the Uranium Miners remain bullishly aligned and may be ready to push higher out of their cup-like consolidations. These are usually very choppy and that makes them hard to ‘buy & hold’, but last summer and more recently I have pointed them out as bullishly breaking out and trending higher over time. I mentioned this again an hour into trading yesterday, so…
.
I grabbed this chart of NXE as it popped higher and pulled back. NexGen Energy looks to be forming a bullish cup that will break out higher. It closed higher at $6.14.
.
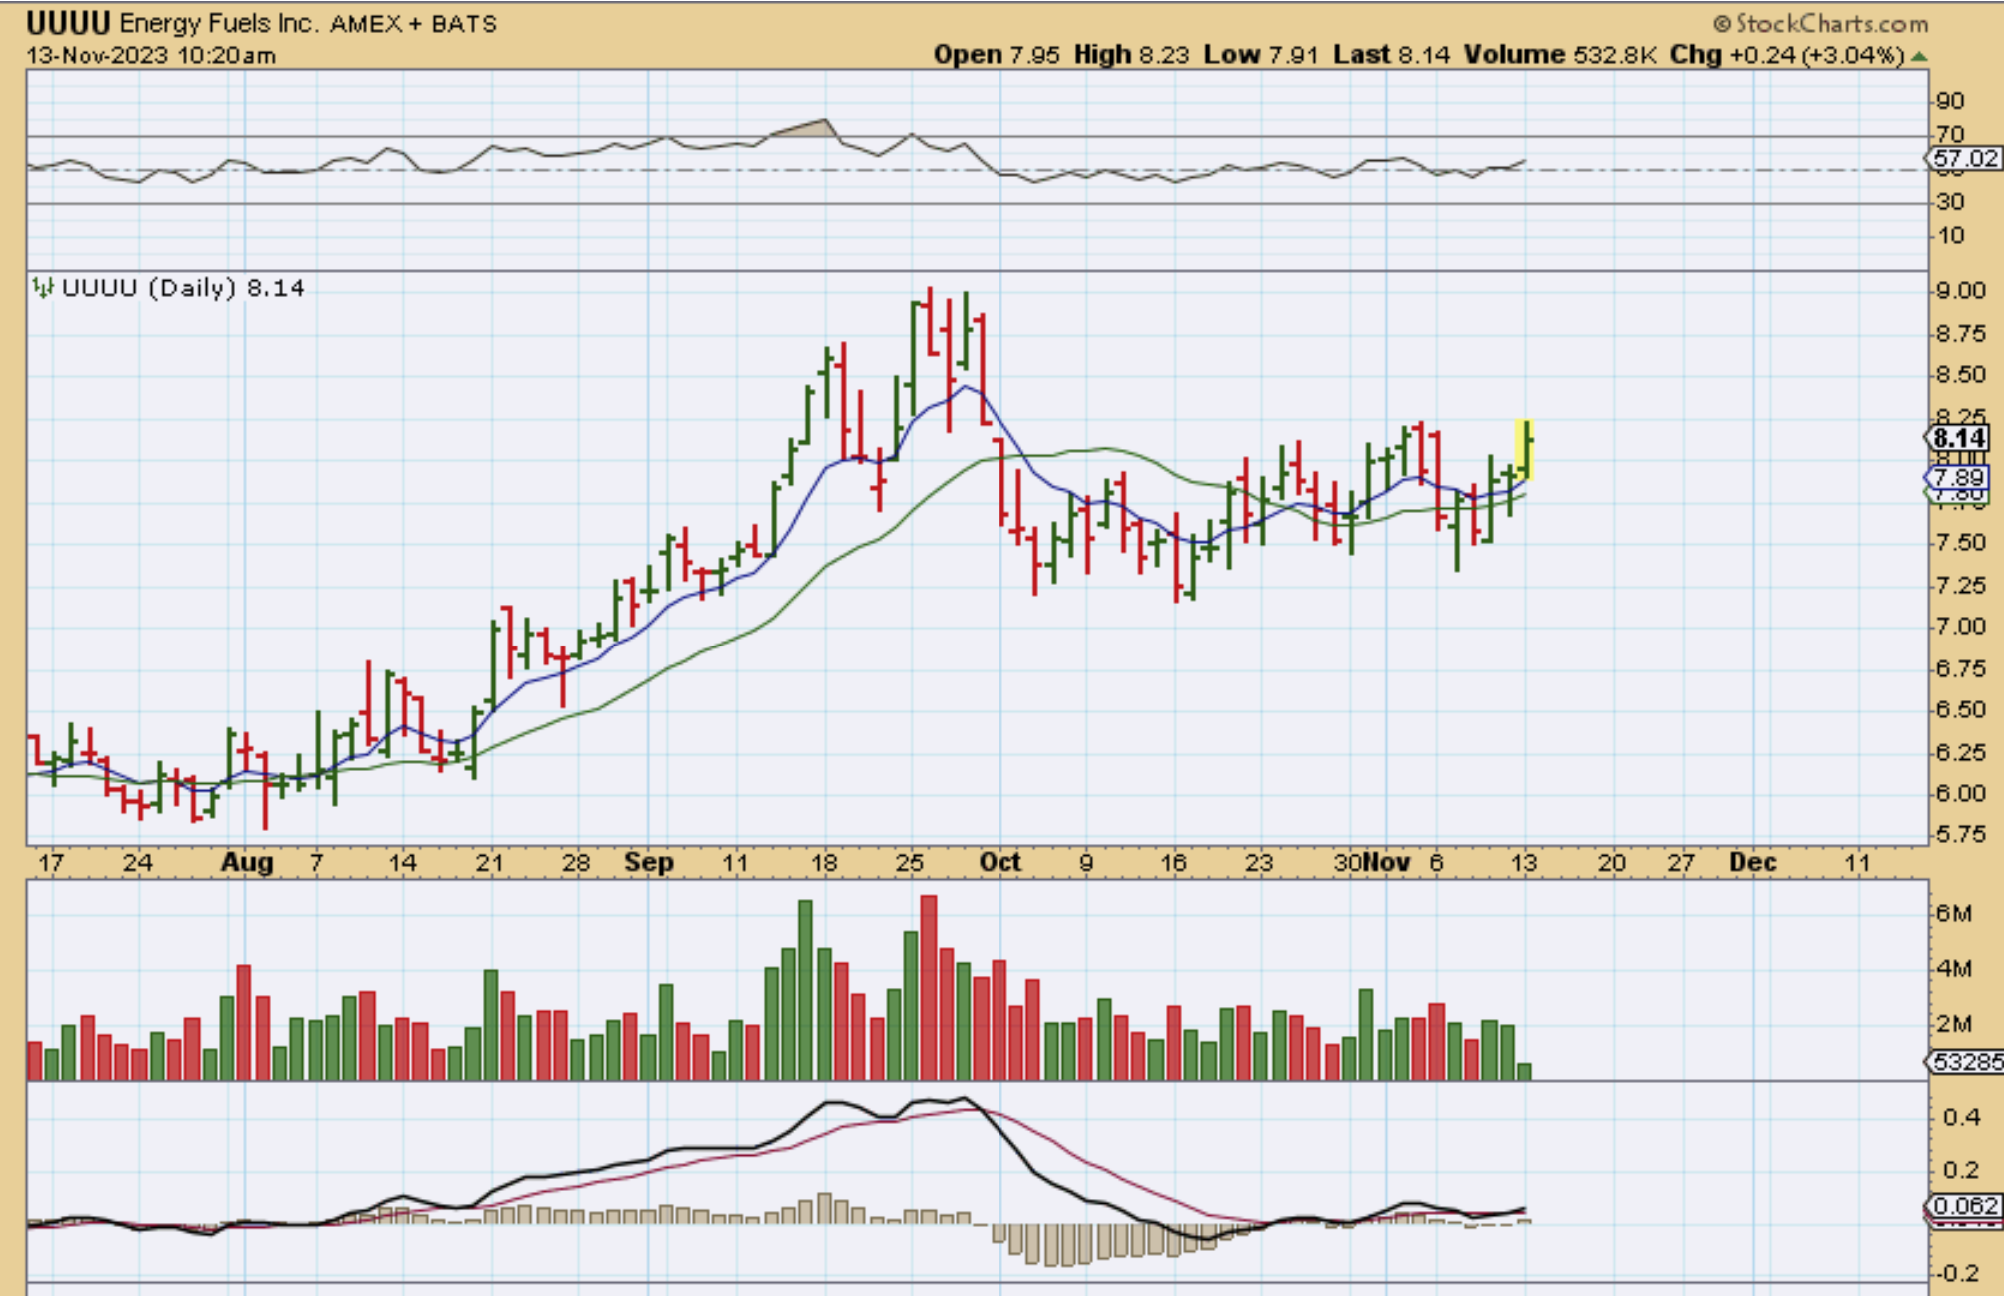
UUUU was another example at 10:20 am. It closed higher at $6.20.
.
CCJ & UEC are leaders, since they are already breaking to new highs, and DNN, URG, UROY, etc are all also bullishly set up forming cup-like patterns.