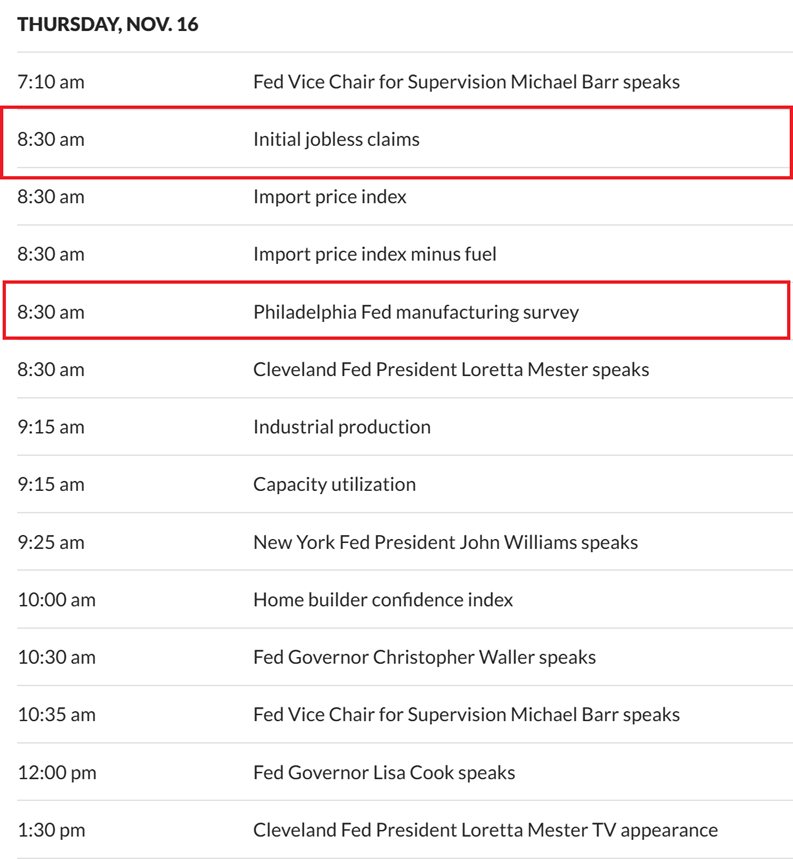
Thursday November 16th – Jobless Claims
Todays Economic Data has also been known to move the markets, but right now it has already been pretty well established that we have ICLs in place and the lows should hold for weeks and even months, so let’s review the charts…
,
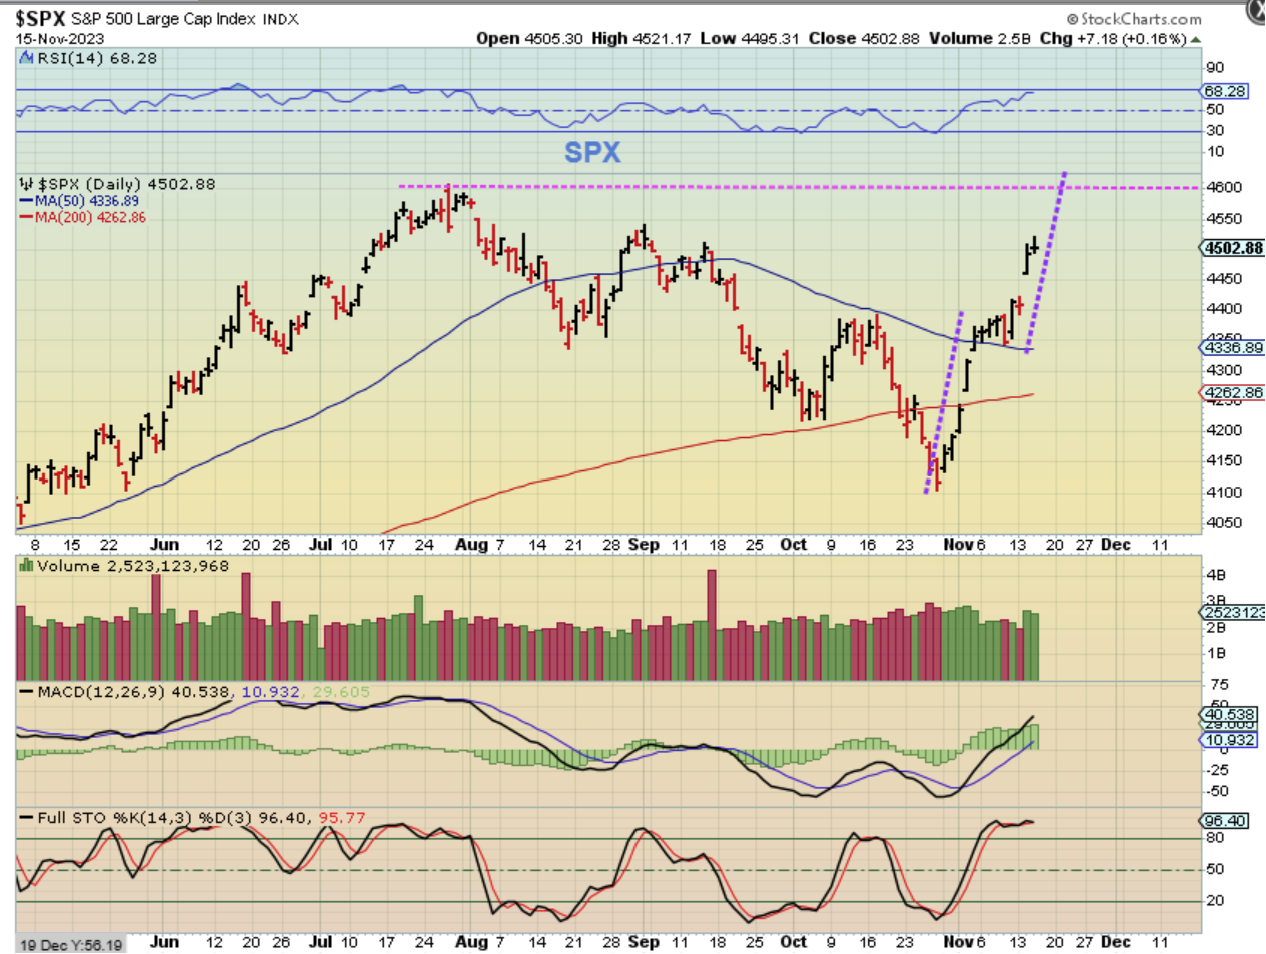
The SPX is on day 13, and we are seeing a move from the ICL to prior highs unfolding very quickly. Short term we may wonder if the gap fills on a 1/2 cycle dip or not, but even if it did it would be a nice buying opportunity.
,
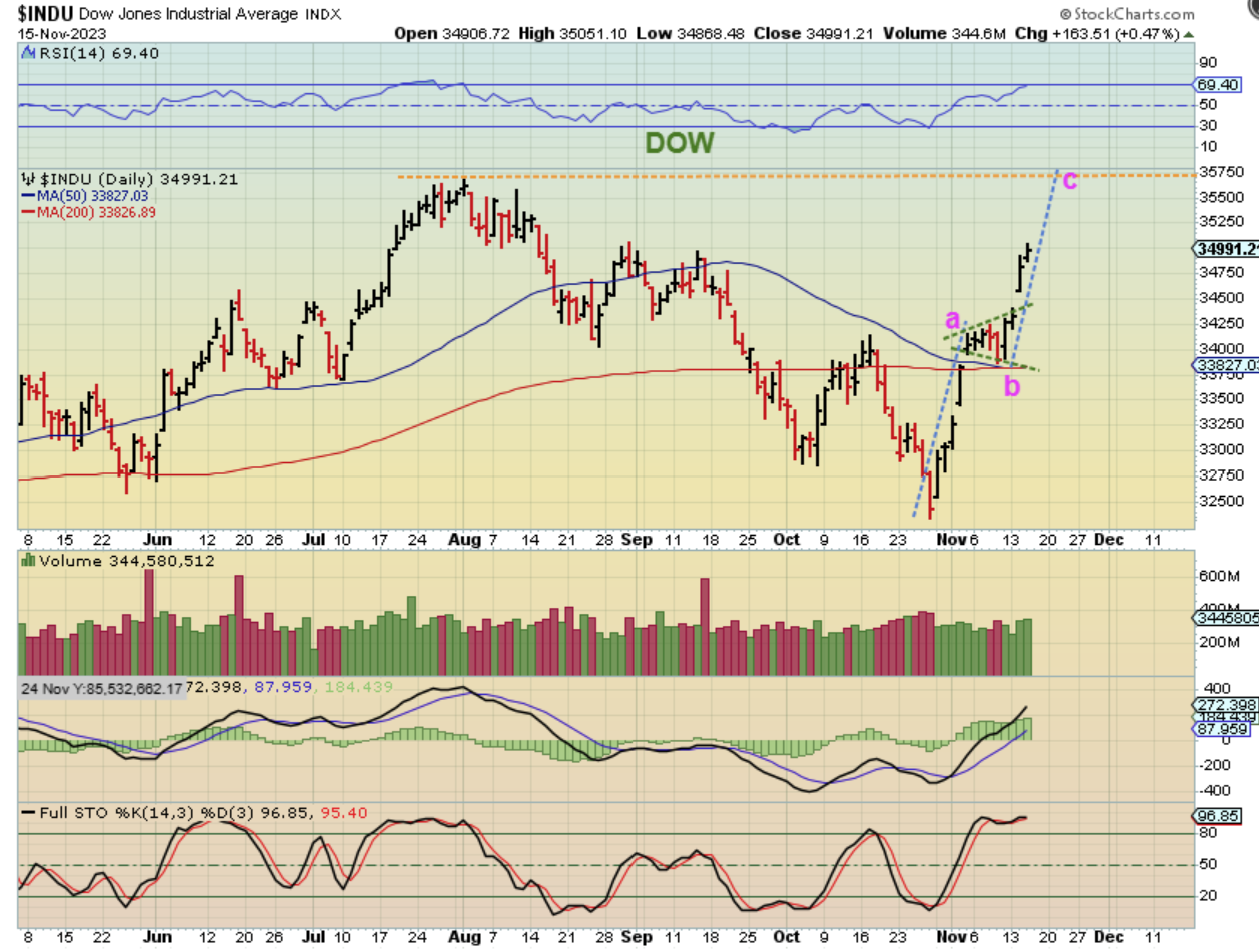
Look at The DOW chart as an example too:
Nov 1st was the Fed mtg. I remember that I flipped on CNBC to see the decision as it came in and I saw an analyst say that the Dow is extremely bearish since it looks like a bear cross (50 under 200sma) was about to take place. He warned everyone that it pointed to a recession no matter what the fed did, and gave a ‘sell’ or ‘go short’ due that coming 50/200 cross. At the same time, I was already saying that we should have an ICL and a Buy. Now it looks like a midpoint triangle formed at the 50 & 200sma, and it also wants to run to prior highs, so we had and have a very nice bullish set up. Cycles really do give us a little help with the ‘timing’.
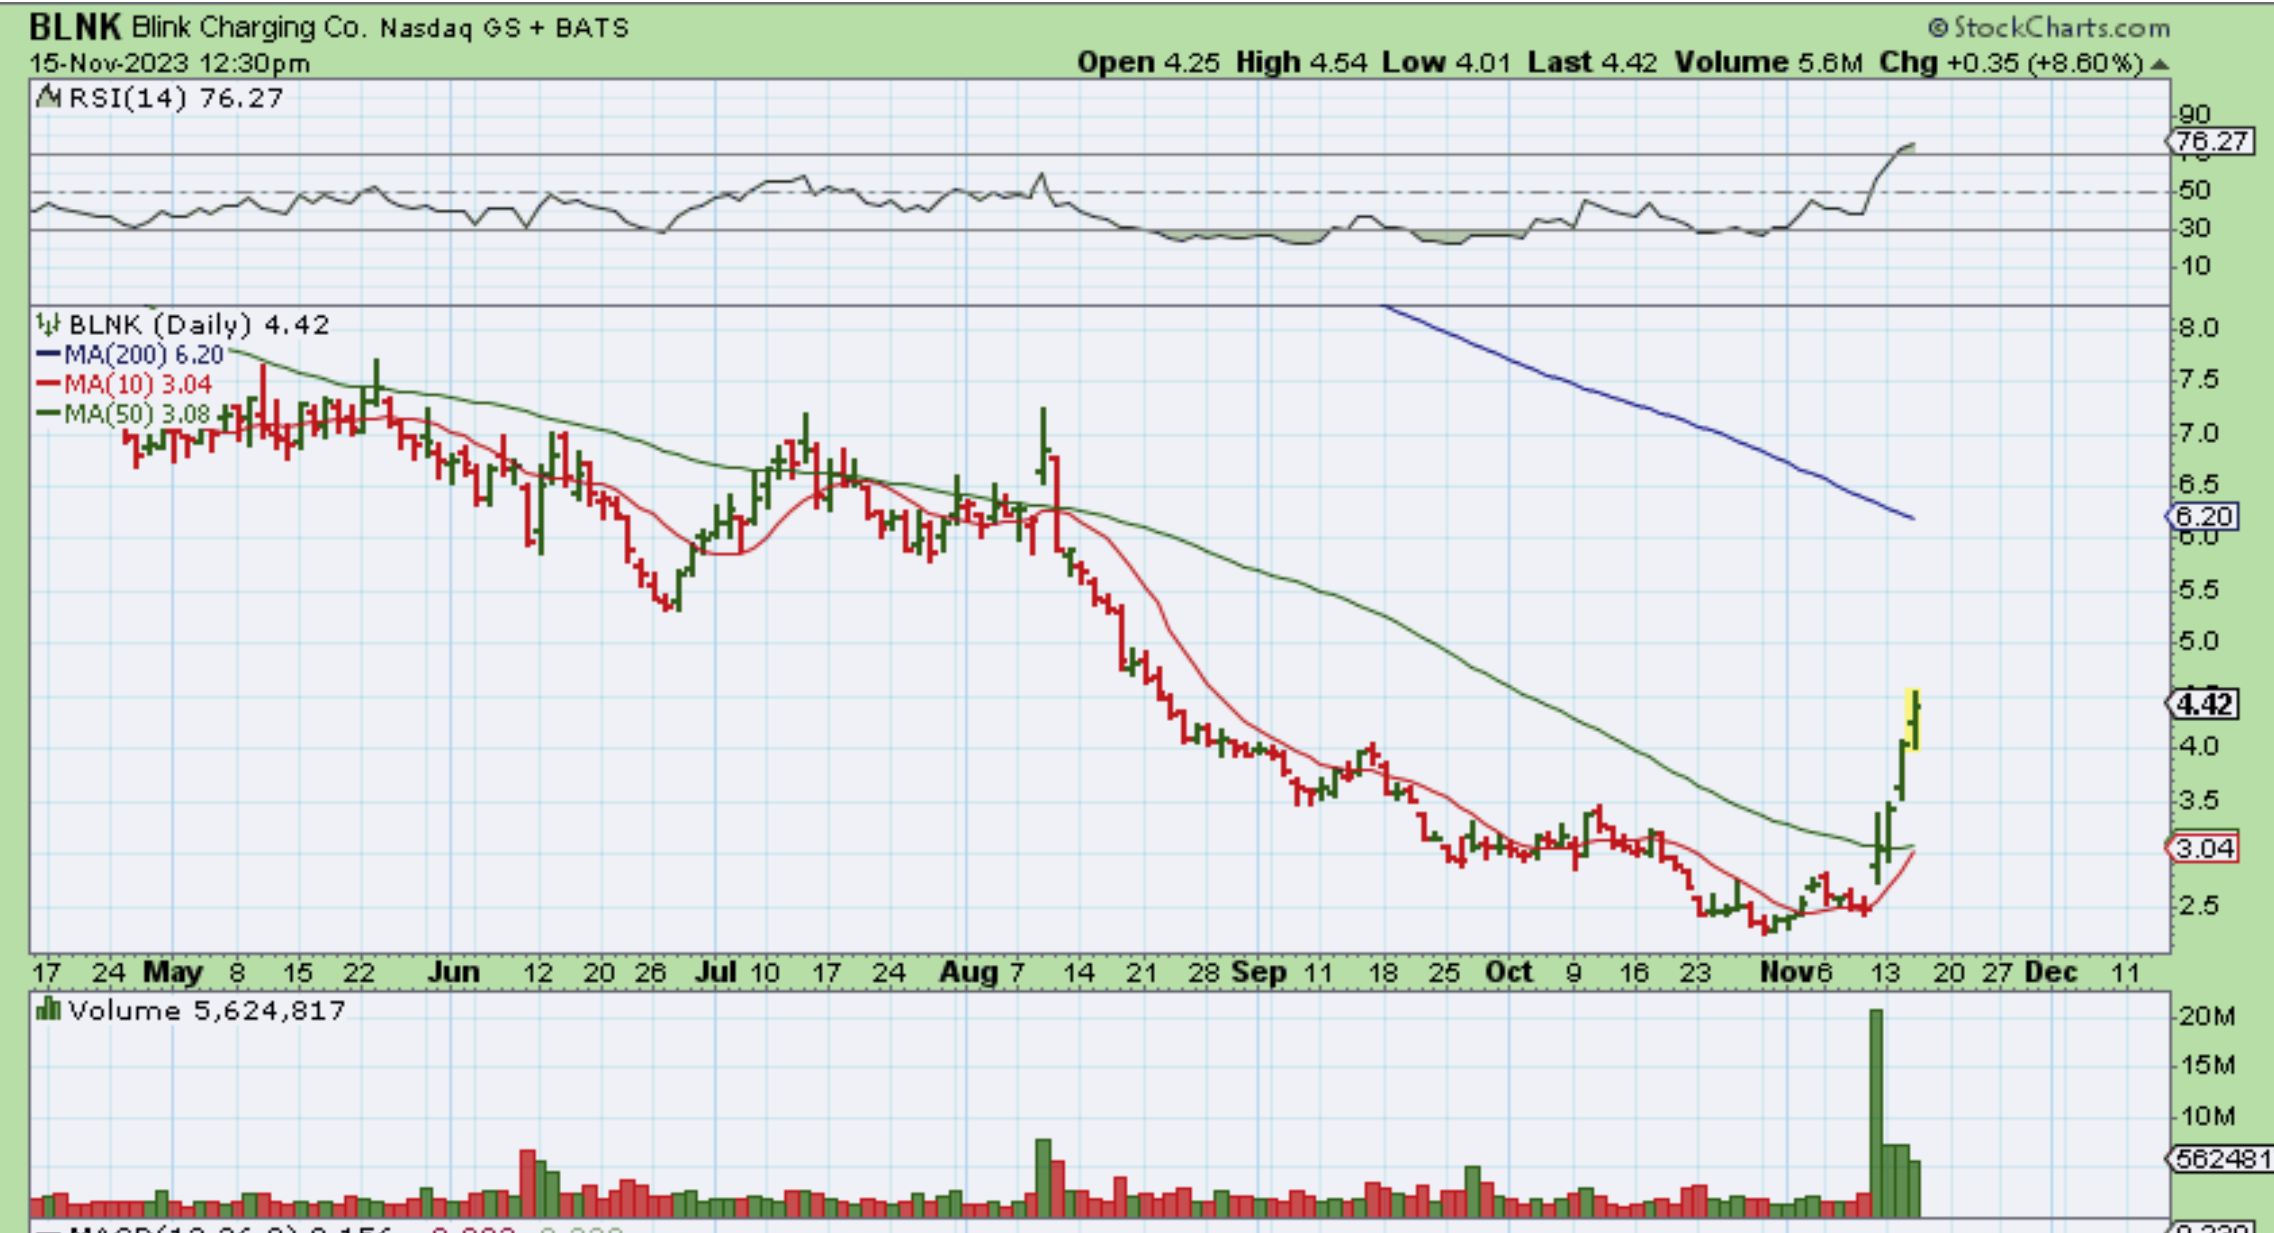
NOTE: Some of the small caps are running, and some of the stocks that have been basing are on the move again. For example TLRY, OGI, CRON, CRLBF, etc in MJ are moving higher. BLNK, BLDP, CHPT, HYZN, etc are starting to run. Check your watchlists and check your charts. I will try to include more in tomorrows report, but check out BLNK for example:
BLNK is up 80% in 4 days.
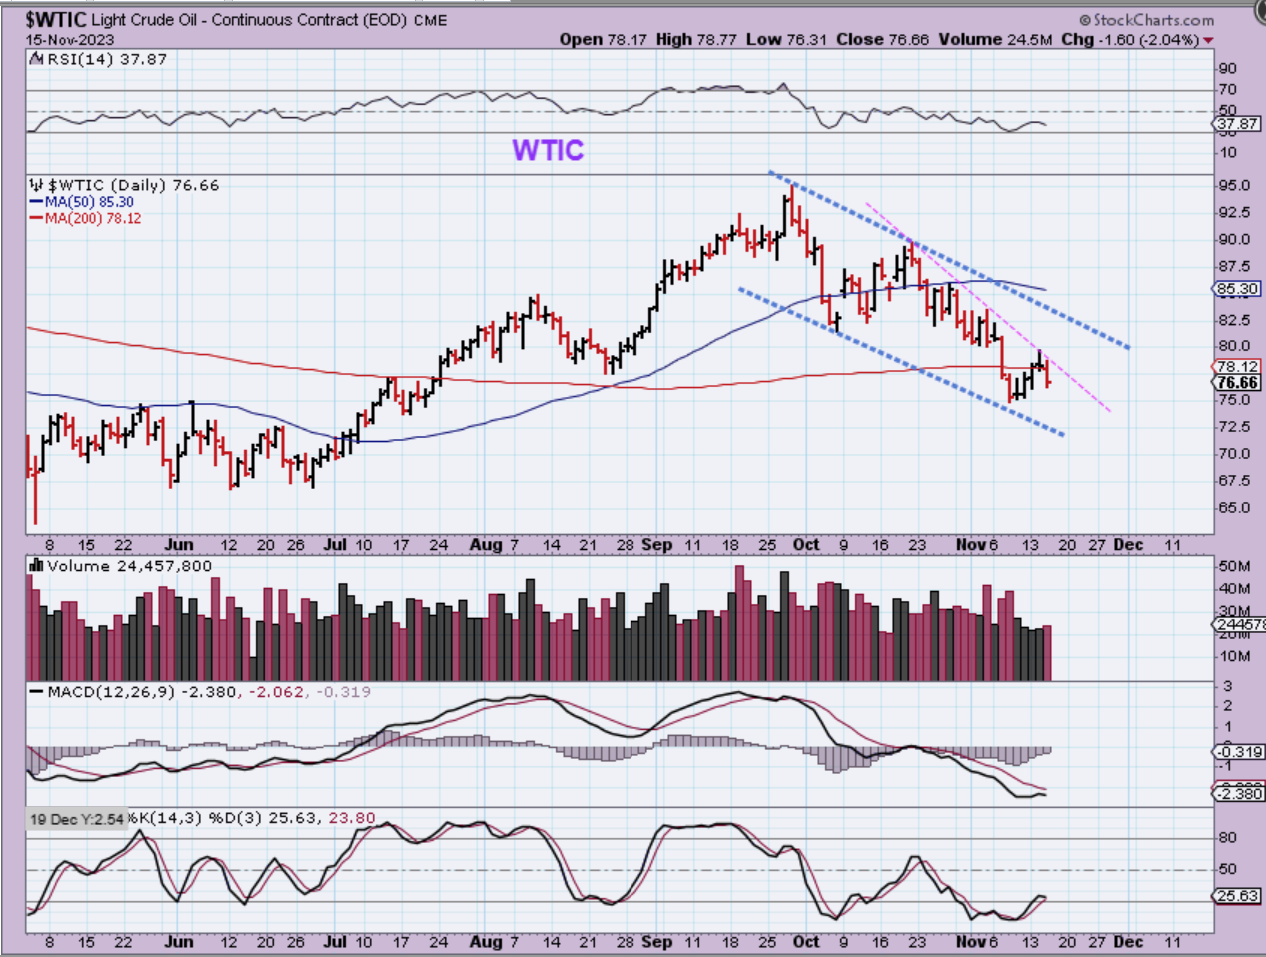
Yesterday I used this chart and mentioned that we should have a dcl, but we are watching for Oil to close above the 10sma to confirm that. Well…
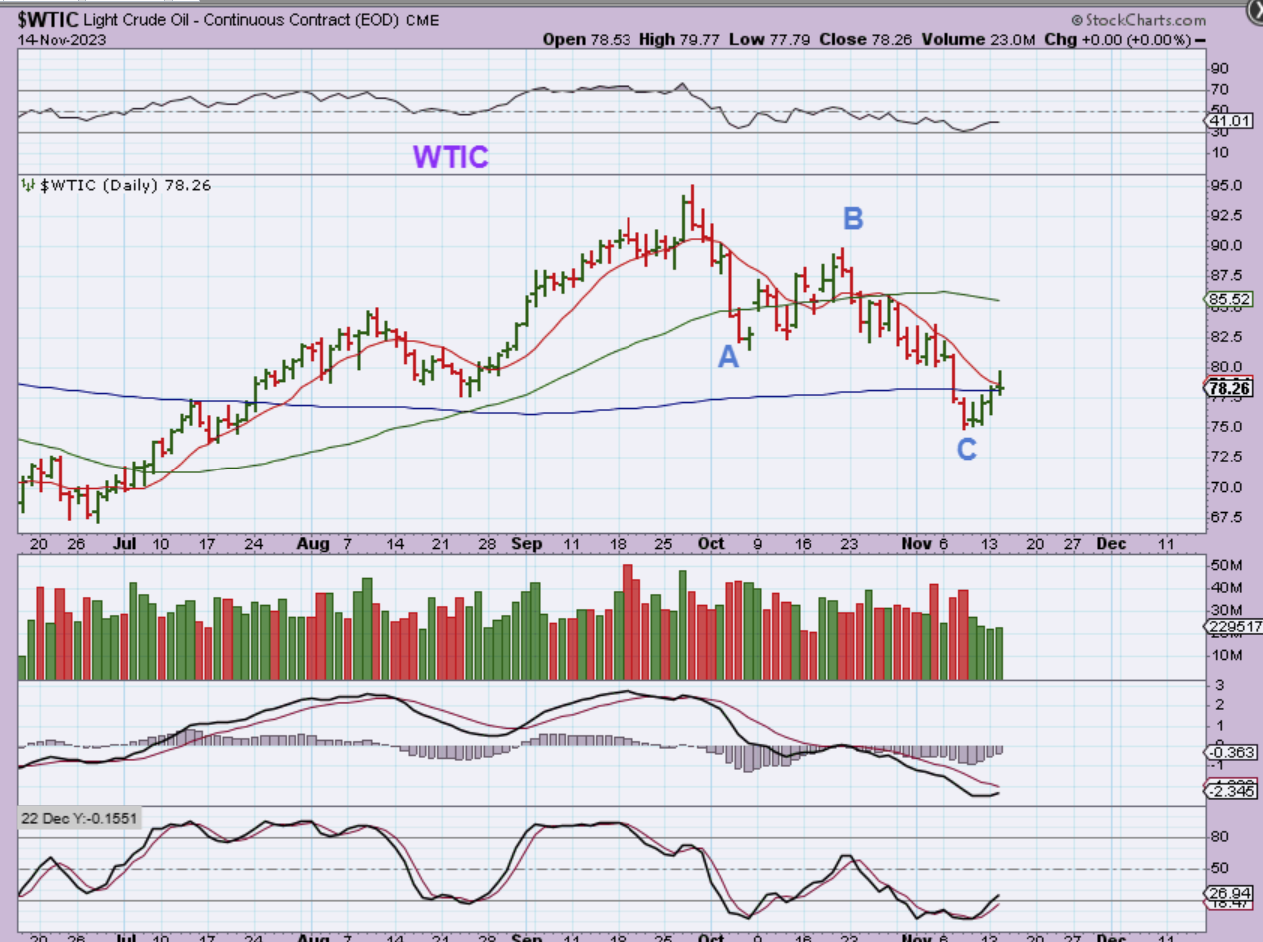
WTIC – Oil did not close above that 10sma yet. Look how weak Oil is. I thought that Oil would run to the 50sma and blue downtrend line on this bounce (and it still might), but so far it popped above the 200sma and then lost it again yesterday. I now see an even steeper downtrend (See my Magenta line) and we’ll see if Oil can get above that or not. That is where the 10sma is and this really should only be day 5 unless those lows are taken out.
,
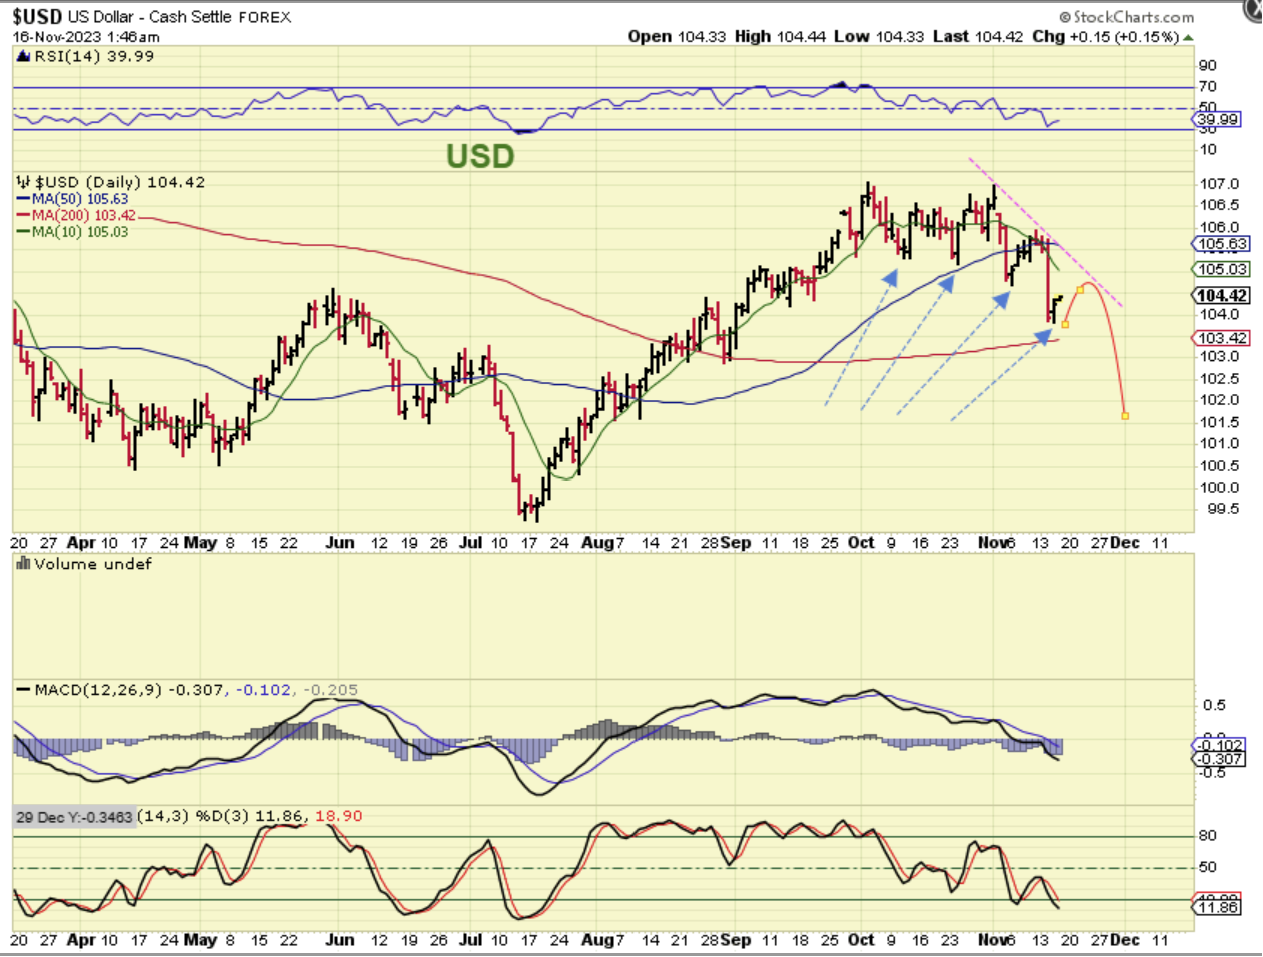
With the USD, I have discussed the sharp drop and bounces that followed, but the USD should be rolling over. I said yesterday:
We have been seeing a strong ‘1 day drop and then a slow multiday bounce’, so this looks like a Drop, Bounce, Drop, Bounce, Drop pattern so far. If this bounces Gold could pull back and offer a buying opportunity, but to be honest, I think that at some point Gold is just going to run and leave people behind too.
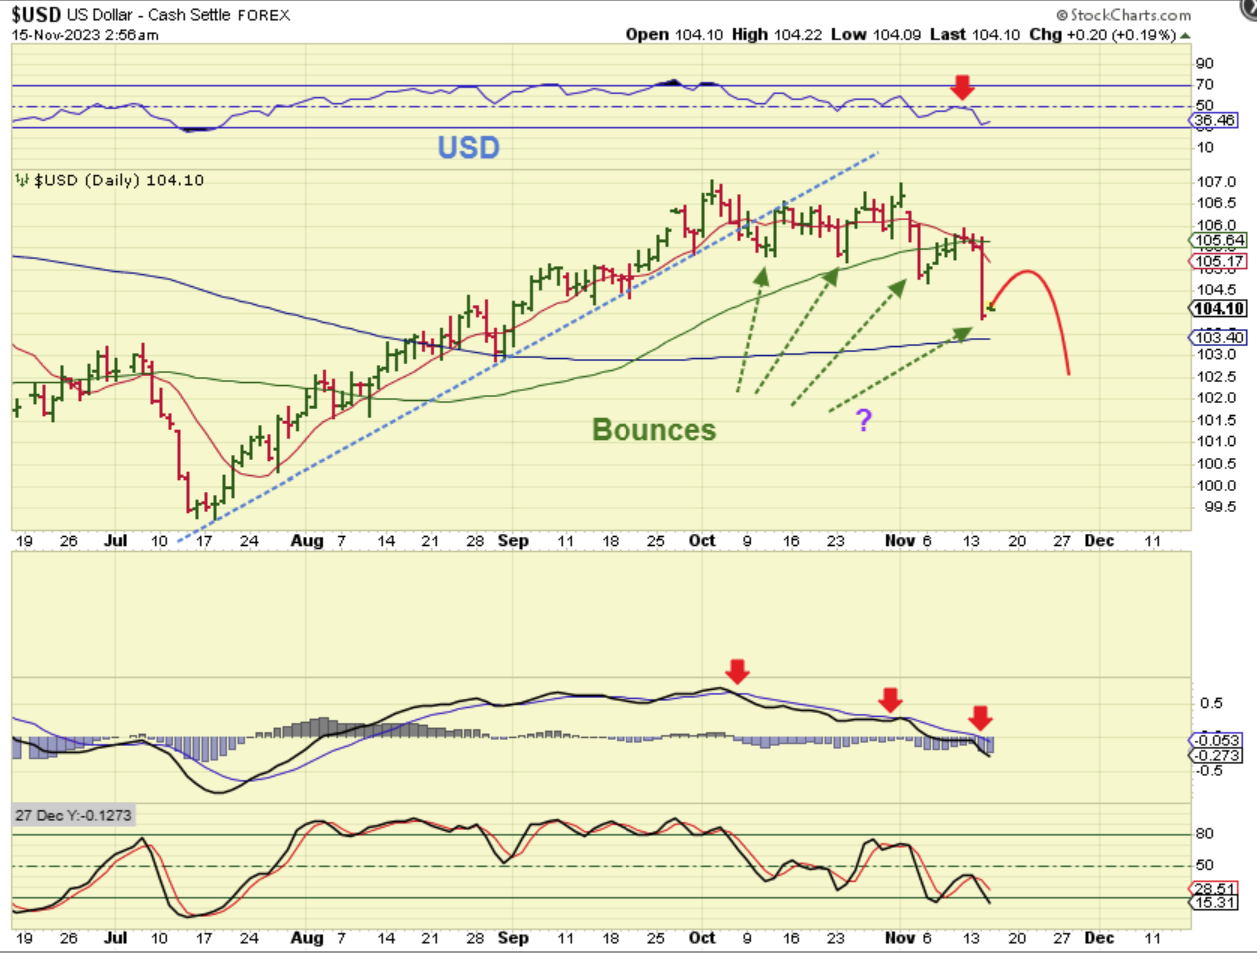
So The USD did start to push higher, but I do not expect a strong bounce. This caused Gold to ‘stall’ a bit and miners dipped in the morning, which allows for adding to positions if one wanted to.
,
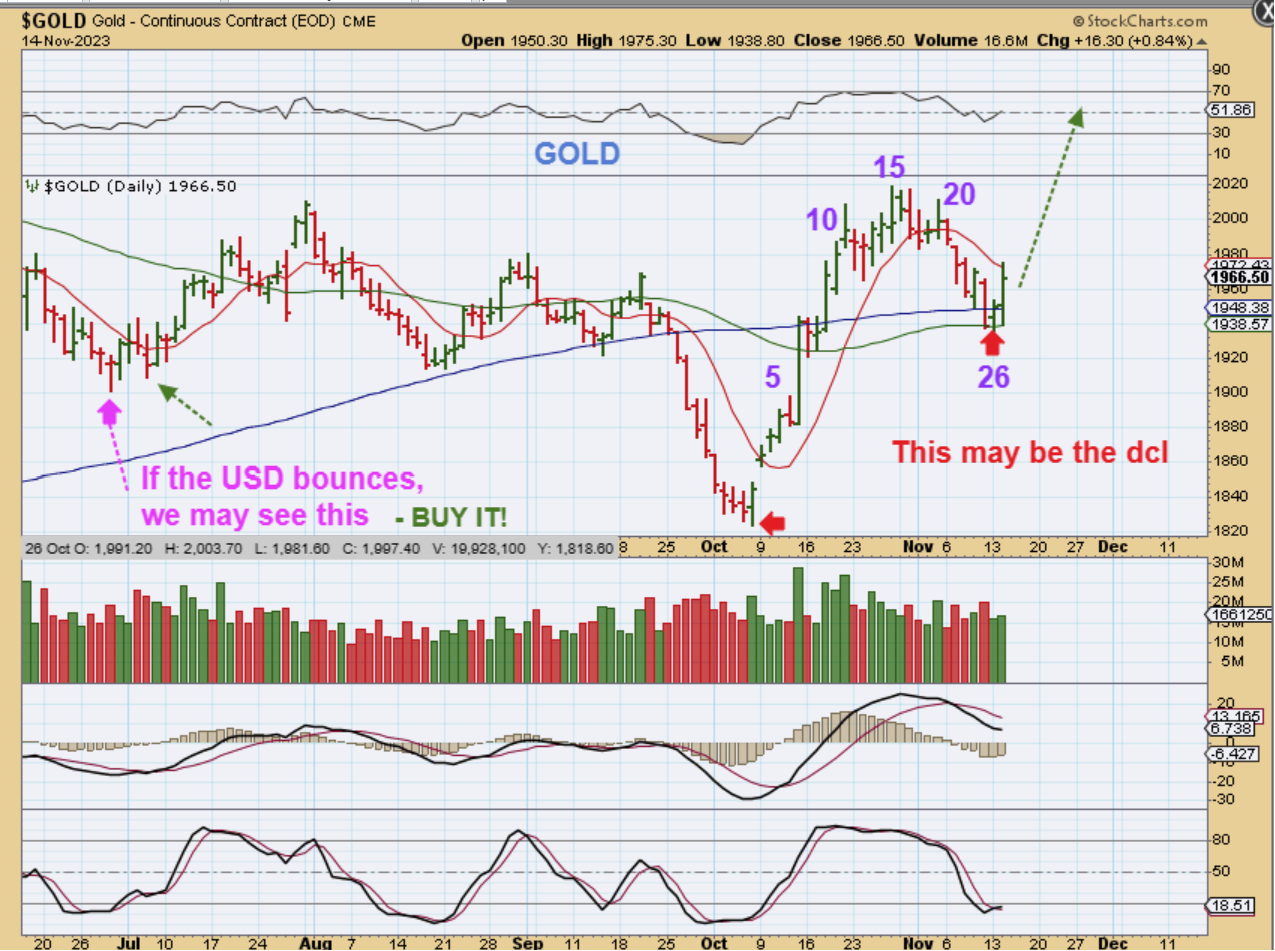
AS A REMINDER: Yesterday I discussed a possible early dcl followed by a dip with Gold. Gold found support at the 50 & 200sma, so a dcl is very possible. I said:
GOLD could just follow through higher or if that USD does that Bounce, drop, bounce dop , and bounces 1 more time, Gold could do what we saw in past swing lows (a small curl down before running higher). Either way, this second daily cycle looks like it will be the strong run to break out to all time highs.
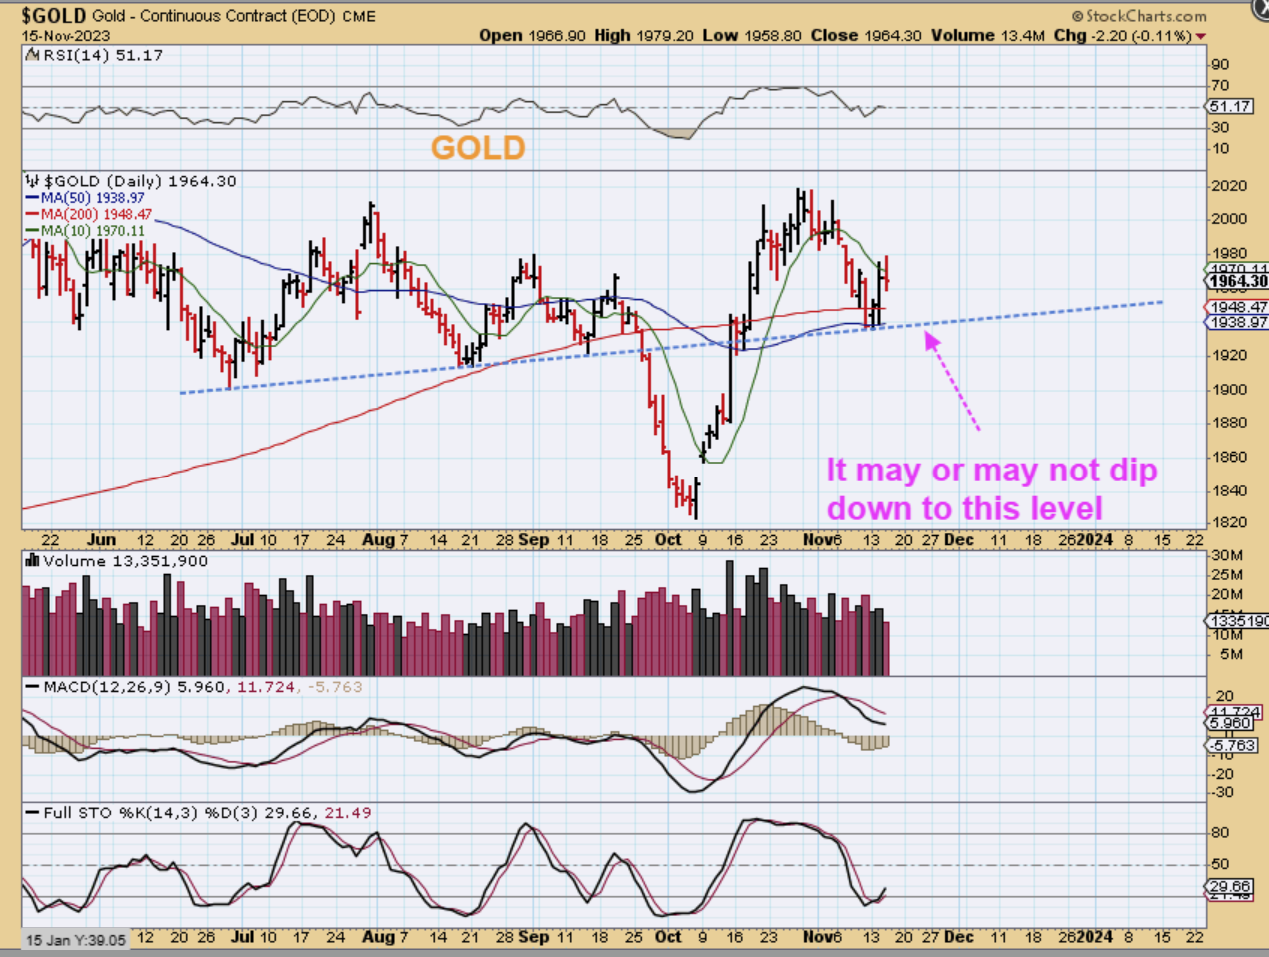
GOLD paused and it has not closed above the 10sma to confirm the swing low, but this does still look like an early dcl. Gold can dip back to the lows, but dips are buying opportunities with an ICL in place.
,
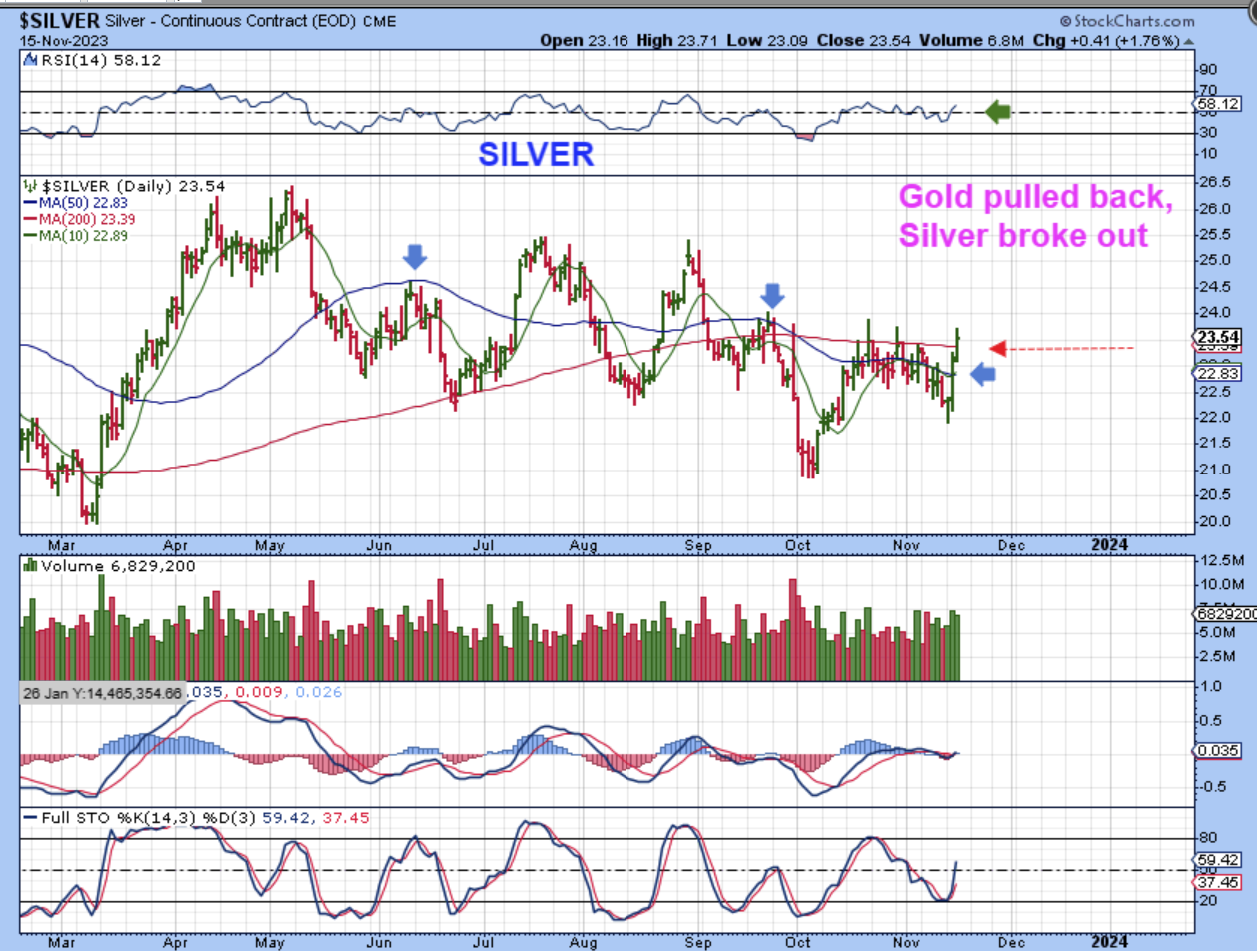
SILVER did NOT dip. This is nice to see, since it now looks like Silver wants to take the lead higher. Silver stocks lagged during the whle move out of the ICL for Gold in early October. They look bullishly aligned now and may play catch up. Silver has now also closed above the 50sma and now the 200sma.
,
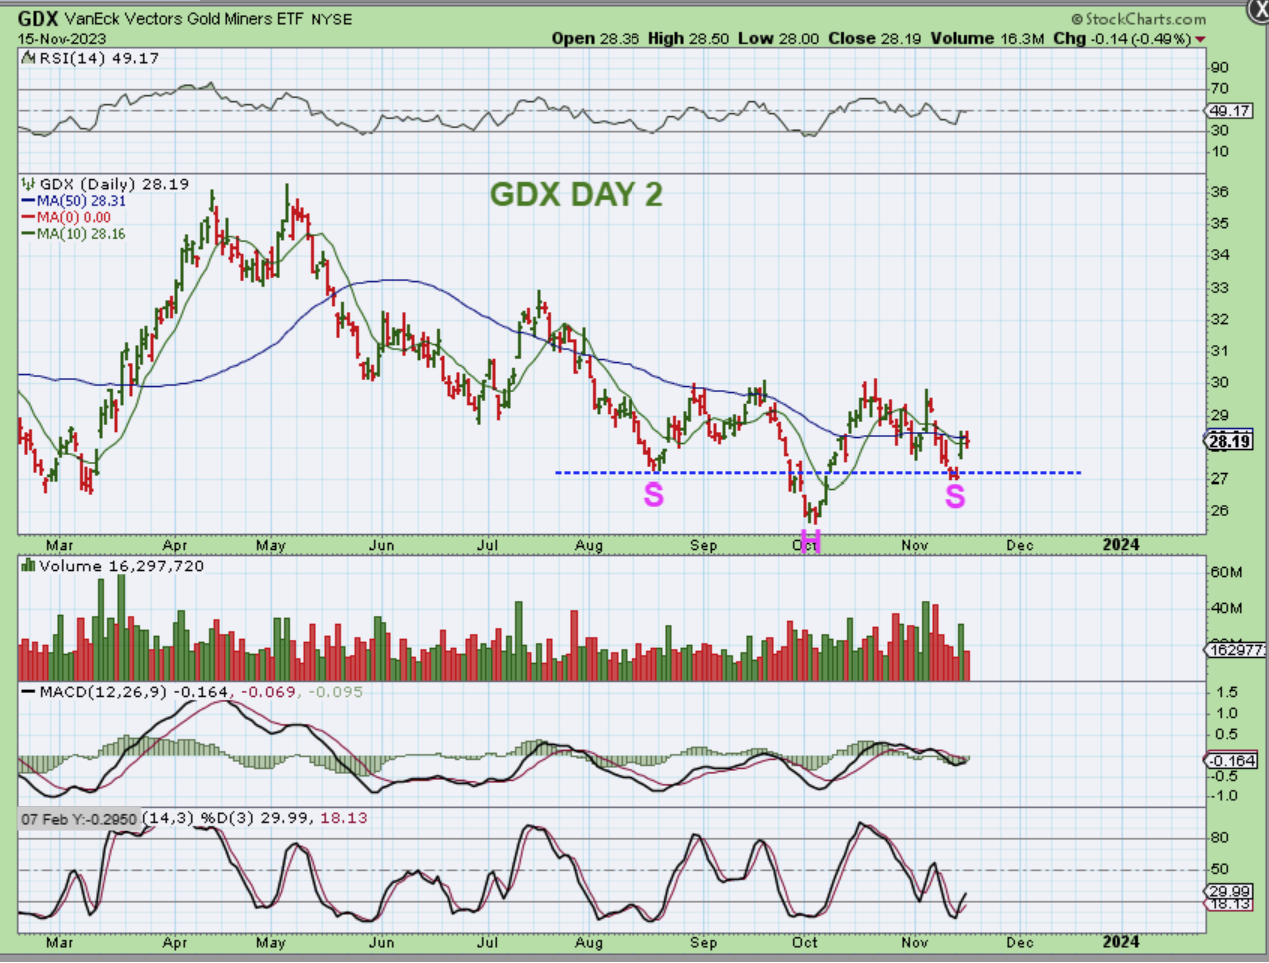
GDX or the Miners paused yesterday. This really should be day 2 of a 2nd daily cycle and this looks like an inverse H&S that will eventually run higher. We do have a gap and a gap fill and reversal would be a buy opportunity again, but this might just push higher from here.
,
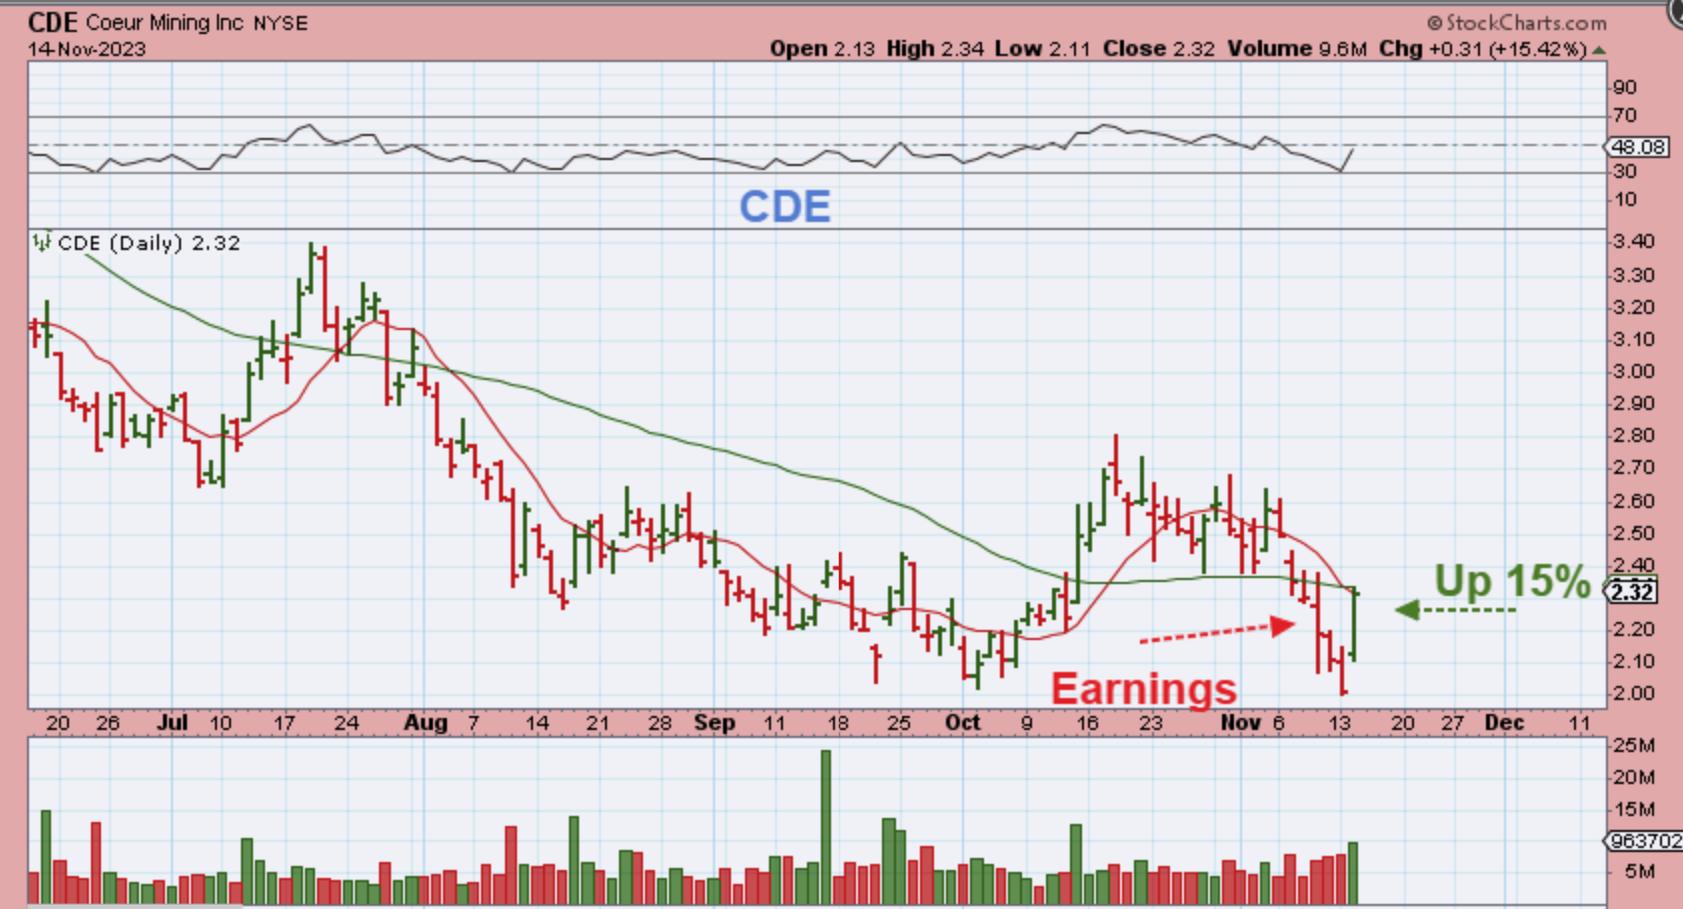
I wanted to point out that many Silver stocks crashed after they released their earnings, but those losses have already been erased. So with Silver miners like CDE, I feel that this is a bullish development as they start to recover with Silver.
,
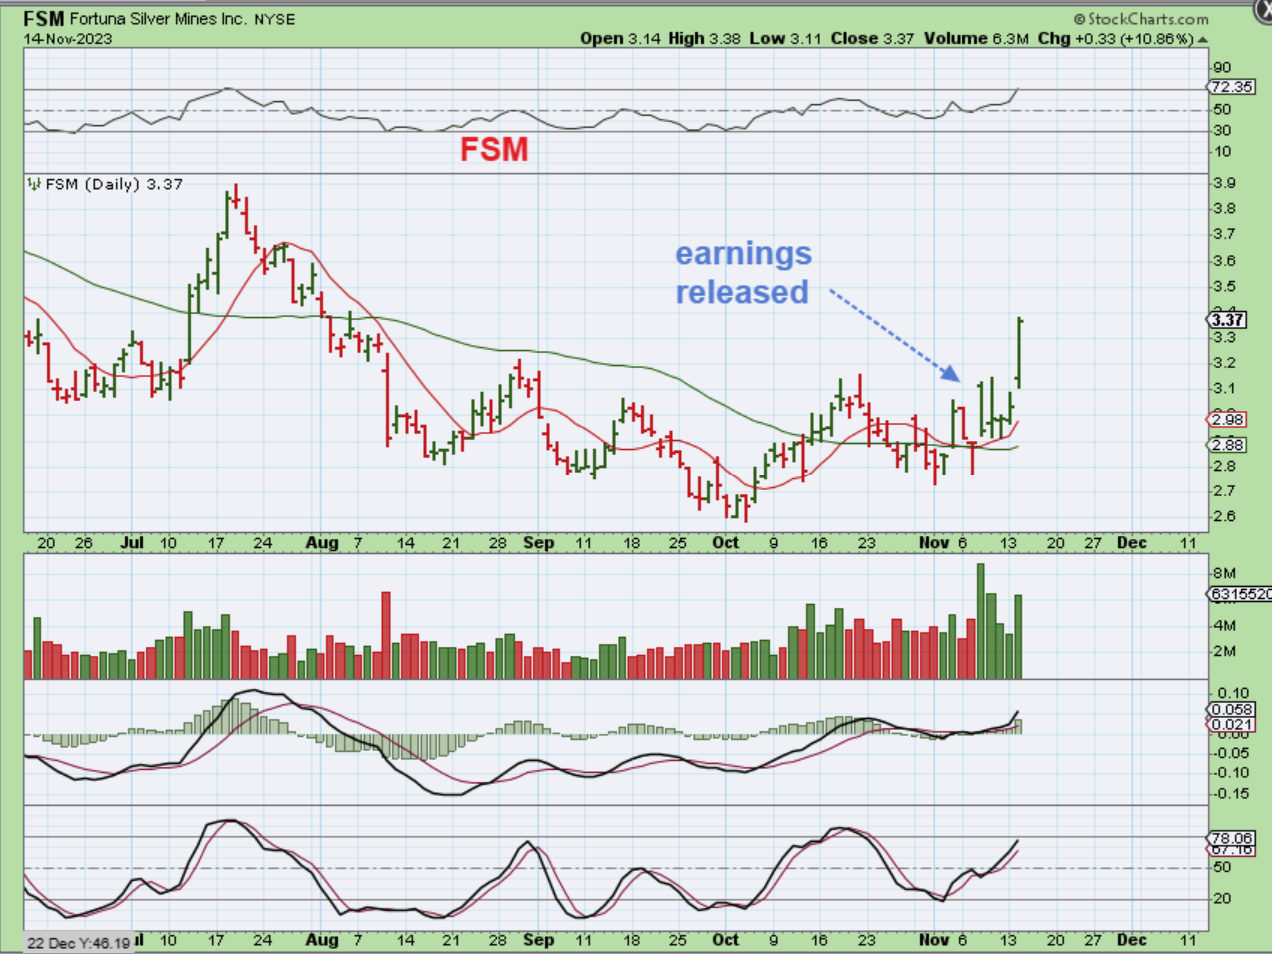
FSM released good earnings and is now a leader. Buy the dips on FSM.
,
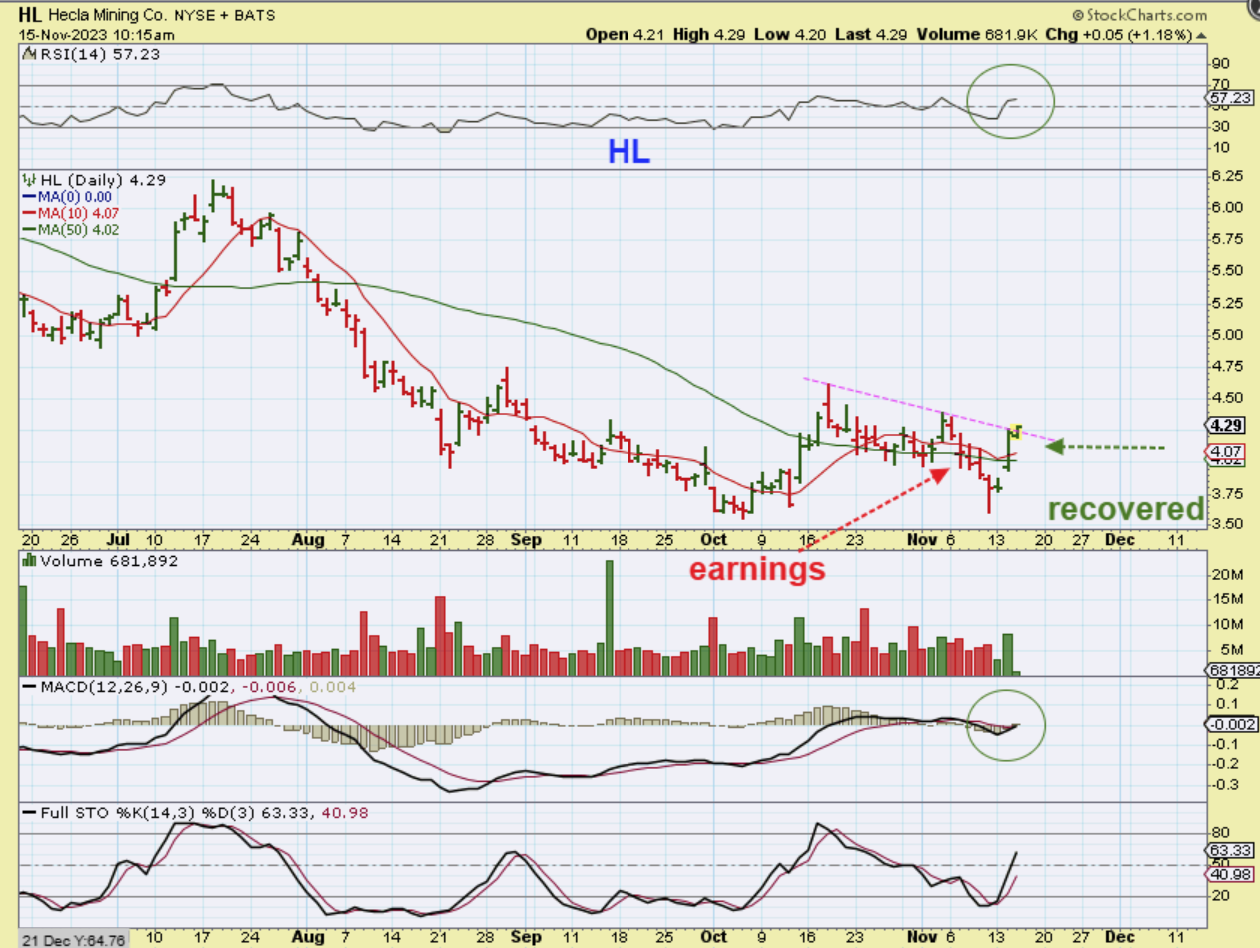
HL dropped on earnings too, but those losses were quickly erased. HL looks ready to break above a downtrend line and it is already above the 50sma.
,
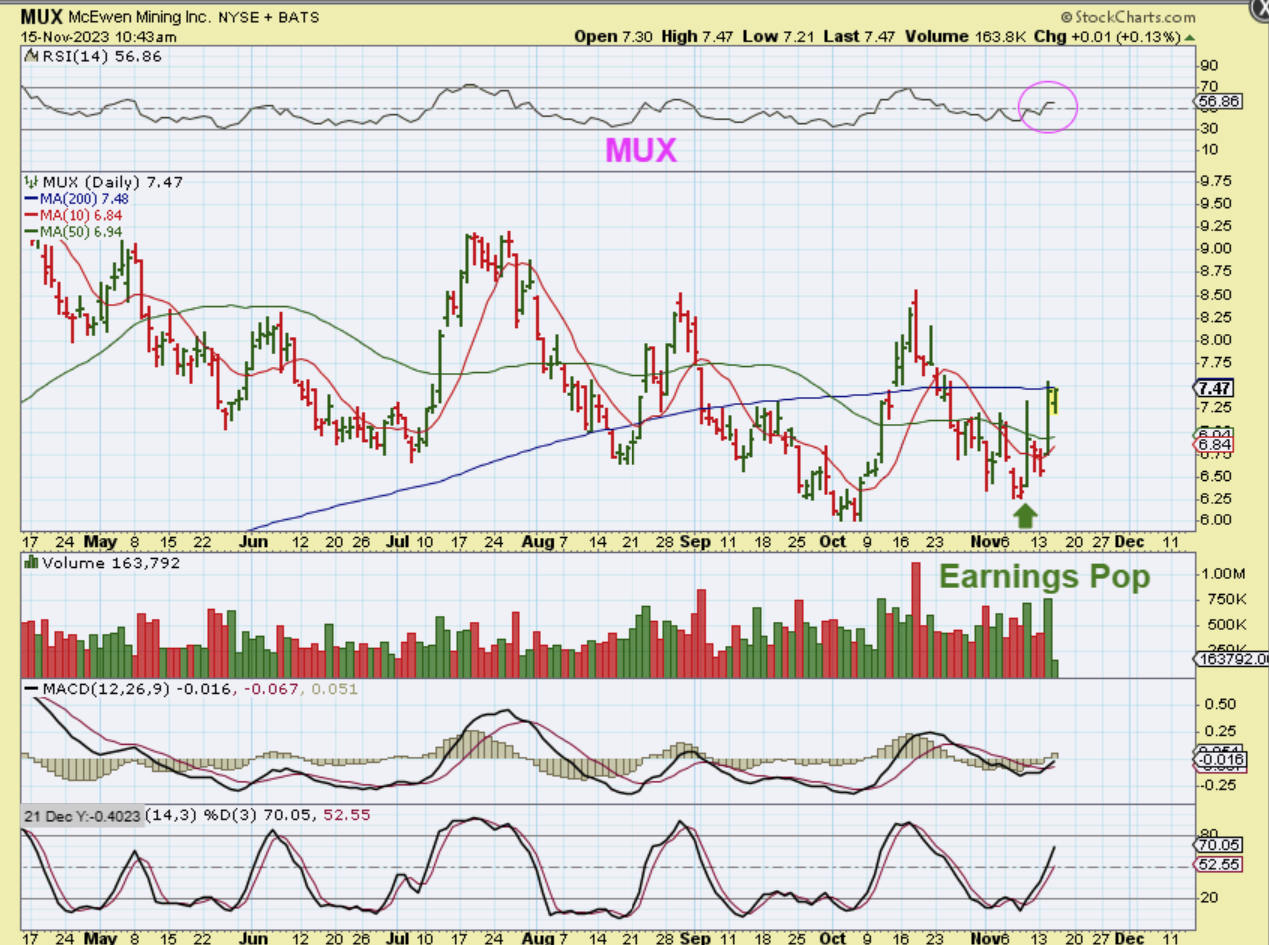
MUX actually Popped on earnings, paused, and is trying to continue higher. The chart is a bullish base and so MUX is a buy for those reasons.
.
We do not have a confirmed swing low in Gold, since it didn’t close above the 10sma, but it does resemble an early dcl. If Gold dipped down and slightly broke those lows, that would be a low on day 30 or so and that would even be better for those looking to add to positions, but I just don’t know if Gold will drop that low again. We are in a buy the dip mode for the General Markets and Precious metals, because both do have an ICL in place. We have the jobless claims released at 8:30 and we’ll see what direction that takes the futures. I will also cover a little more below with Bitcoin & Crypto. Enjoy your Thursday trading!
.
~ALEX
.
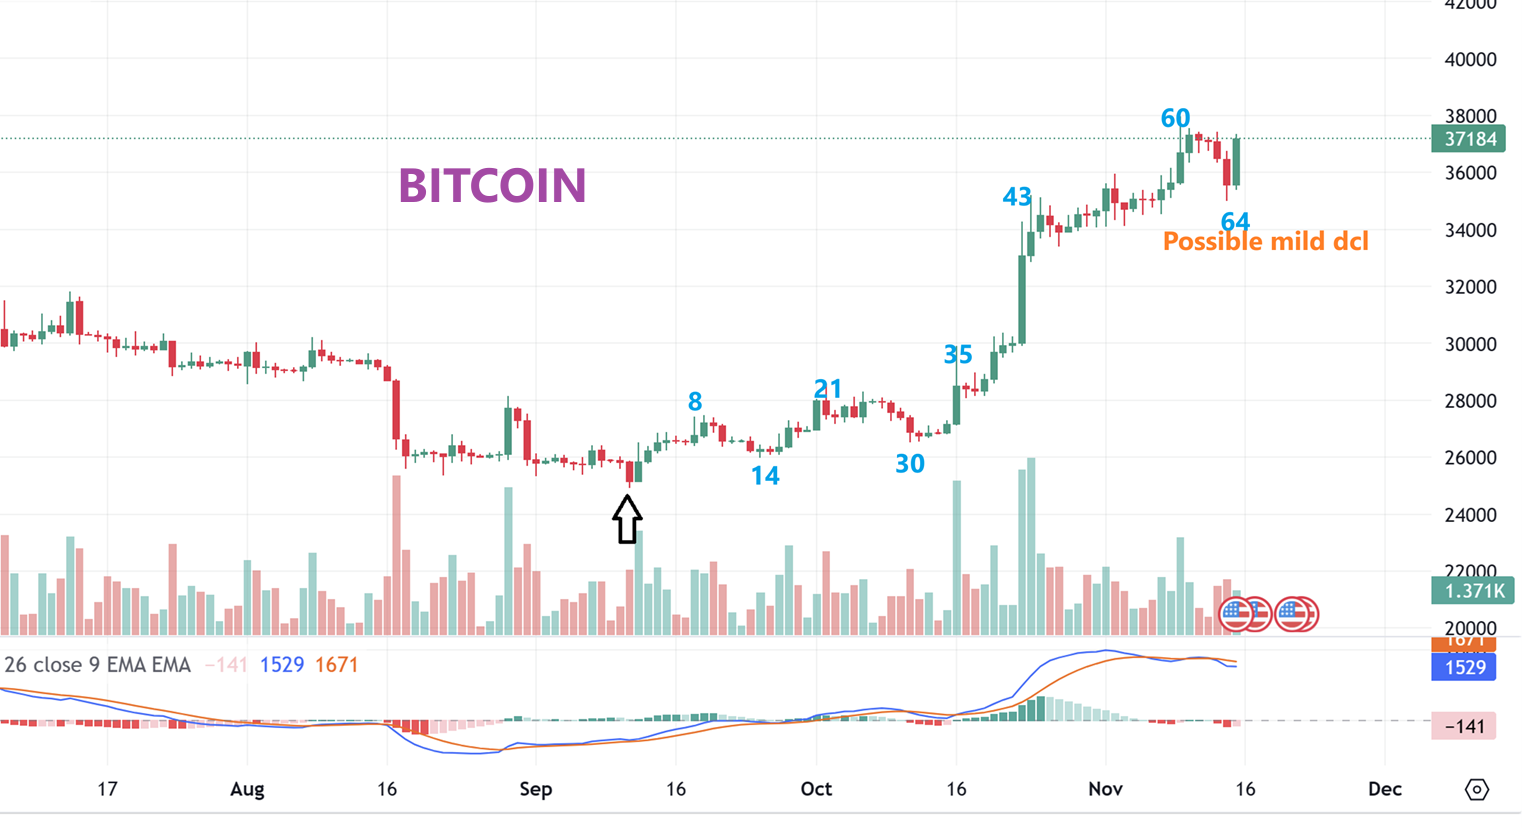
BITCOIN dipped down on day 64, and day 60 is when a dcl is due, so I am thinking that this was a strong move out of an early ICL (the 60 day run, with a day 30 dip), and that may be all we see for a dcl. Look at the 4 day dip into day 30 and it looks very similar to the 4 day dip into day 64 dip. It is hard to believe that Bitcoin is THAT strong and crtypto stocks are not following, however, when I look at those stocks now–they have become bullish bases. Will they run on the next push higher?…
.
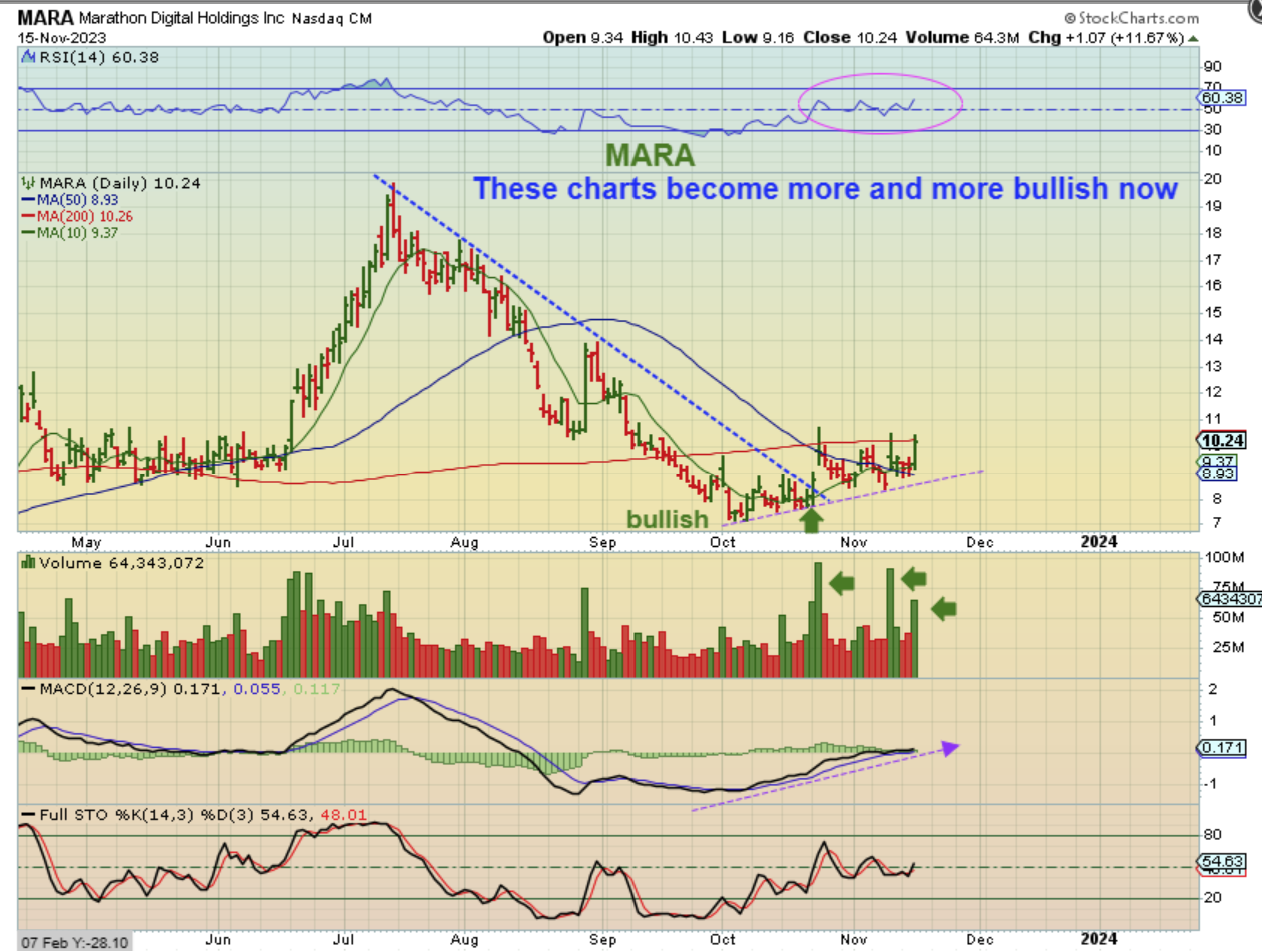
MARA is a base with higher lows now and it is battling the 200sma. This is a bullish base, so I am wondering if these will now start to run with Crypto currencies? They CAN play catch up very very quickly if they do, so a small position may be warranted (Hard to hold, but it could pay off if these break & run). Or buy on a break out of the 200sma.
.
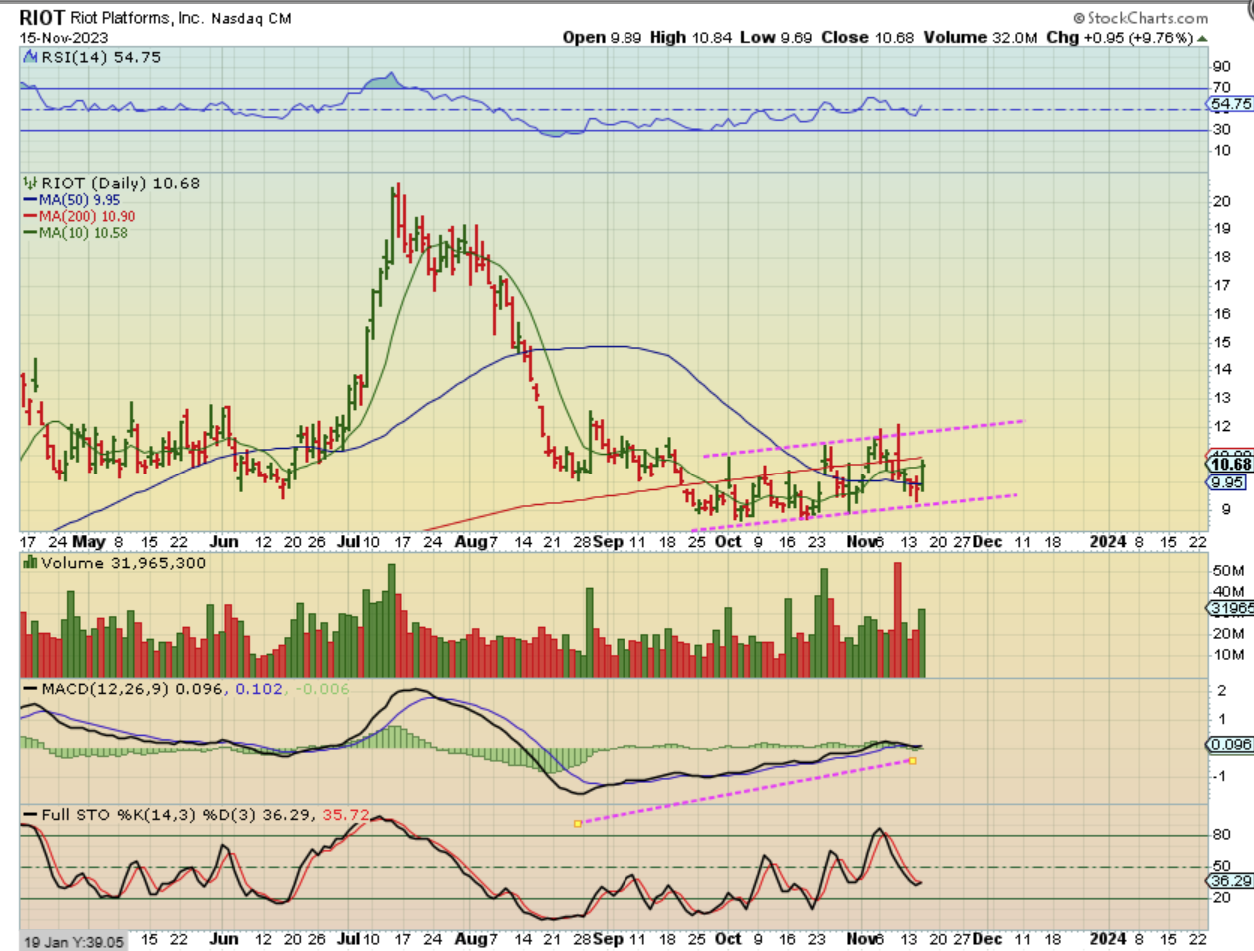
RIOT is also a series of higher lows and also challenging the 200sma.
.
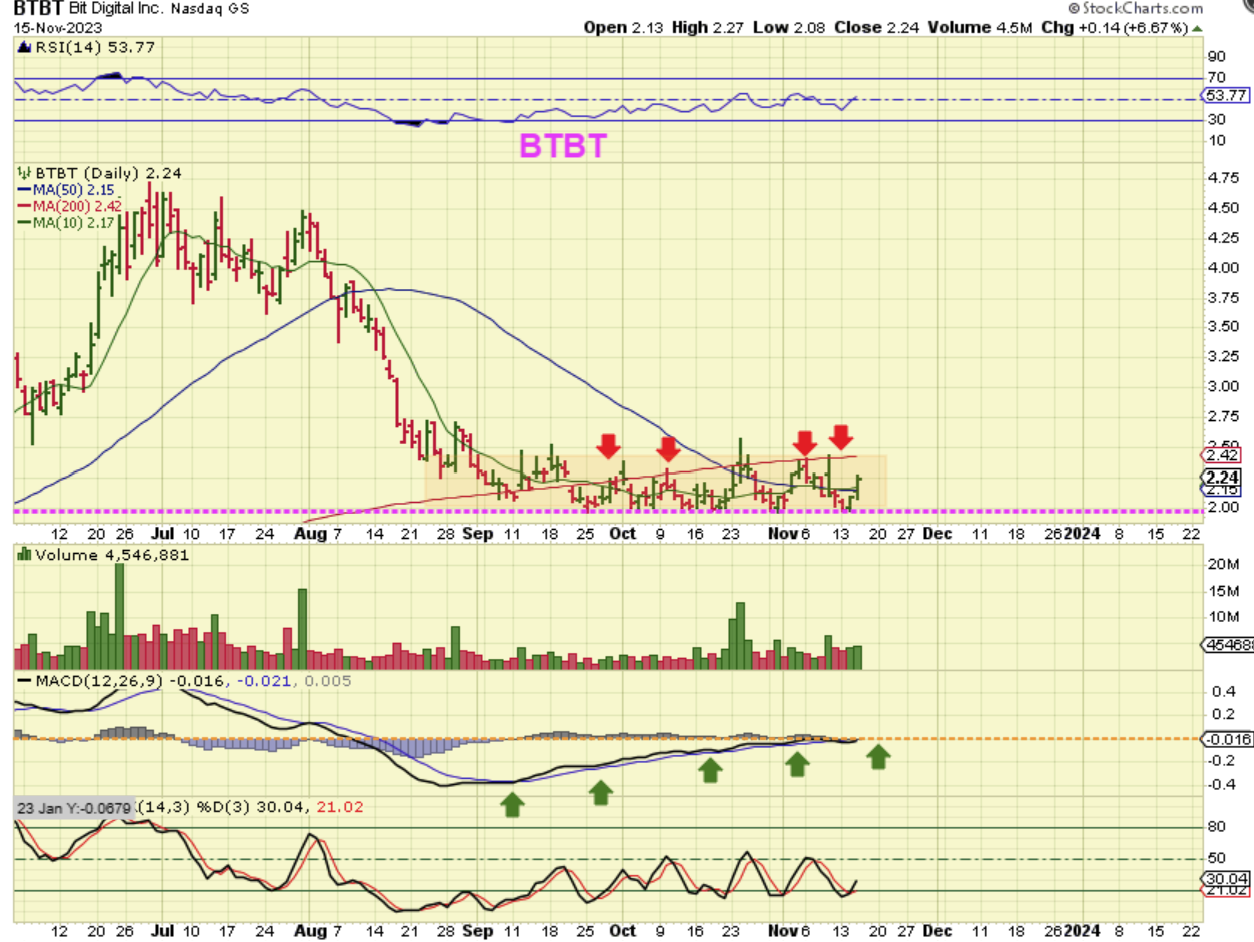
BTBT released earnings 2 days ago at the lows and has pushed higher for the last 2 days in a row. This is a flat bottomed base and an easy buy & hold, since the lows at $2.00 represent a nice stop. I did buy a position in this just to hold and watch it.