
November 11 Weekend Report
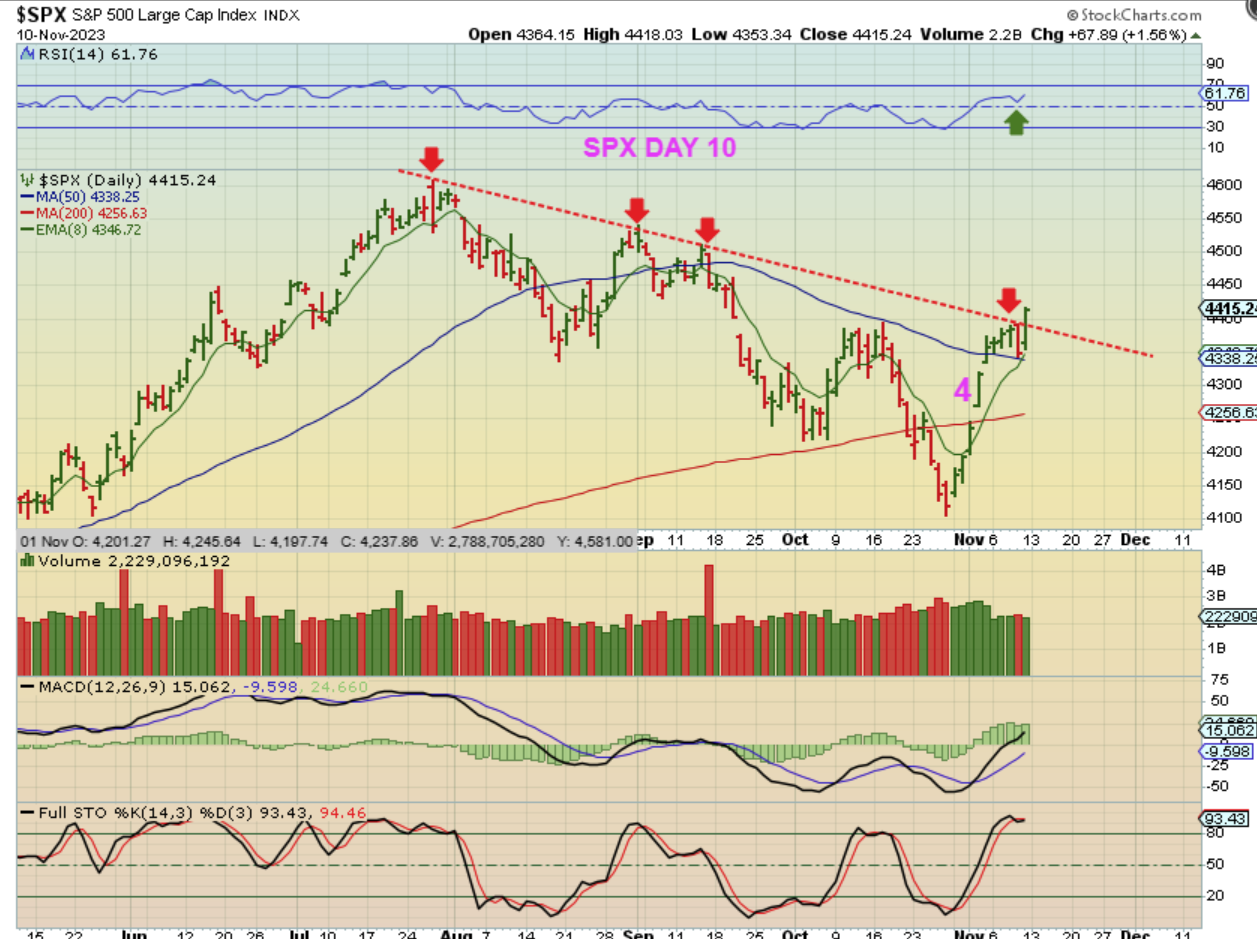
THE SPX sold off at resistance on Thursday and it appeared that the strong rally out of the ICL would now stall and possibly crawl sideways in order to break out above the trendline. Friday the General Markets pushed higher with a strong surge and the rally continues. Let’s take a look at the big picture…
On The SPX WEEKLY CHART we took note of the deeper drop below the blue 30 week ma, but that has now also been recovered, and price is back above the 30 week ma again. That is an additional sign of bullishness. 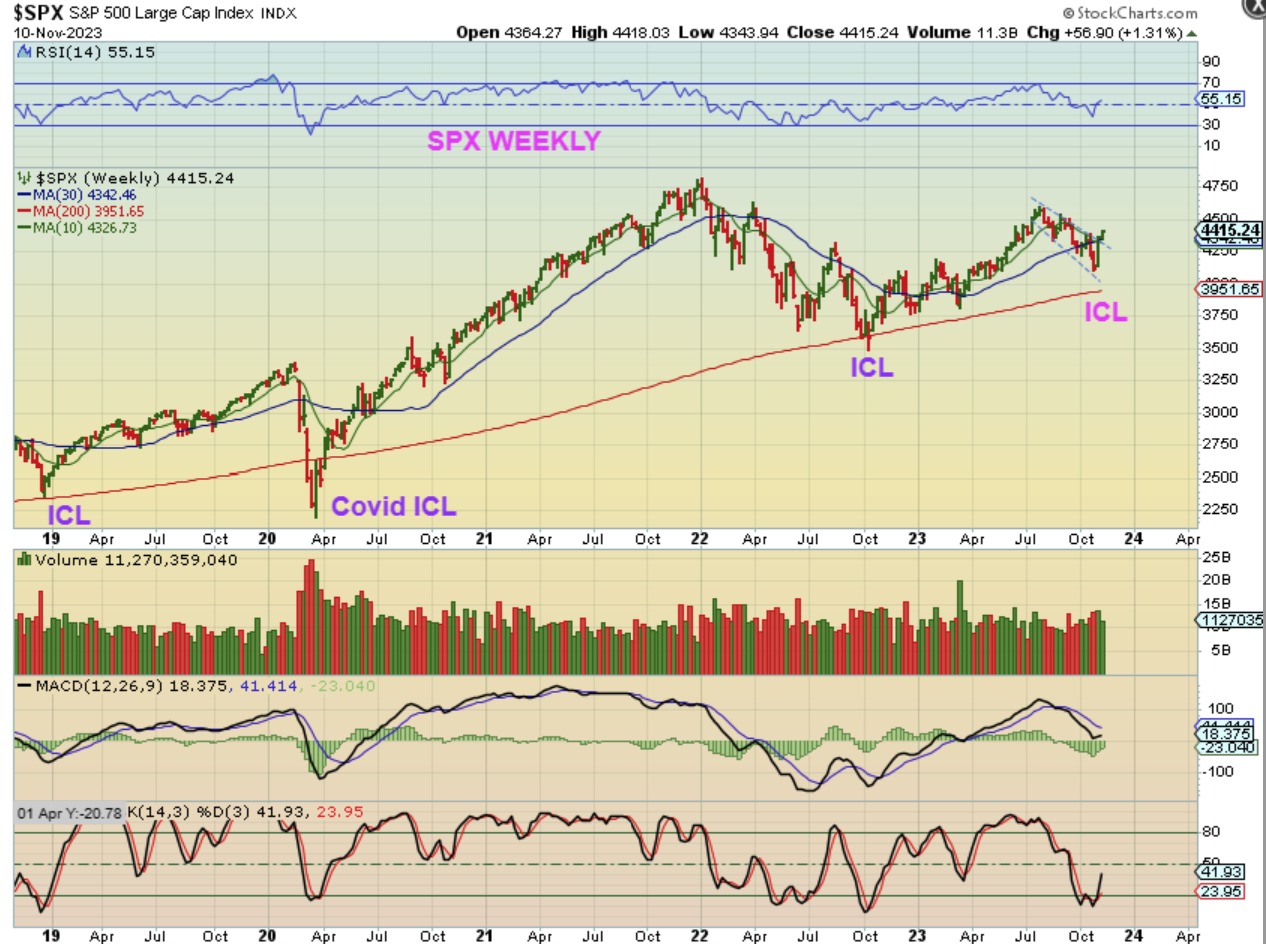
.
With an ICL is in place, the markets can run higher for 2 or 3 daily cycles, and since the daily cycles are over 30 days long, we should have months of higher lows over time. So let’s take a look at the NASDAQ too, since there are still 2 ways to look at this.
.
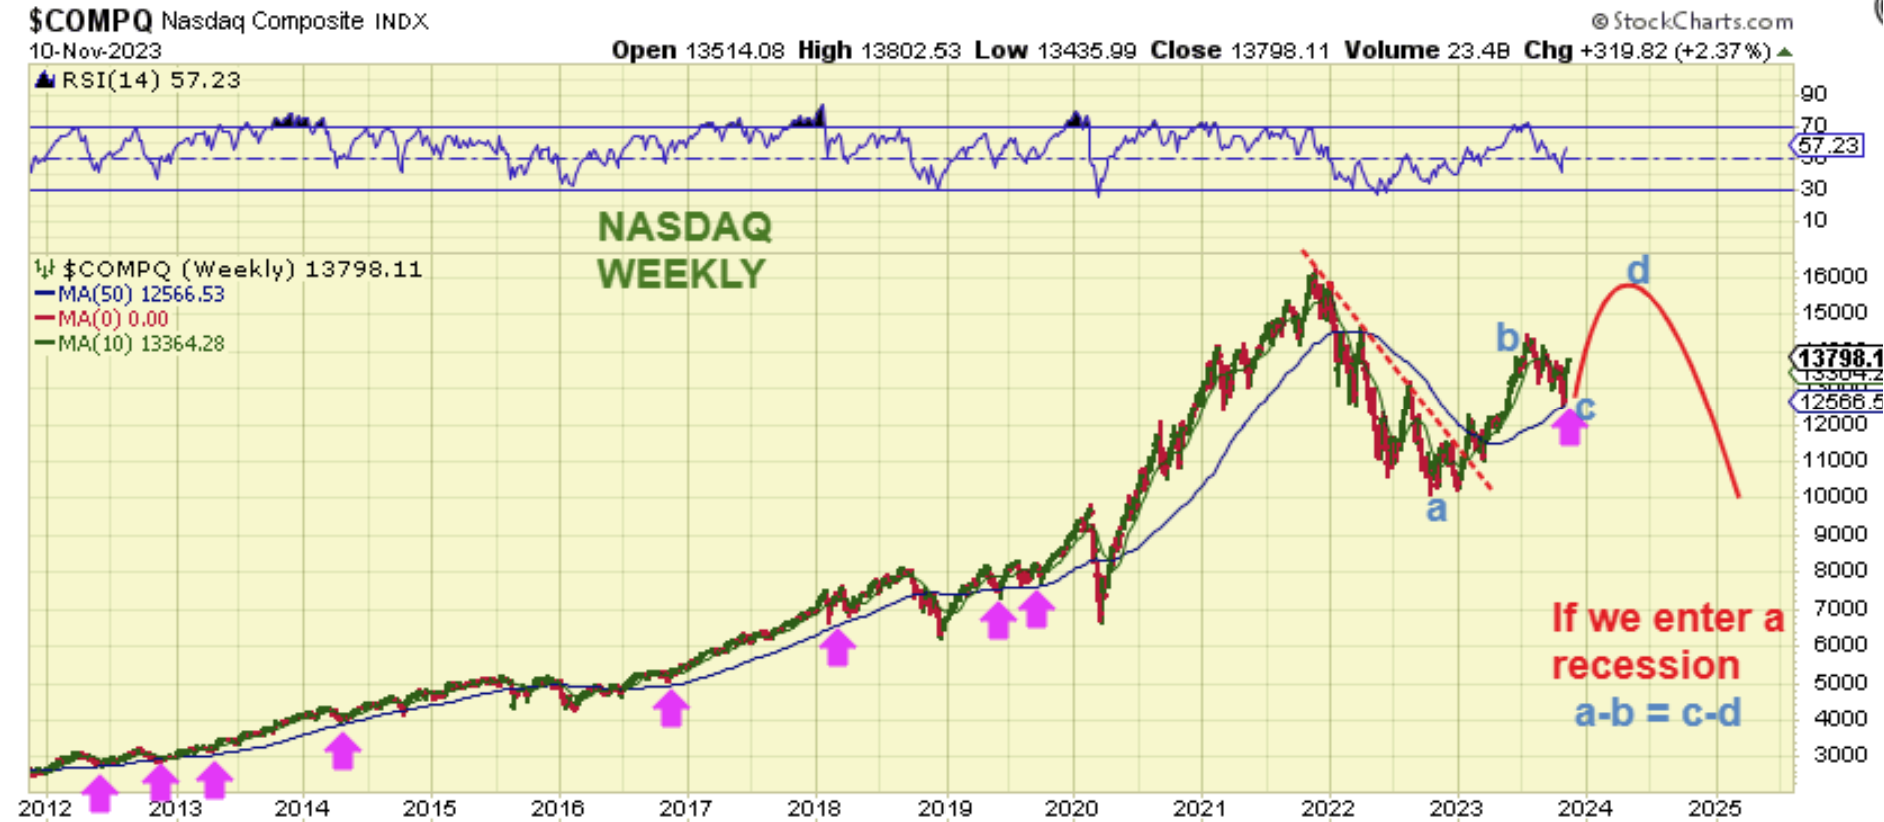
If we have a recession coming in 2024, then the NASDAQ, SPX, and DOW, etc would look like this. We just ran out of the 2022 ICL to a peak midyear, followed by a correction into this ICL. So that would be the possible A,B, & C of an A-B = C-D. We would now run to the highs, double top and roll over ( If we get the recession). If not…
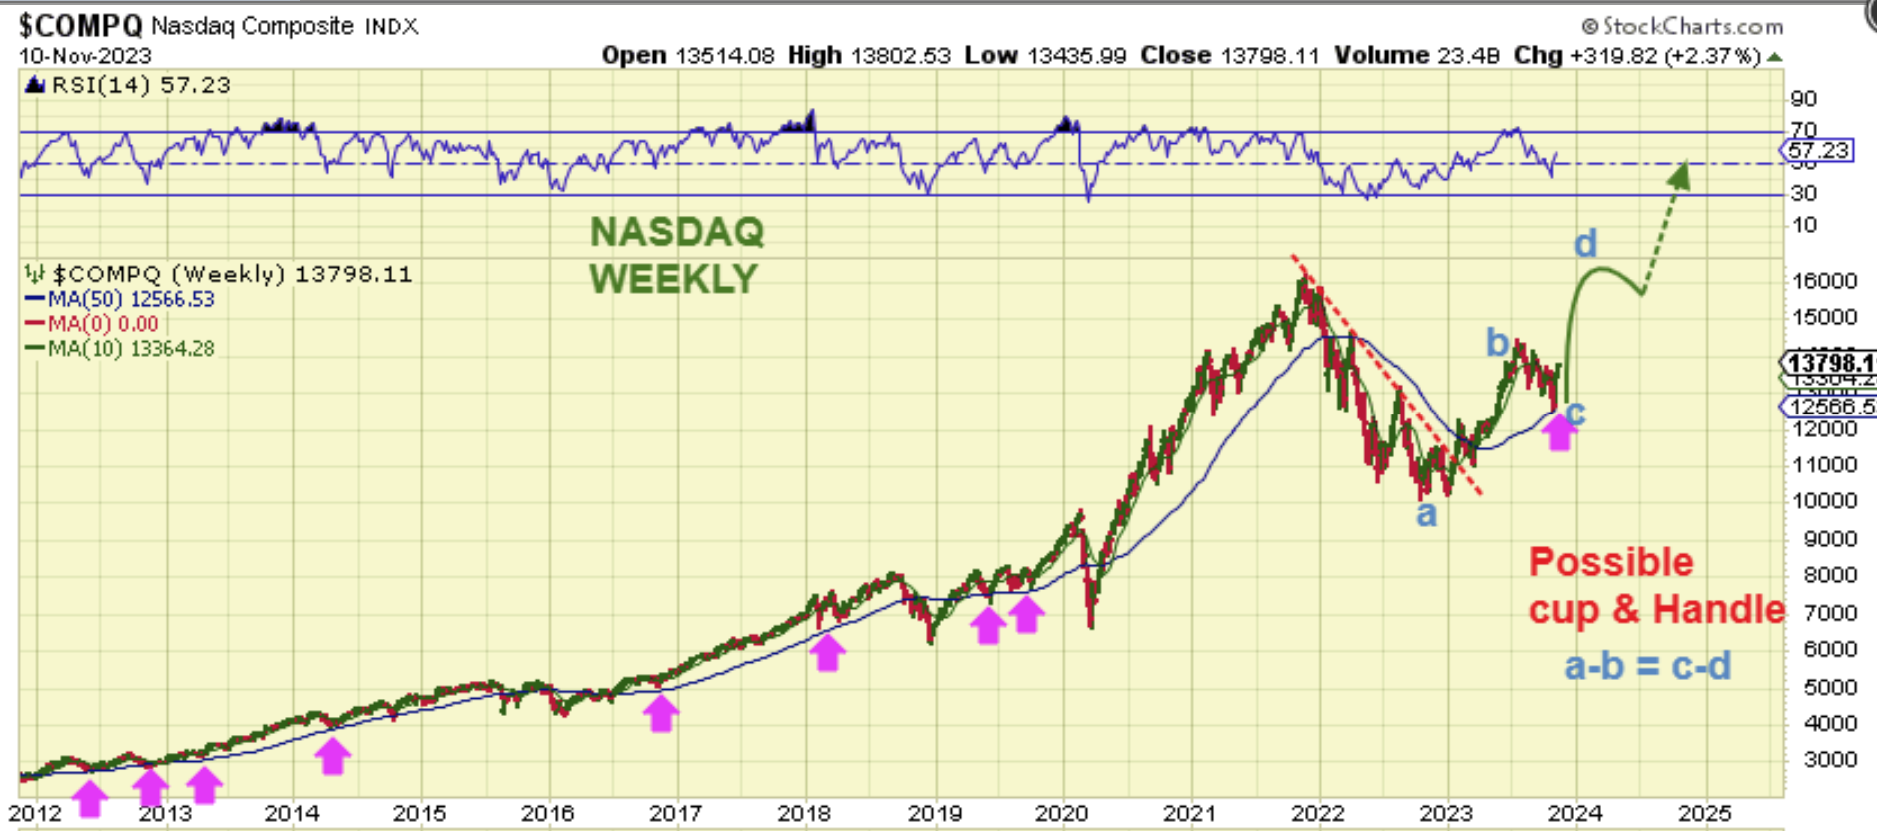
Then The NASDAQ WEEKLY could complete the same A-B = C-D run and form a handle with the next correction into a higher ICL. That could form a large Cup & Handle and the bull run could continue to run to new highs.
.
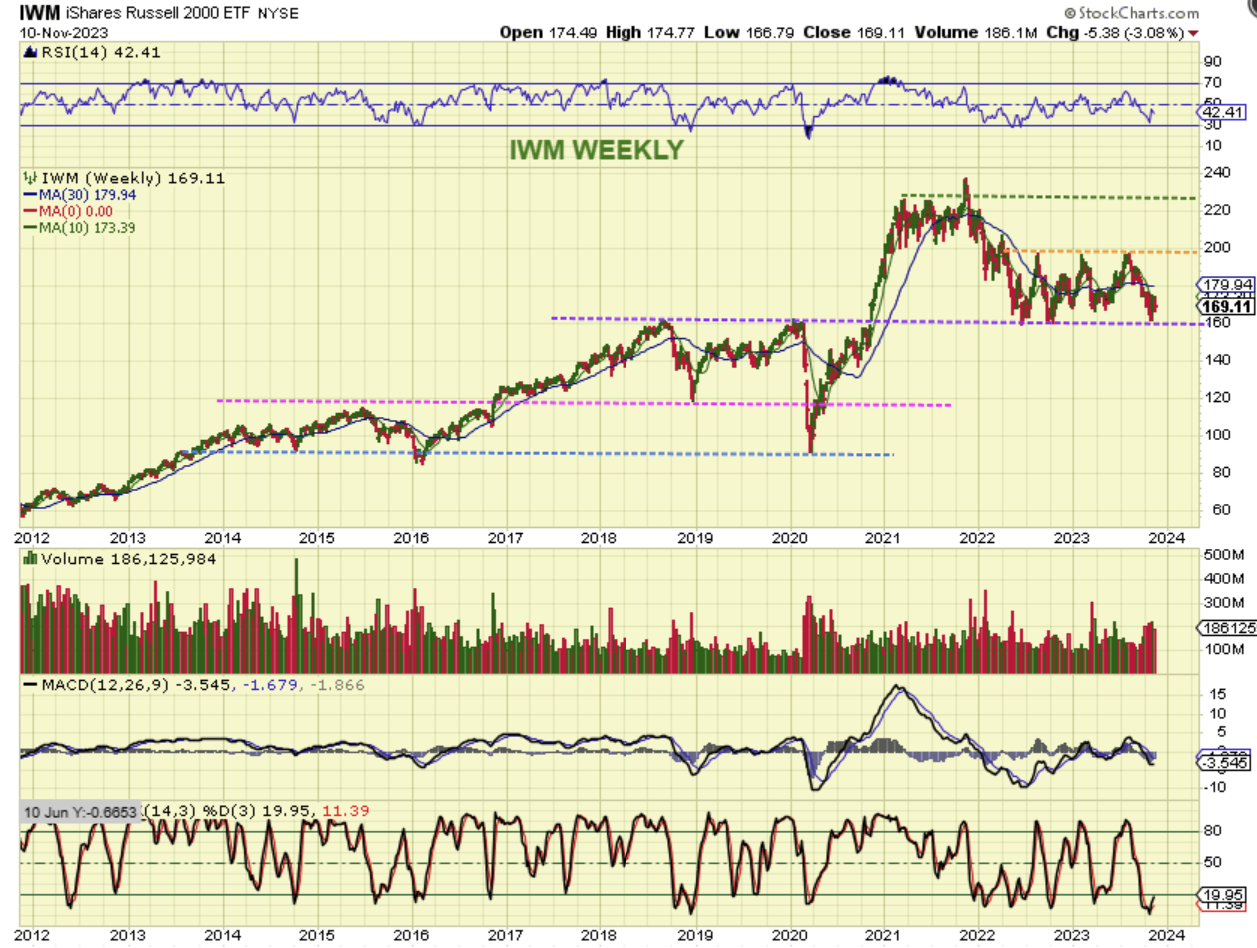
The small caps or IWM are a completely different set up. They have been in a large choppy sideways consolidation and are not trending higher (Yet?). With an ICL in place again, this should run to that 200area, and then we’ll have to see if it can break free or will it stop there and drop back again?
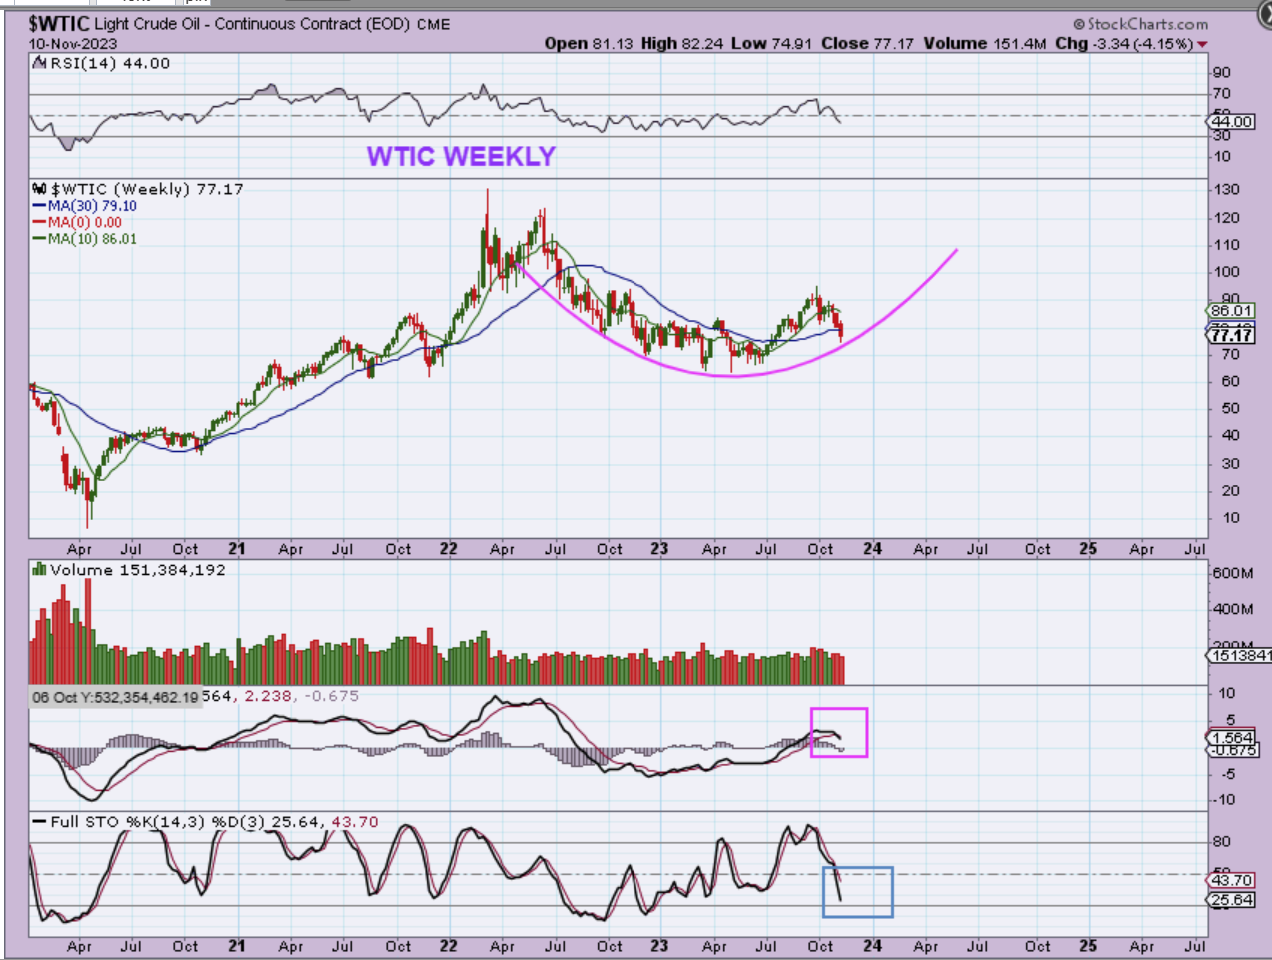
WTIC WEEKLY – You may recall from the weekday reports that Oil is very due for a dcl, so Fridays price reversal higher may be that dcl. Is it an ICL or a dcl? It could be either, but I think it is a dcl and we would have one more daily cycle bounce and drop. As of the June ICL however, we are now climbing the right side of a cup formation, so we would expect a higher low to begin building the right side of the cup. Now let me zoom in…
.
Now let me zoom in…
.
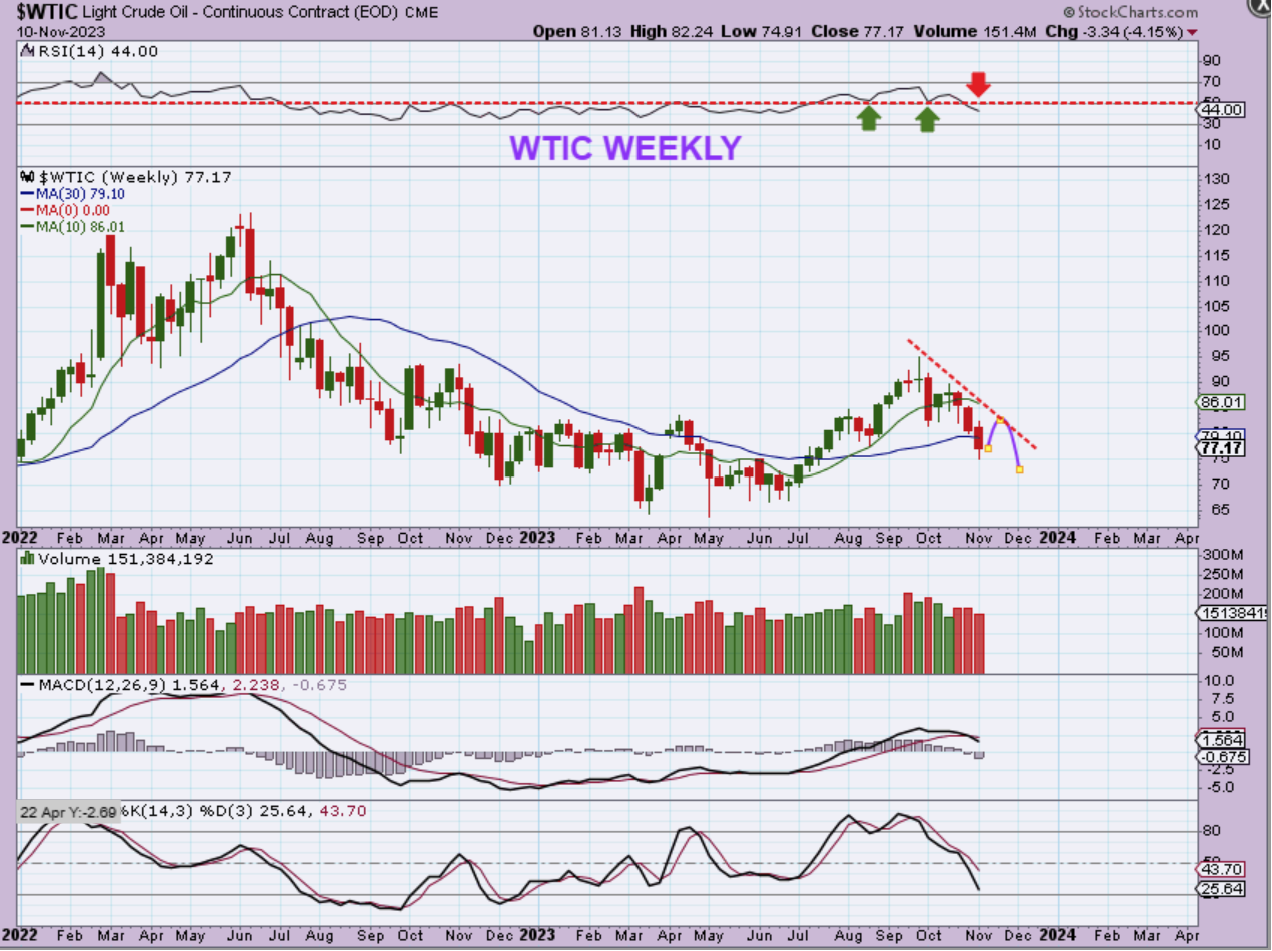
WTIC WEEKLY- Oil looks weak with the RSI losing the 50% and the MACD cross down, so one more daily cycle lower could give us an ICL. If this rallies above that downtrend line, the ICL is in place.
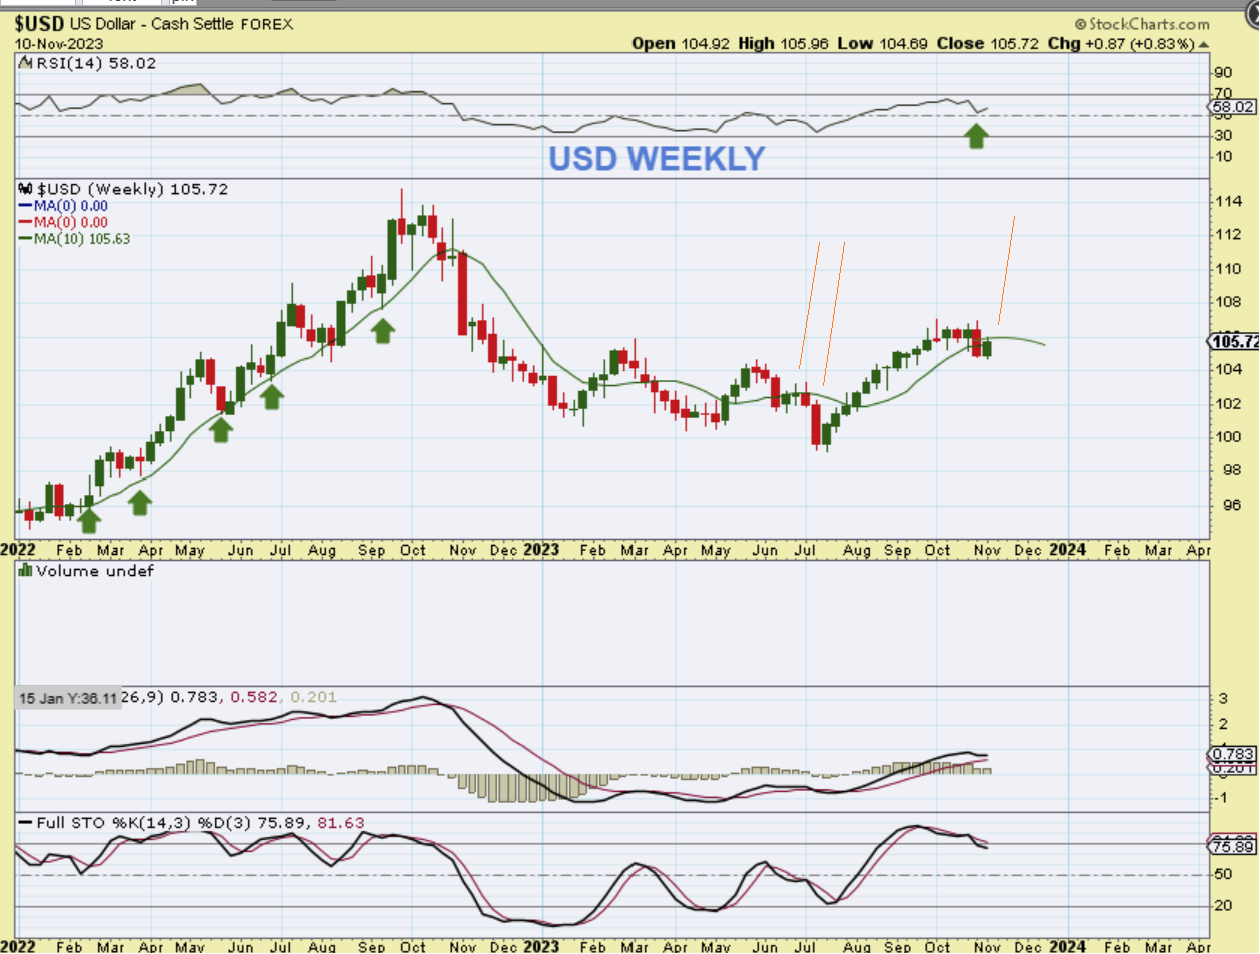
USD DAILY – We had 2 strong daily cycles higher and then the 3rd one is chopping sideways and is making slightly lower lows. I am expecting this to start to drop into the next dcl soon.
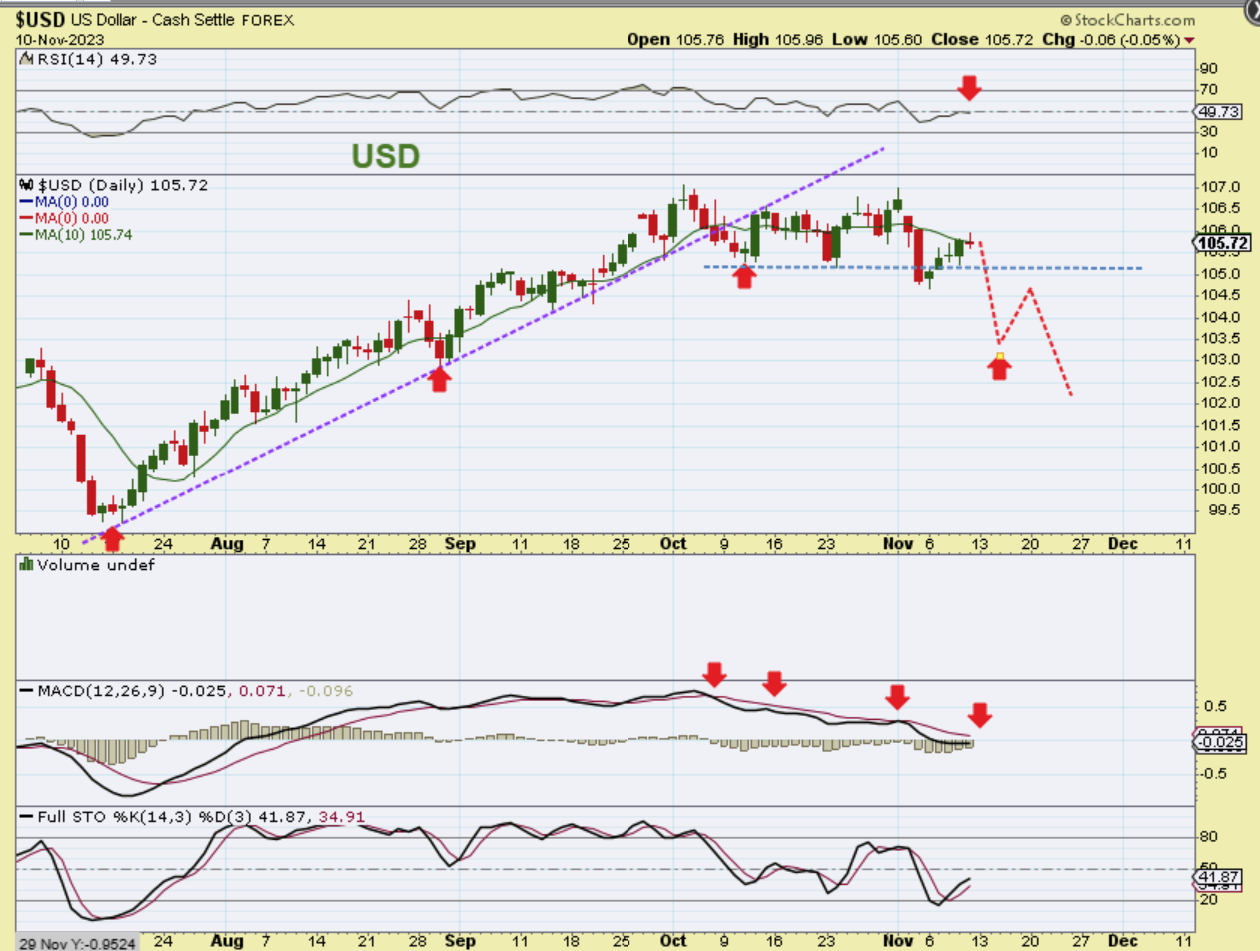
THE USD WEEKLY has lost the 10 week ma. That also happened in June & July of this year and price gradually rolled over under it.
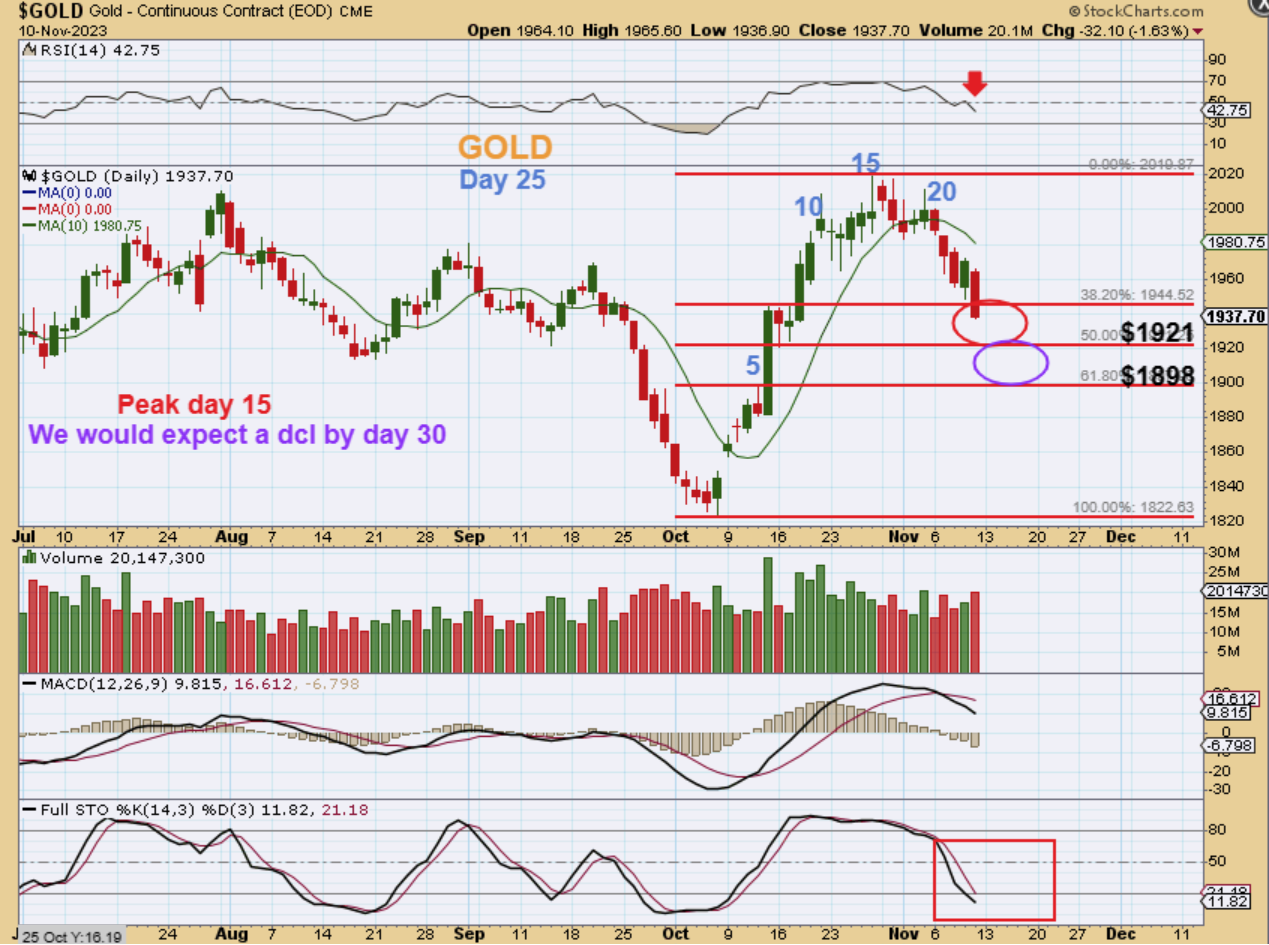
GOLD dropped fairly sharply on Friday, putting it slightly under the 38% fib retracement level. Next are the 50% and the 61.8% fib retrace levels. This was day 25, and with a day 15 peak, I would expect this to put in an early dcl soon. I have seen that happen in the past. So…
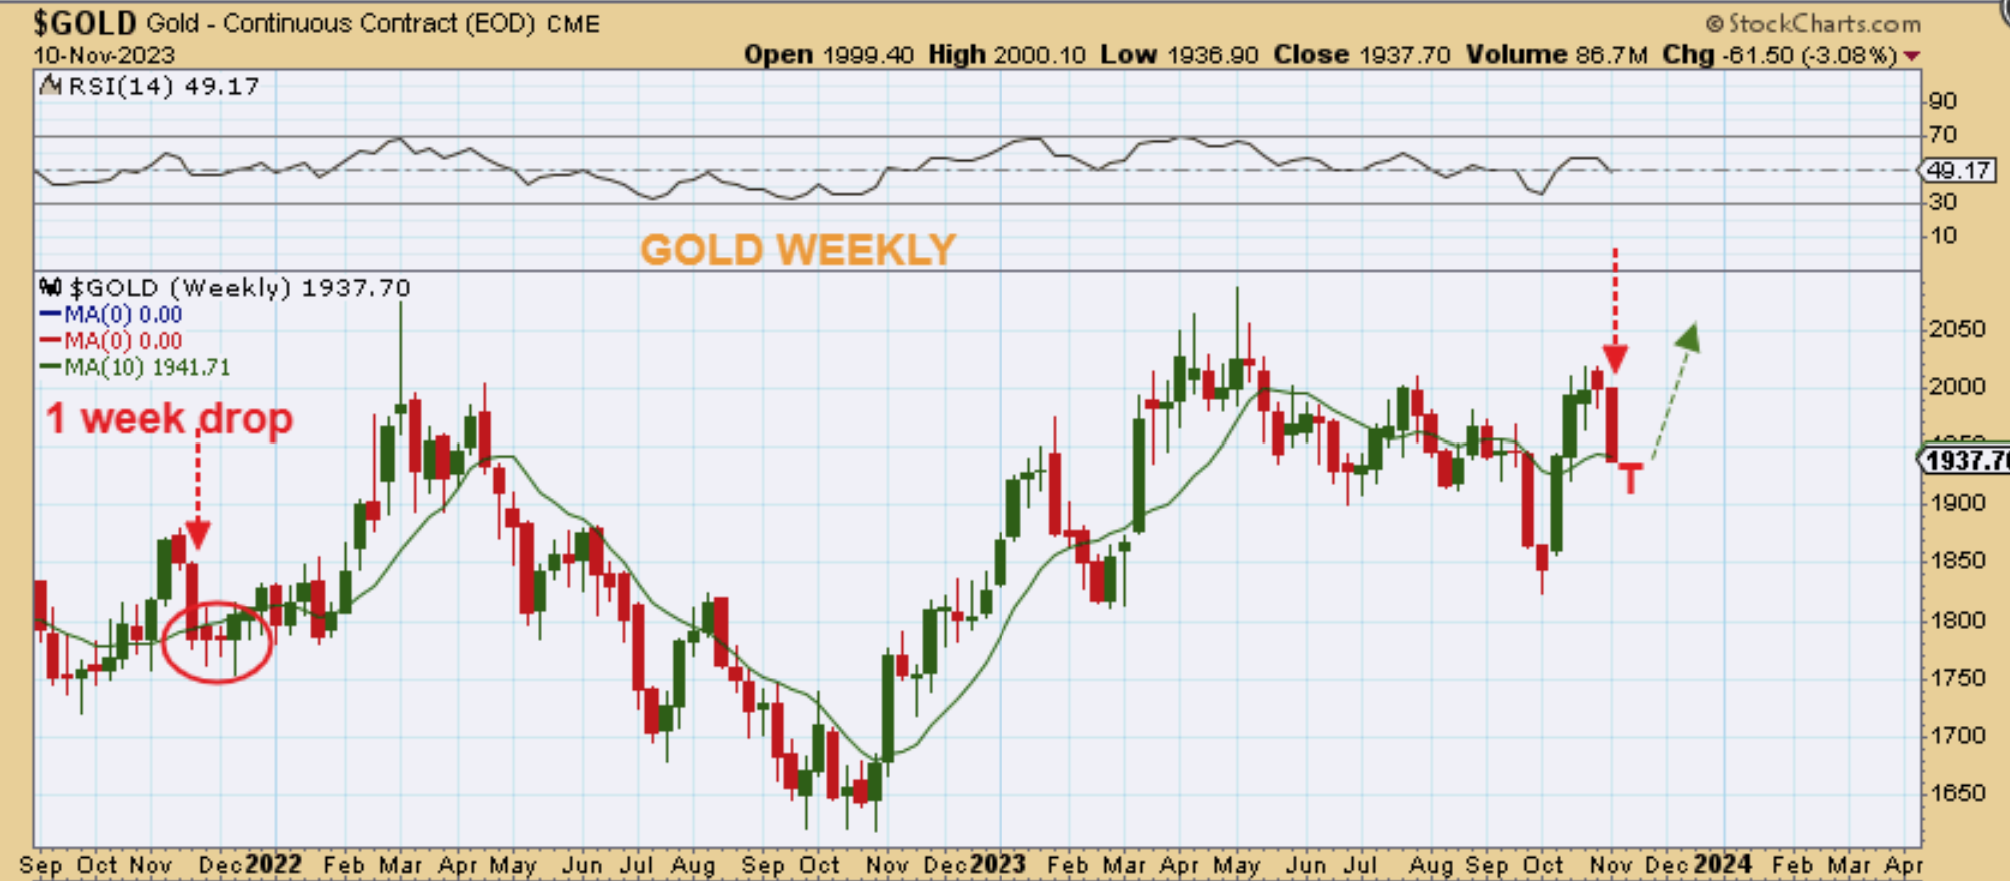
GOLD WEEKLY – I just wanted to point out that after a deep 1 week plunge like we saw last week, we can get a smaller reversal candle as a low the following week. It is true that we can just keep selling off and we all know that, so that is why I wanted to show an example of a big red candle followed by a small candle forming a low. So I drew a reversal ‘T’ in place for next week.
.
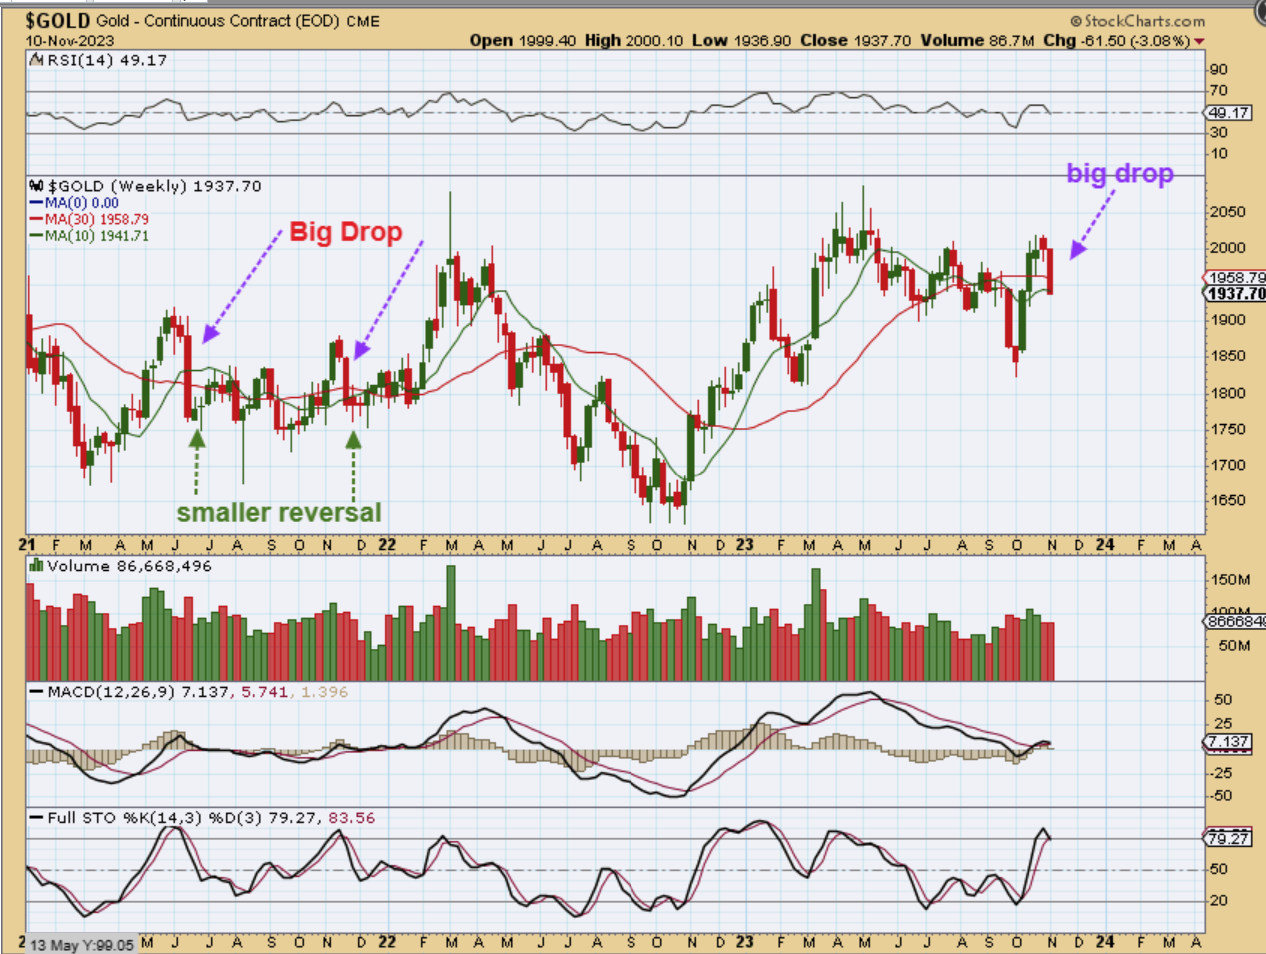
In fact, here are a couple of examples of a large drop and a reversal low under it. Please ignore how ugly and choppy that was week after week 🙁 I agree that the chop that followed is ugly, but we should be seeing a drop in the USD soon, so I would expect a push higher with Gold.
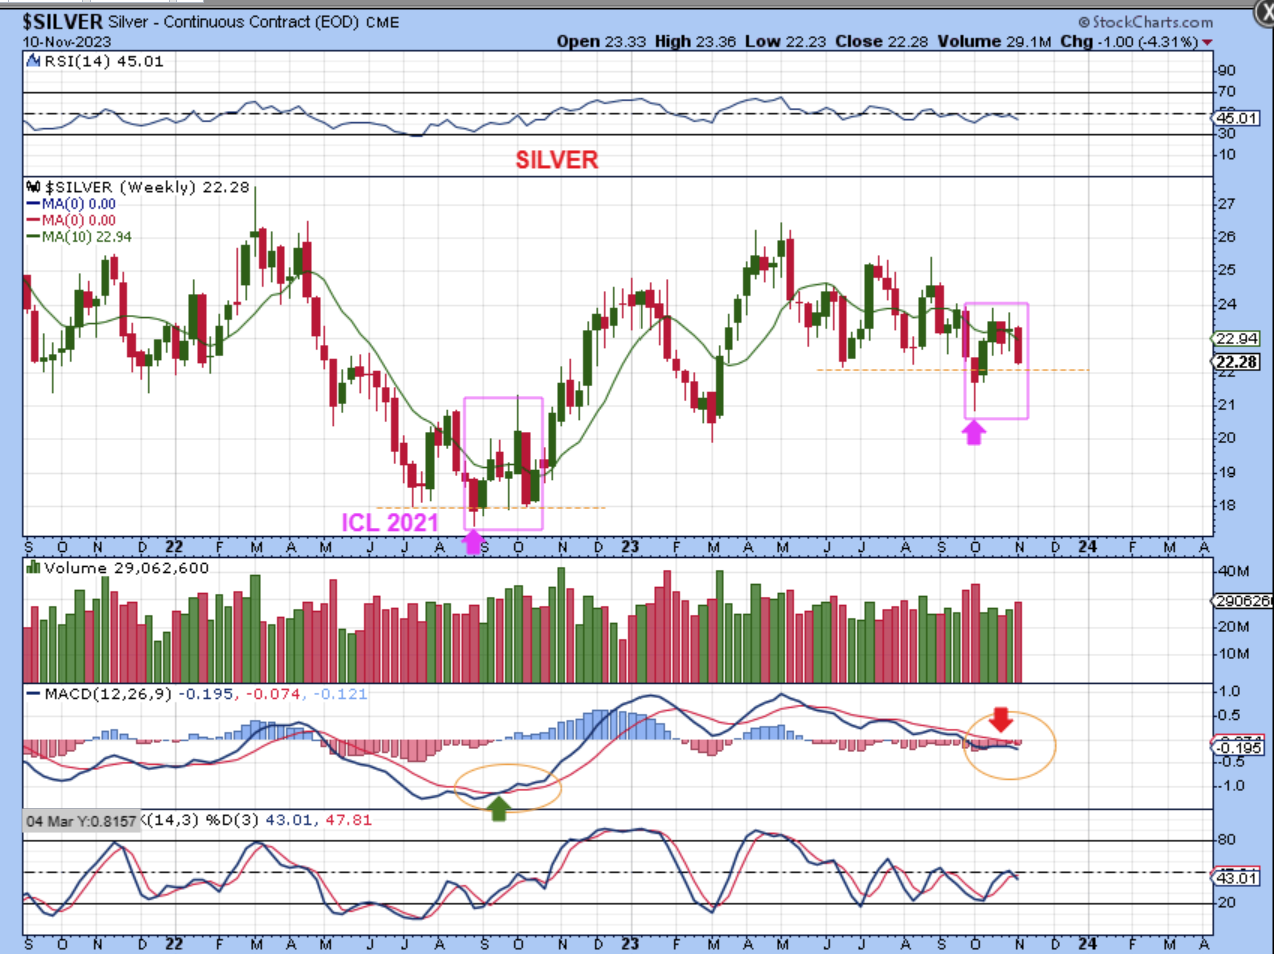
SILVER dropped too, but this looks similar to the ICL that formed in 2022 also. Silver almost touched that ICL low with a big 1 week drop last year, but then a rally followed in the next daily cycle.
So looking back at past GDX ICls and as much as we hate to see it, it seems that lately price runs up and then comes right back down toward the ICL ( lows). The good news is that after that dip back toward the ICL, the next daily cycle was a rally.
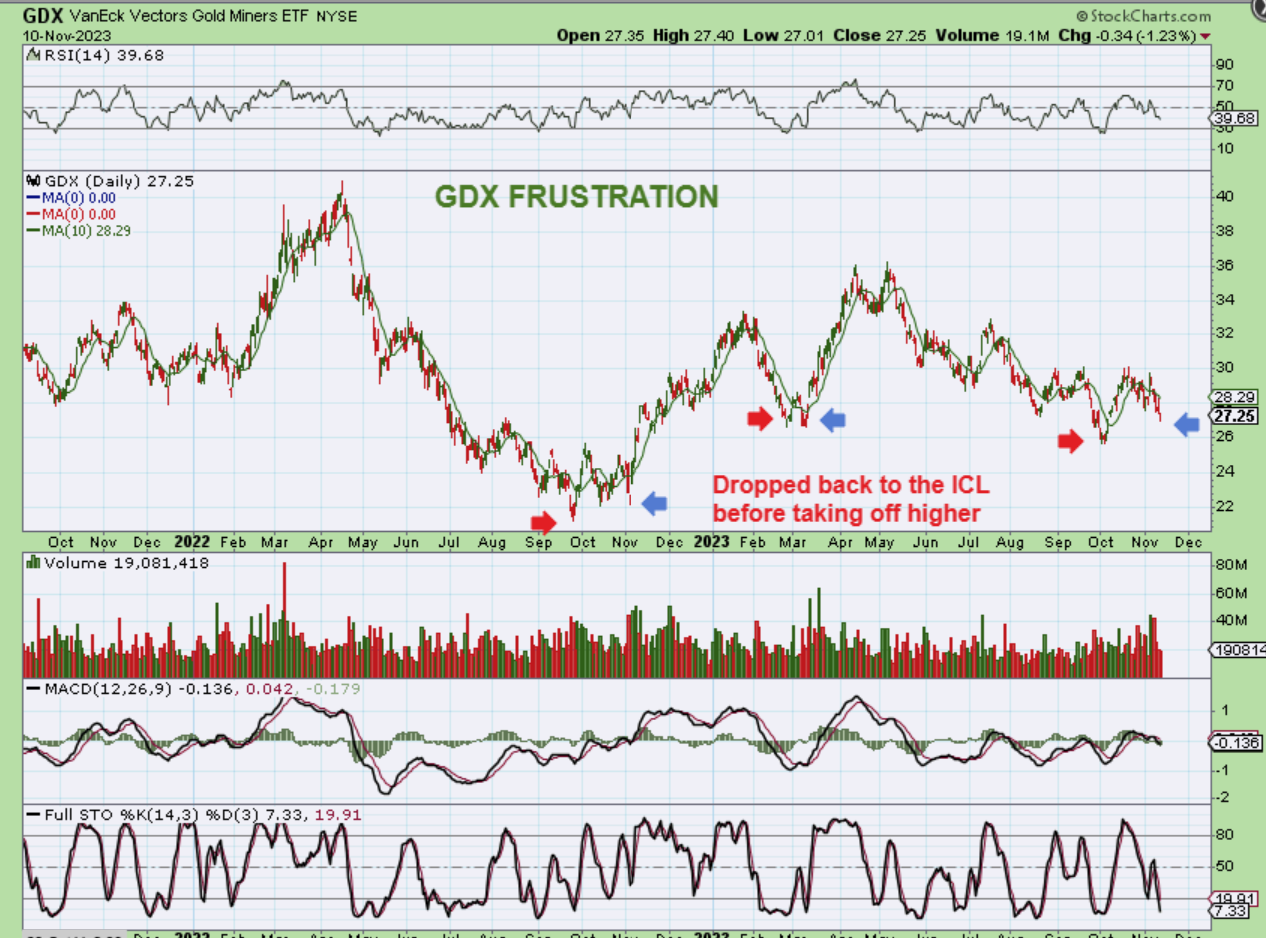
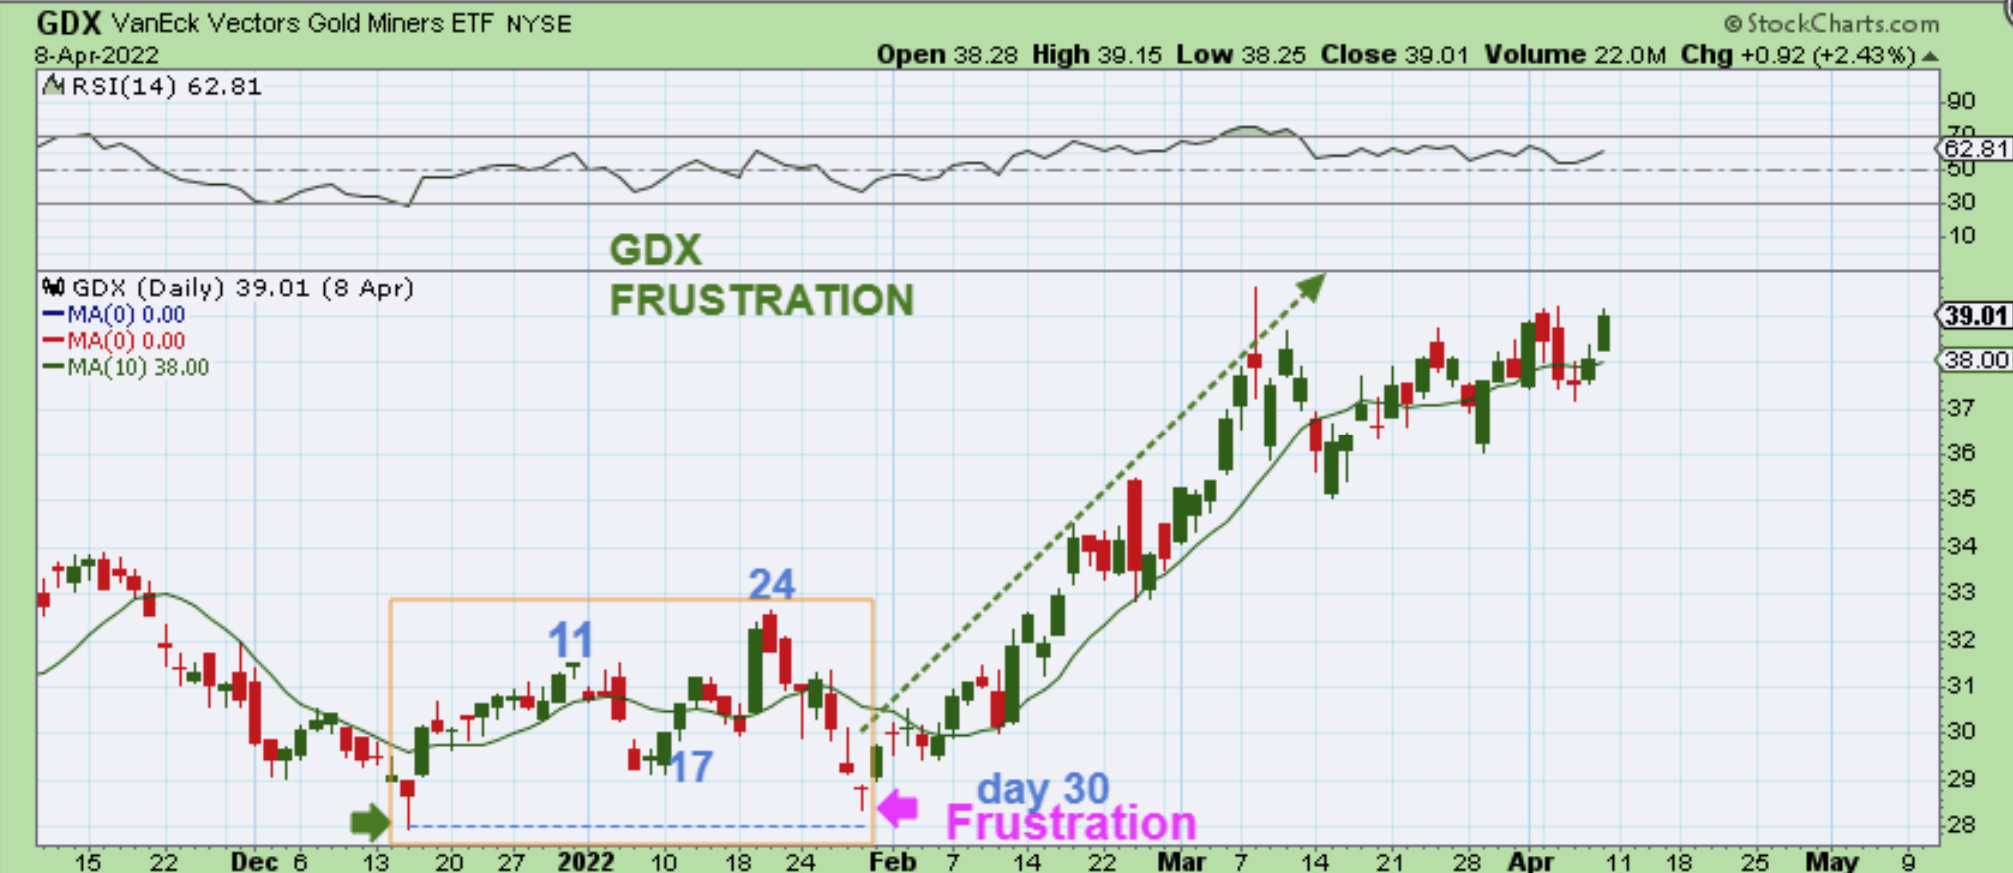
Take a look at THE GDX ETF from the Dec 2021 lows. We had a 30 day daily cycle and price just about tagged those lows again. That is so frustrating! And sadly many probably sold right at the lows and then we got a rally that followed.
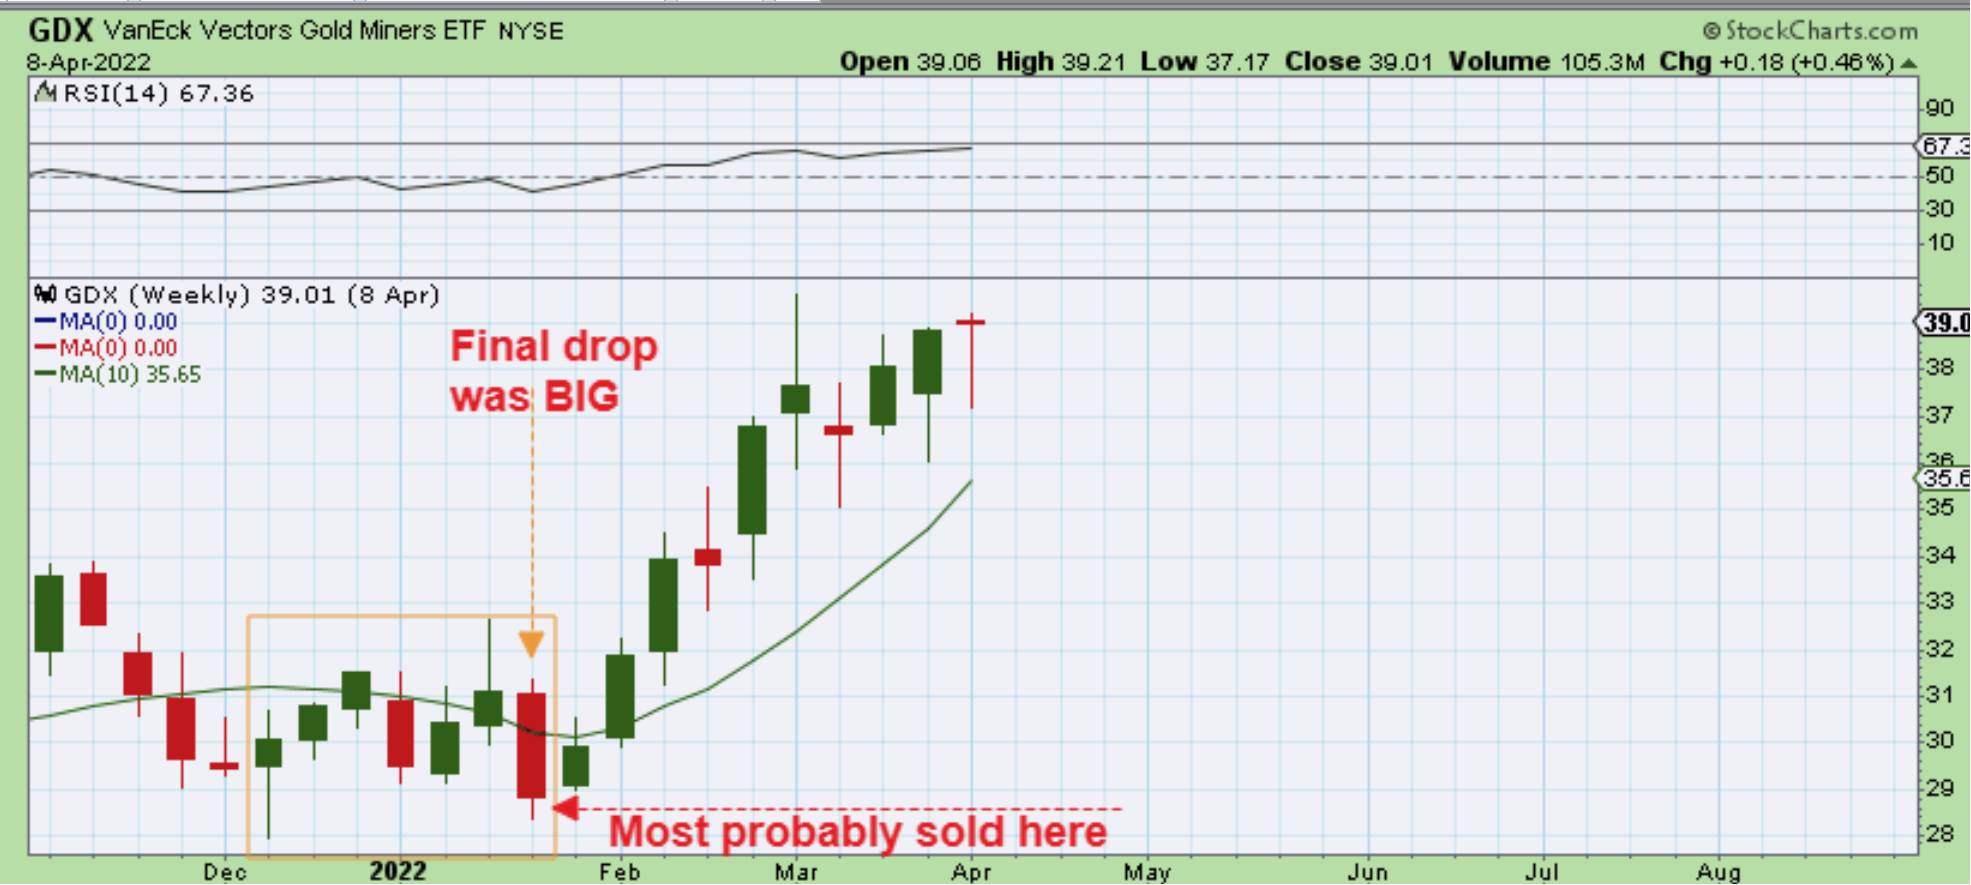
This is The Weekly view of that GDX low. The last drop was a large red candle, similar to what we have with Gold today. Read the chart and I’m sure that you’ll agree – double bottom lows like that before a nice rally are very frustrating and we may be seeing that now with our miners. One thing that I don’t fully understand is NEM…
.
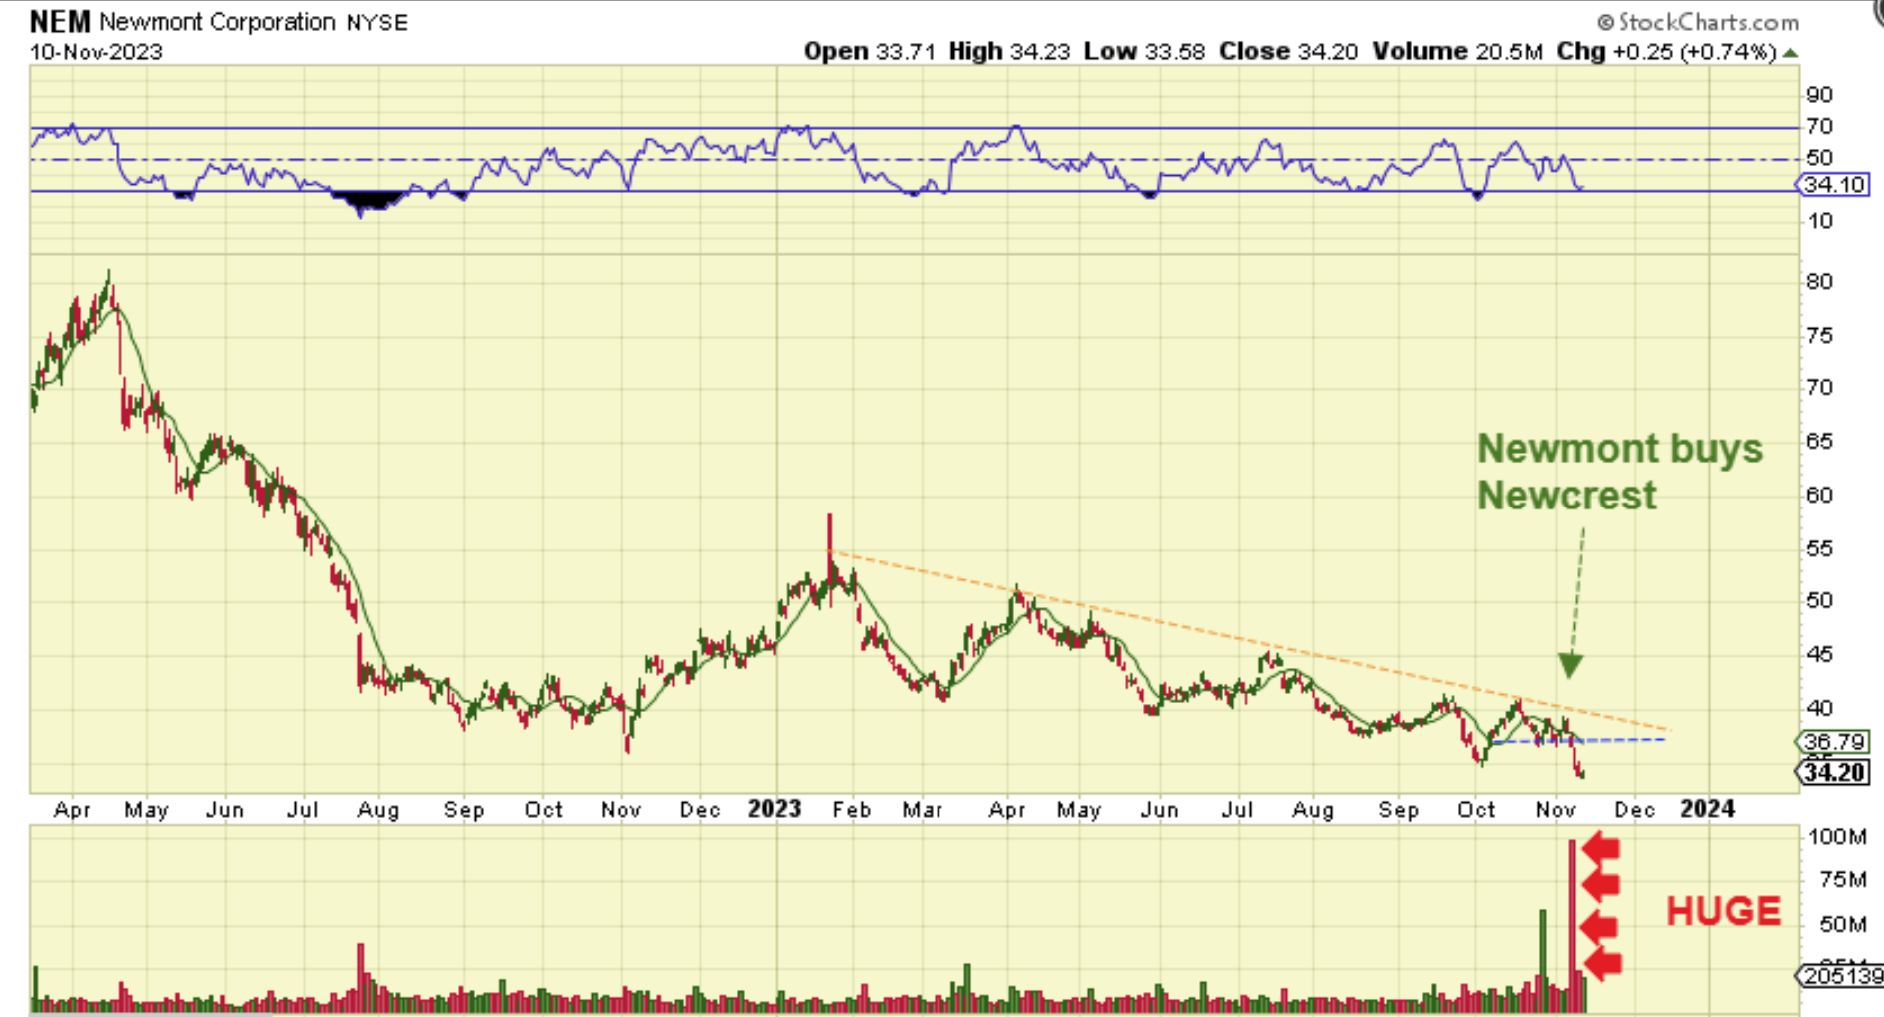
One thing that I don’t fully understand is NEM. When they released earnings it rallied for a couple of days, but now they announced that they bought Newcrest Mining and it has sold off to new lows? That is a bit confusing. I understand that there are expenses and costs that may temporarily eat into profits, but the headlines announced that this creates the world’s leading Gold Mining Business.
,
NEM dropped last week with HUGE volume to new lows after announcing on Monday that they acquired Newcrest. THIS is dragging GDX down too, but that may be capitulation volume and a reversal usually takes place after that. So this may mark the lows for NEM, and if so, it may mark the lows for GDX.
.
If you invested in the General Markets or individual companies, last week was bullish, but if you are holding Miners or waiting for that reversal higher (I was doing both), then it was a bit frustrating. Instead of a 1/2 cycle low with last Fridays SURGE in miners, we saw Gold and Silver continue to drift and then sell down on Friday, and Miners gave back the gains from last Fridays surge. We are on day 25 for Gold, so it would seem that Gold is dropping into the dcl and the targets to watch are the 50 & 61.8% Fib levels for now. We should be close to a low too. Some miners are holding up so far (The stronger ones like KGC, HMY, EGO, GFI are above the 200sma and some above the 50sma), but other Miners are selling off. NEM is at the lows? NEM looks to have capitulation volume, so that may be putting in the lows for it and the GDX this coming week. It is frustrating in this sector at times, but if it is anything like the last 2 ICLS, then the rally in the 2nd daily cycle should be rewarding. Gold is on Day 26 Monday and if this is to be a R.T. Daily cycle, then it should bottom by day 30 this week. We’ll see what next week brings, but with the current set ups, the USD should also be ready to roll over soon and the Precious Metals should recover. The General Markets are Bullish and should remain bullish for the coming weeks, so hopefully they all start to move higher together sooner than later.
.
I hope all enjoy their weekend, and thanks for being here at Chartfreak!
.
~ALEX
.
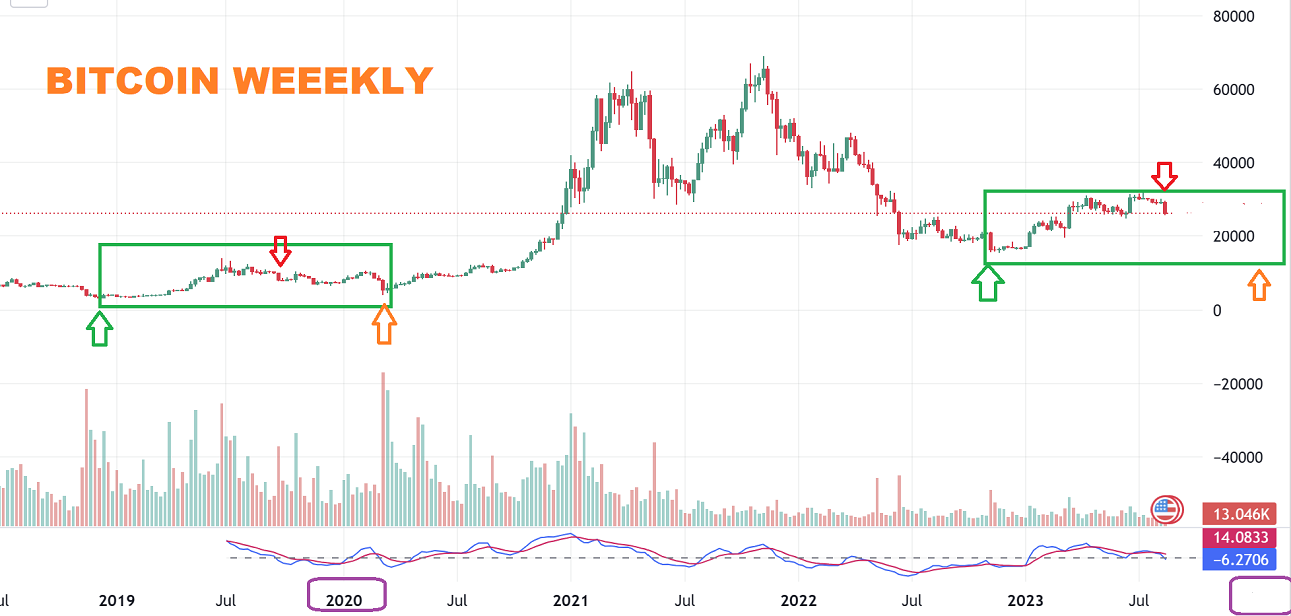
BITCOIN WEEKLY I went back to my June 2023 charts and wanted to review the Bitcoin set up. At the time I said that Bitcoin was looking a lot like the 2019 year, which was also the year before the last halving year, so let’s take a look:
Notice in 2019 (The year prior to the 2020 halving year) Bitcoin rallied strongly , but then chopped lower and finally we saw a 1 week red candle that dipped and recovered. See the 2 Green arrows . So I drew something similar. This was the weekly view, and I expected a little more from the rally and then a dip. I also did the daily view…
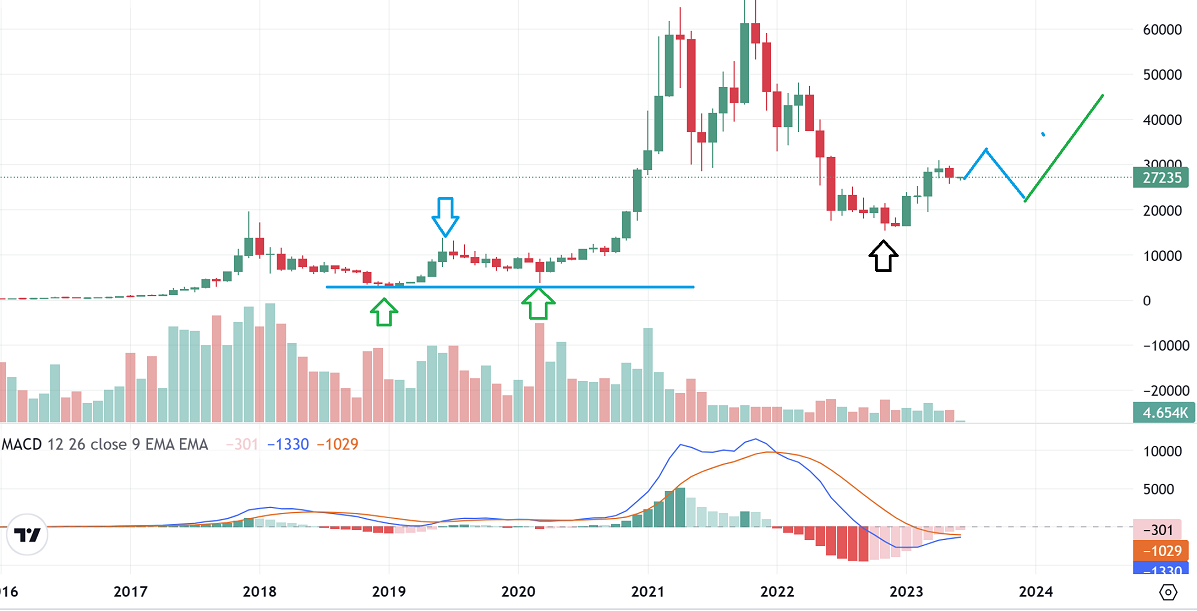
BITCOIN DAILY: So we already had a similar rally in 2023 to the one in 2019, so I drew a box and showed what we may want to look for going forward. I expected a peak maybe in October and a deeper dip in Nov or Dec as an ICL, similar to that quick sharp drop in the 2019-2020 run.
.
And now to the August 2023 set up from a prior report:
.
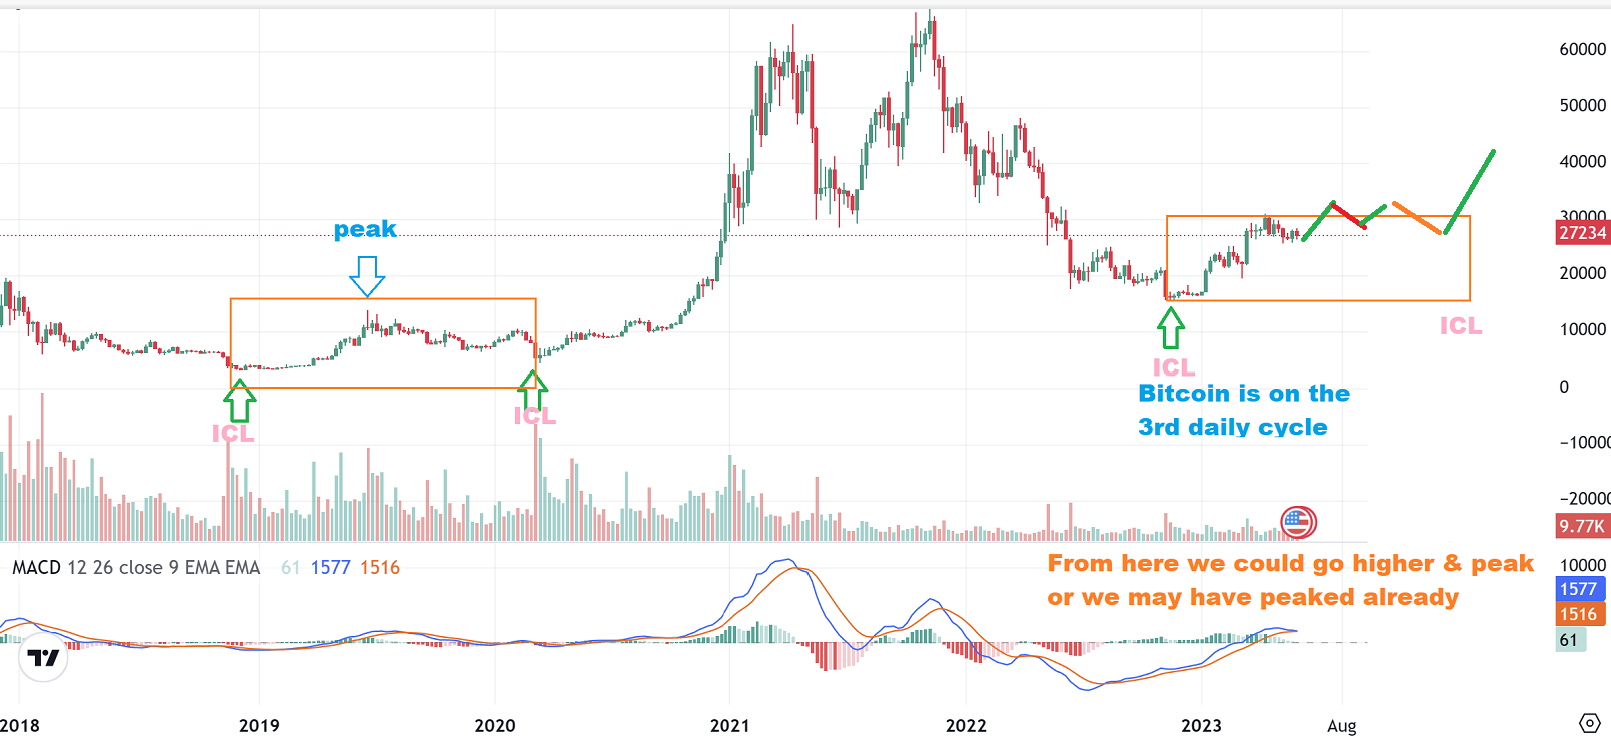
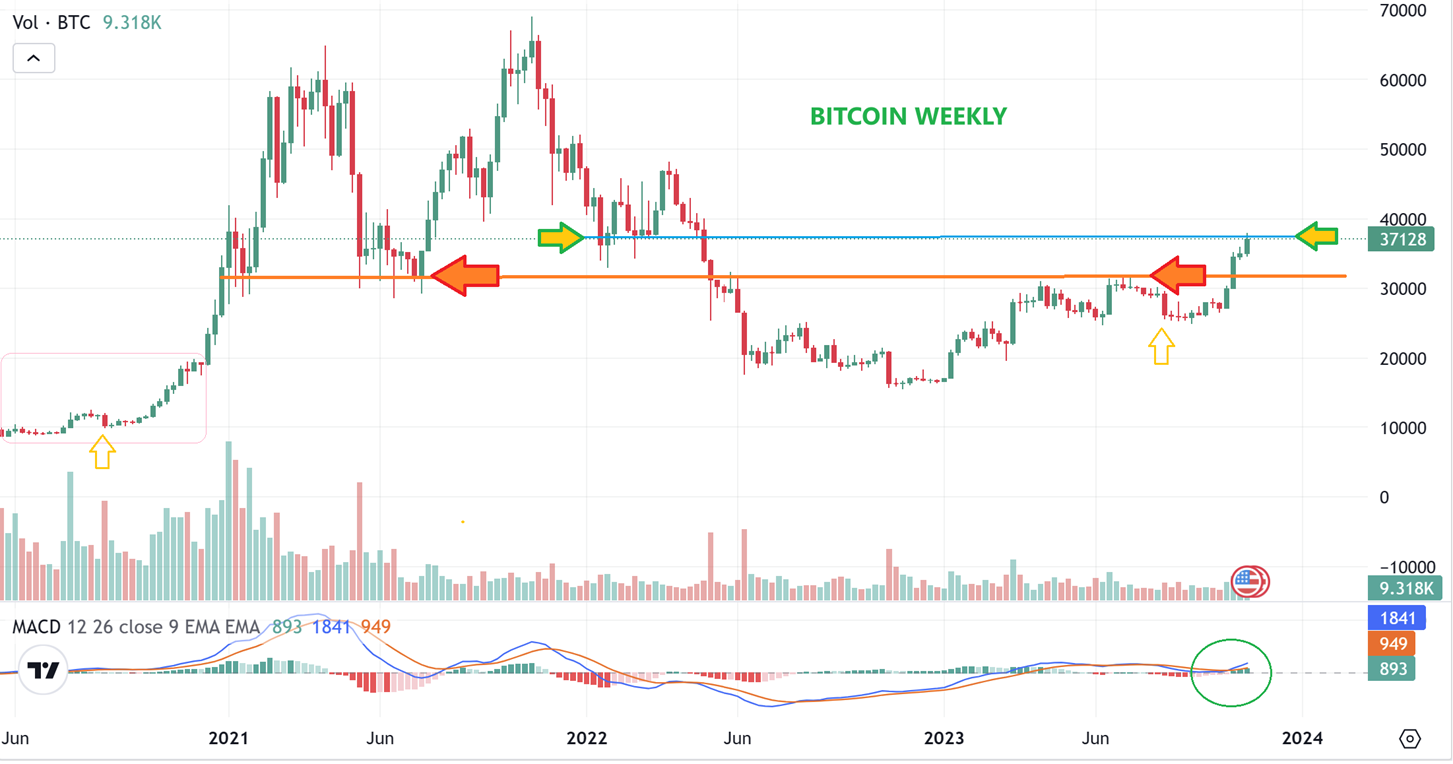
BITCOIN WEEKLY Now in August, it still looked similar with a sharp 1 week dip (red arrows). So I expected a small rally in September through October and the ICL in maybe Nov or DEC (it came in March of 2020 though, after a rally, but that rally did NOT make new highs). Right now Bitcoin has played out similarly, but it HAS made new highs, so let’s take a look…
BITCOIN WEEKLY: Bitcoin did do that sharp 1 week drop and now it has rallied to new highs. I didn’t see that drop as an ICL, but it does look similar to the drop in the orange box at the left of Bitcoin in 2020. The problem is still MARA, RIOT, HIVE, CLSK, etc. They are not rallying, but they do look to be possibly ‘bottoming’ now. So—-
.
So, using the same weekly chart:
Bitcoin looks to be at the next resistance area and should be on day 60 or 61 on a Daily. This should mean that we will see some kind of a pullback, similar to when price got above $30,00 and hit that orange resistance line. That would give us a buy in Crypto miners, since they look to be basing and may resist a lot of the selling.
1. IF this just keeps pushing higher, crypto stocks may become a buy now, since RIOT, MARA, etc have higher lows in their bases.
2.If it dips lower, that may be the buying opportunity, but let me show you something important though…
,
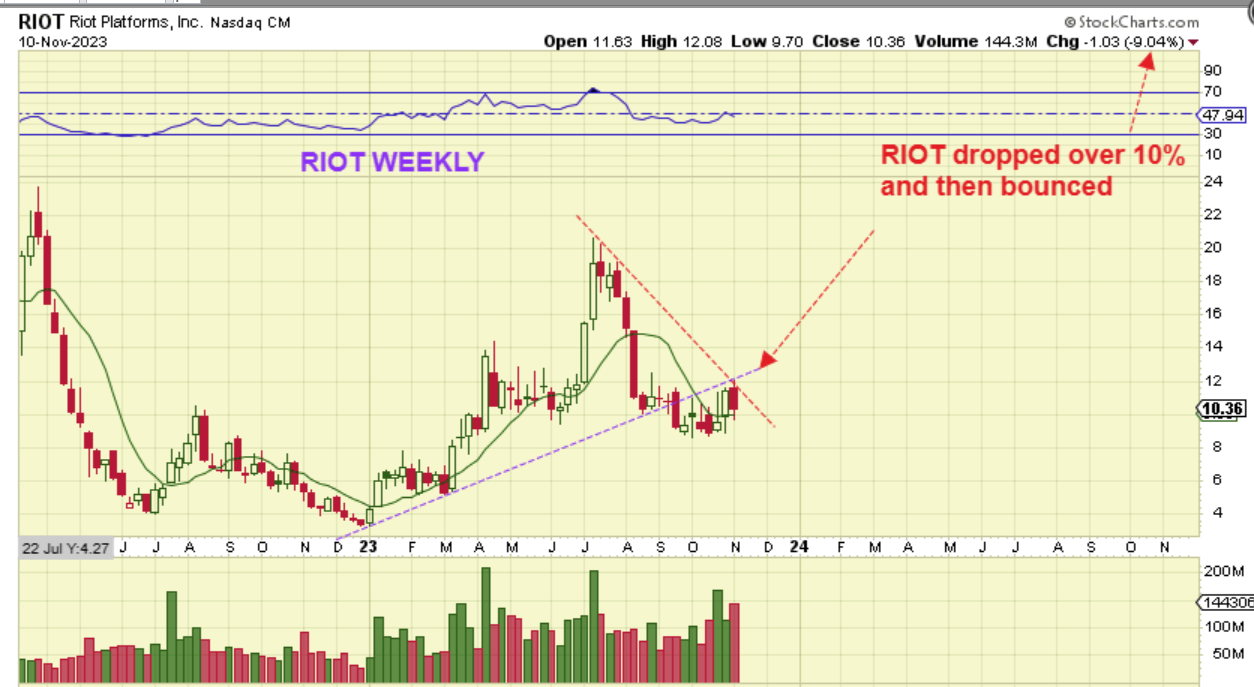
RIOT WEEKLY: The RIOT & MARA daily charts have a base with higher lows, but the Weekly is still not extremely bullish. RIOT, for example, was still down 10% this week. It also looks like it hit double resistance. So these are very hard to buy & hold. Now take a look at these even more important charts.
.
Now take a look at these even more important charts.
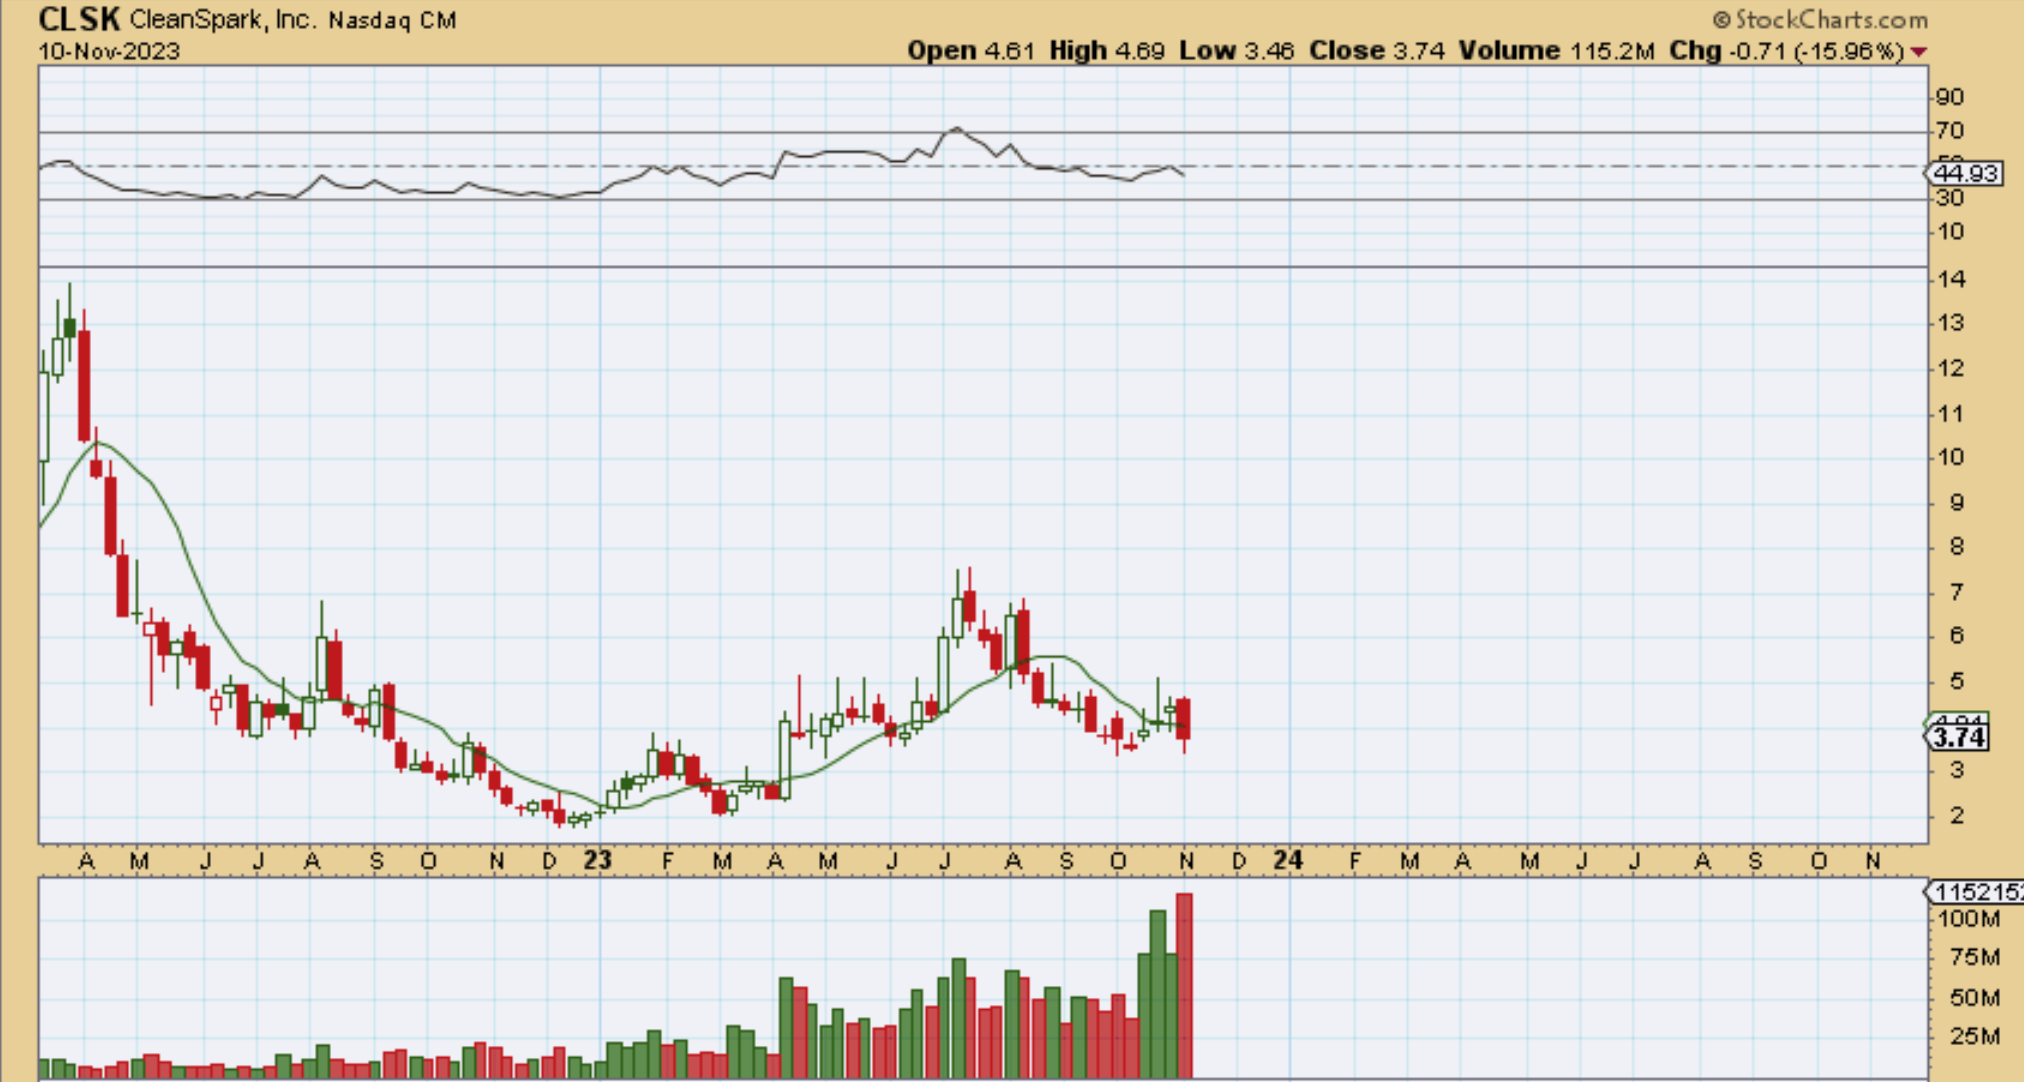
CLSK was down 16% last week, and this is with Bitcoin, Ethereum, etc rallying? Or…
.
CIFR was down 27% last week! So this one rallied nicely but then crashed. Mara and Riot delivered good earnings reports and rallied and then gave it back, so they may be a bit more stable. My point?…
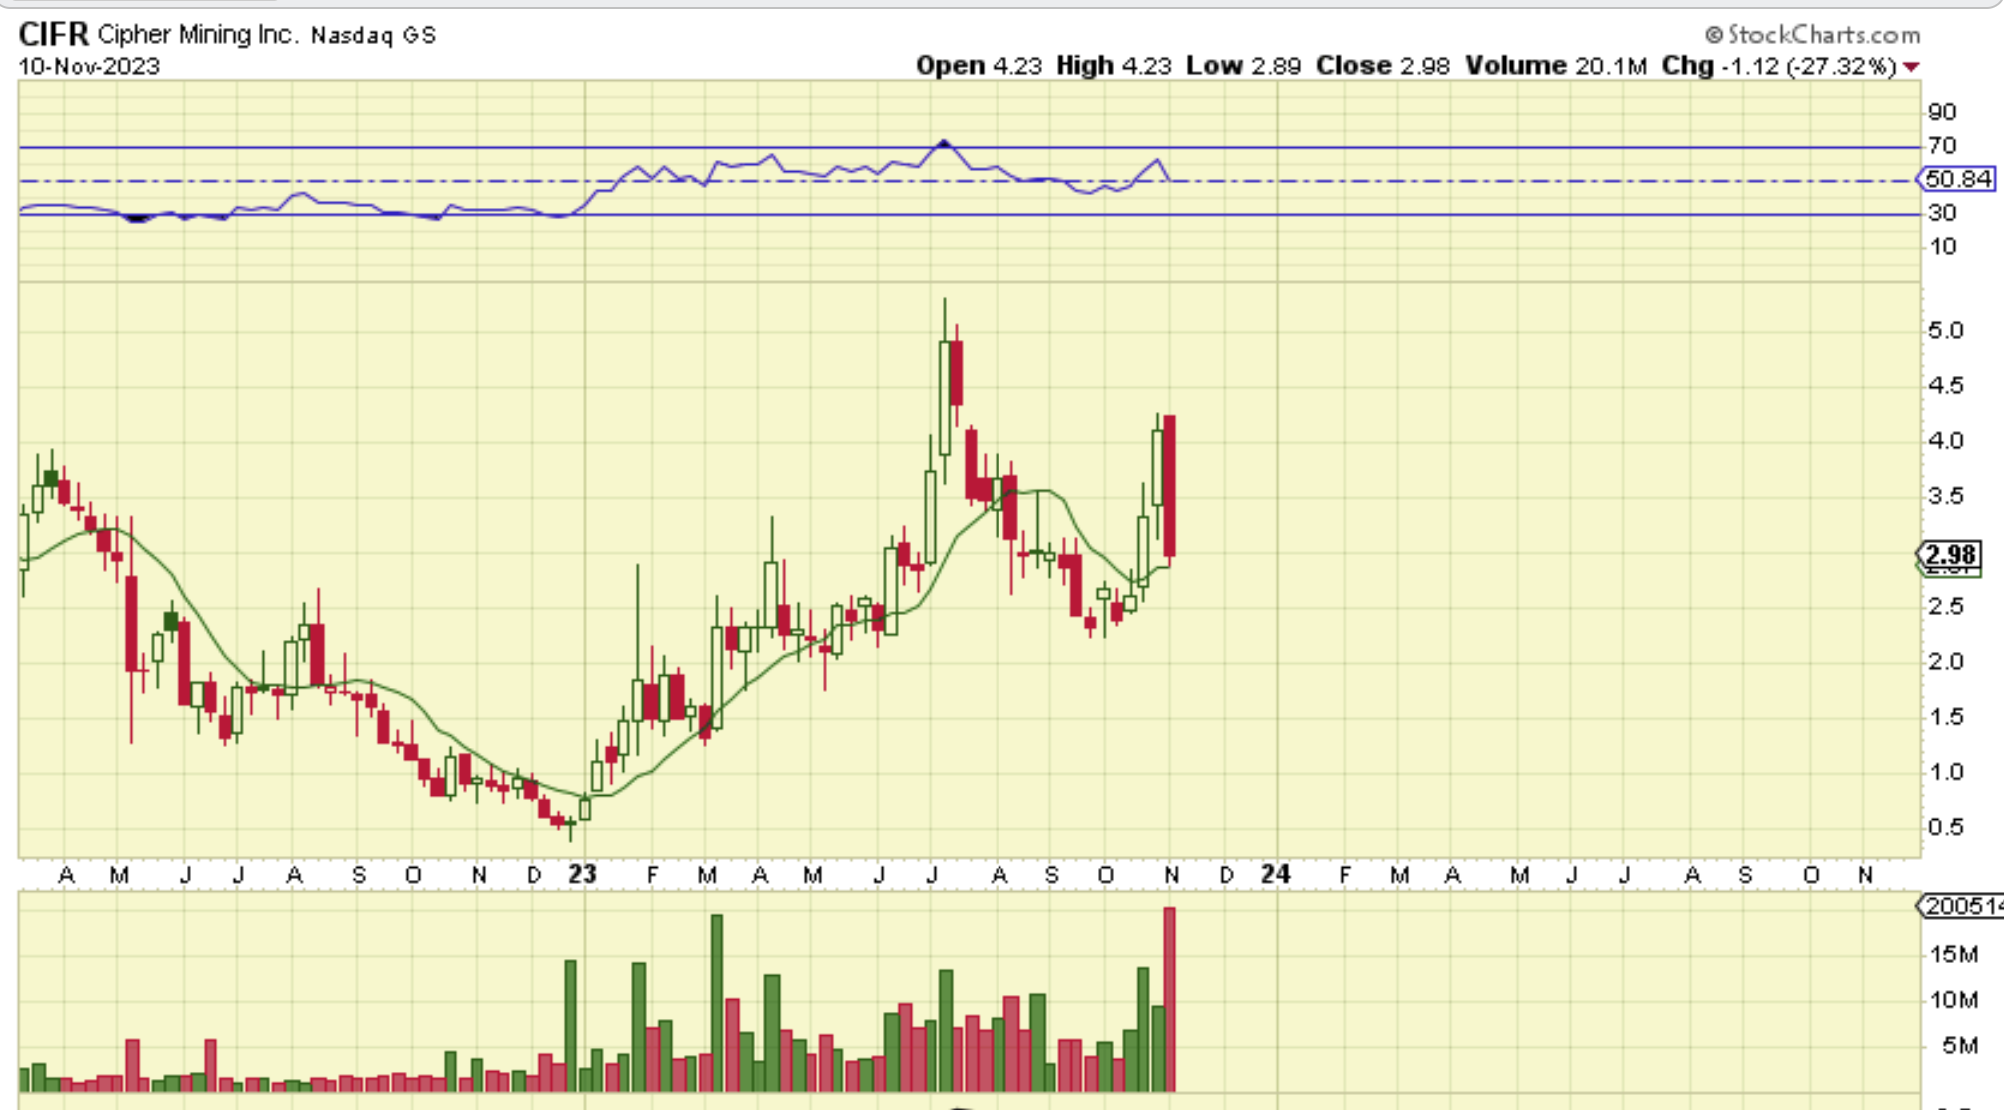
The point that I want to make again is that these are NOT YET Following the Crypto currencies, so I do not want to start putting people here into them yet. If you want to make that decision on your own, you can. You could always buy a small ‘buy & Hold’ with a stop and add on improvement, that is fine. I would look at the ones that have already released earnings and acted ok that day. I am thinking that Bitcoin should pull back soon and after a dcl, maybe then these will be ready? On the other hand, we have all seen Bitcoin just go parabolic, so if I was invested in the Cryto sector itself (Bitcoin, Ethereum, Litecoin, Doge, etc ,) I would be holding.

