Wednesday October 25th – This Set Up Looks Good
The only Data release that I see scheduled for today would be existing home sales, and I wouldn’t think that it would affect the markets one way or the other. We still have 2 ways of looking at the General Markets, but what we do have here is a ‘buy with a stop’ swing low in place. Let’s take a look…
.
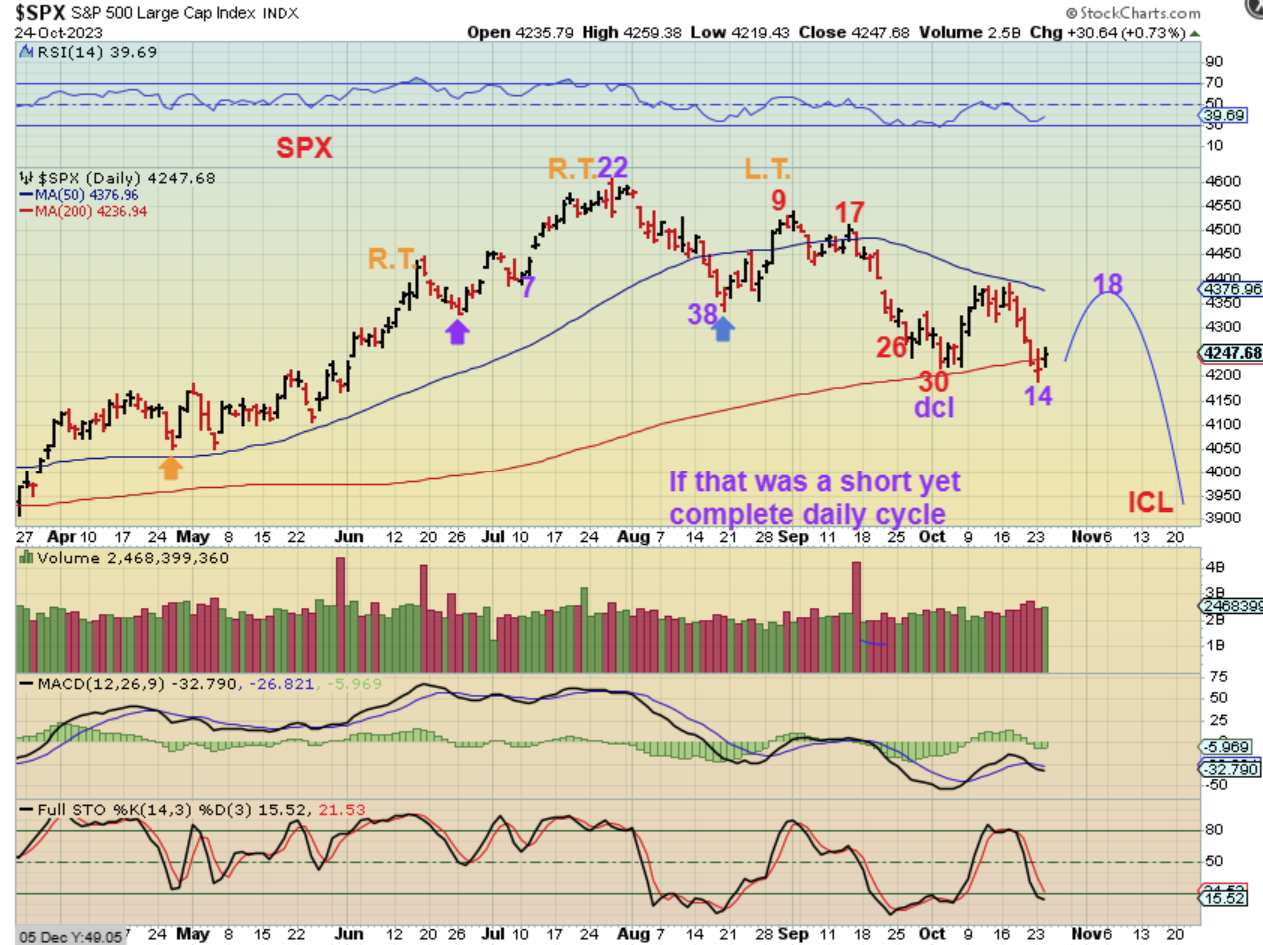
I was saying that a day 30 dcl seems too early, so we could bounce and break to a new low that would be the ICL or DCL. The problem is that the bounce was rather strong and that is a little odd for the last days of an ICL drop. That means I have 2 ways of looking at this.
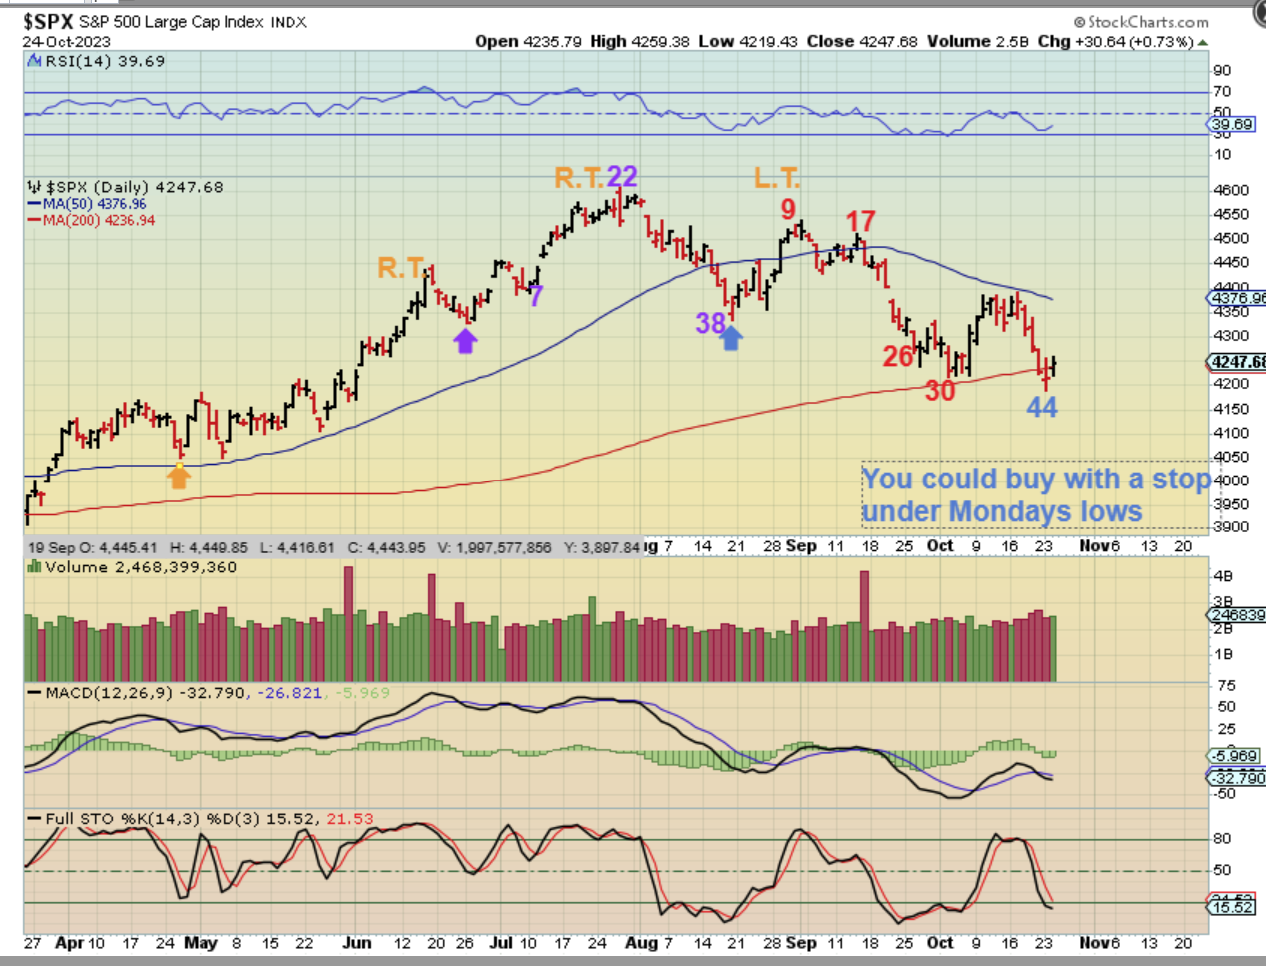
THIS WAY shows that we now have an extended 44 day long daily cycle and a swing low is forming at the 200sma. You could buy it with a stop under Mondays lows, and the ‘risk’ is minimal.
.
The other view would be that we DID have a day 30 DCL in The SPX, but it was rejected at the 50sma and we are now only on day 15. That would lead to a bounce and then another final drop. That would make this a 5 wave drop. For this one you can still buy this reversal with a stop and then consider shorting it if it does roll over, because it should have about 20 more days lower.
.
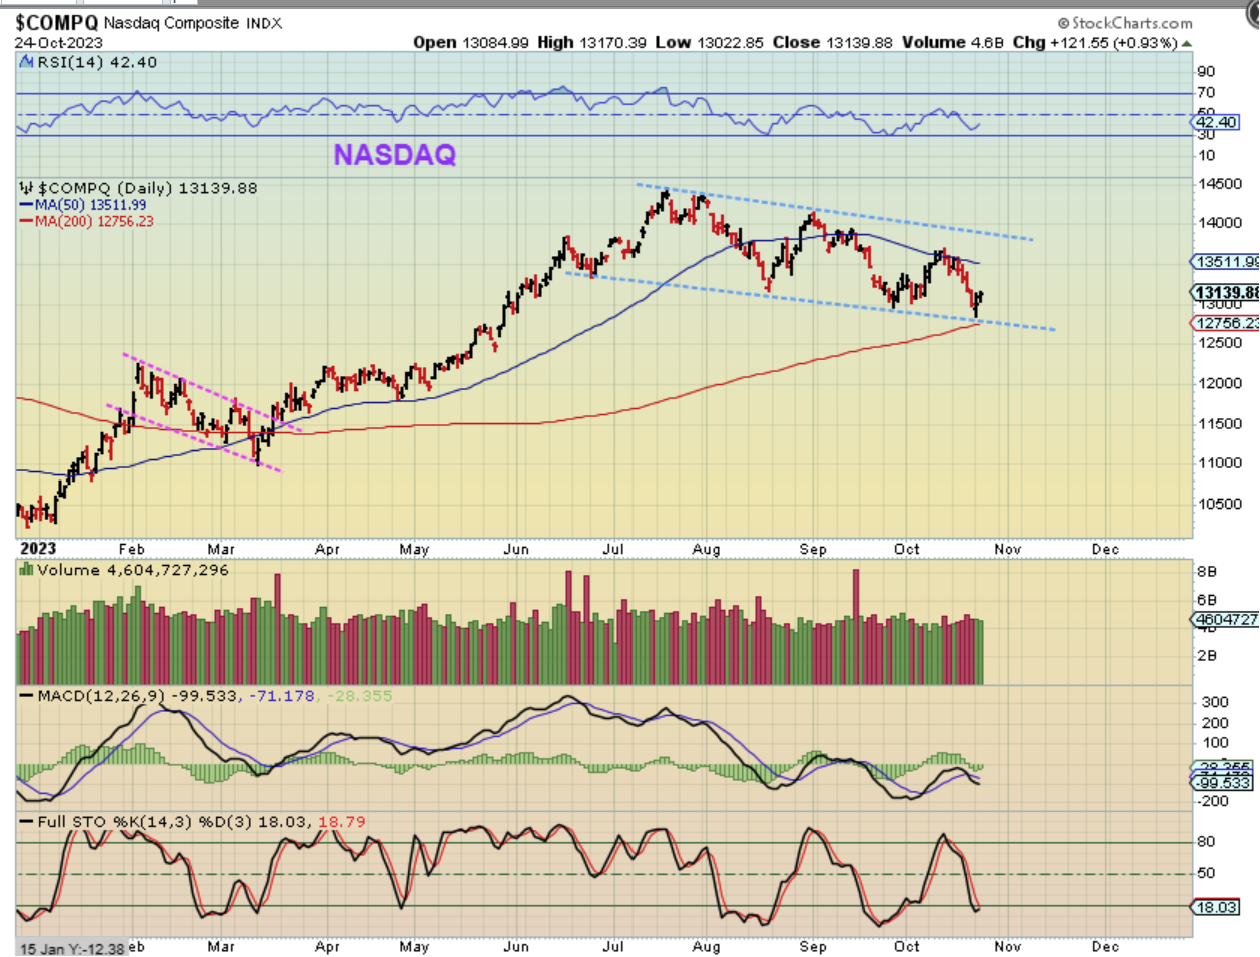
The NASDAQ: So while we use ‘cycles’ and ‘cycle counts’ to predict the drops, you basically can see that…
1. The markets rallied strongly in 2023 and
2. The markets are now consolidating those gains with a long choppy drop toward the 200sma.
3. So this does remain bullish at this point, we are just waiting for that final low (ICL) to reveal itself and a rally should develop.
.
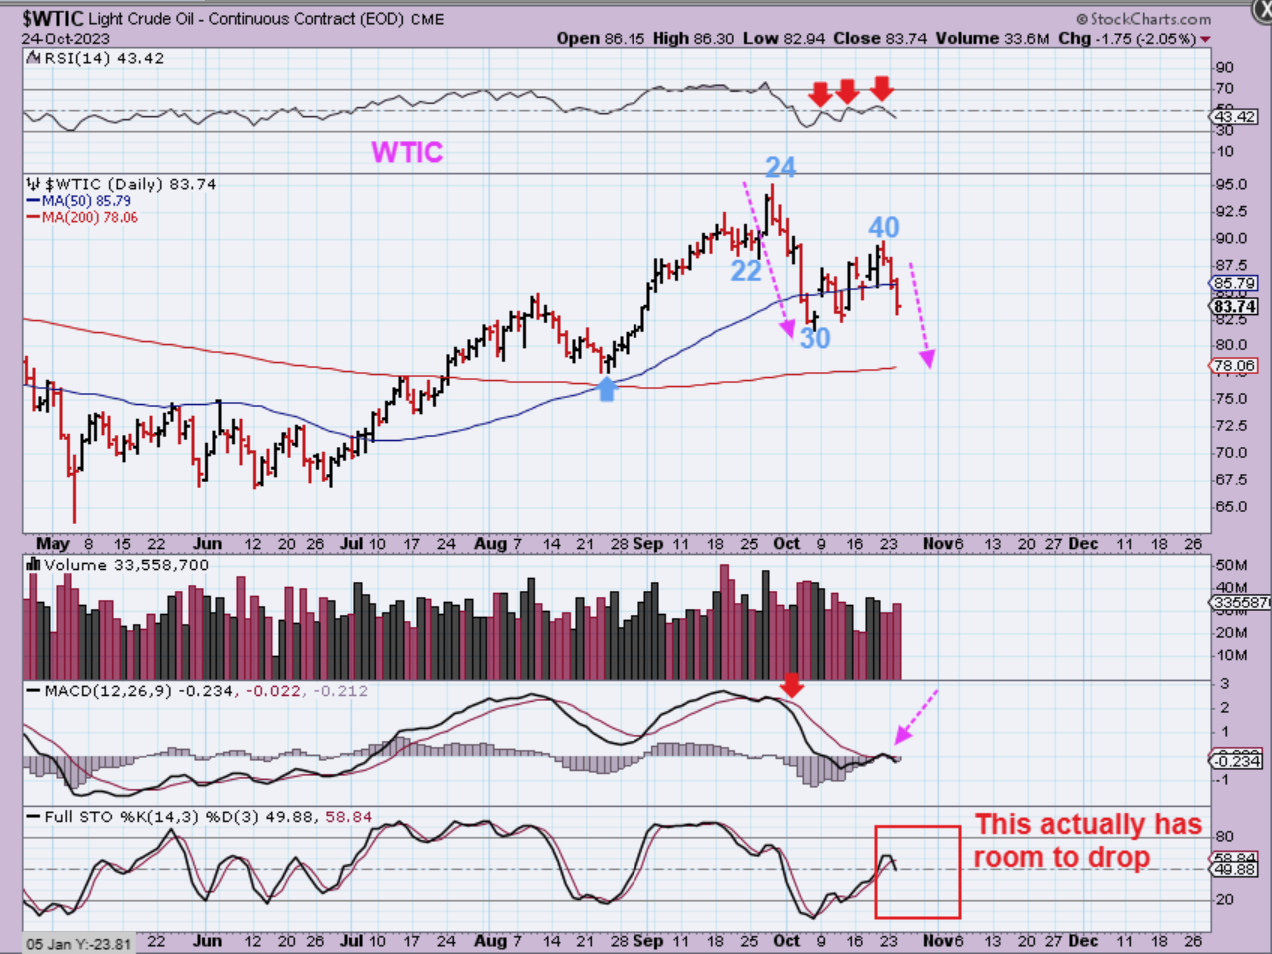
WTIC – I’ve been expecting a drop with Oil here and we did see some follow through, so now it has lost that 50sma again. I have an arrow that shows a drop to the 200sma, but it can break through it.
.
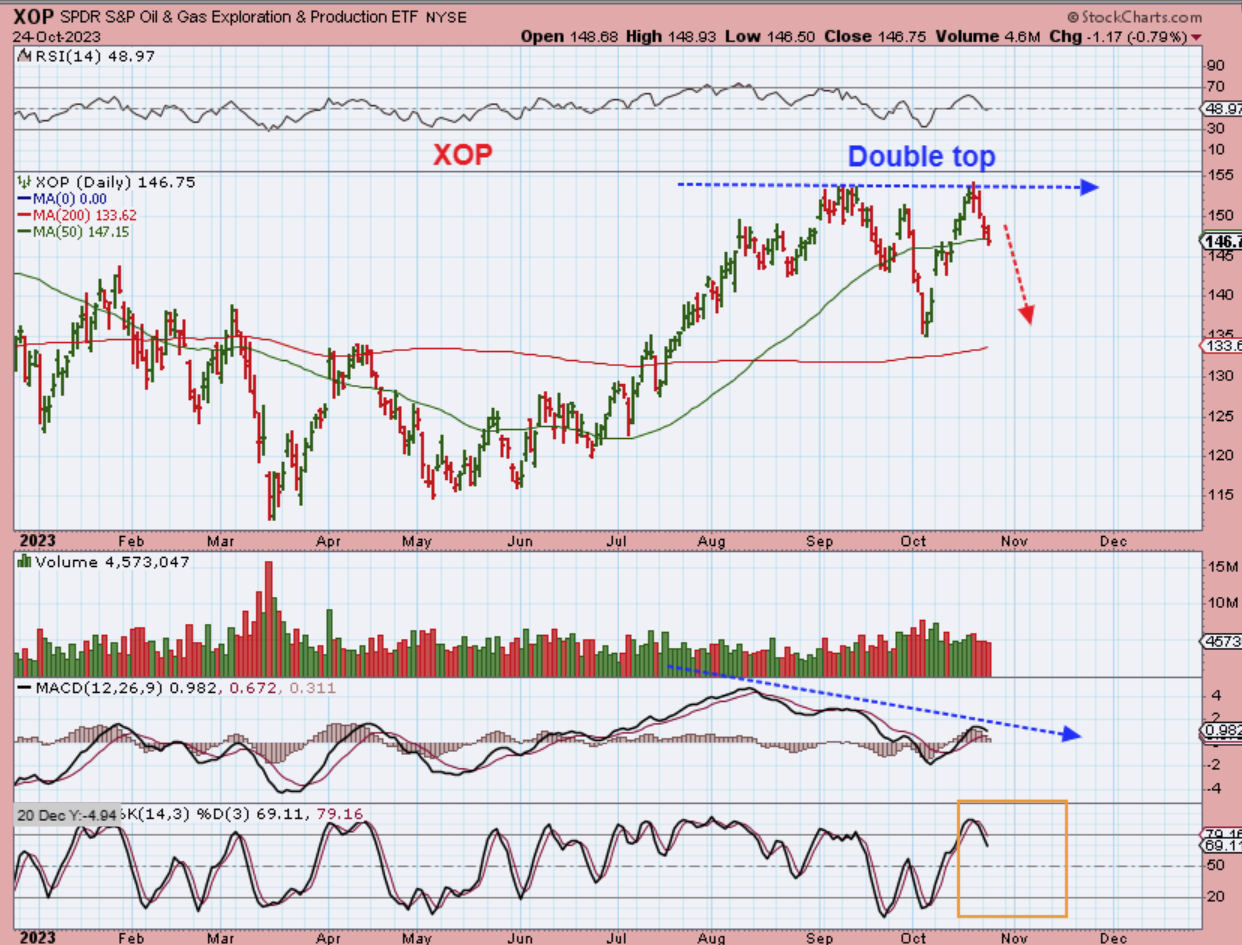
So now we have a slight change with Oil Stocks. They were leading the way higher and set up to break to new highs, but with Oil dropping, These also now look vulnerable, so…
.
THE XOP looks like it is now a double top with negative MACD divergence. Yes, it dipped to the 50sma and that looks ok, but with Oil breaking down I think that it is more likely that this will continue lower too.
.
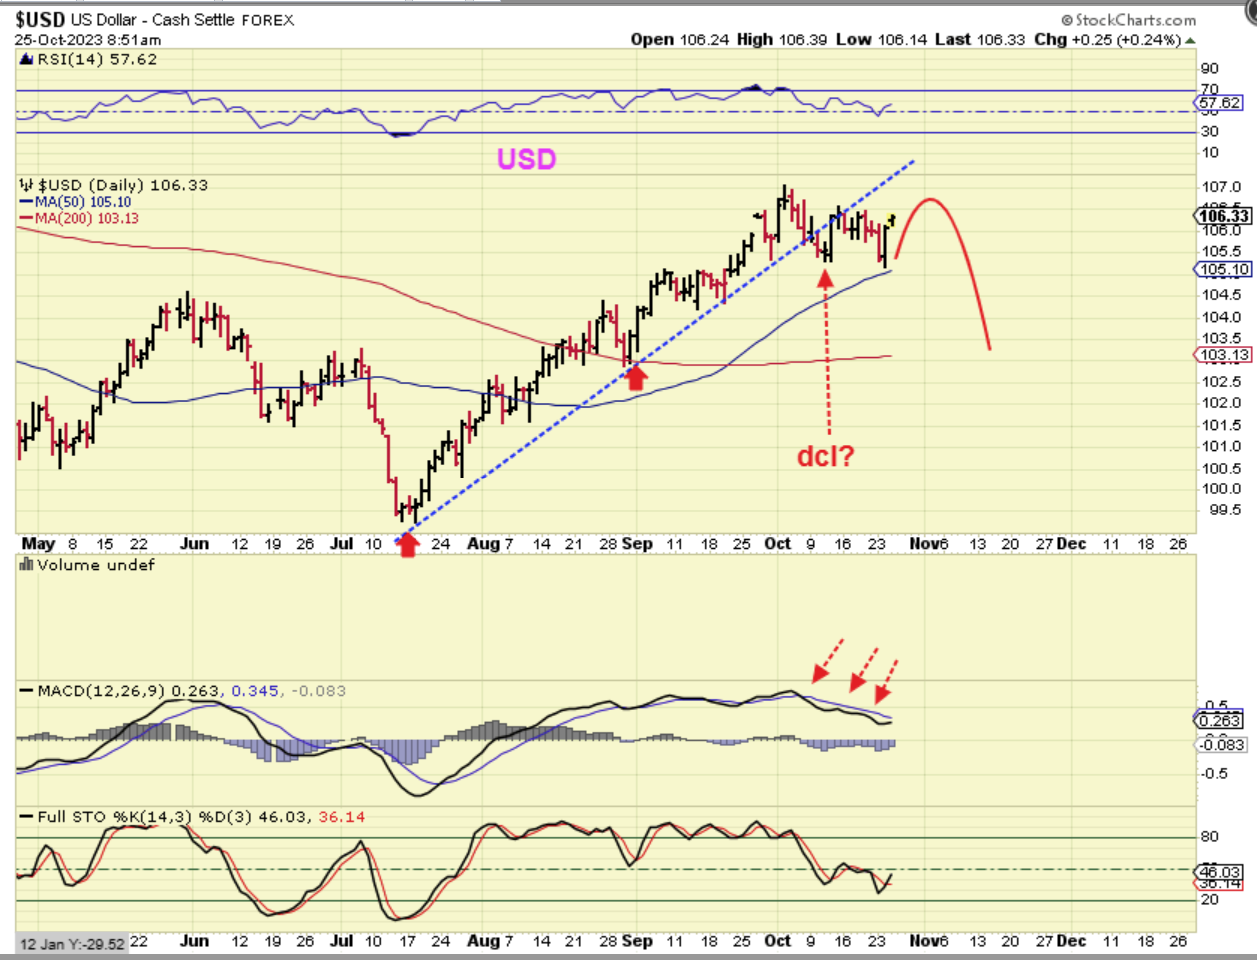
The USD is bouncing off of the 50sma area. I am still looking for a short-term bounce that rolls over as Left Translated, and that should give Gold its next run higher.
.
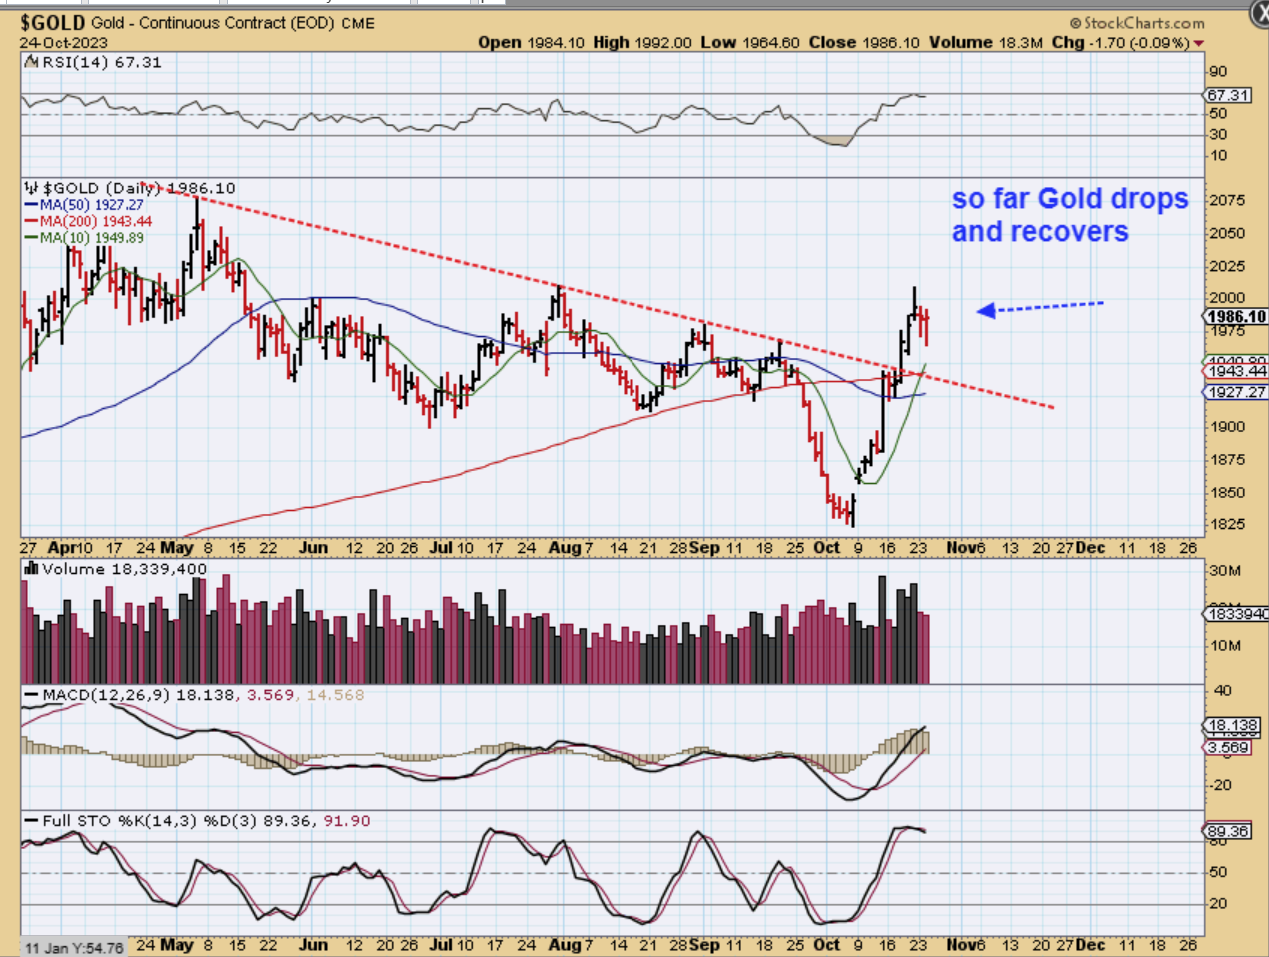
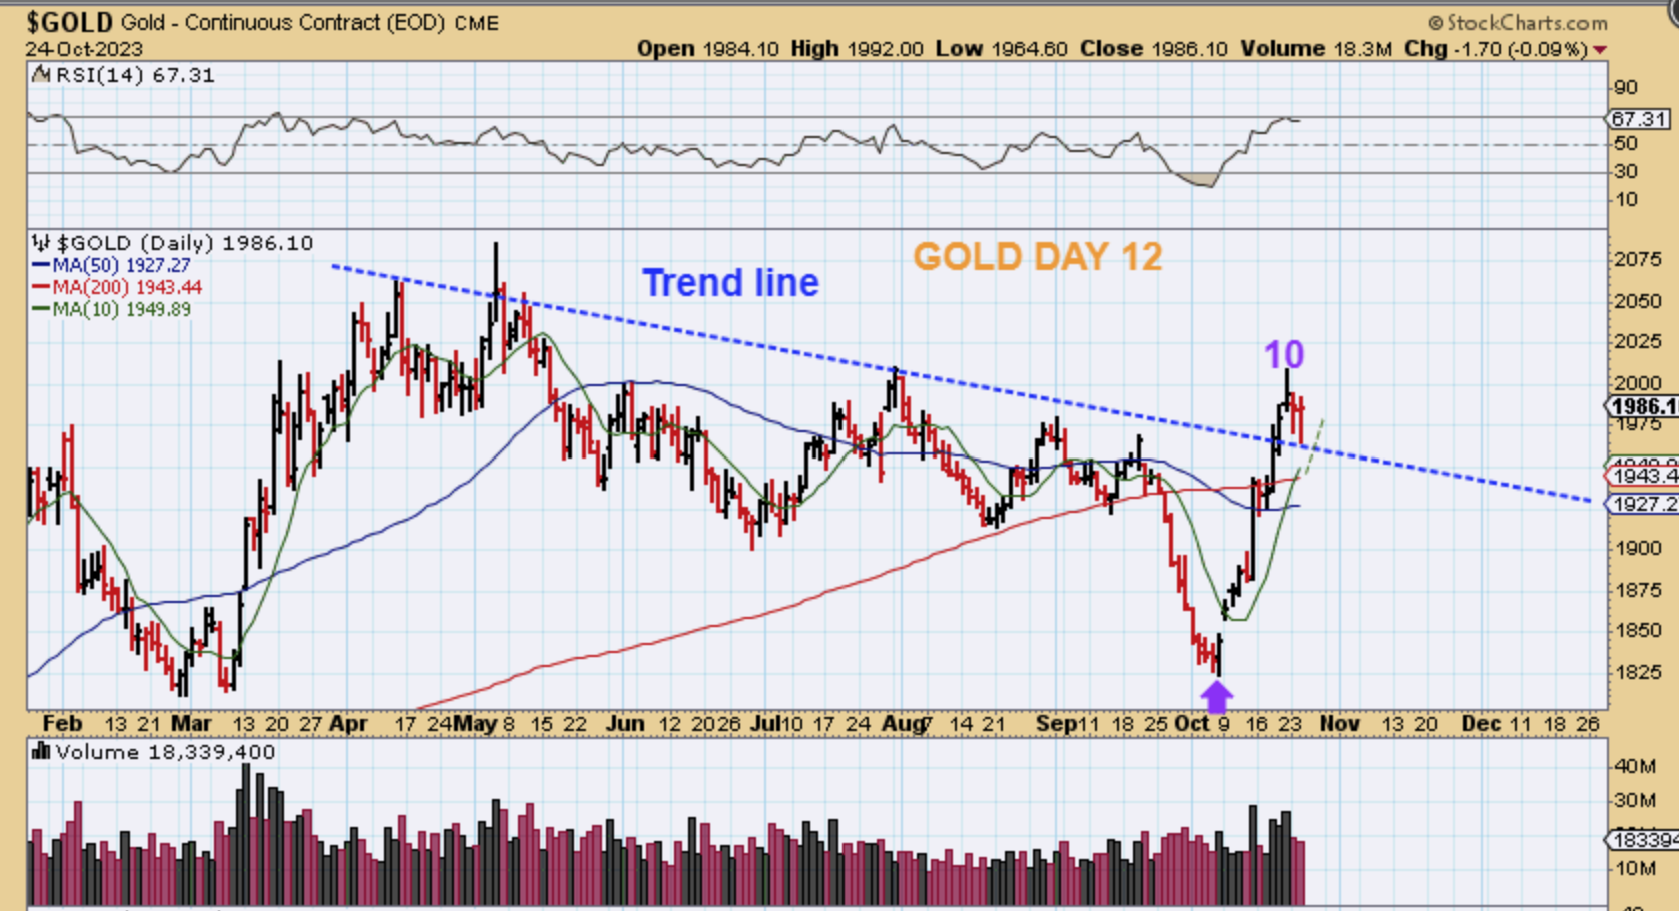
So far we are seeing GOLD drop each day and then start to bounce back as the day goes on. This is a bullish consolidation or pause, and since that was such a strong move out of the ICL, we are expecting another strong move higher. When will it start? How many days will this churn? How low will Gold drop? Those are unknowns.
.
Take a look at this chart of Gold: I drew this trend line from the last several ‘peaks’ and a tag of that trend line and 50 & 200sma below seem to be likely targets, but this next chart was interesting too…
.
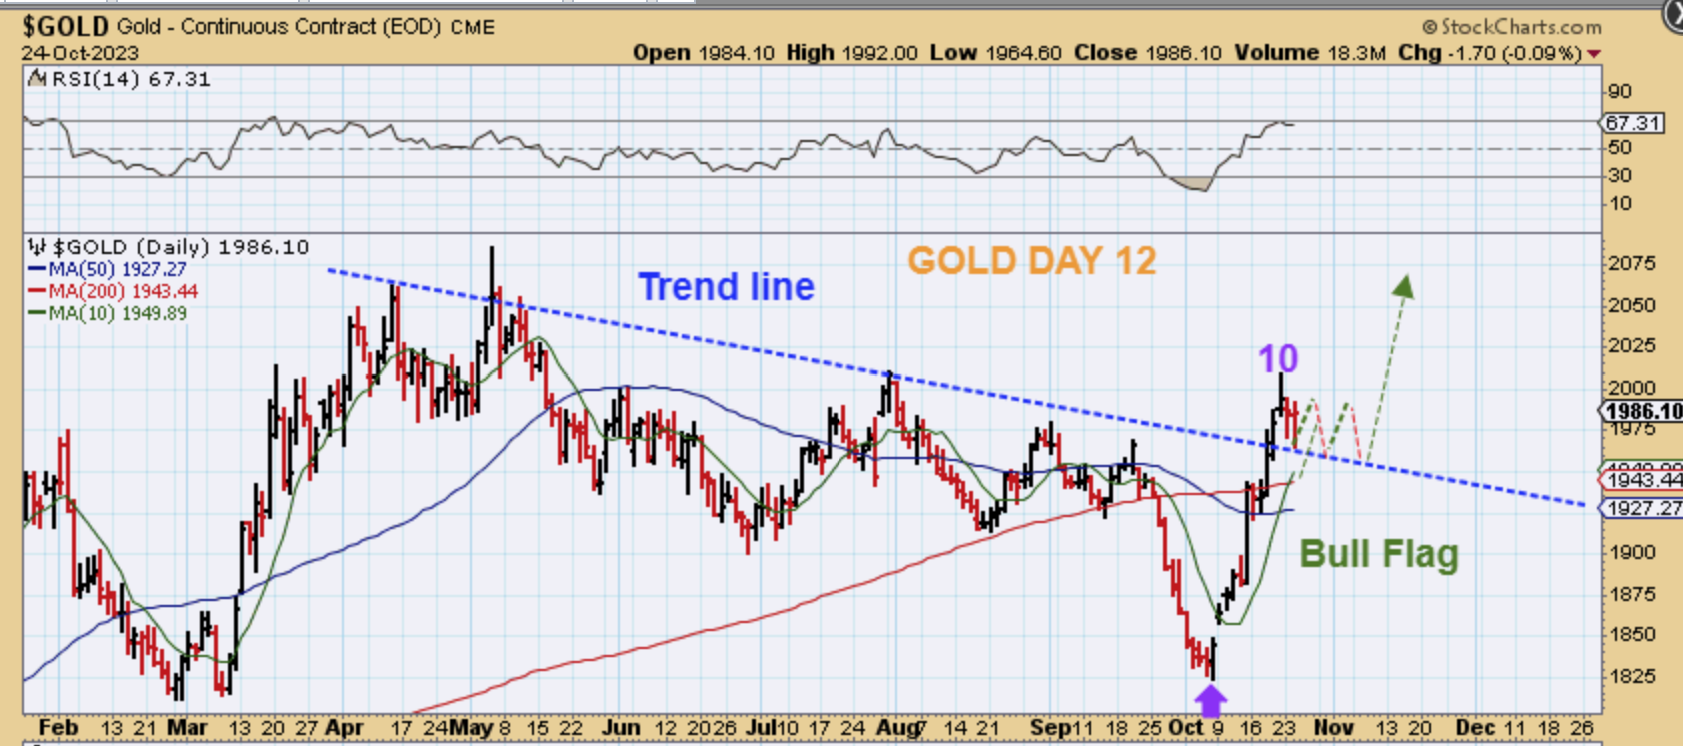
GOLD – I changed that trendline to ignore the May ‘spike’ and when I do price has been bouncing off of that trendline already. Gold is almost at the 10sma too, so we while we may get the deeper drop on the chart above with a USD bounce, we should also be ready for the 2nd leg of that rally to begin at any time, when we consider this chart below.
.
GOLD – A bull flag can also be a boring extended churning sideways of price, so I have drawn that here too.
.
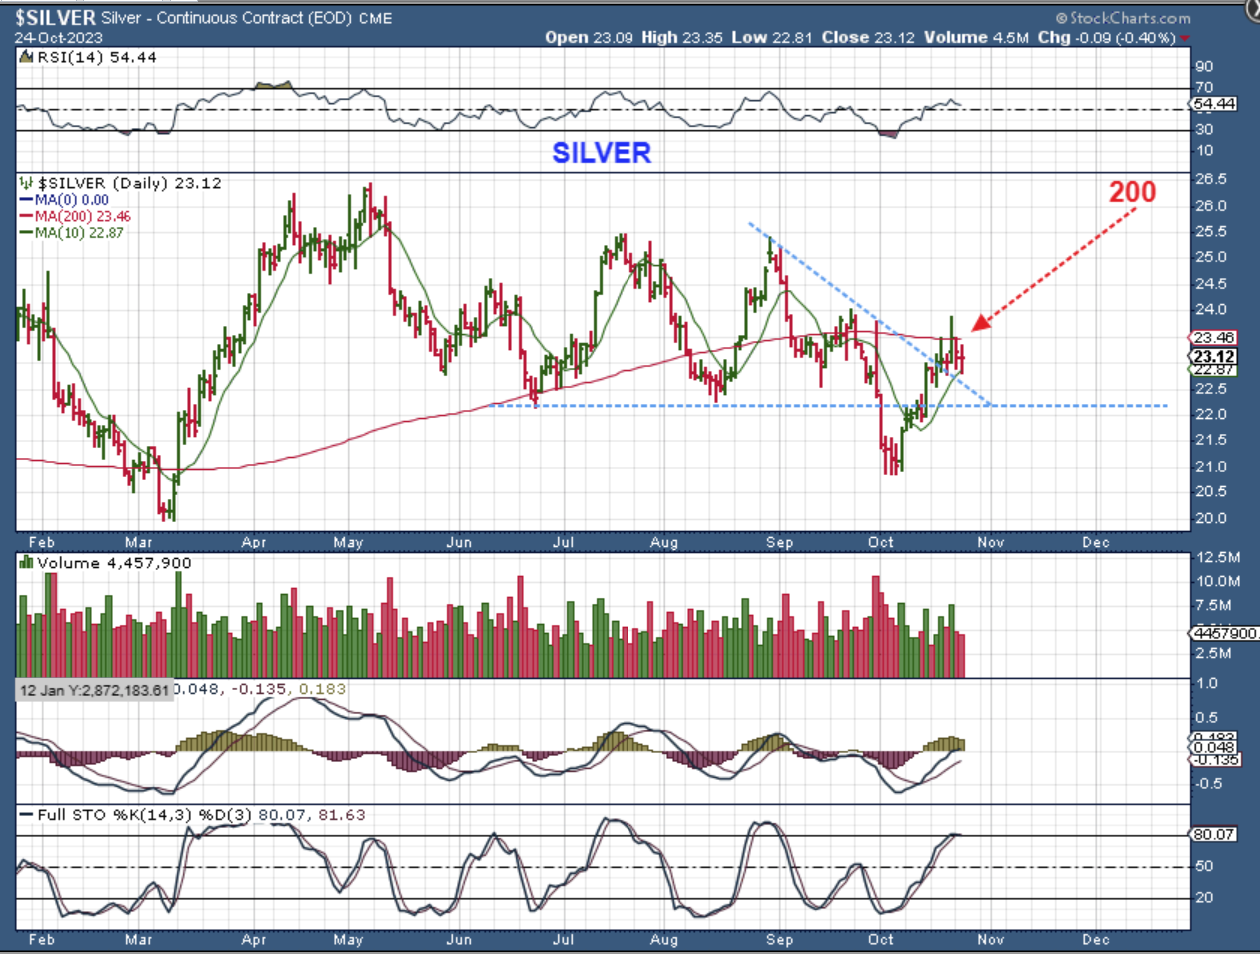
SILVER is stalling under the 200sma, likely building energy for a break out.
.
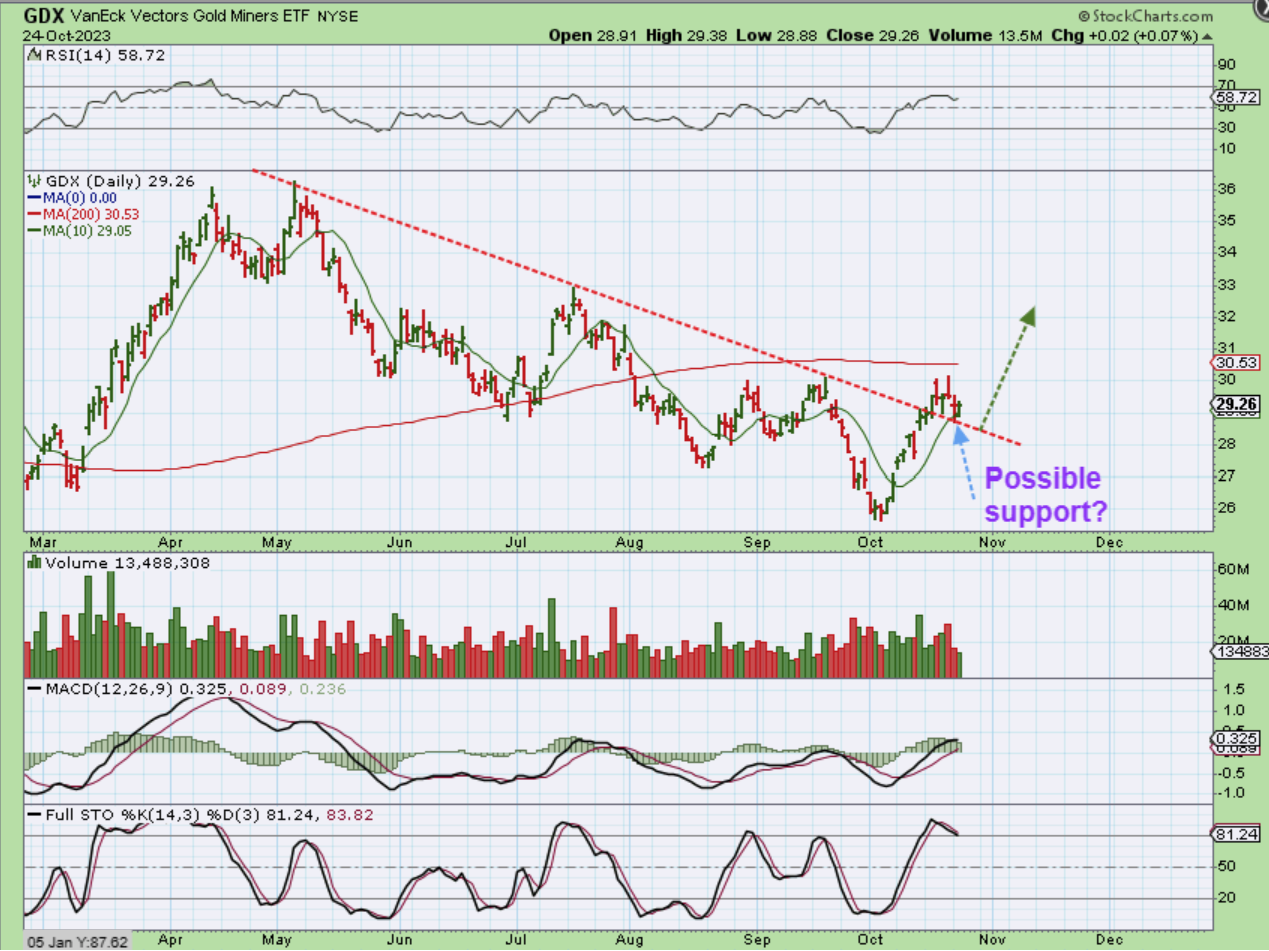
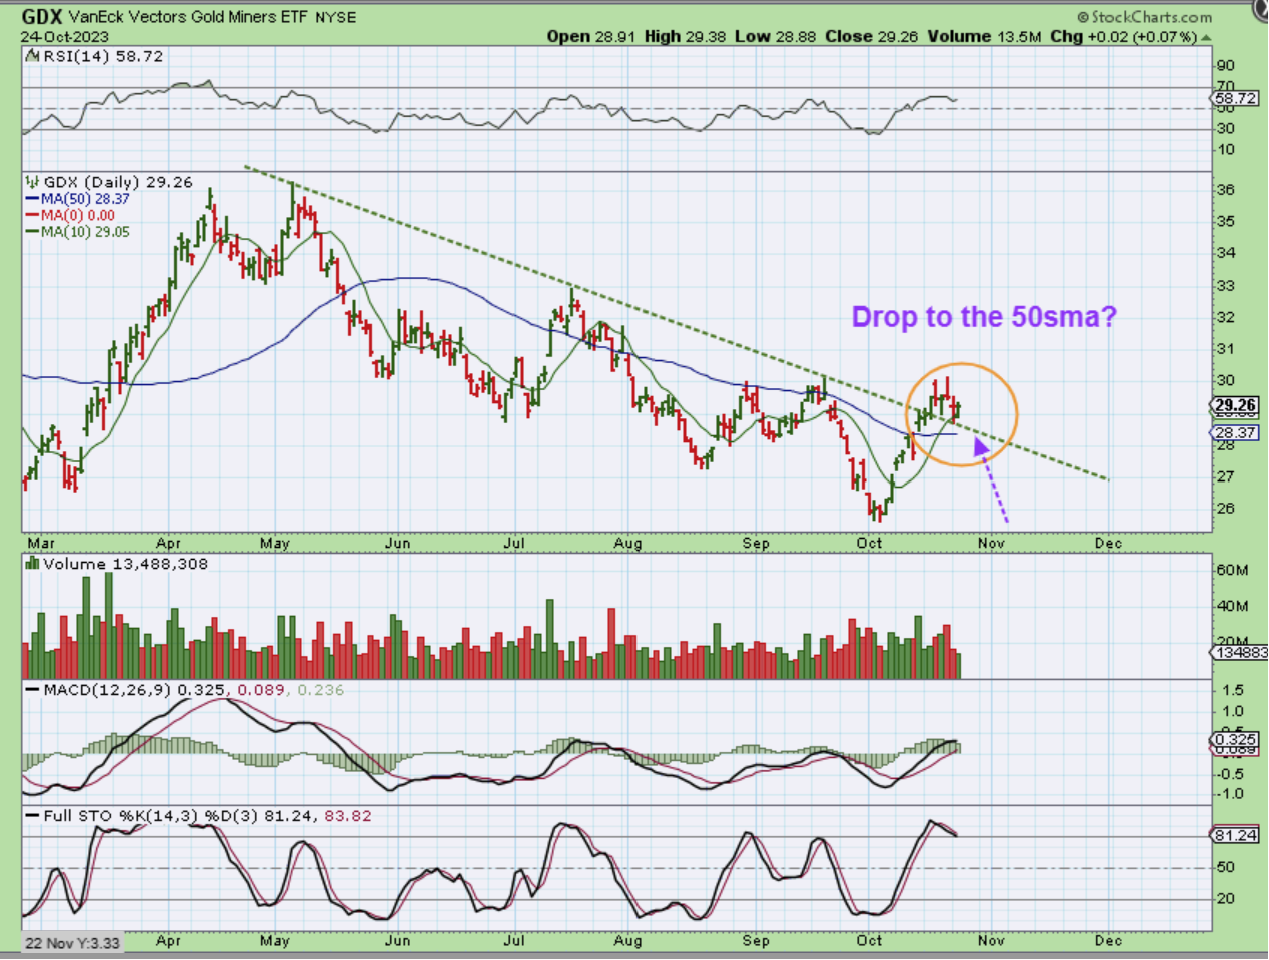
GDX may be at a support area.
.
GDX may be at support with the trend line and 10sma, but it also shouldn’t surprise anyone if it just drops to the 50sma too.
.
I’ve been looking at various Miners and really, we have a mixed picture as to how they are pulling back. This is likely due to the different ways that they ran out of the lows.
.
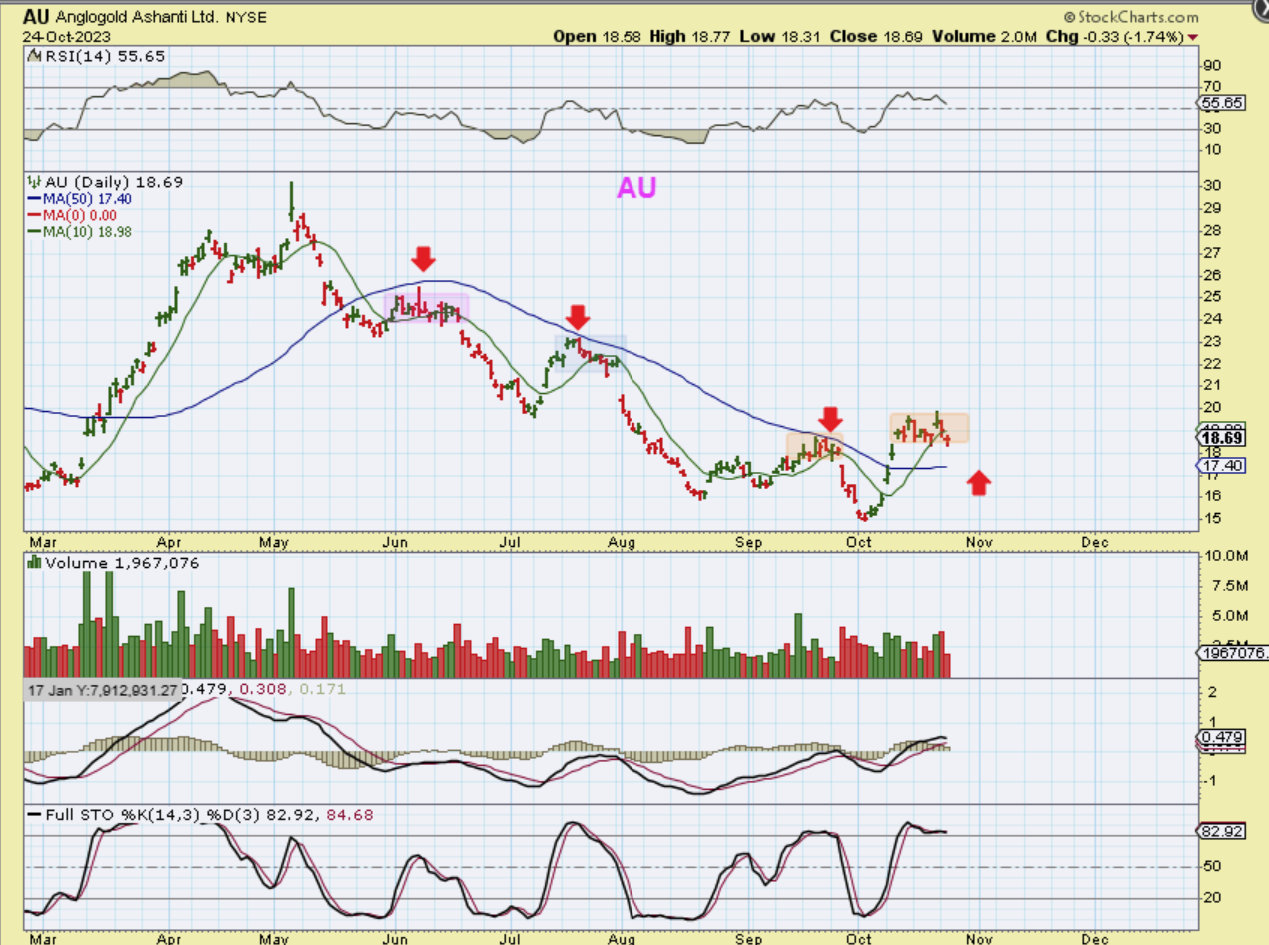
AU ran strong and it has simply been chopping sideways over toward the 10sma, but it often ran up to the 50sma and then dropped, a drop there seems possible and would be a buy if it reverses there as support.
.
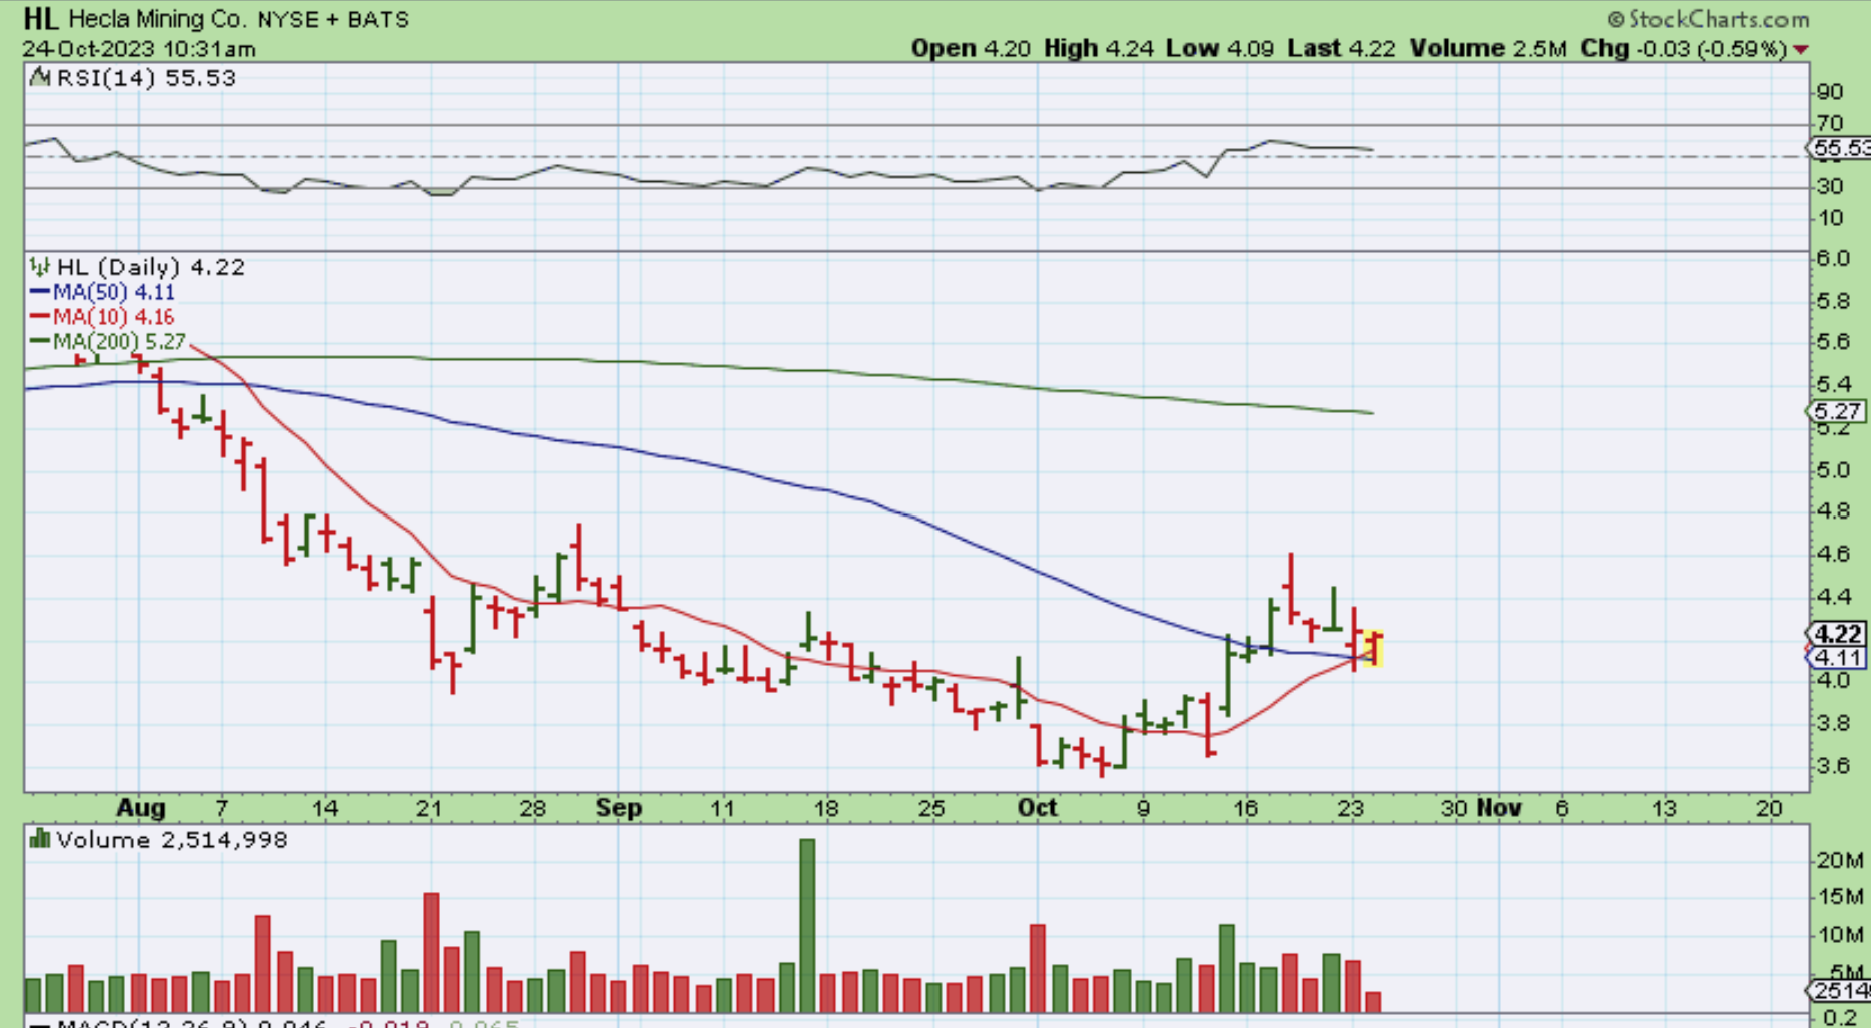
HL and a few other silver Miners seem to be holding up and riding along support so far.
.
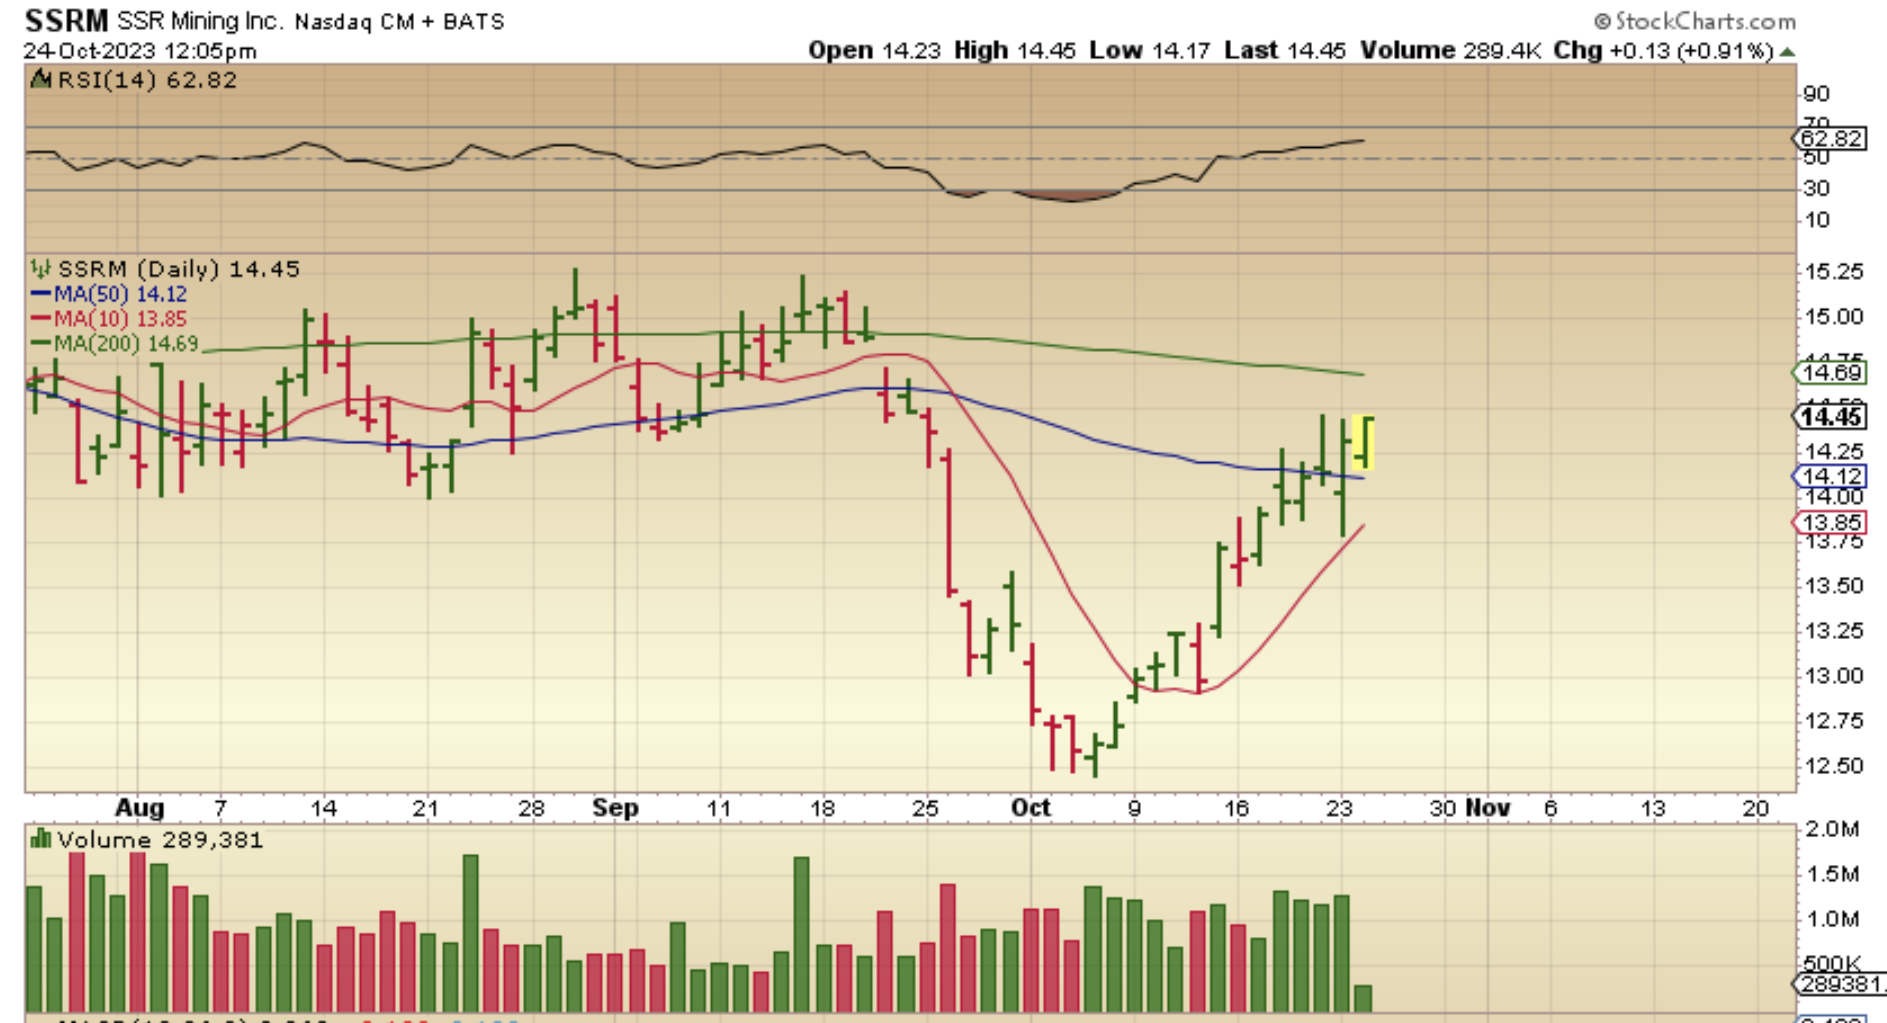
SSRM has actually closed green all week and may be heading up towards the 200 sma.
.
– So we have a swing low (unconfirmed) in the General Markets, but is it THE LOW or just a dip that bounces and leads into a final drop? That takes time to play out and give us the clues that we need, but you can buy the reversal with a stop and raise stops if price moves higher.
.
– Oil looks ready to continue its move lower, and Oil stocks seem to have double topped for now.
.
– As for the Precious metals? We expected this to be a down week. You can go back and read the weekend report and you will see that. Now we just have to try to patiently watch how things unfold, and so far it is more of a sideways chop lower, where the morning sell off ends up getting bought back up, but the selling certainly may not be done yet. These moves can last for a couple of days or even several days. When I look at a variety of different miners, they are acting differently during this consolidation period, making it difficult for those that want to add or buy them. Will they drop further? They could. Might they just start another run higher in a day or 2? They could, so we just have to be ready for anything. I said from the beginning that the basic strategy of a move out of an ICL is to buy a basket of Miners and just hold on through the wiggles. In a month or 2, Prices should be a lot higher than your entry. Anyone that bought HMY, GFI, AU, etc is still holding good profits (I owned those), anyone that bought Silver Miners ( I bought a couple of those too) are a bit disappointed due to the lackluster move higher, but that could change by the time this rally unfolds. It just takes time. I want to discuss Uranium stocks below, enjoy your Wednesday trading.
.
~ALEX
.
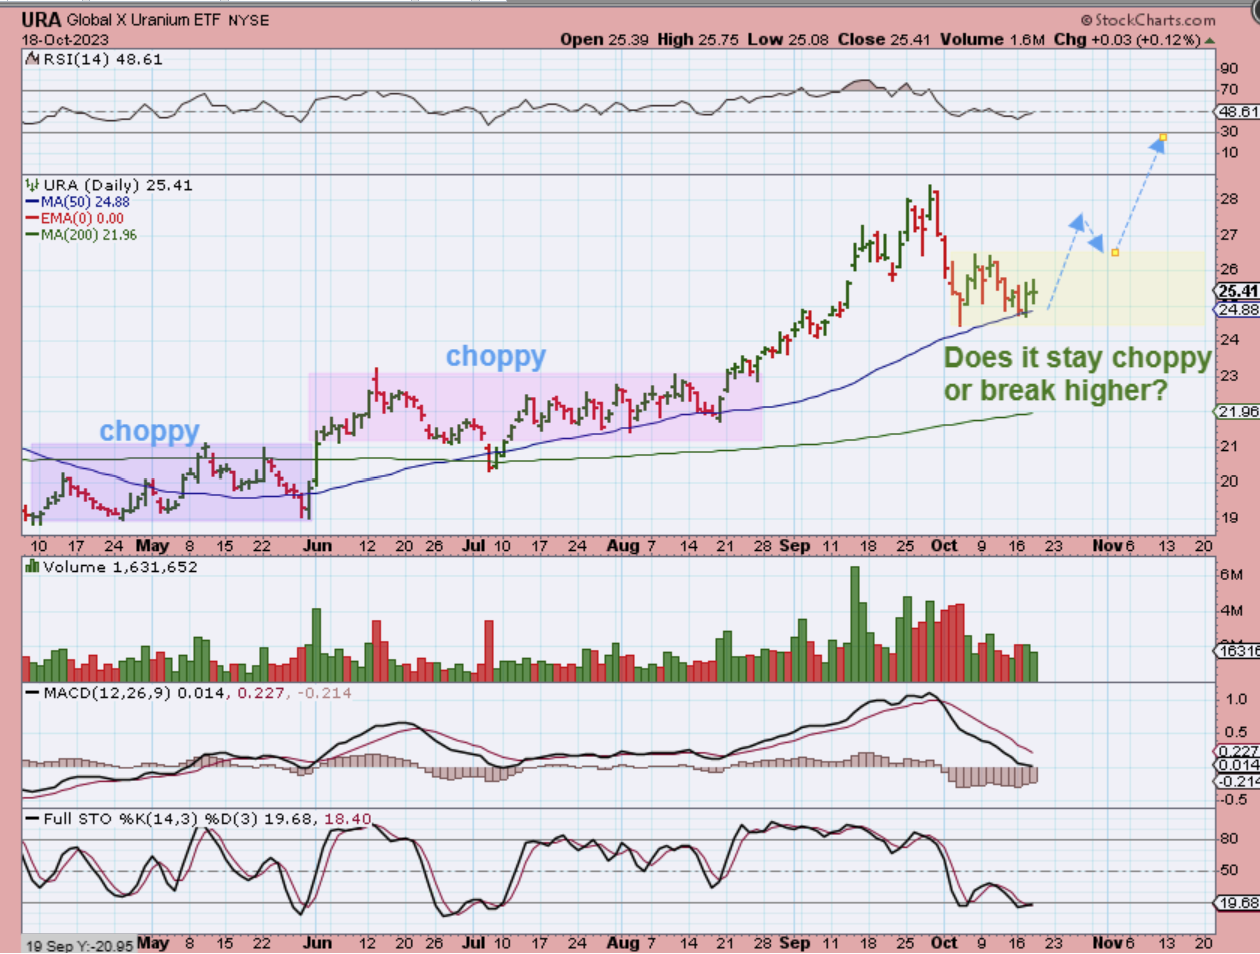
I pointed out Uranium stocks in the summer and also a couple of weeks ago as Bullish, so a couple of weeks ago I mentioned that many were reaching a support level. I then added that they are a buy but also that they are notorious for chopping sideways and not just running higher.
This was URA on OCT 18 at the 50 sma support. You can see that I was discussing that choppiness as possibly repeating. SO DID THESE JUST RALLY HIGHER, OR WAS IT CHOPPY LIKE I MENTIONED?
.
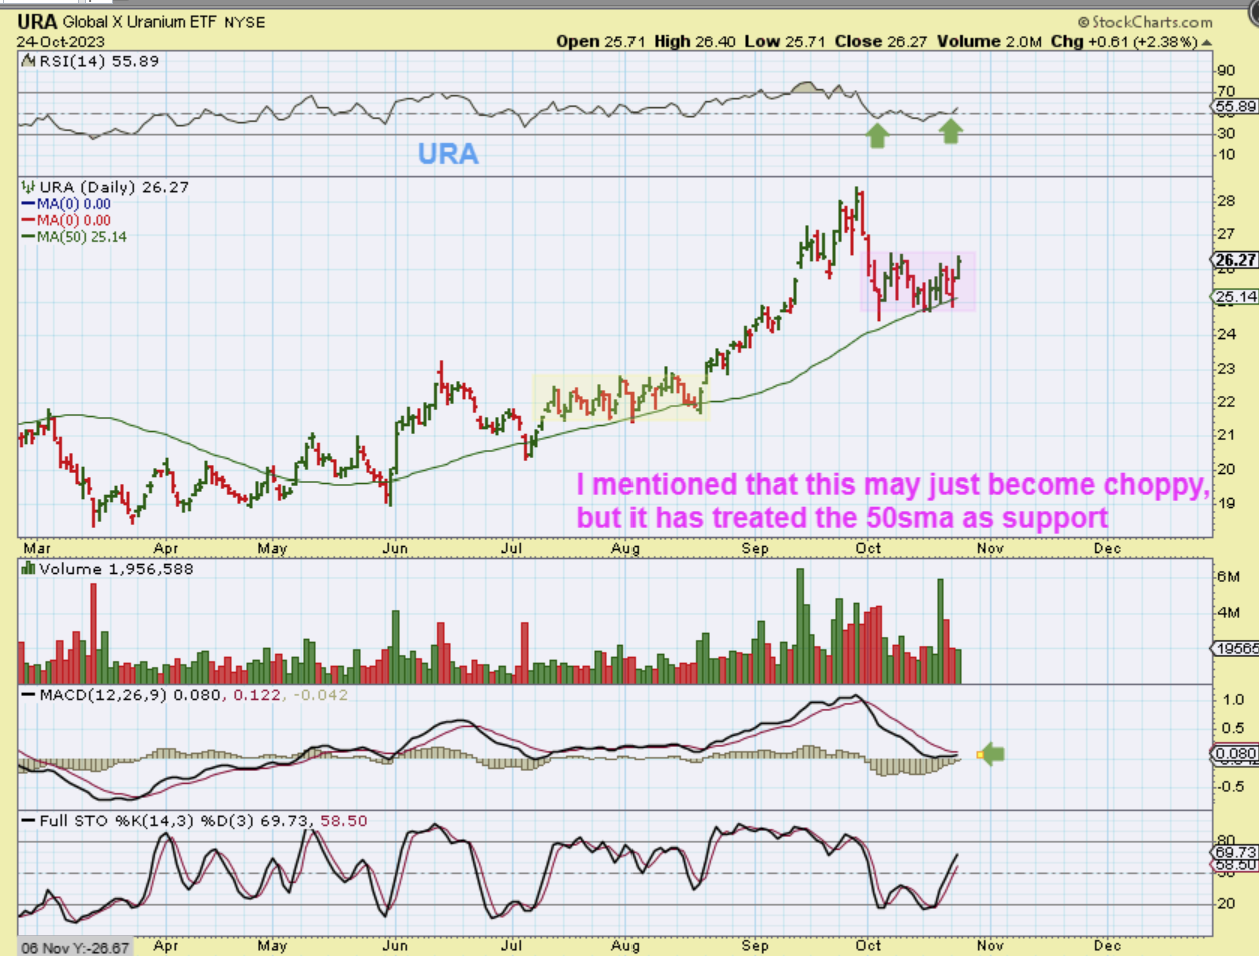
Well, those uranium stocks churned sideways, but they do look set up to run higher again, so these are a buy at the 50sma, but yes- they may just remain choppy and that can be frustrating.
.
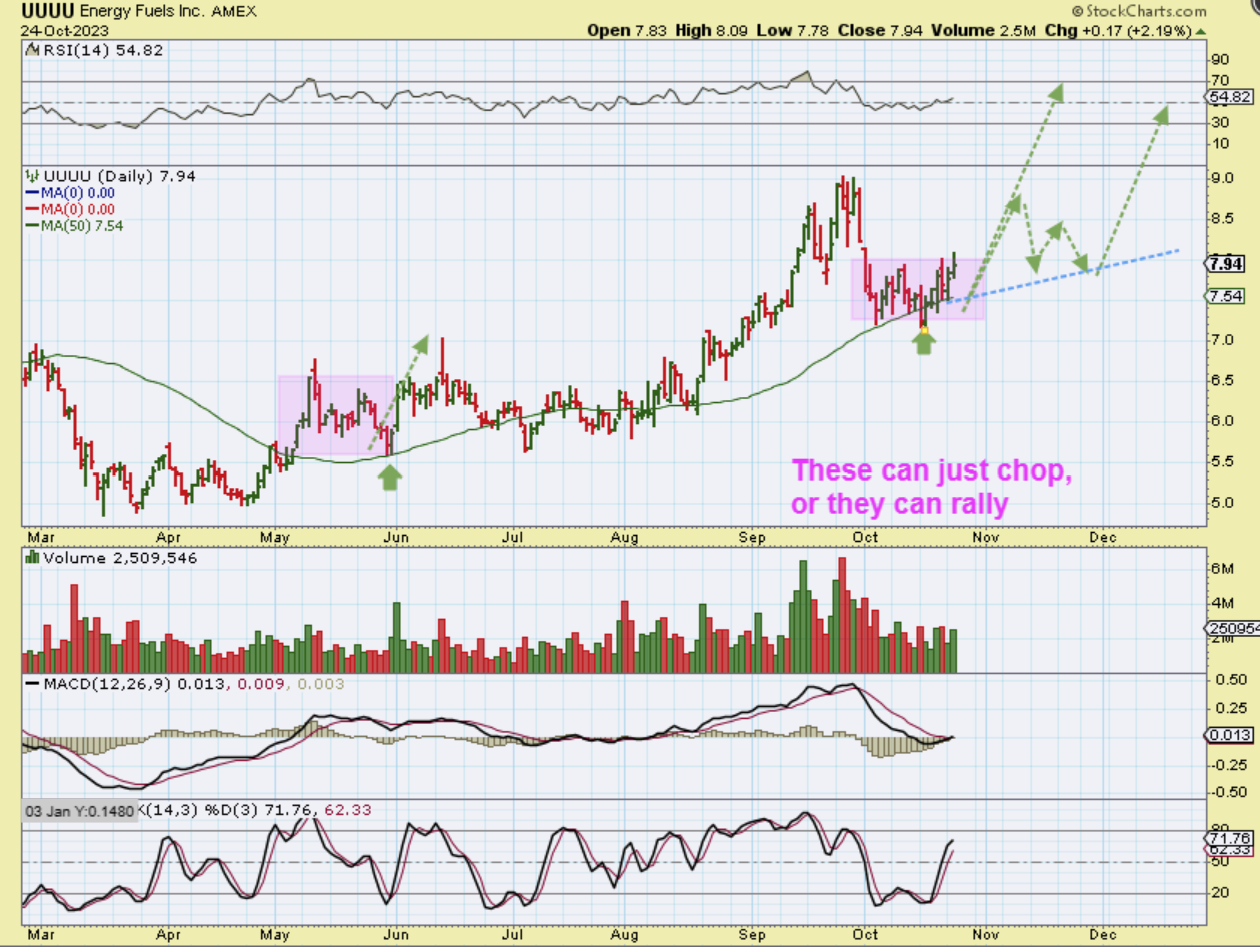
So with a stock like UUUU, we may see a sudden rally higher or a bounce along the 50sma, both are shown here.
.
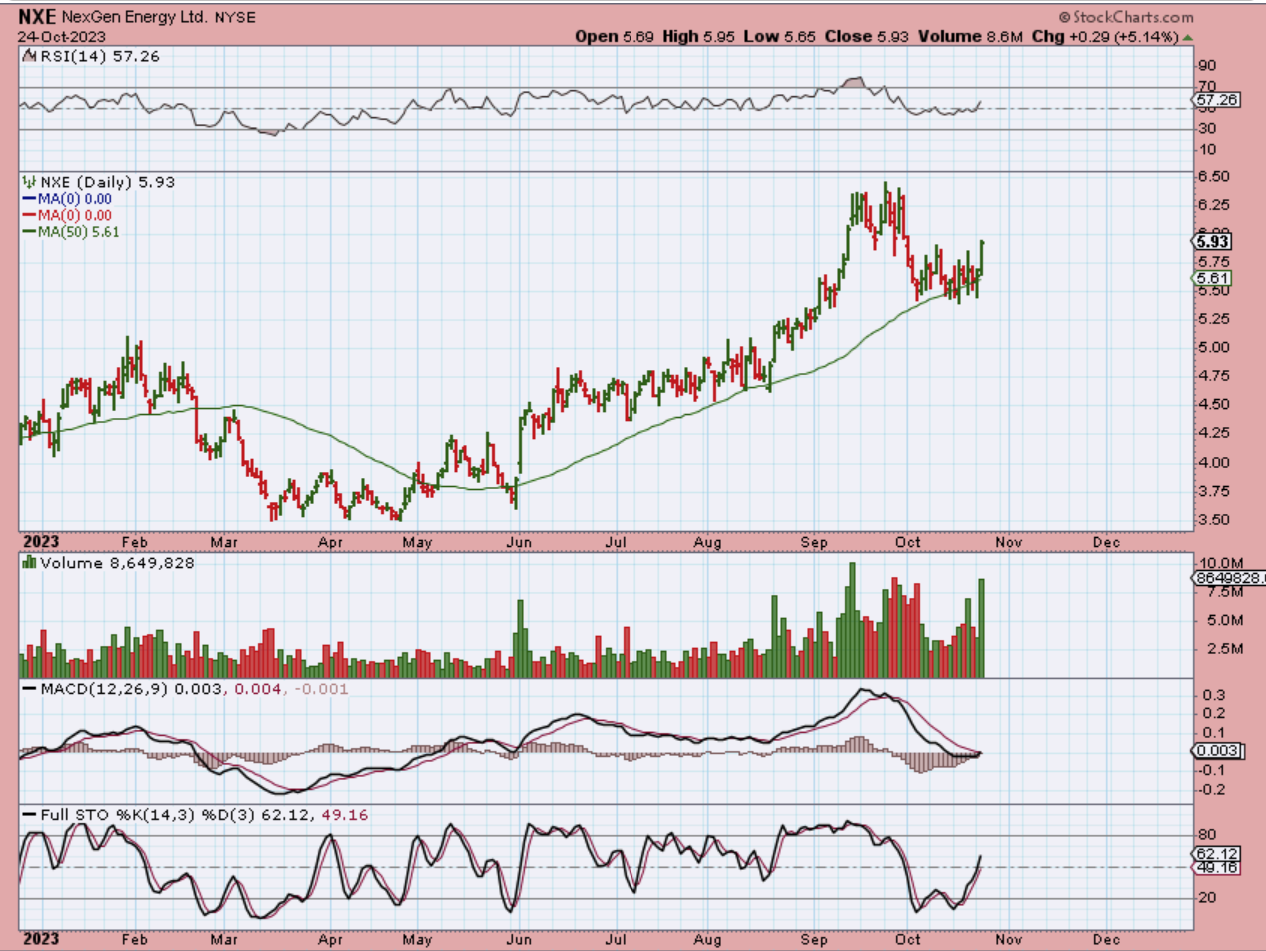
NXE had a nice 5% pop yesterday, so it looks good as a buy, but you just have to be prepared for a bumpy ride with these. Overall, the big picture on these is bullish s they chop & rally above the 50sma. See also UROY, DNN, URG, CCJ, etc.