Thursday October 26 – Jobless Claims
.
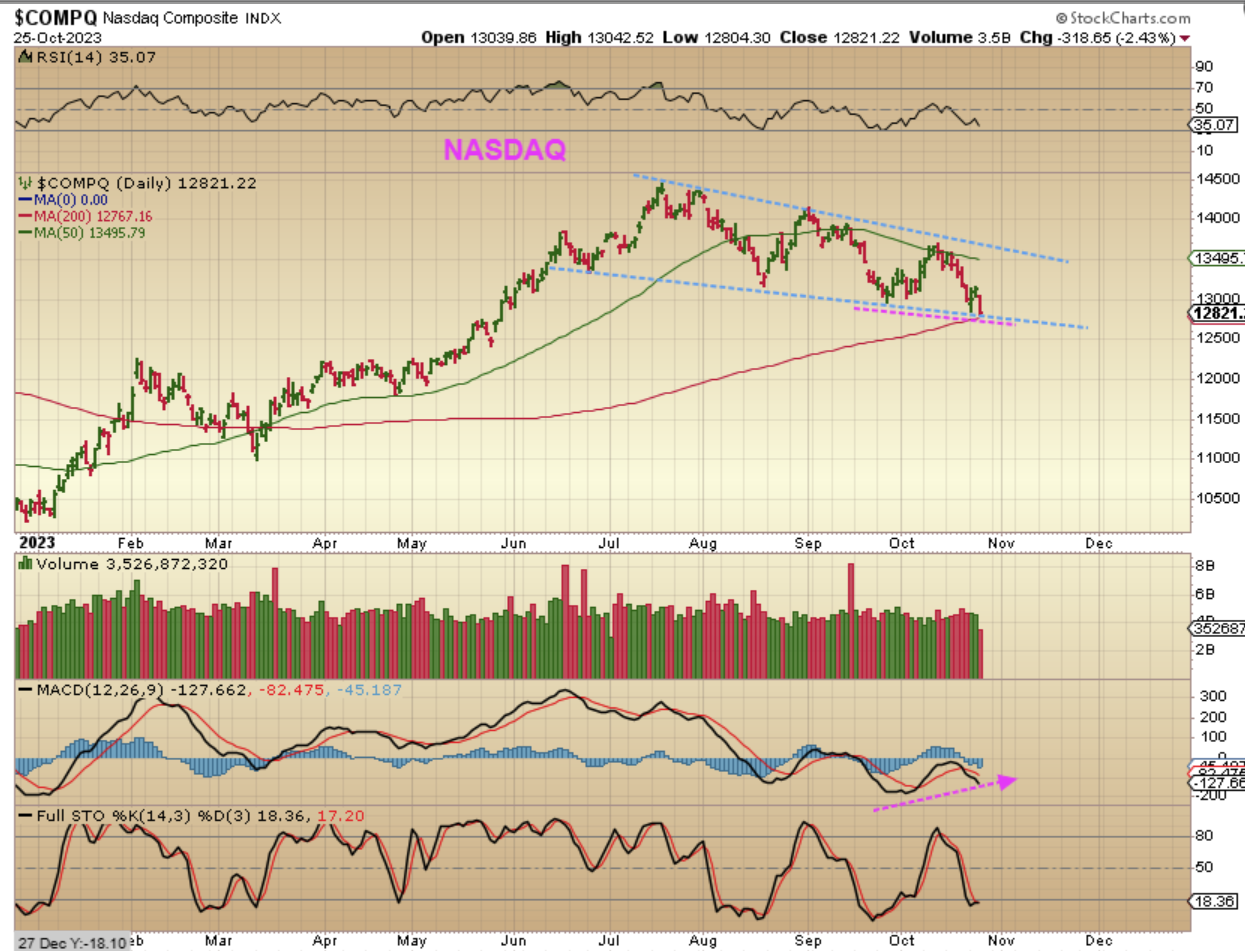
The NASDAQ dropped on Wednesday and we broke to a new low where the Nasdaq is finally down at the 200sma. You could look at this as a 5 wave drop ( 1-2-3-4-5) and today we have the jobless claims report being released at 8:30. We’ll see if that turns things around and leaves behind an ICL (a meaningful lasting Low). I usually like to see wave 3 much longer than wave 1, but in this case we are simply due for a reversal.
.
FROM YESTERDAY:
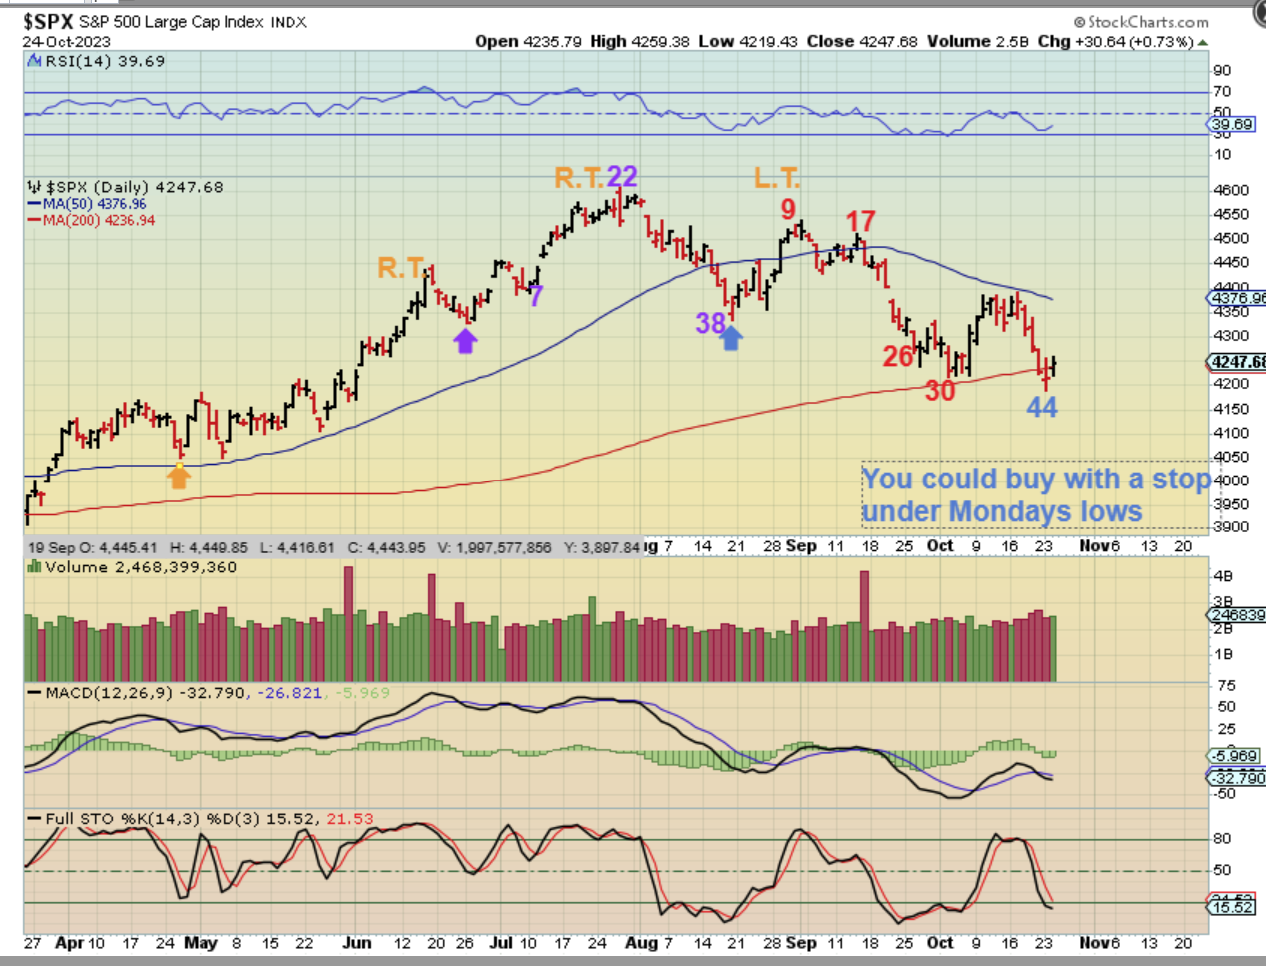
THIS VIEW shows that we now have an extended 44 day long daily cycle and a swing low is forming at the 200sma. Since this broke to a new low on Wednesday, we would be on day 46. I bought this with a stop, I already got stopped out. Not a big loss, but I was hoping for a run to the 50sma. So now…
.
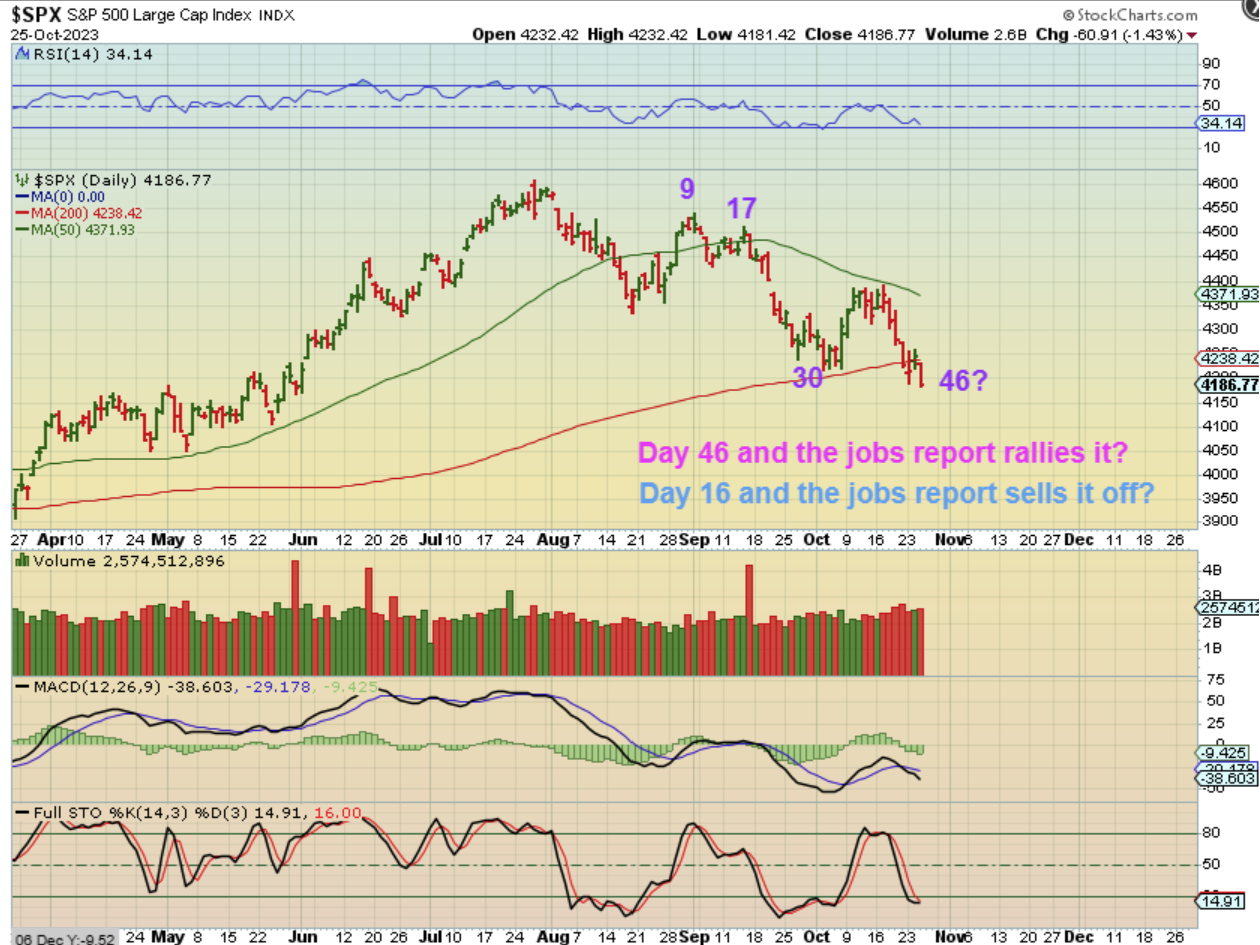
SPX – Now likely on day 46, we have the release of Jobless claims. In the past the markets have rallied with the jobless claims, since the economy and work force seemed strong, so we’ll see if that puts in a low or not. I will note that last week the markets dropped on Thursday and Friday. PLEASE READ THE CHART.
.
I WANT TO SHOW YOU YESTERDAYS OIL CYCLE COUNT:
.
YESTERDAY I SAID
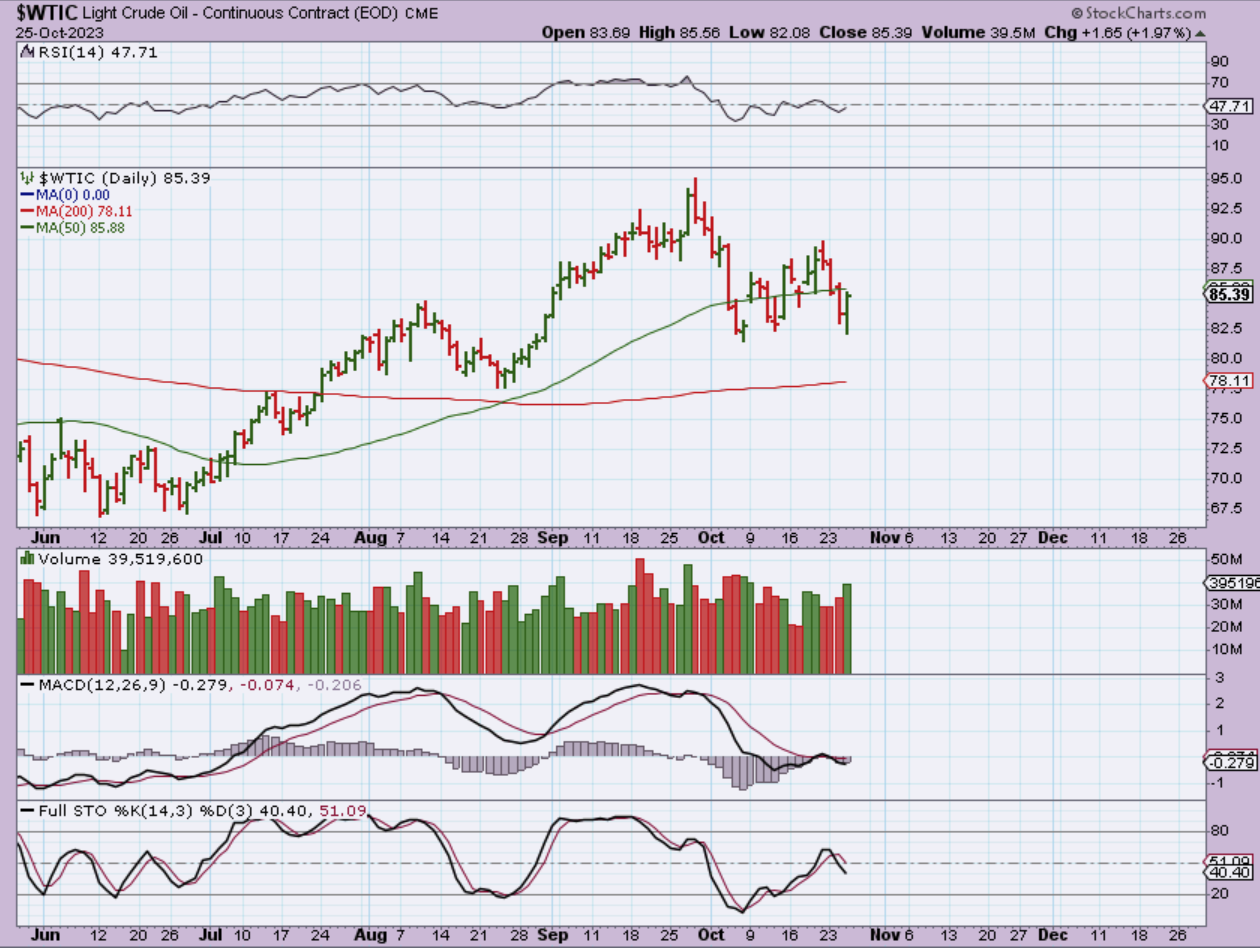
WTIC – I’ve been expecting a drop with Oil here and we did see some follow through, so now it has lost that 50sma again. I have an arrow that shows a drop to the 200sma, but it can break through it.
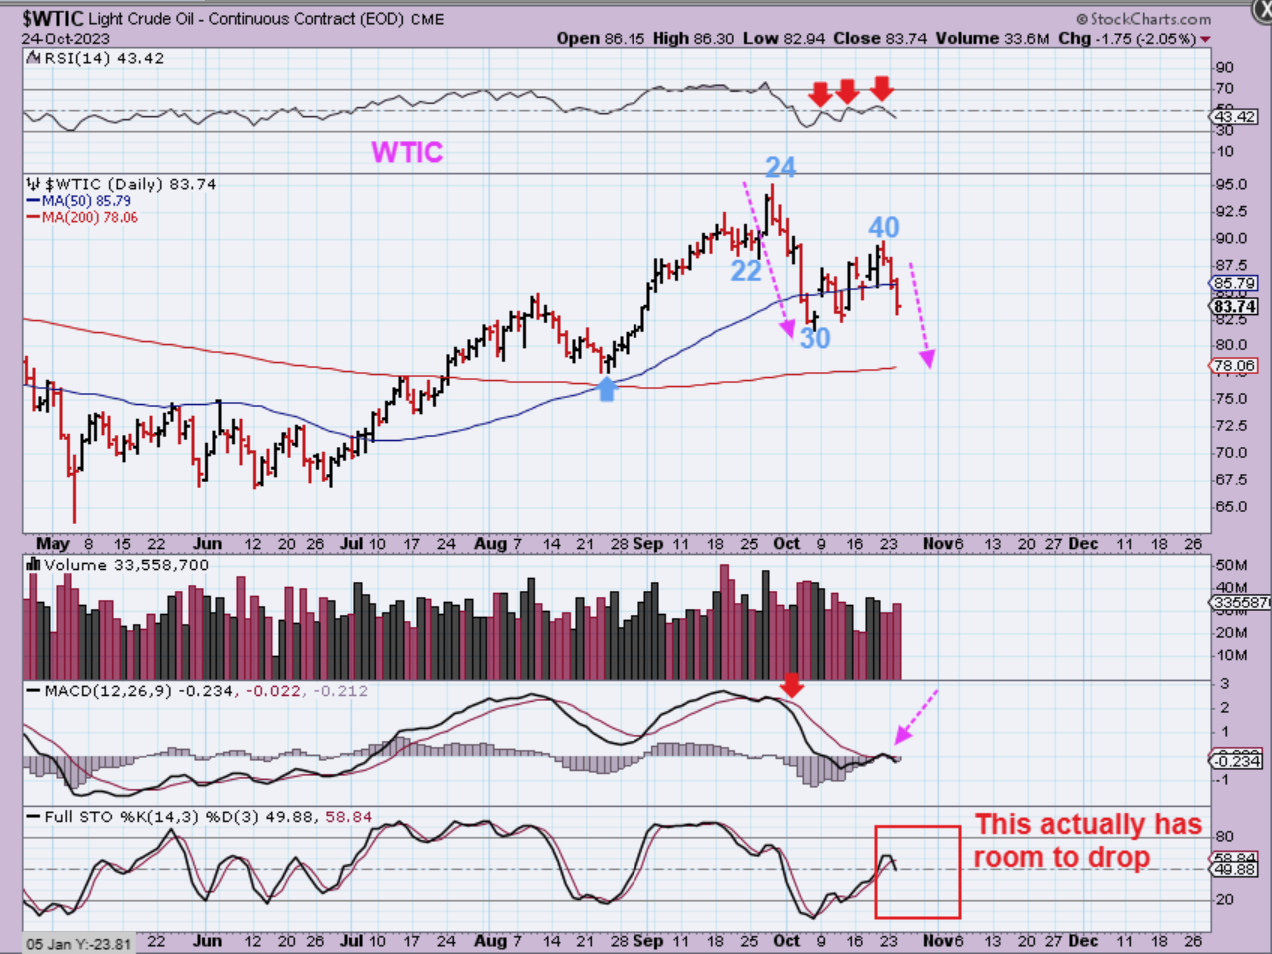
WTIC – Oil reversed yesterday on what would now be day 43. I am still expecting a drop lower. Day 43 could be deep enough for the daily cycle count for Oil, but it didn’t break the day 30 lows and it has been extremely choppy. This is tricky, because the MACD is divergent, so we could get another pop higher, but the stochastics is not oversold. For now I’m expecting more downside to the 200sma over time. Oils counts can reach 50 days with no problem.
.
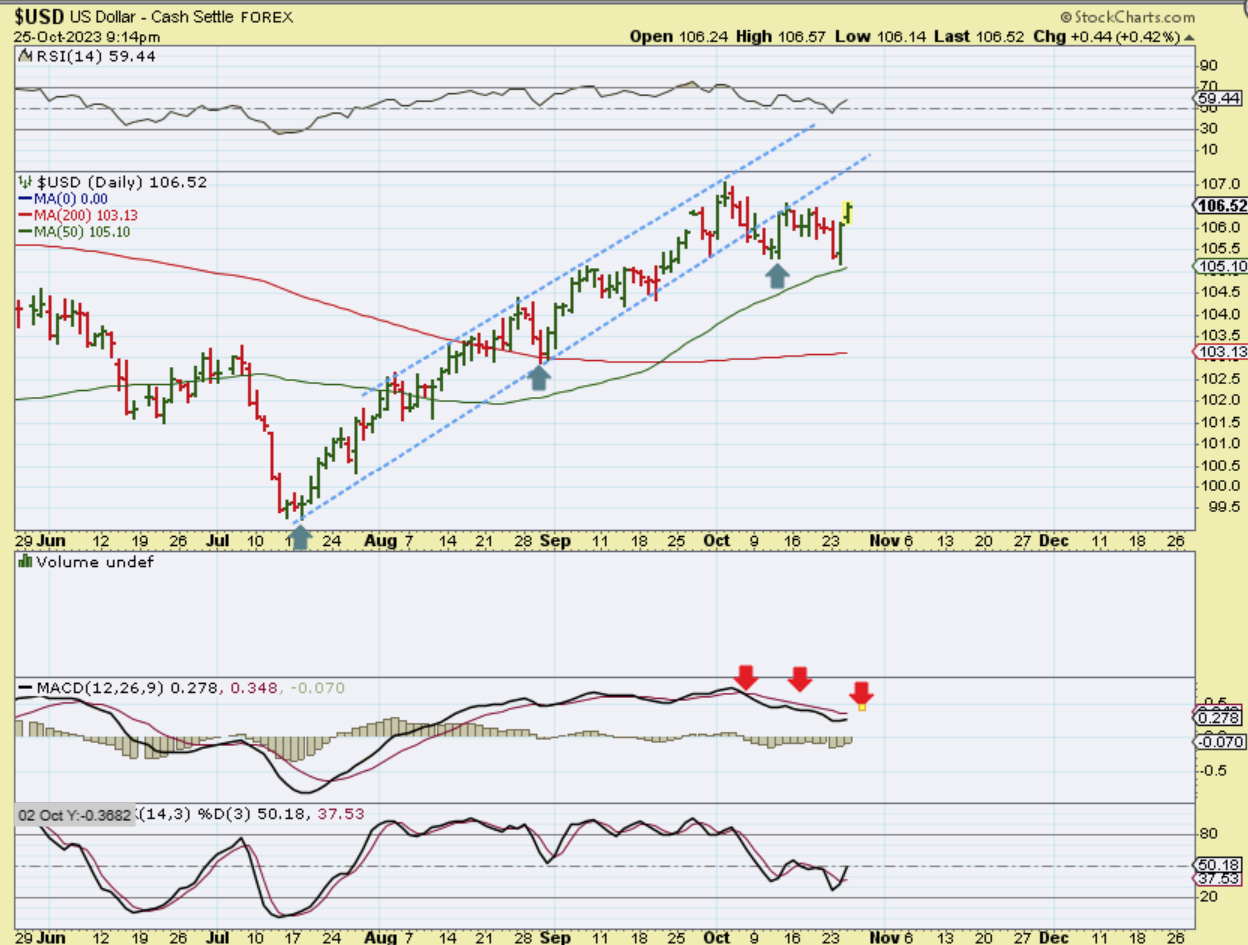
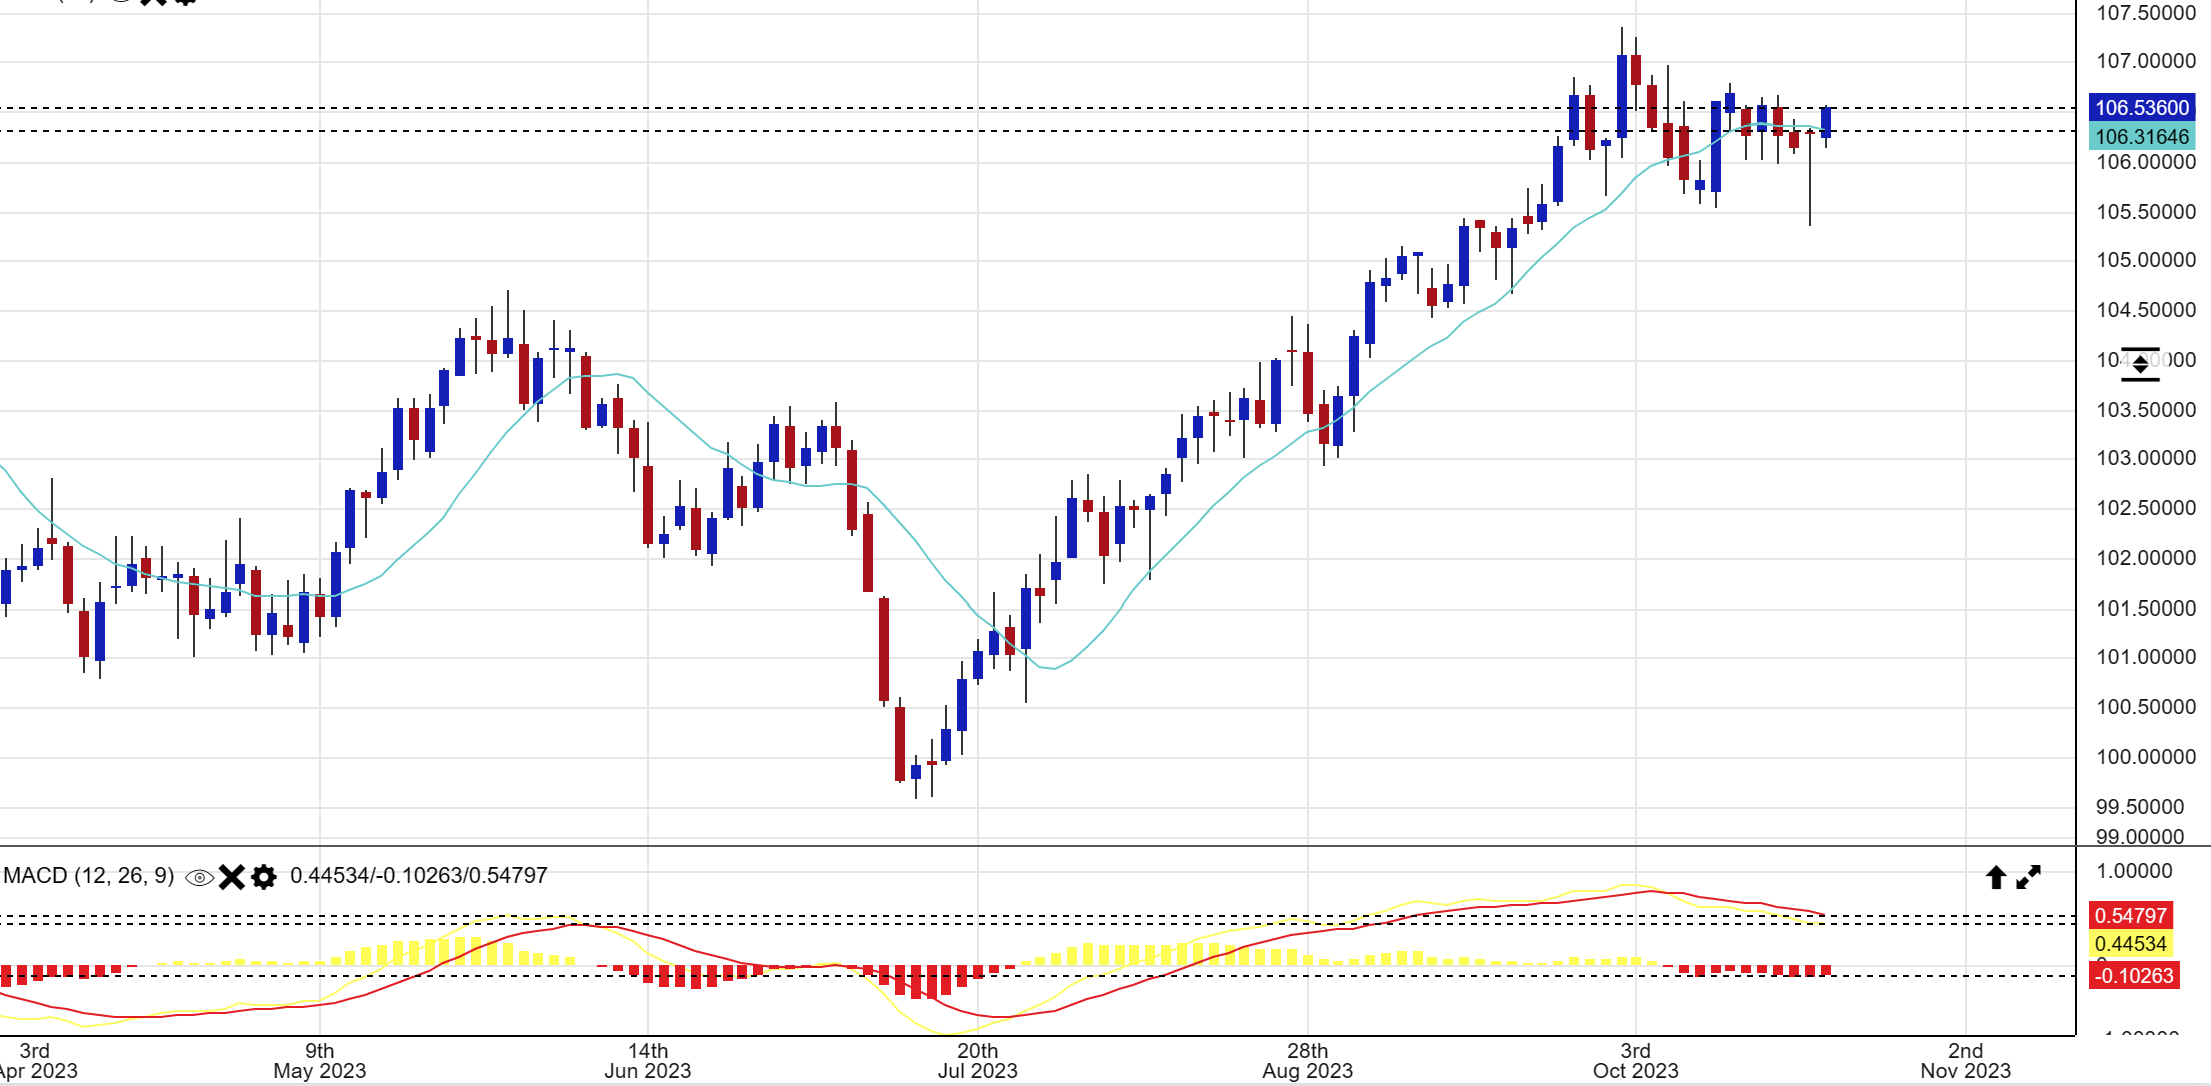
2 CHARTS for the USD, because I get 2 different looking charts from 2 different services.
.
USD chart #1 – This shows the USD reversing at the 50sma and it made a slight new high for this new daily cycle. We already saw a break of the uptrend and a back test, but it could back test it again and then roll over. I am expecting the USD to move lower into the end of this year.
.
USD chart #2 -`This view of the USD is simply showing the USD did not make a new high yet for this new daily cycle.
.
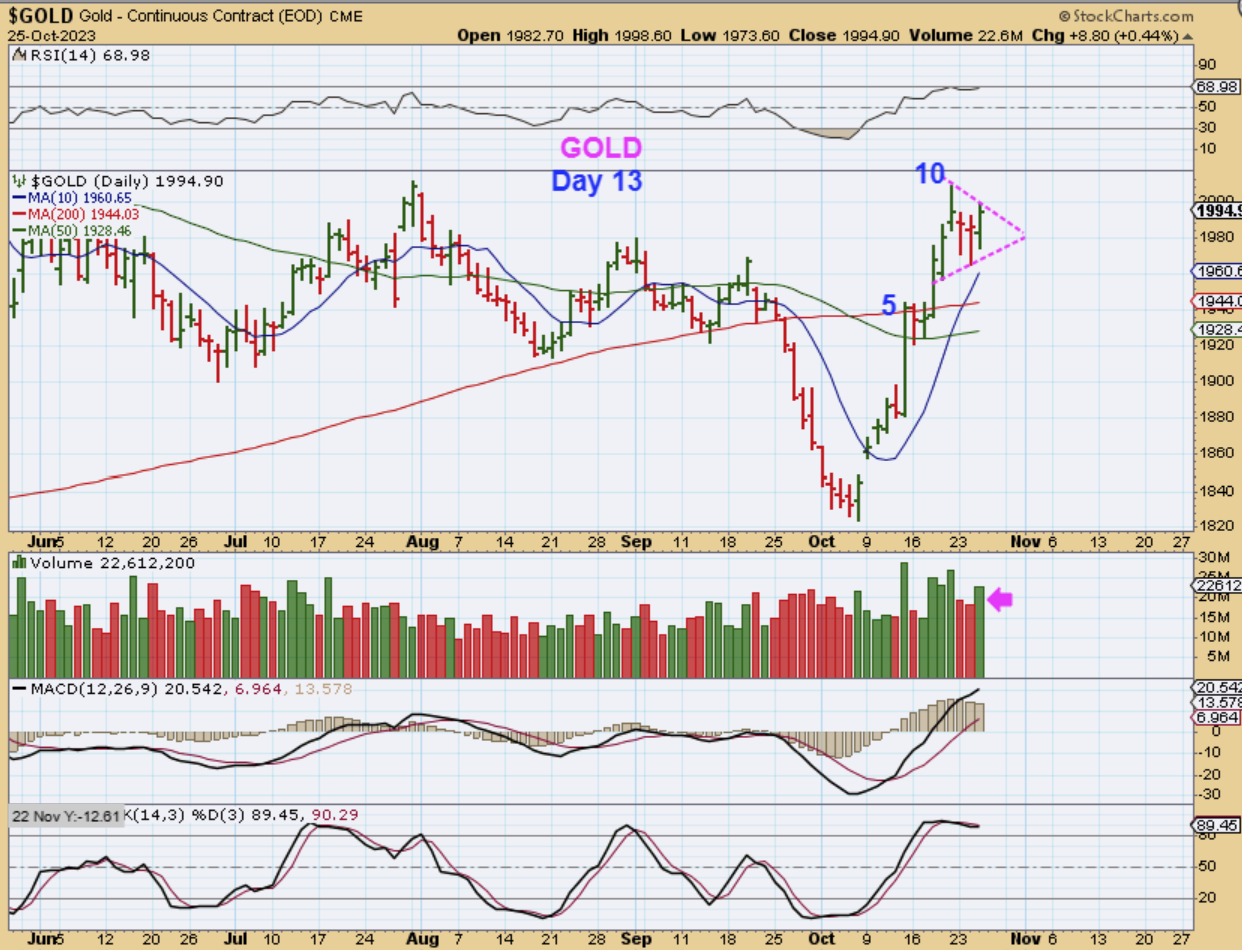
GOLD could be forming a Bullish pennant. Even if this broke down though, we basically still have a very bullish run out of the ICL and Gold is on day 13, consolidating those gains.
.
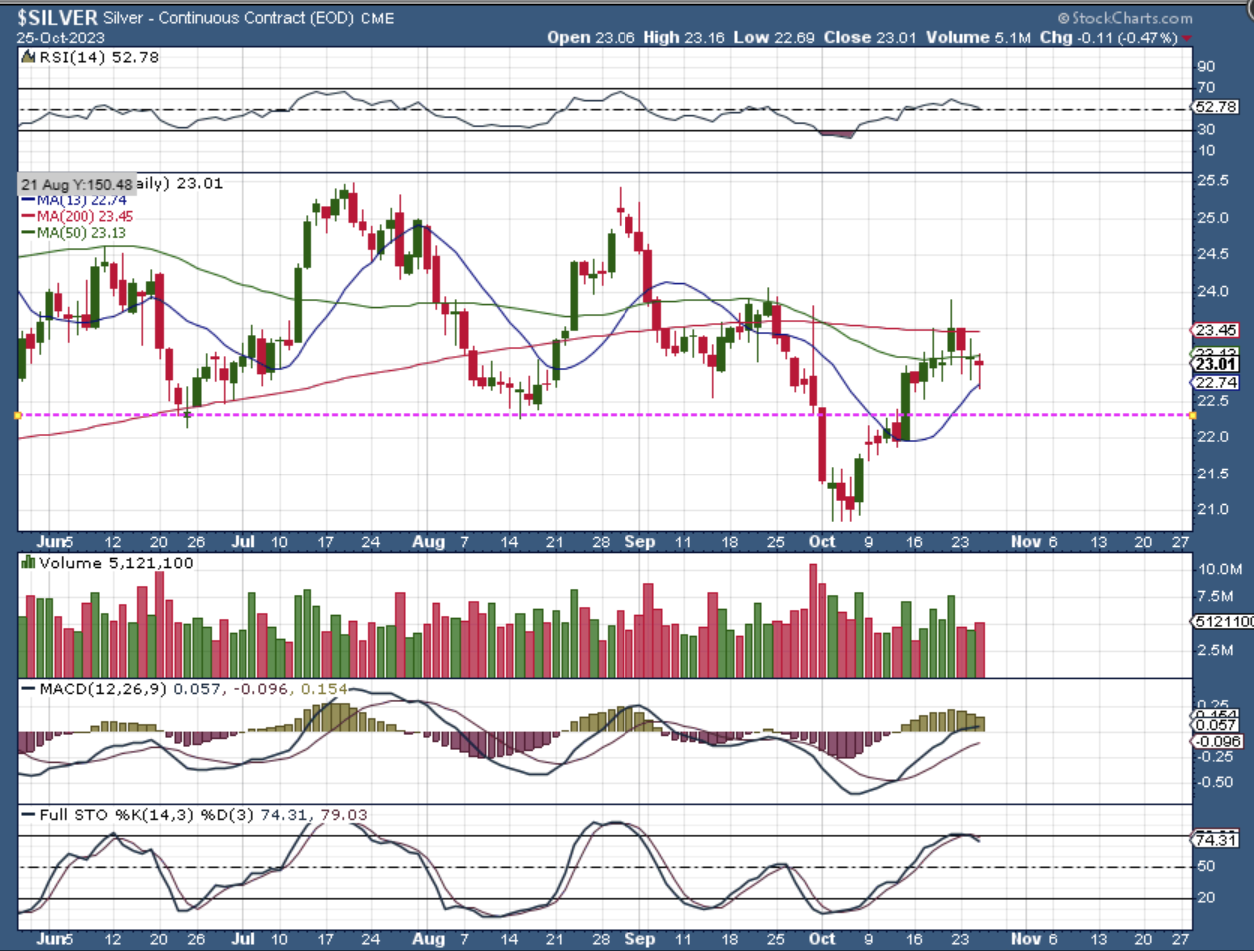
SILVER had a nice run after a ‘shakeout’, but it does lag Gold a little and it is stuck under the 200sma and is now also under the 50sma. Yesterday it bounced off of the 13 sma, so it is trying to hold up so far as a mid-point consolidation.
.
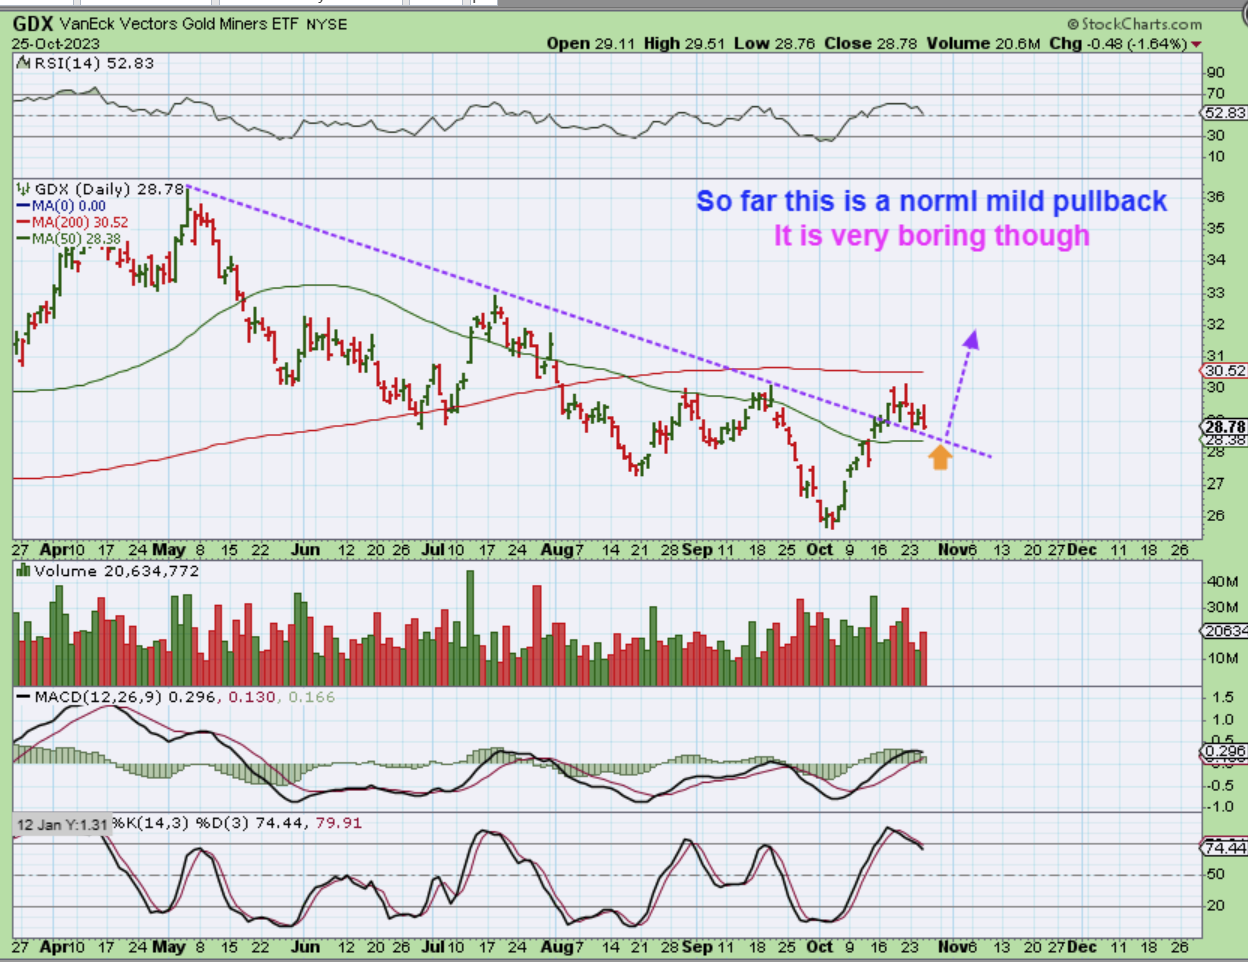
Gold was up yesterday with that possible pennant formation, so it was disappointing to see The Miners, or GDX down 1.64%, but it is still a mild normal dip. One more day of this could give us a back test of both that trend line and the 50sma. I have mentioned that we could back test the 50sma from the start of this drop, so this is not abnormal price action at all.
.
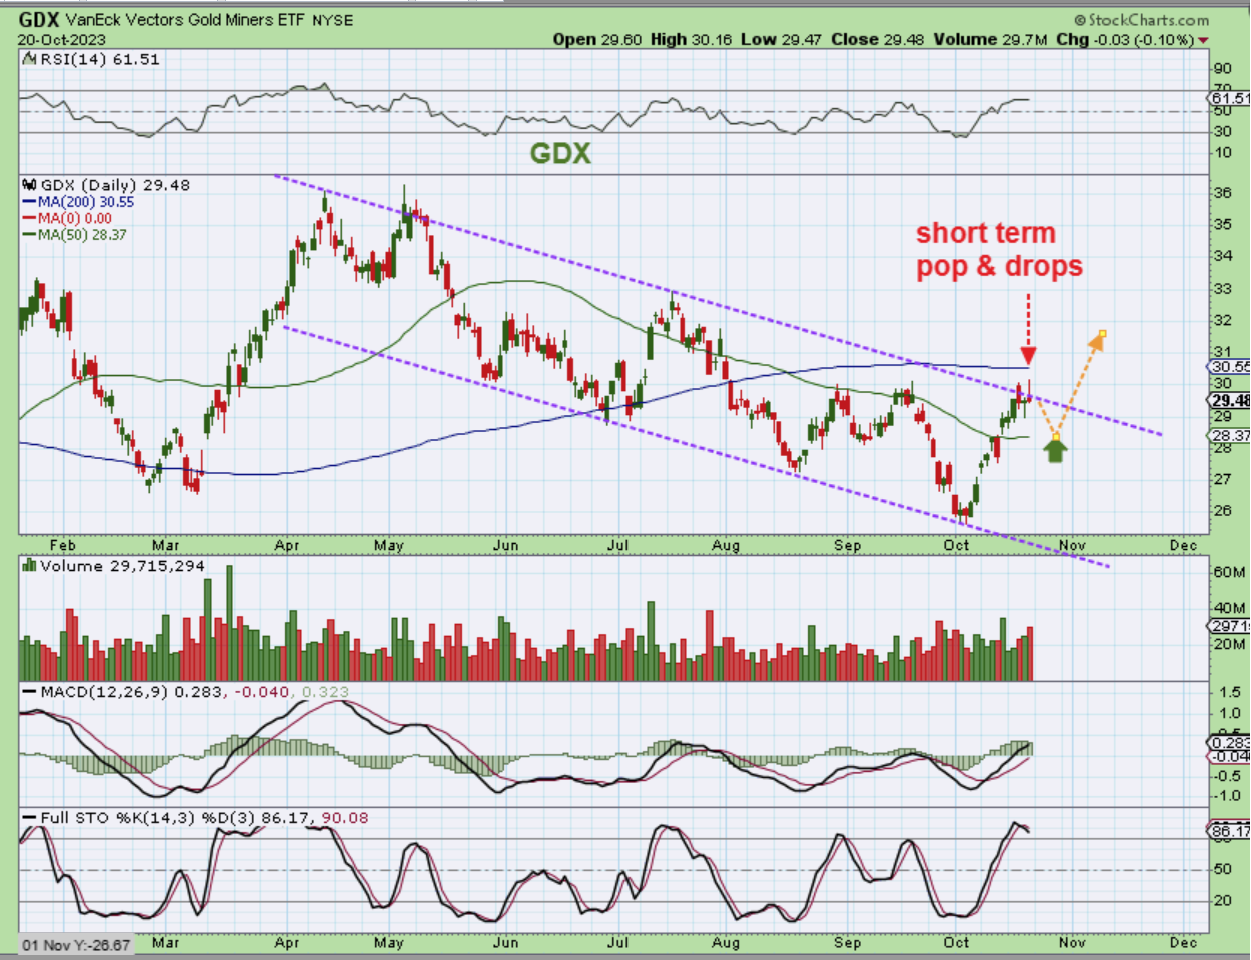
THIS IS WHAT I SAID IN THE WEEKEND REPORT:
THE GDX ETF reversed at the bottom of the channel as an ICL and then broke through the 50sma. It was heading for the 200sma, but it has popped and dropped twice as it reached that channels’ upper trend line along the way this week. I have drawn a back test of the 50sma as a 1/2 cycle low possibility, and then I’d expect a breakout above the 200sma.
.
So things really are playing out as I have expected, but isn’t it true that when you spend 3 -5 days chopping and pulling back, it seems like forever! 🙂 In the weekend report I even said that we should expect this week to be a boring week pulling back. I’ll go out on a limb and say that next week we’ll probably be enjoying the second leg of this Precious Metals rally higher. Consolidations can drag on though, so that is not a 100% guarantee, but that first leg up was so strong that I do expect the next leg to get underway sooner than later. Let’s see what today brings, especially following that Initial Jobless Claims report at 8:30 a.m. ET. I have just a little more below, Enjoy your Thursday trading!
.
~ALEX
.
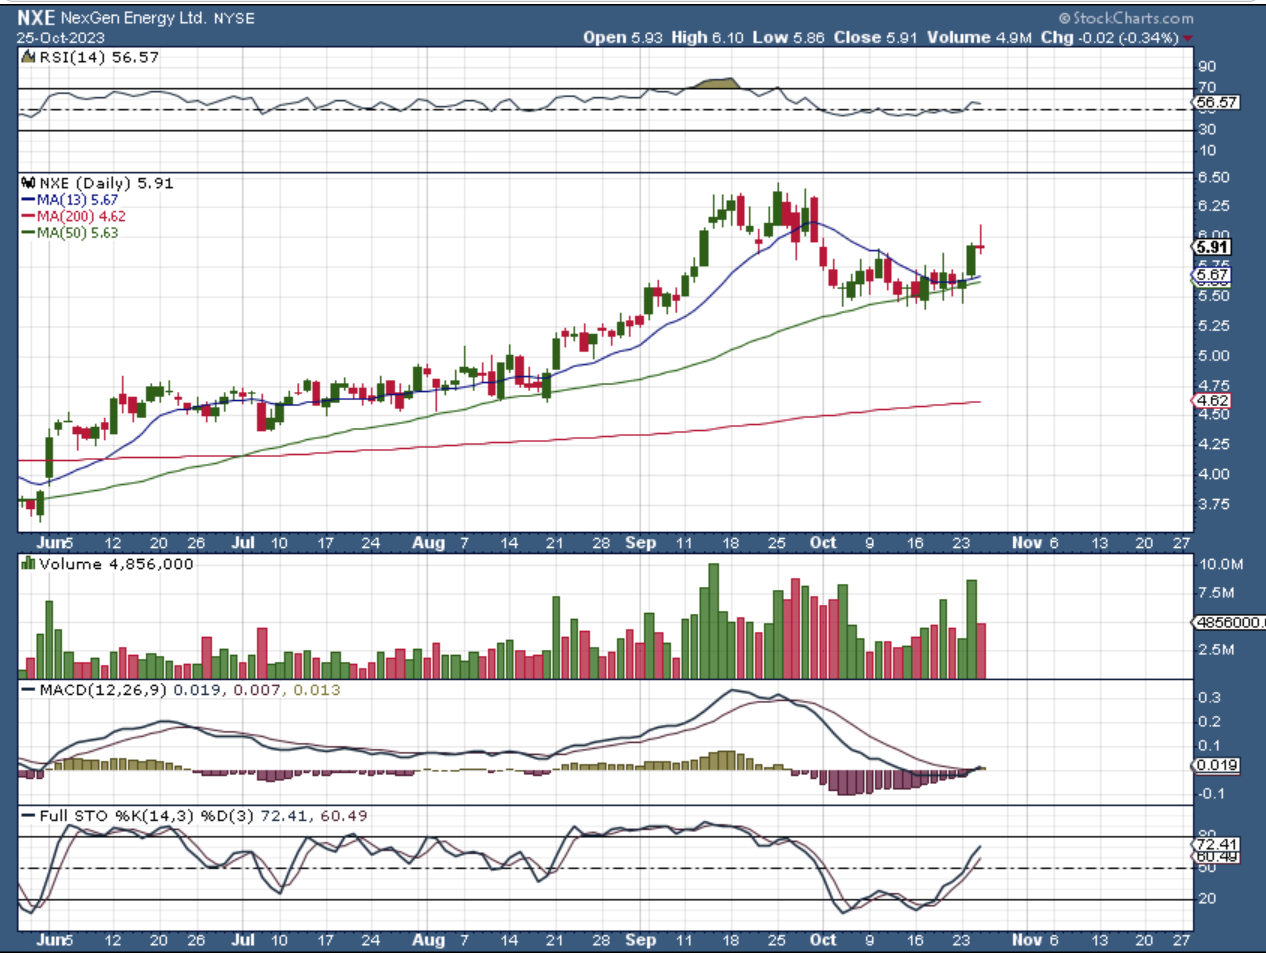
I saw all of the Uranium Stocks start to push higher out of that consolidation, so in the live comments I mentioned that.
.
I decided to add one to my portfolio and I bought a starter of NXE at $6 as it popped and dipped here. It actually dipped even lower, so let’s see how it closed…
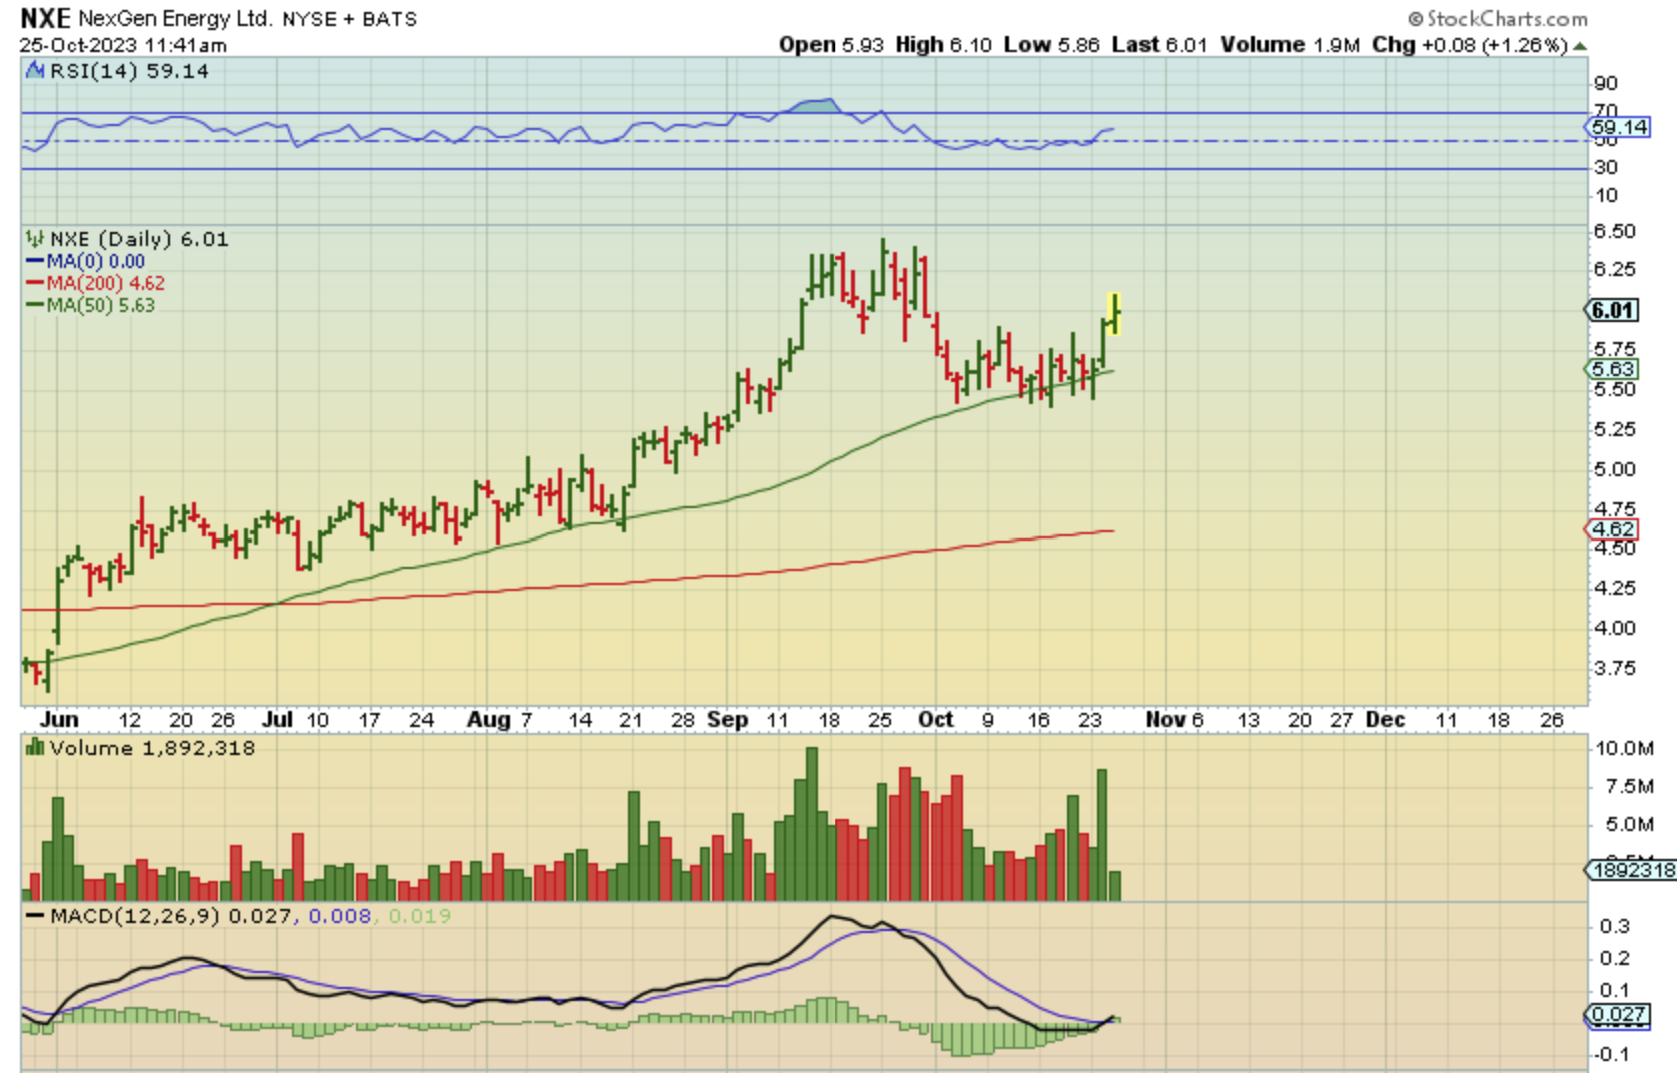
.
NXE – So we see a short-term reversal candle and it may drop back to the 50sma. I could use that area as a place to go full position on this company. Again, these are choppy, but I’m just going to hope that they ride the 50sma and I can get a lower dollar cost average.
.
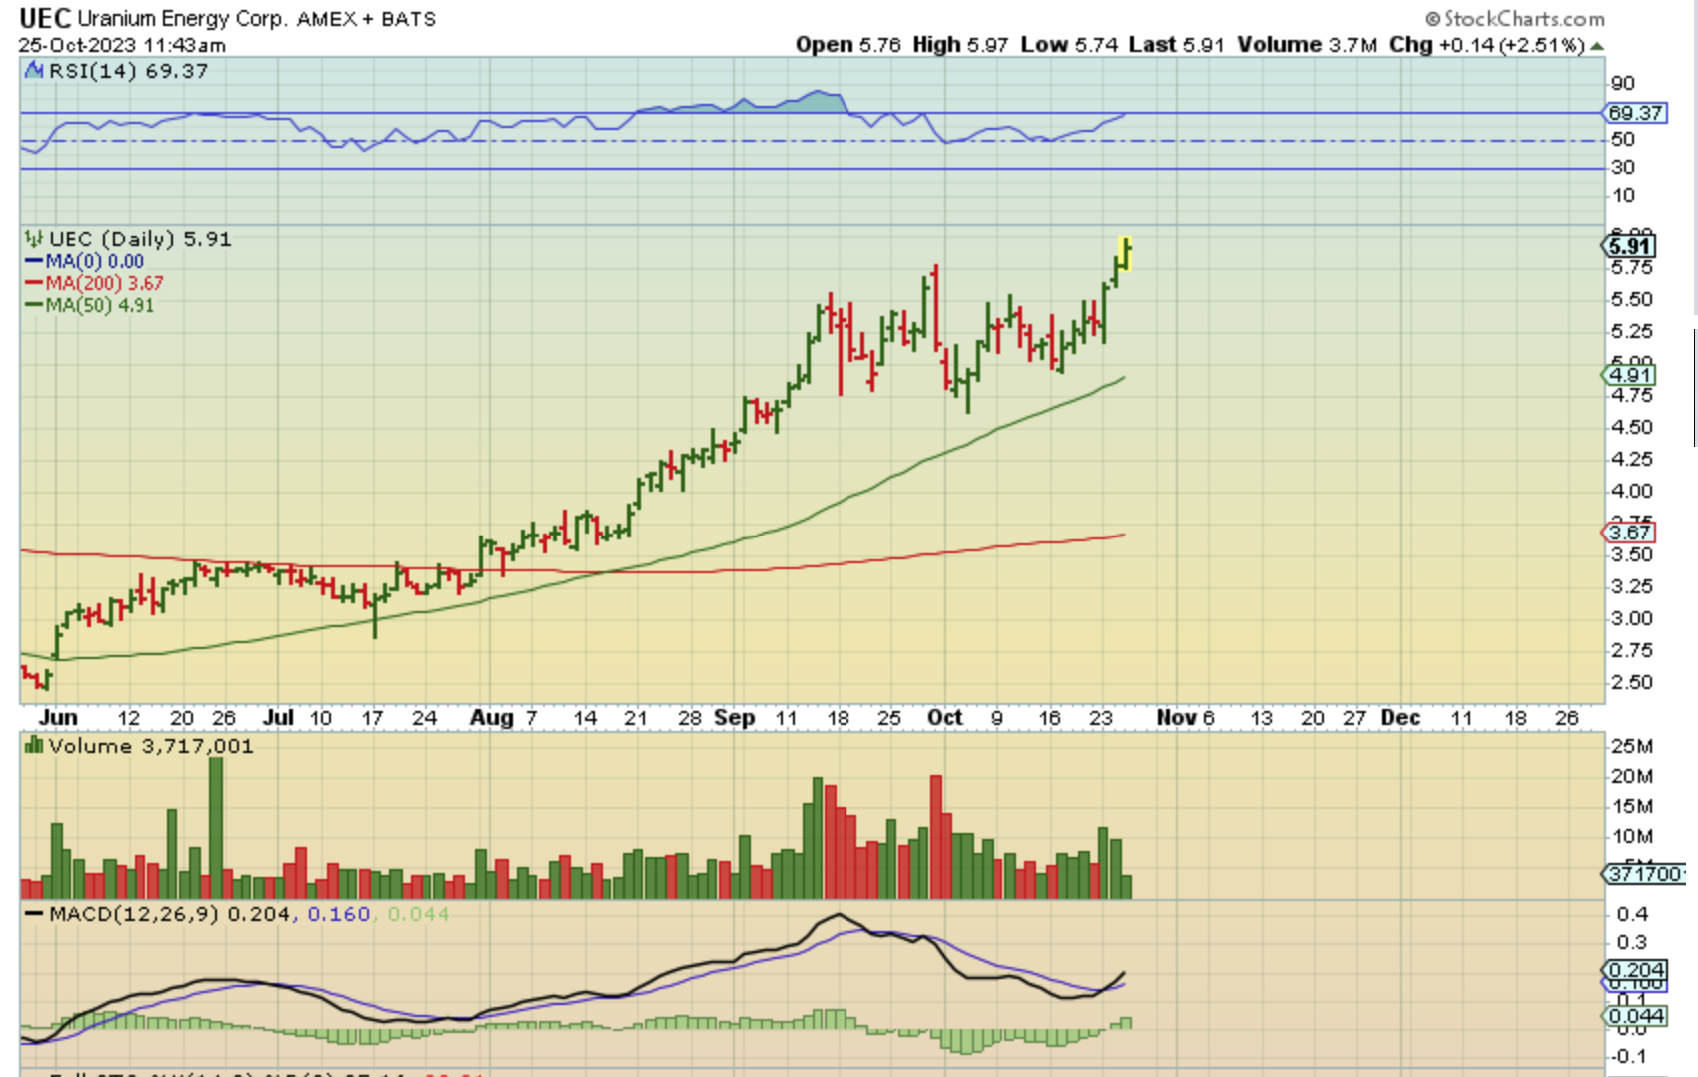
As a leader, UEC was already breaking to new highs, so that is a good sign. The sector looks good longer term.
BELOW IS FROM YESTERDAYS REPORT AS A REVIEW ON THE CHOPPINESS IN THIS SECTOR:
.
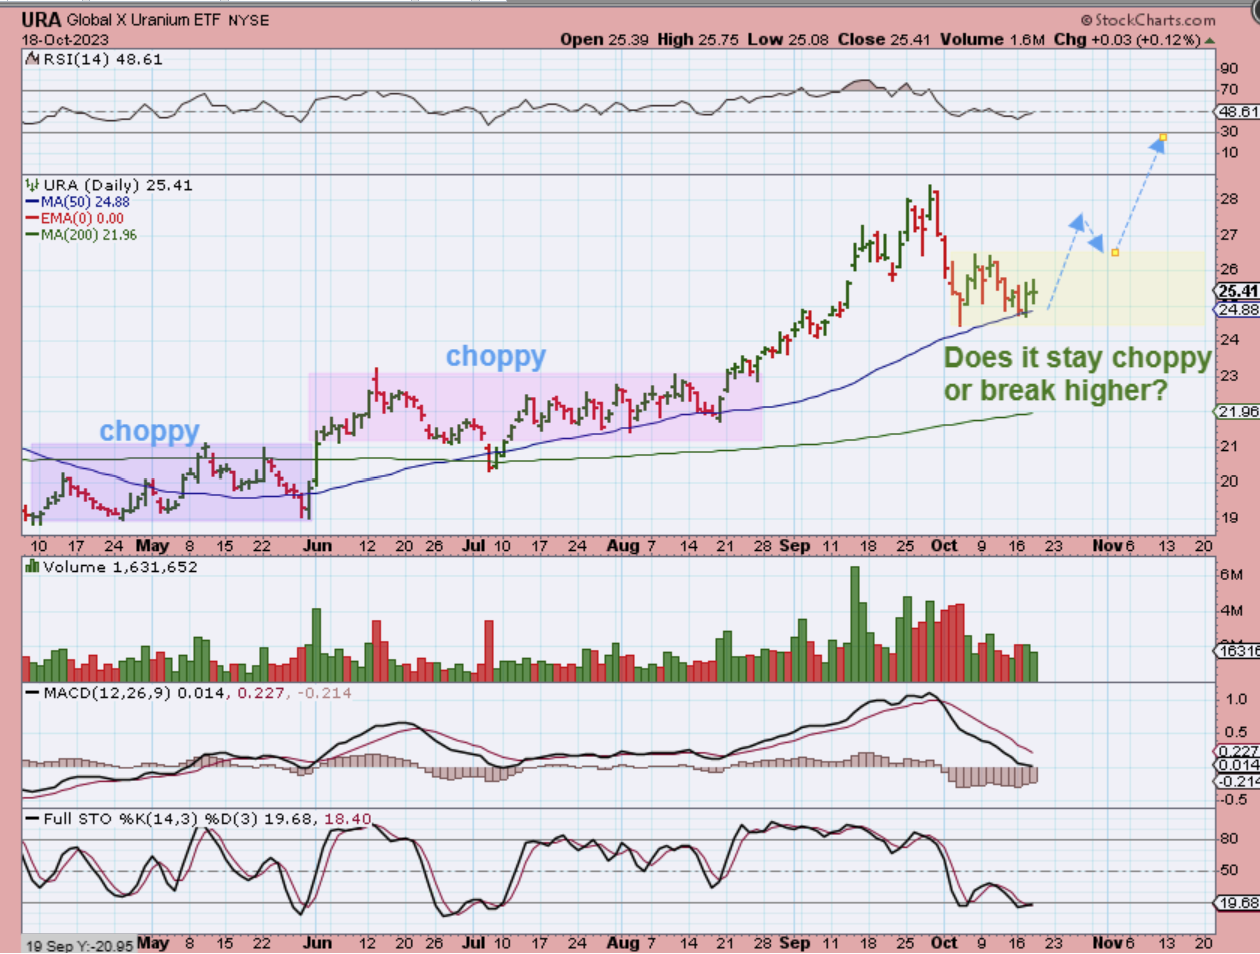
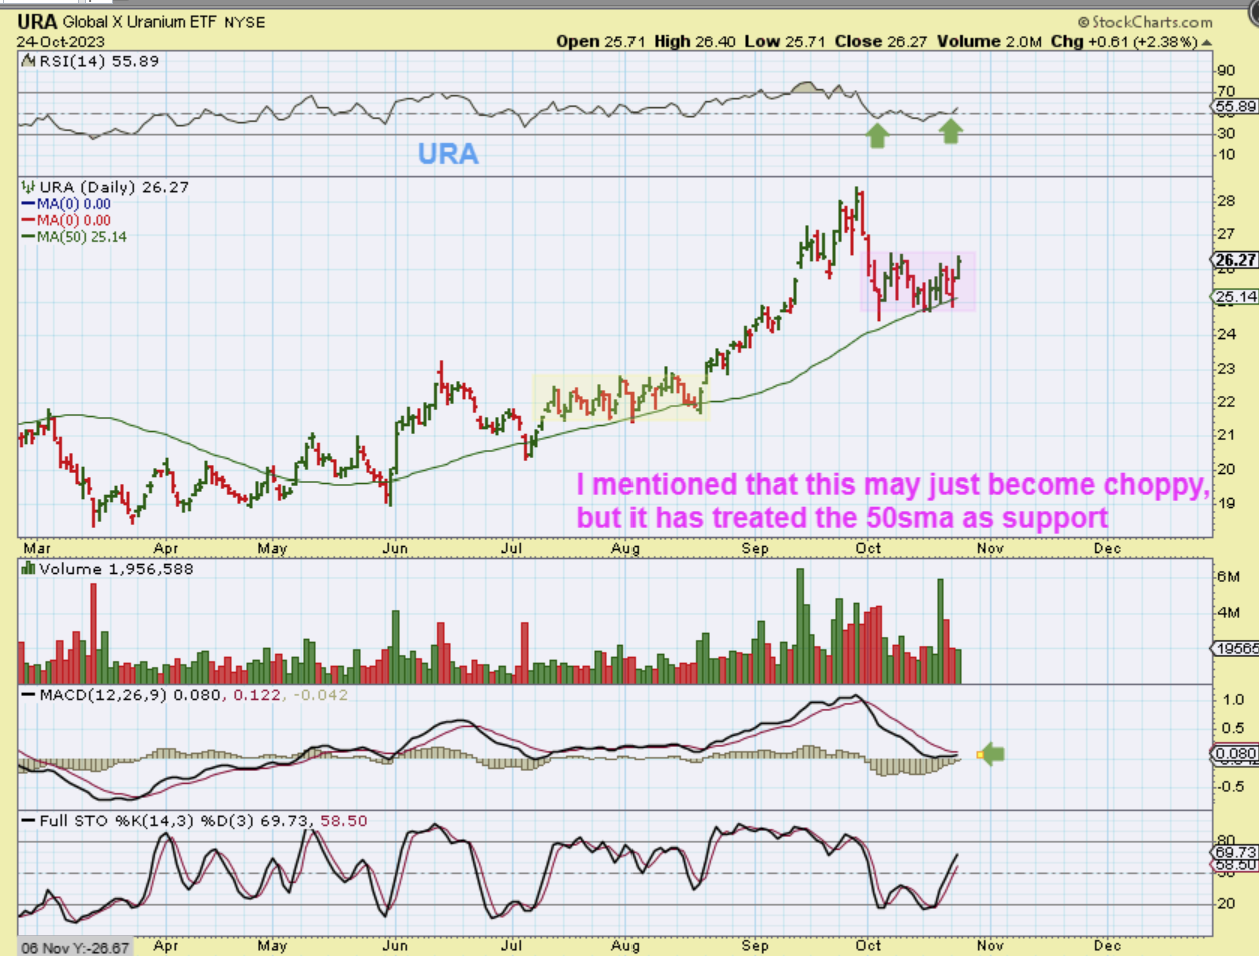
I pointed out Uranium stocks in the summer and also a couple of weeks ago as Bullish, so a couple of weeks ago I mentioned that many were reaching a support level. I then added that they are a buy but also that they are notorious for chopping sideways and not just running higher.
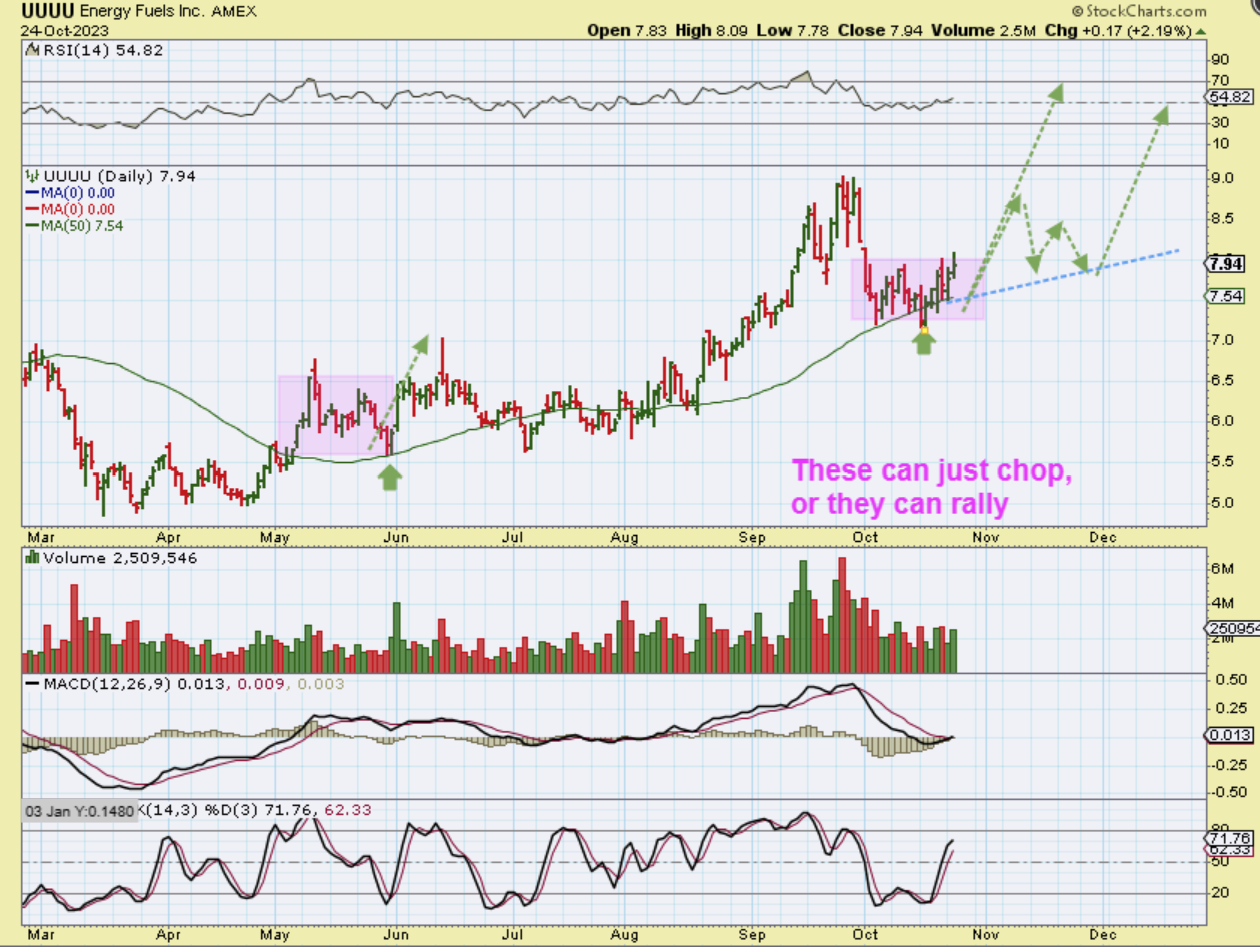
This was URA on OCT 18 at the 50 sma support. You can see that I was discussing that choppiness as possibly repeating. SO DID THESE JUST RALLY HIGHER, OR WAS IT CHOPPY LIKE I MENTIONED?
.
Well, those uranium stocks churned sideways, but they do look set up to run higher again, so these are a buy at the 50sma, but yes- they may just remain choppy and that can be frustrating.
.
So with a stock like UUUU, we may see a sudden rally higher or a bounce along the 50sma, both are shown here.