T.G.I.Friday October 27th
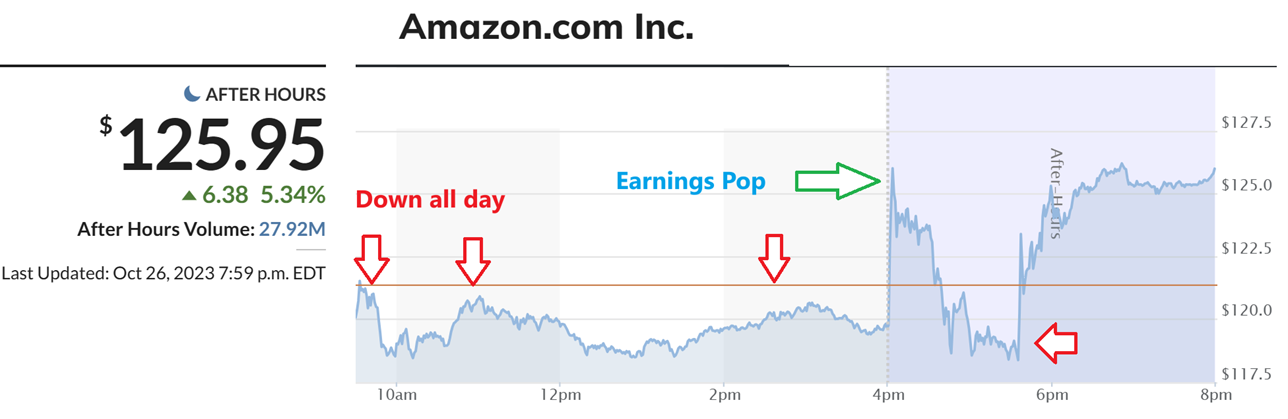
The JOBLESS CLAIMS REPORT did not save the markets from their sell off, but last night AMZN and a couple of other companies released earnings and they Popped. Here you see that AMZN closed under $120, and then it popped 7% after hrs with earnings. For some reason it then sold off to under $120 again, but I think an earnings call may have caused it to rally back to the after hrs highs. So MAYBE this will start the Markets higher? We’ll see.
.
AS A REMINDER:
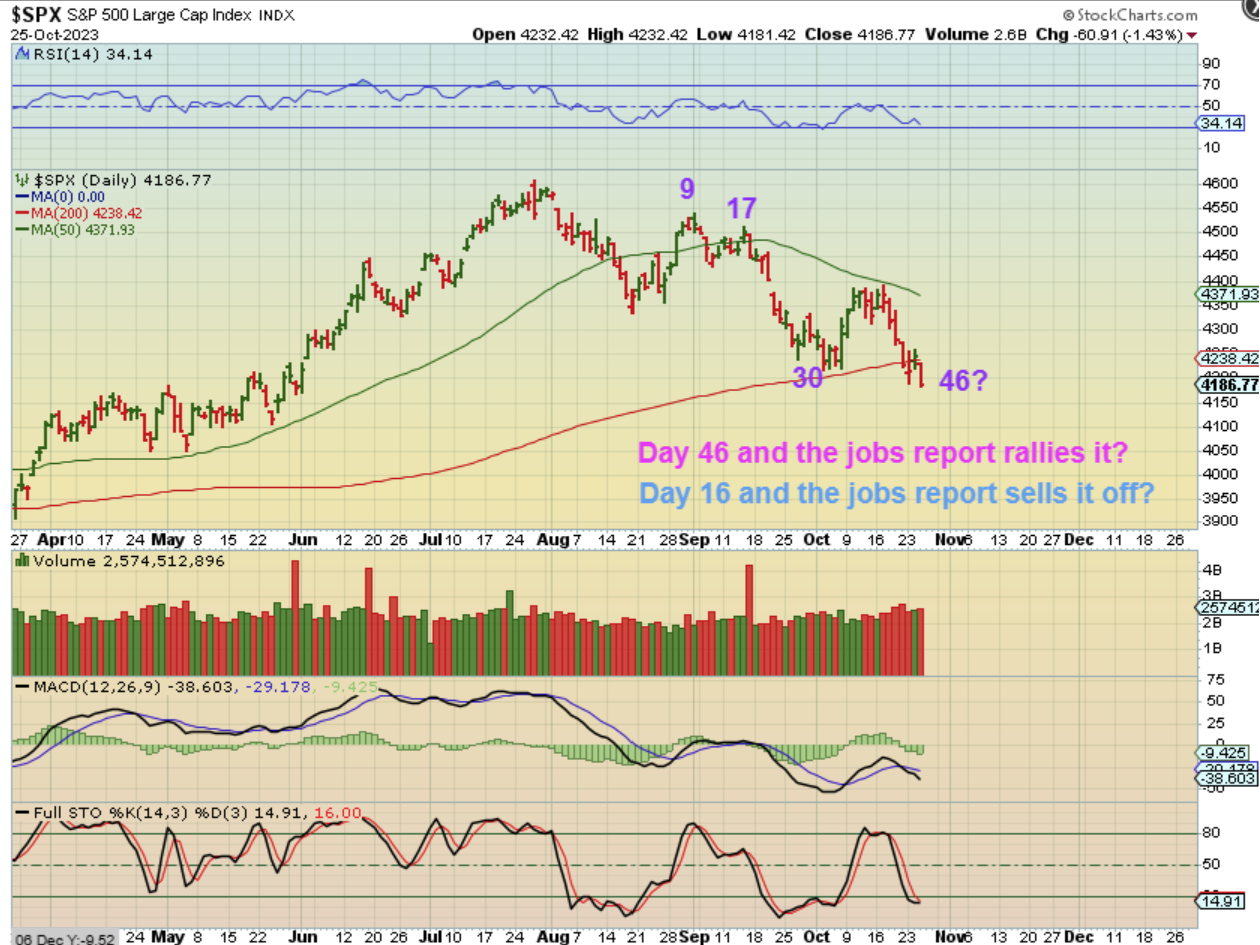
The SPX was on day 46 Wednesday (and they can run to 50 days), but unless this was a new daily cycle with a day 30 low in early October, we should get a reversal higher. On Thursday we did not get that reversal after the jobless claims report…
.
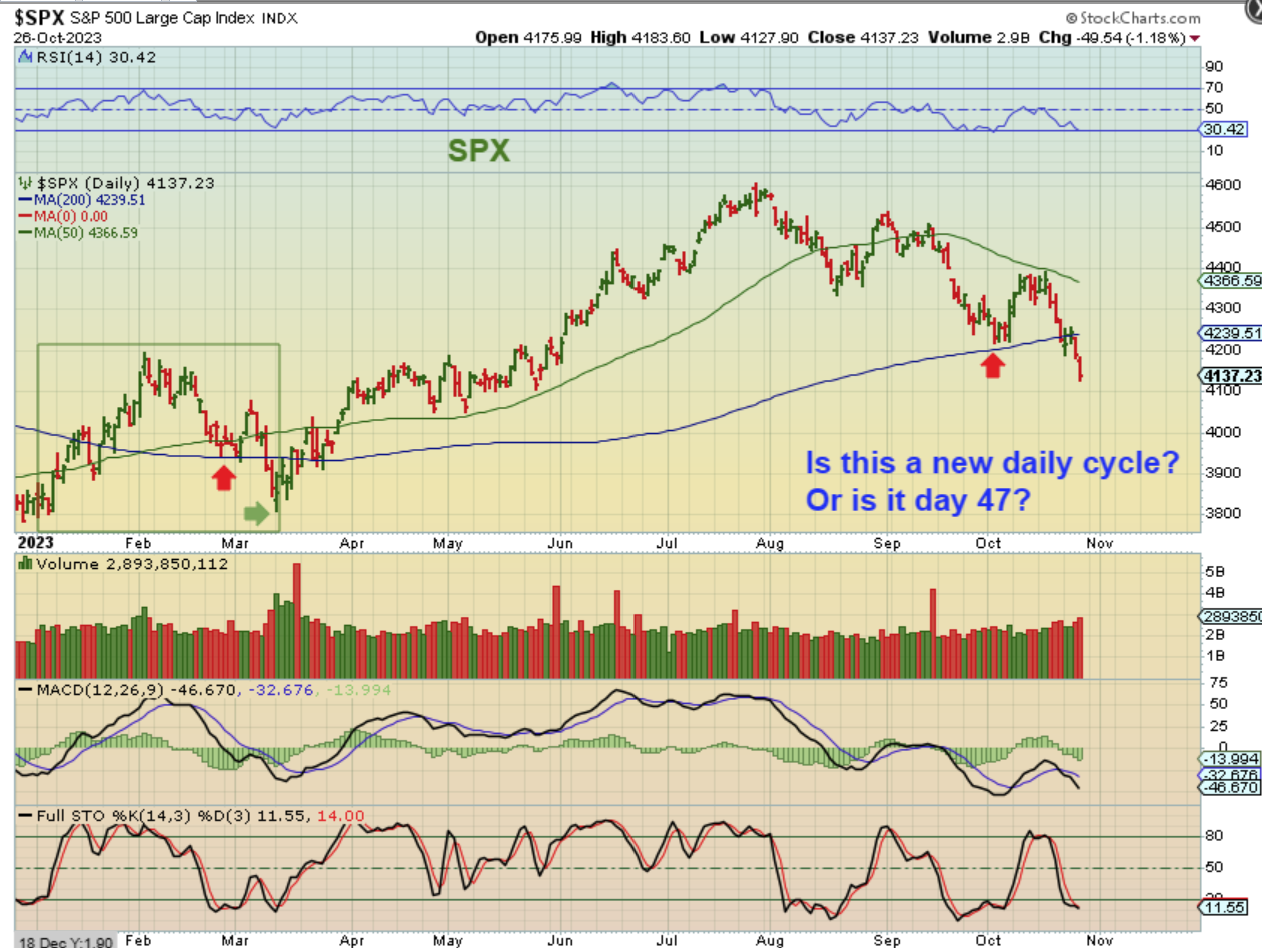
So basically we are on day 47 for The SPX and very due for a swing low (or day 17 of a final daily cycle and a long way to go). This still looks quite similar to the March sell off into an ICL.
.
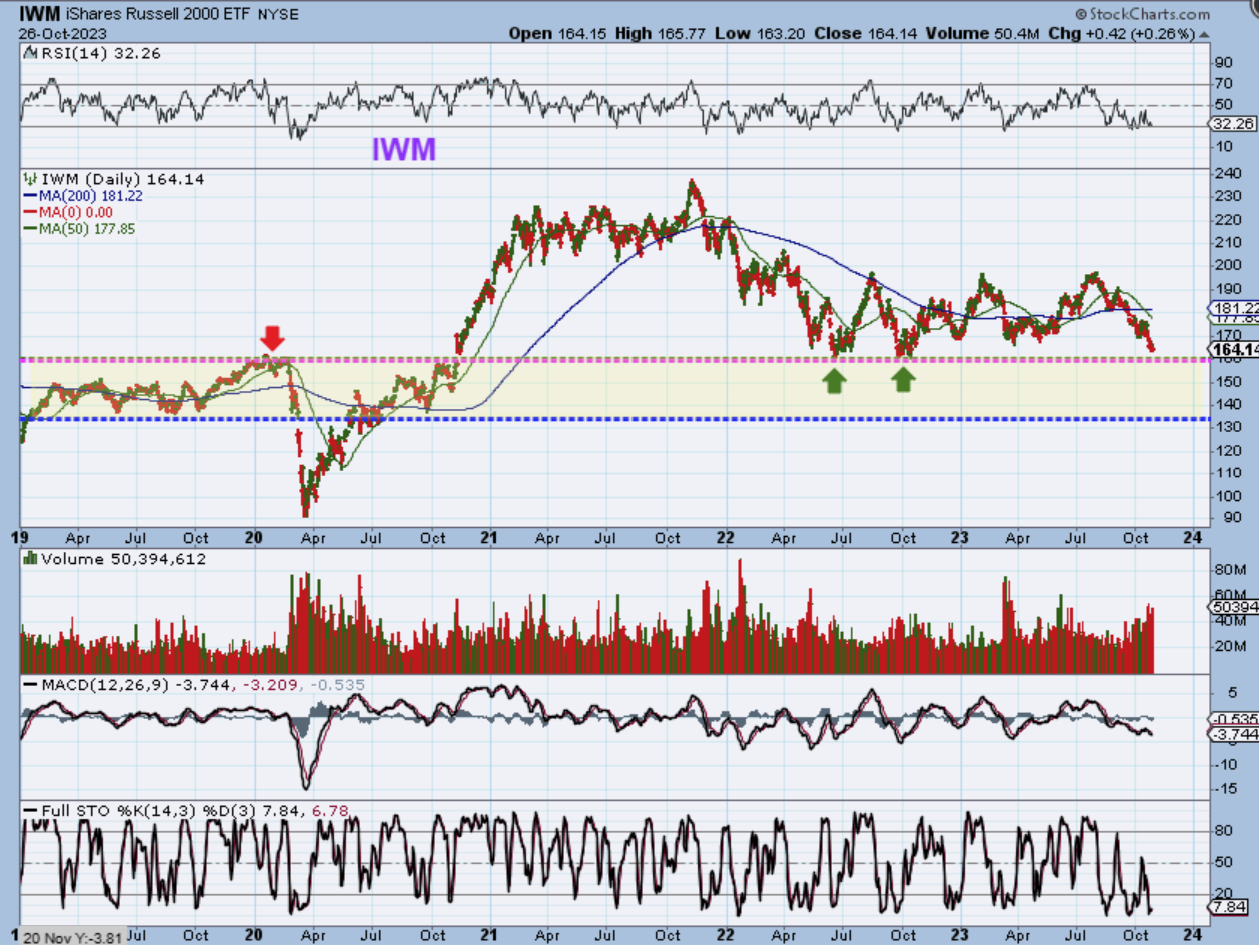
I took a look at The IWM and it sold off steadily too, but notice that it seems to be very close to a solid support area. This would seem to indicate that we are at the end of a final daily cycle and close to forming an ICL.
.
TUESDAY I SAID:
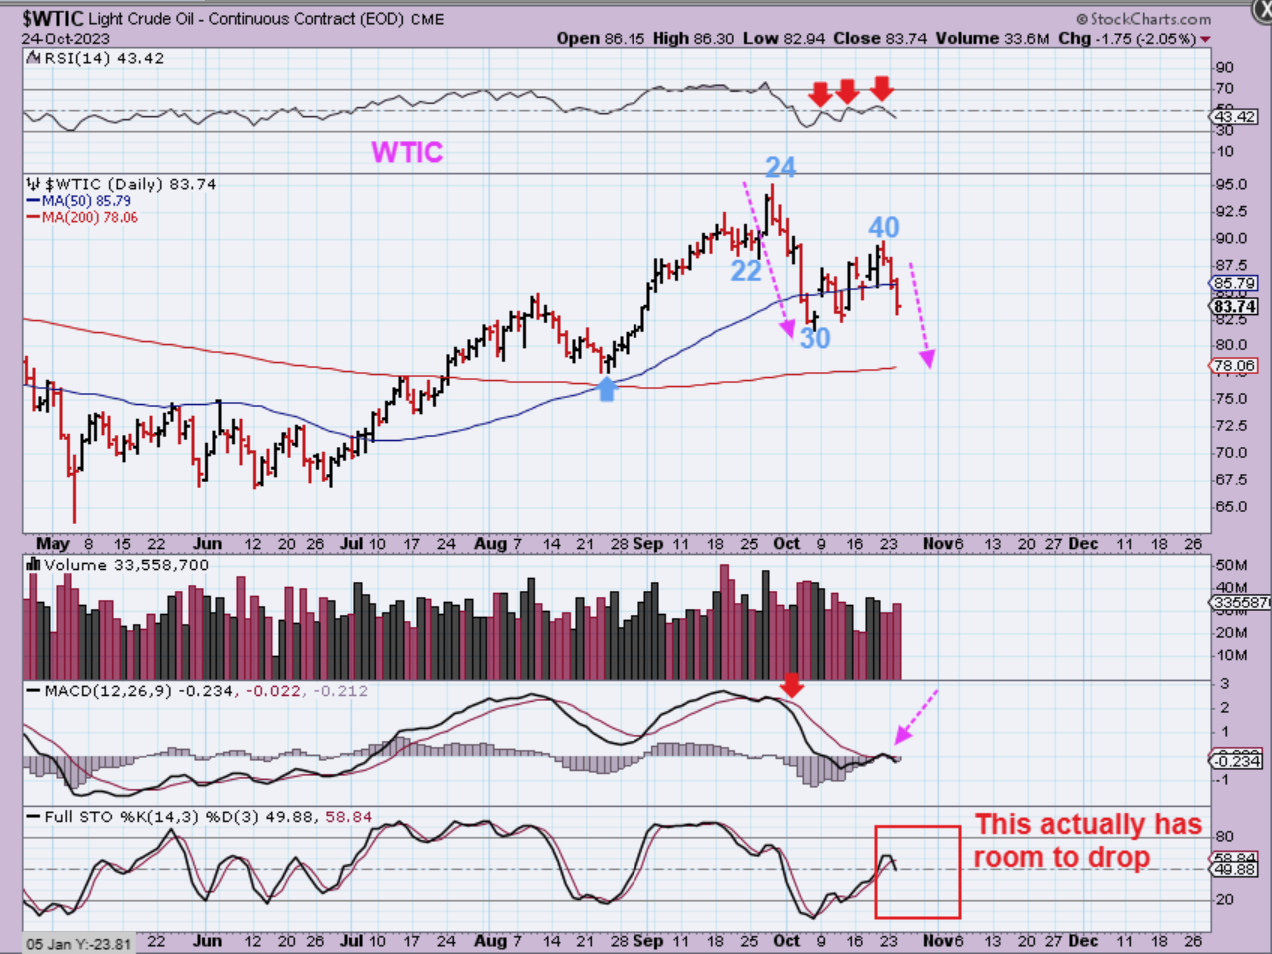
WTIC – I’ve been expecting a drop with Oil here and we did see some follow through, so now it has lost that 50sma again. I have an arrow that shows a drop to the 200sma, but it can break through it.
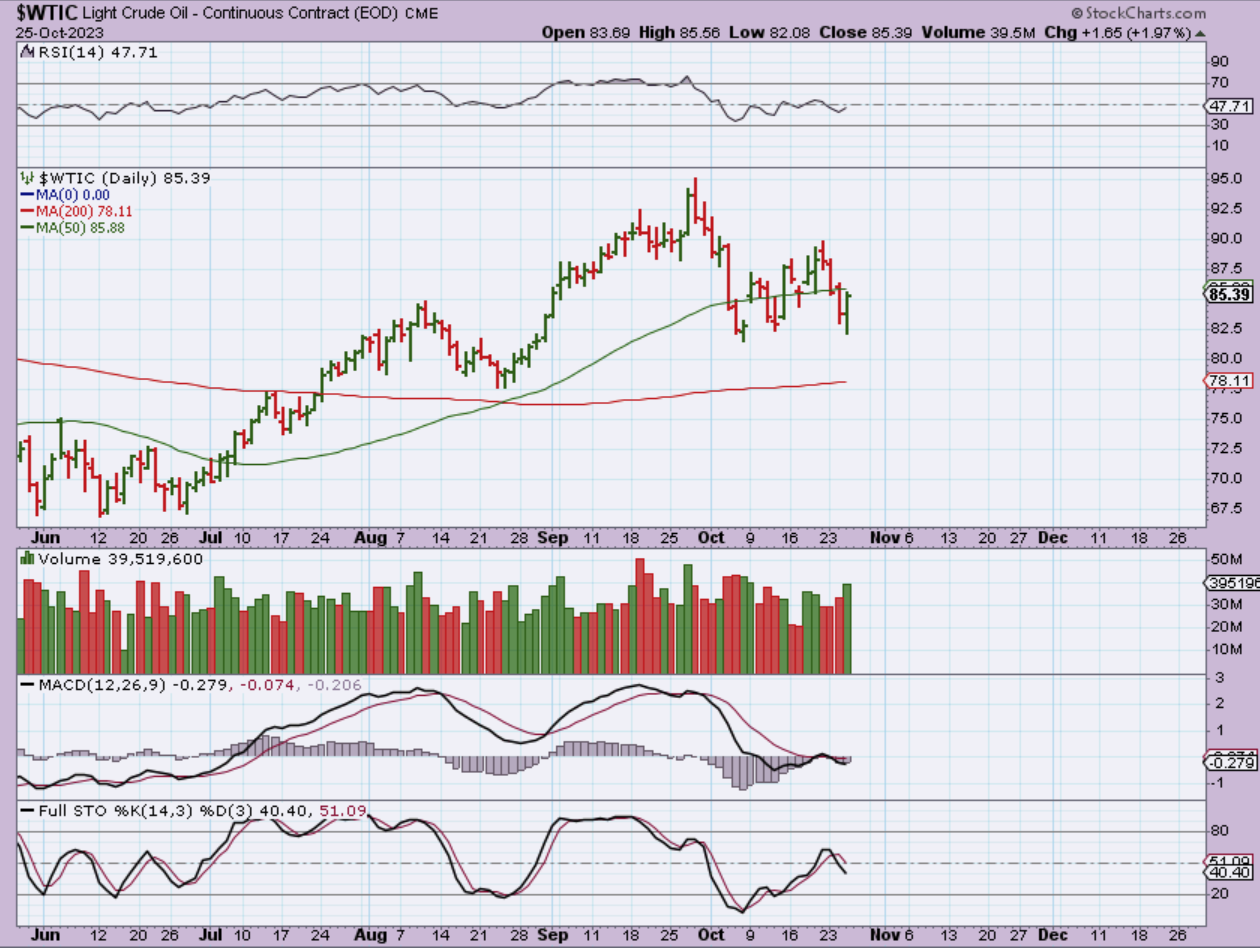
WTIC – Oil then had a strong reversal on Wednesday, but I was still calling for a drop to the 200sma area, because Oils counts can reach 50 days with no problem and the stochastics is not oversold.
,
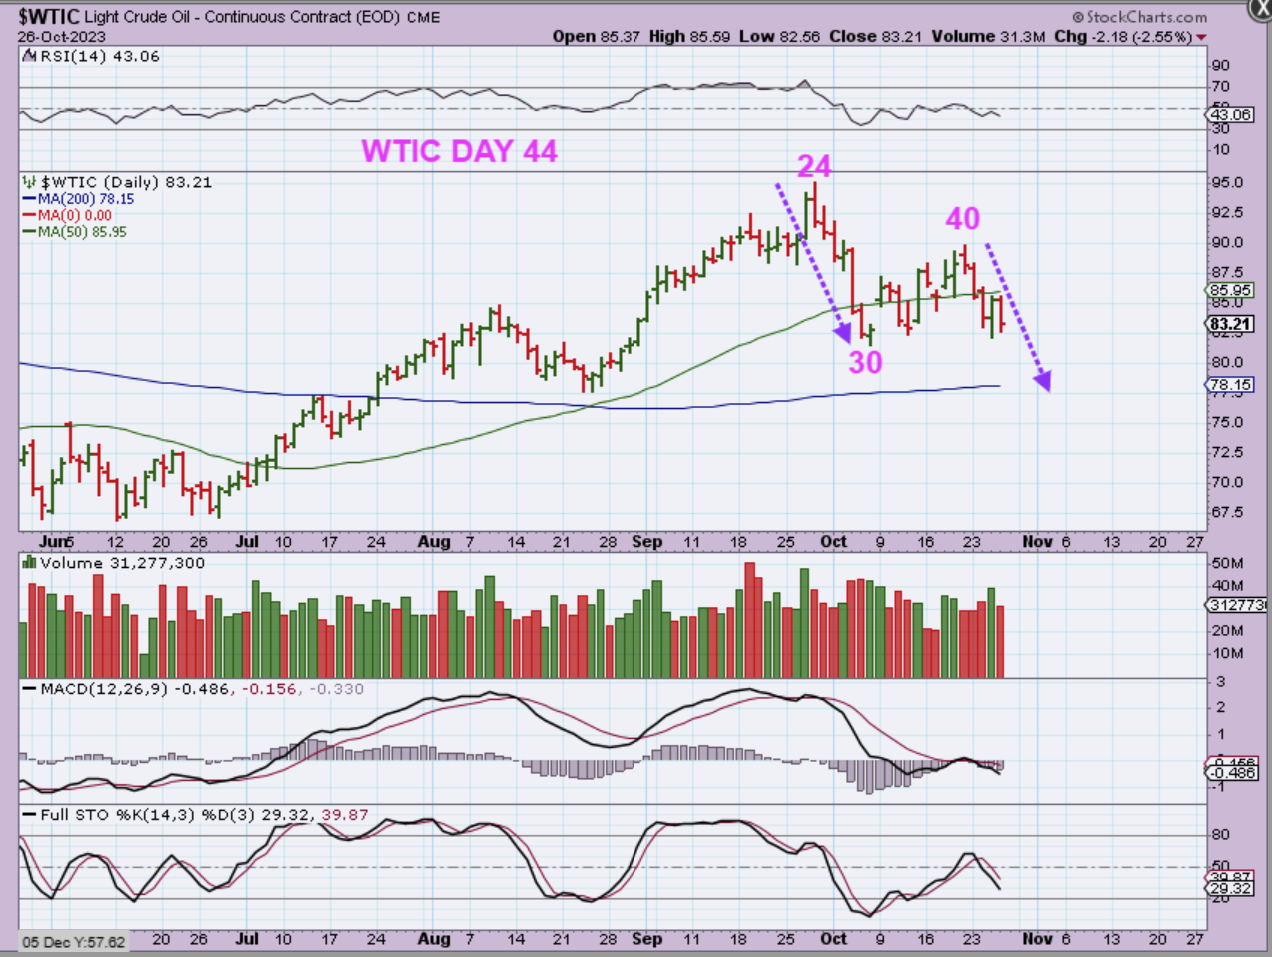
WTIC – Oil did drop on Thursday and is now being held under the 50 sma. I still expect Oil to drop a little lower. We are on day 44. Without using Cycle counts, I think that people would be buying each reversal and getting stopped out & chopped up.
.
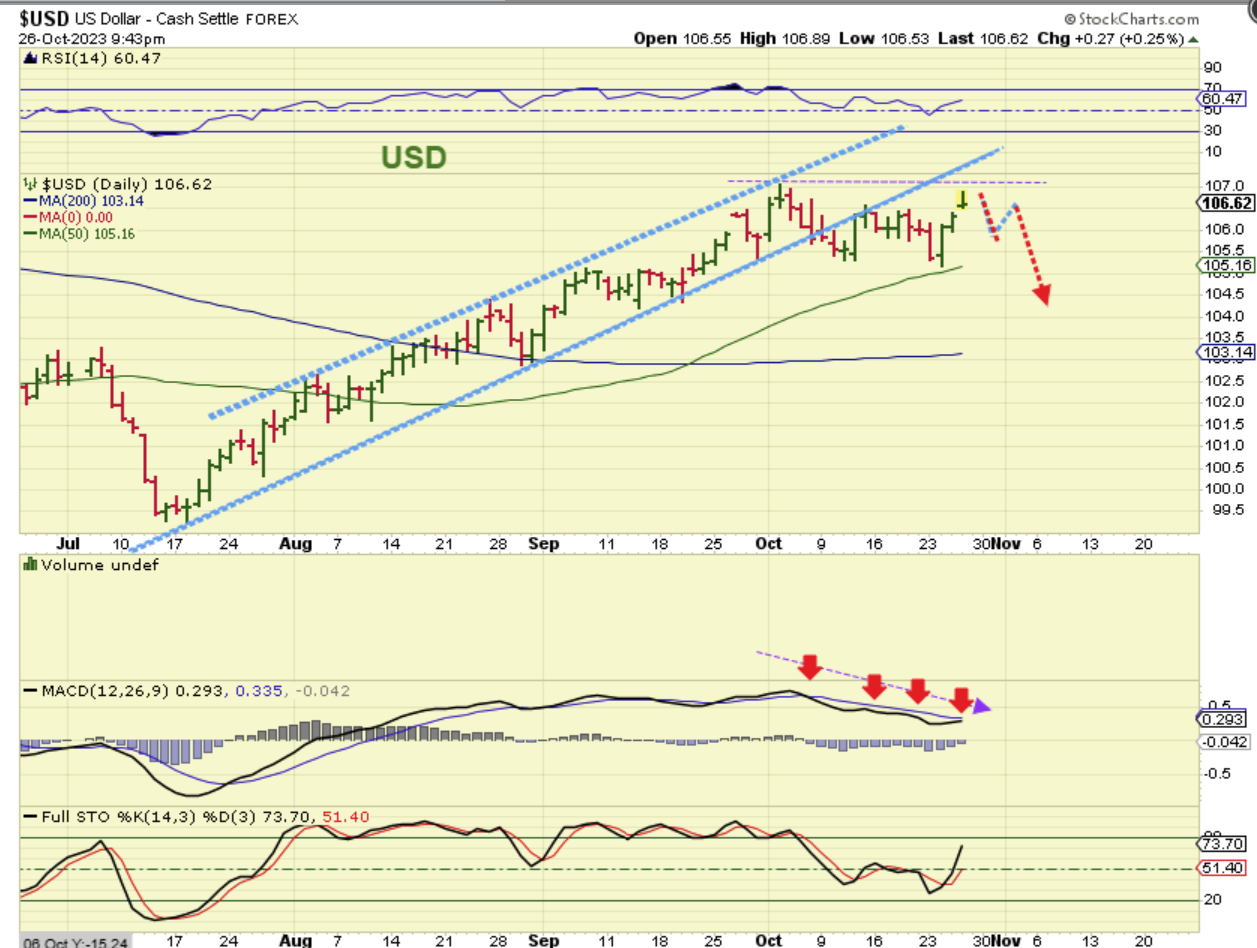
The USD popped and sold off. Cason wants this to just drop right now- on Friday! 🙂 We’ll see what happens.
.
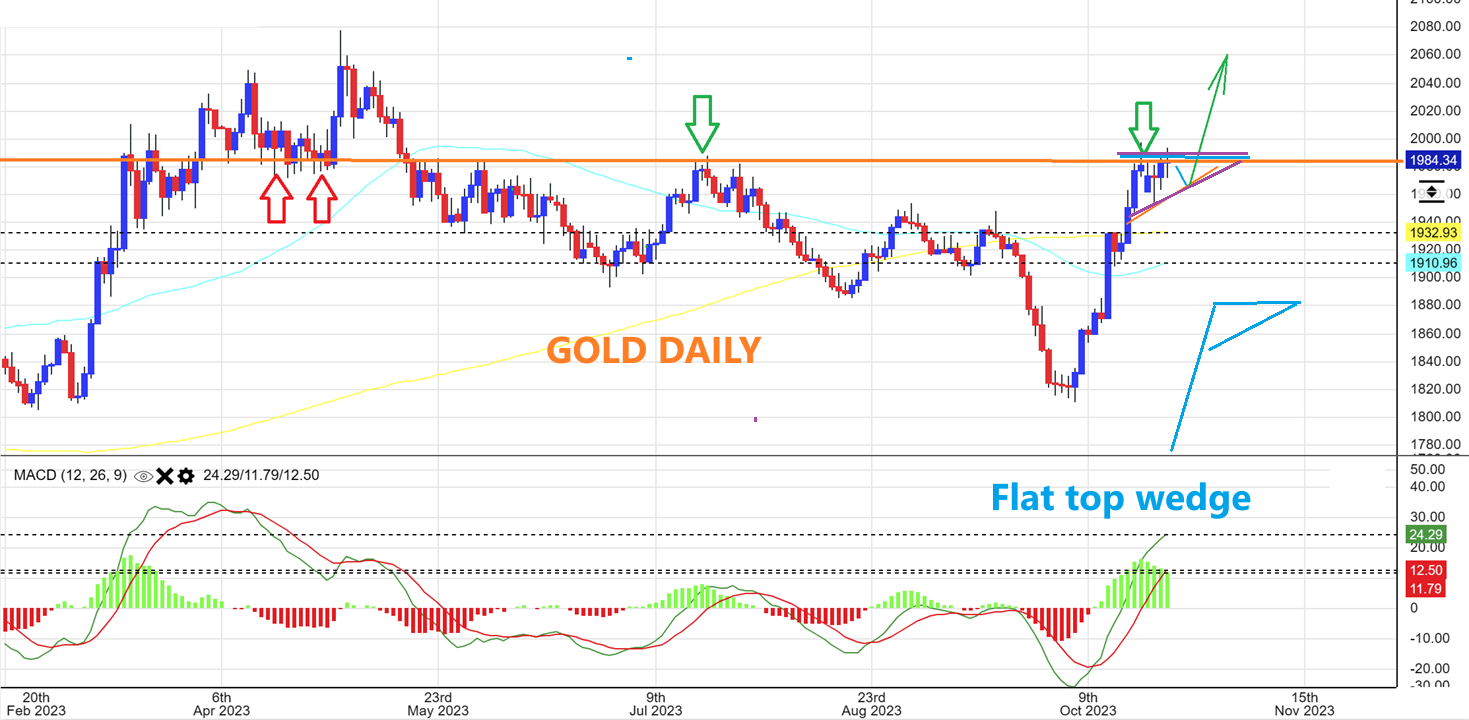
GOLD could be forming a bullish flat-topped wedge, so I drew one on the chart. This can just break out at any time, but just in case it keeps churning sideways, I wanted to draw this pattern so that you could see this as a possibility.
.
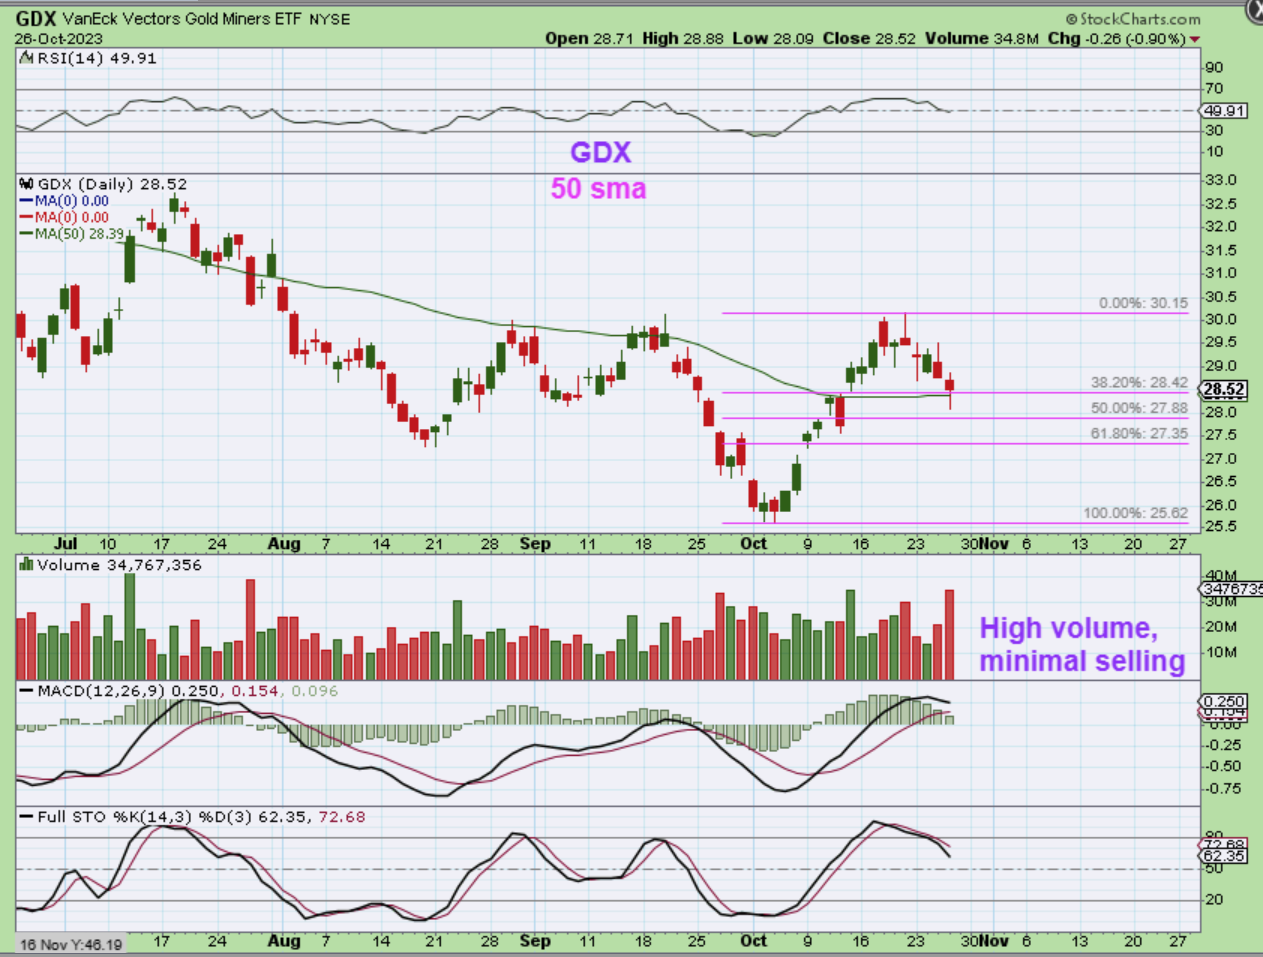
THE GDX lost the 50sma briefly, but I like that it regained it and the 38.2% Fib level. I see high volume, but to me that is not all sellers, it should be sellers and buyers with that wick. This is a mild sell off for the miners so far and should just be a 1/2 cycle low.
.
Let’s just look at a few miners and see how they are acting with the recent selling this week.
.
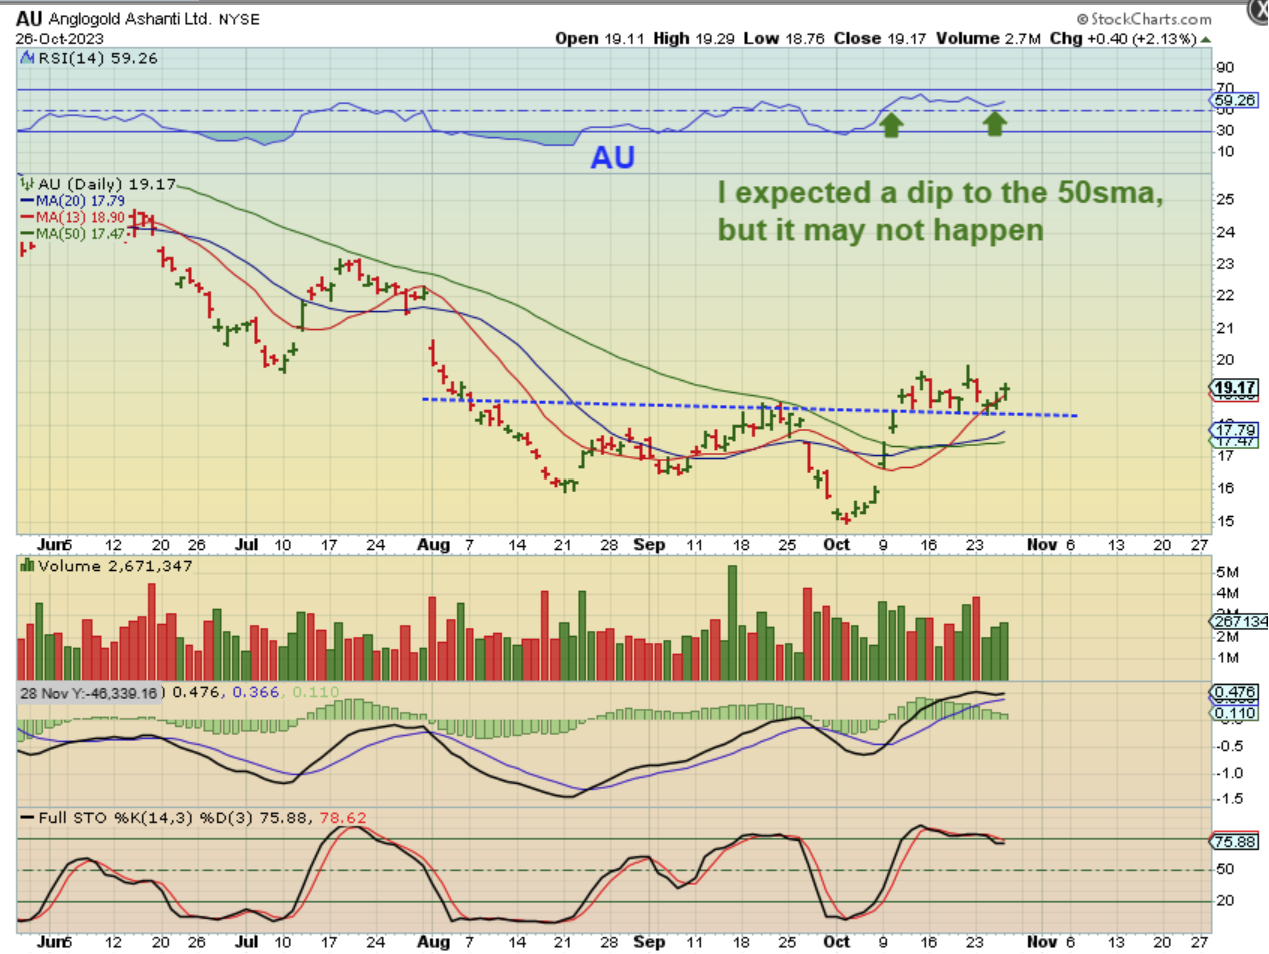
AU was a Miner that surged from $15 to $20 recently. I would have expected that it could dip down to $15 or the 50sma during a sell off, especially with all of those gaps below, but so far it is chopping sideways. Every time it has a red sell off day it finds buyers and pops higher again too. AU is still at $19, so it is holding the gains fairly well during this consolidation phase.
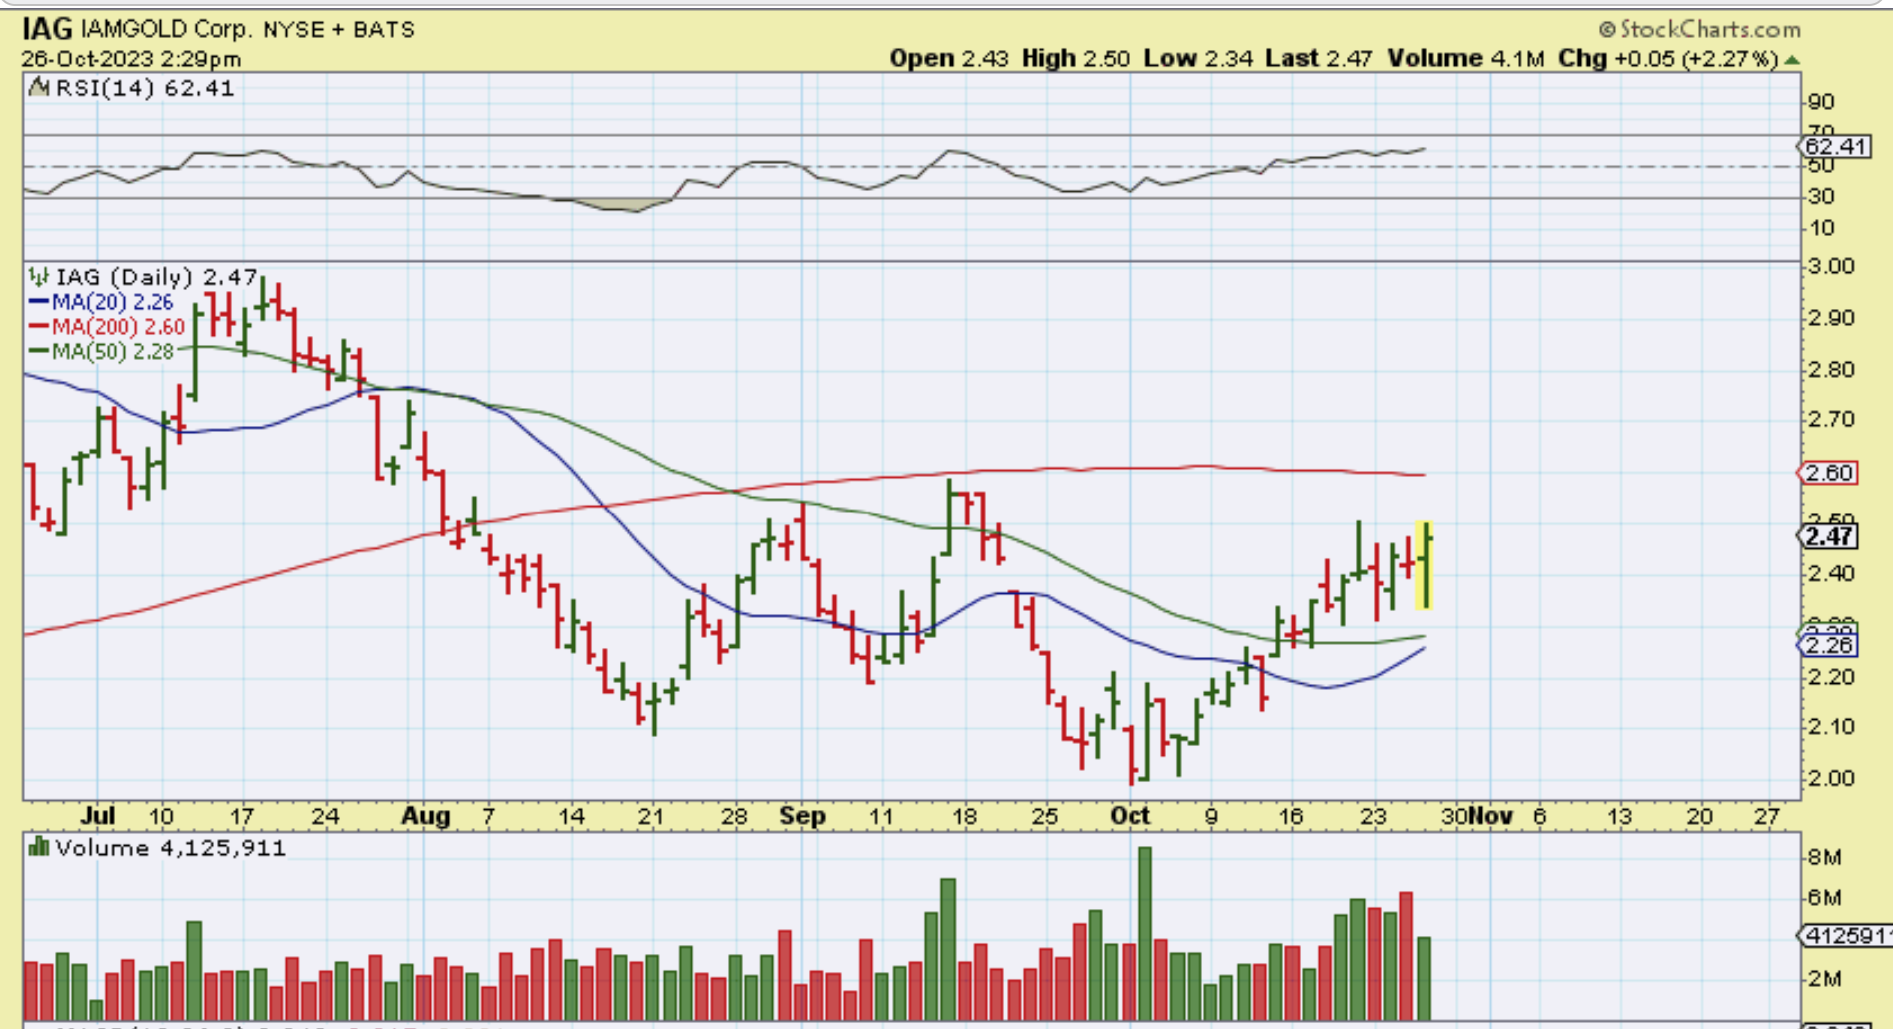
IAG has not been steadily selling off either, and it seems to drop each day and recover. That causes IAG to also still be at the October highs while the Precious Metals sell off.
.
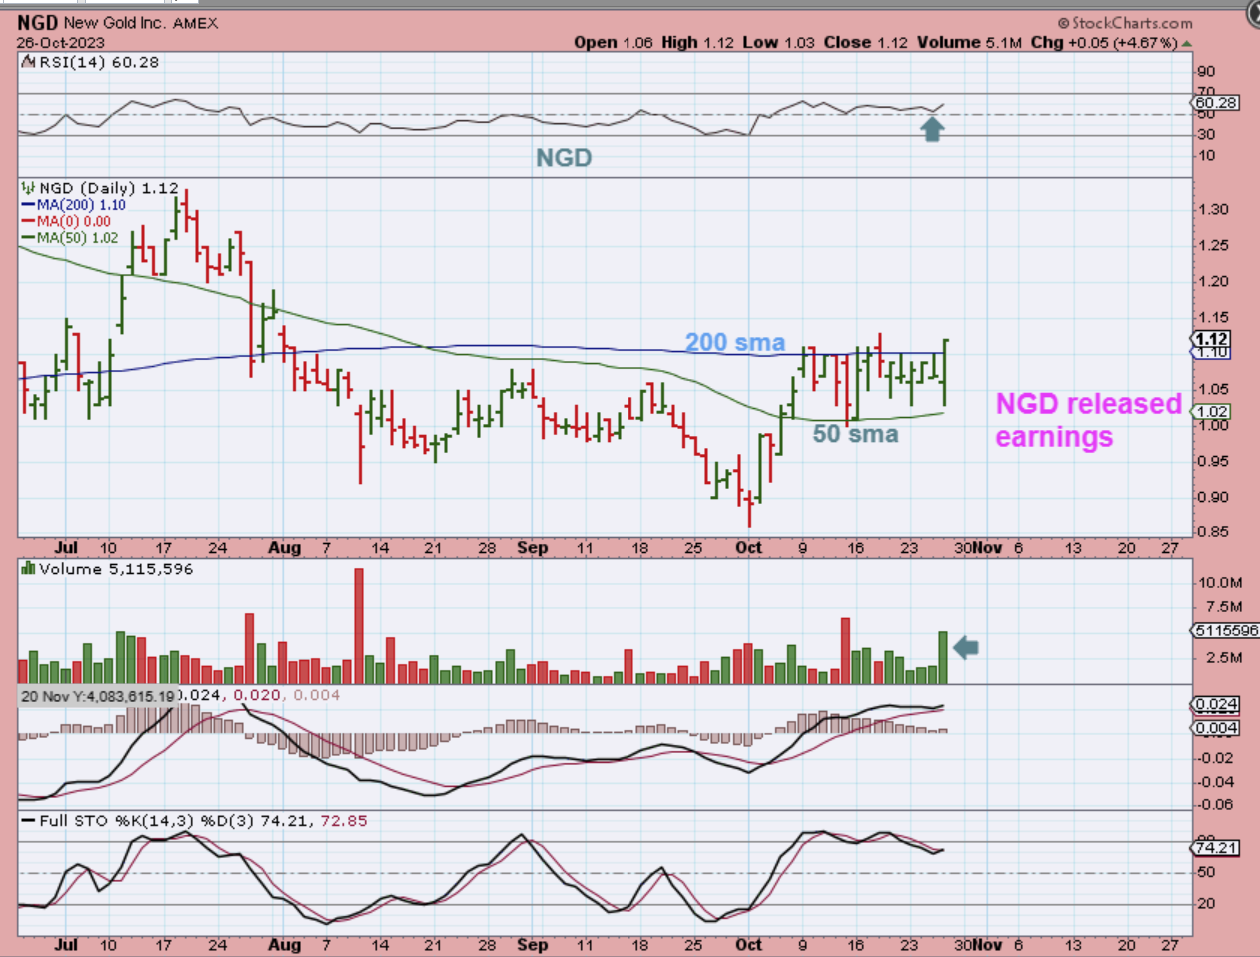
NGD released their earnings pre-market and it dropped and recovered quickly. It actually closed up 4.67% and closed above the 200sma, so I think that tells us that NGD is going to be a survivor of this chop. 🙂 Volume was strong as it broke out above the 50sma.
.
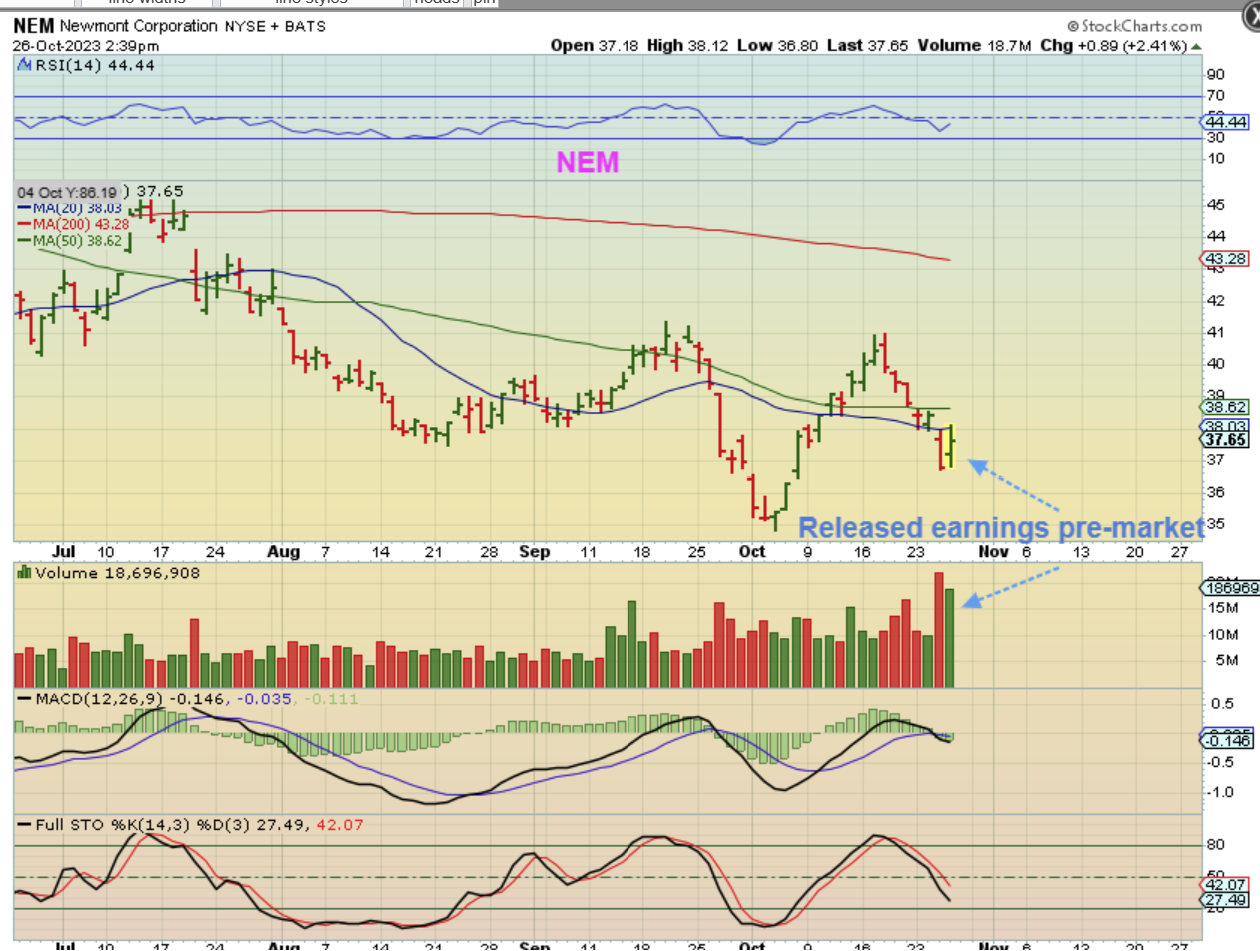
NEM also released their earnings. Newmont is a major component of the GDX so I would think that a rise in Newmont from here would also help the GDX ETF. That looks like a capitulation low for NEM too.
..
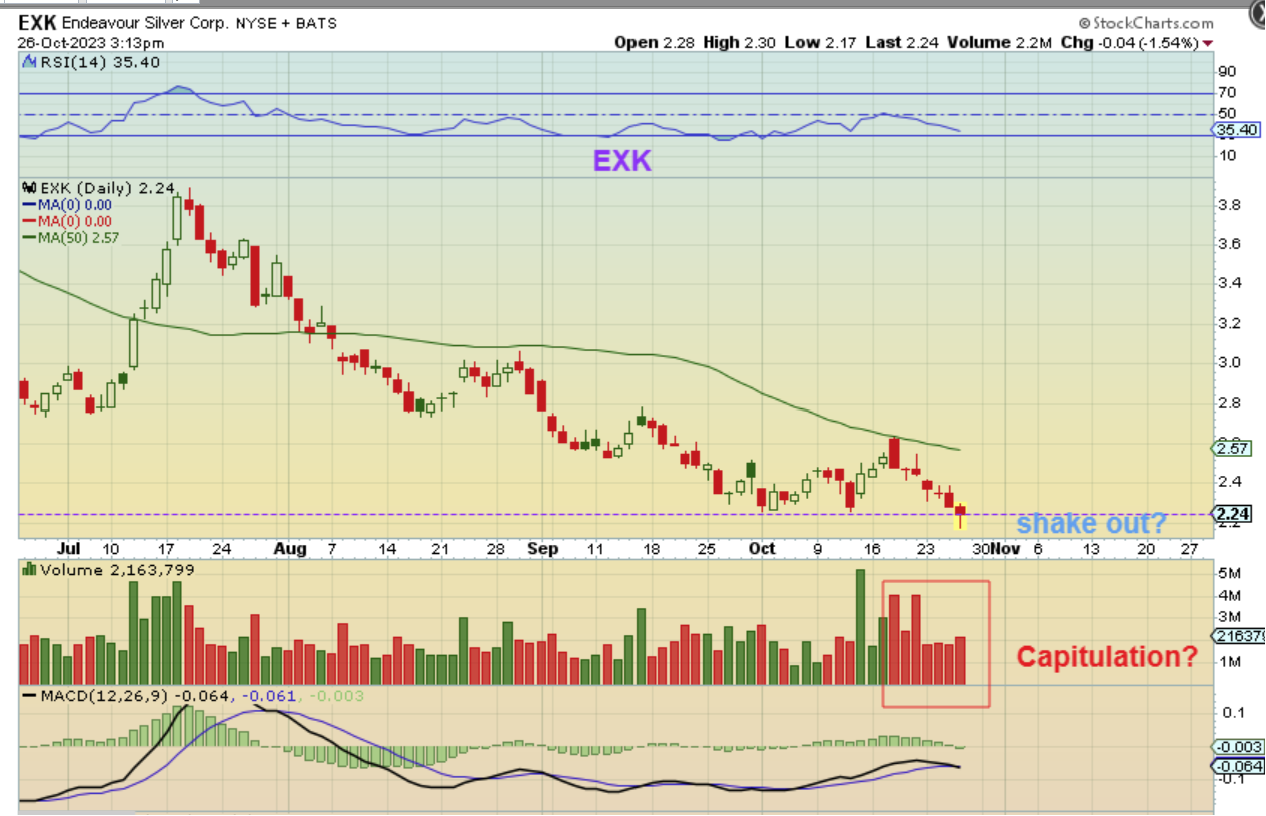
EXK actually sold off to new lows (what in the world is wrong with EXK), but it bounced back and that could be a shakeout low for EXK. I’m personally not buying it here, but this may be the lows for EXK.
.
So we have all heard the expression ‘Buy the Dip’ and now we are seeing that some Miners have dropped to support areas, while others are barely dropping at all, they are churning sideways. The Precious Metals should be putting in a 1/2 cycle dip soon, and then resume the strong rally that it had as it ripped higher out of the ICL (lows). I usually wait for a reversal and swing low before I buy, but buying or adding in this area on stocks like I mentioned above may be a good entry when things start to run higher again. We cannot guarantee that there will be no more downside, but some of these Miners have released earnings and they do look to be holding up nicely.
.
Today is Friday, the last trading day of the week. Enjoy your Friday trading!
.
~ALEX
.
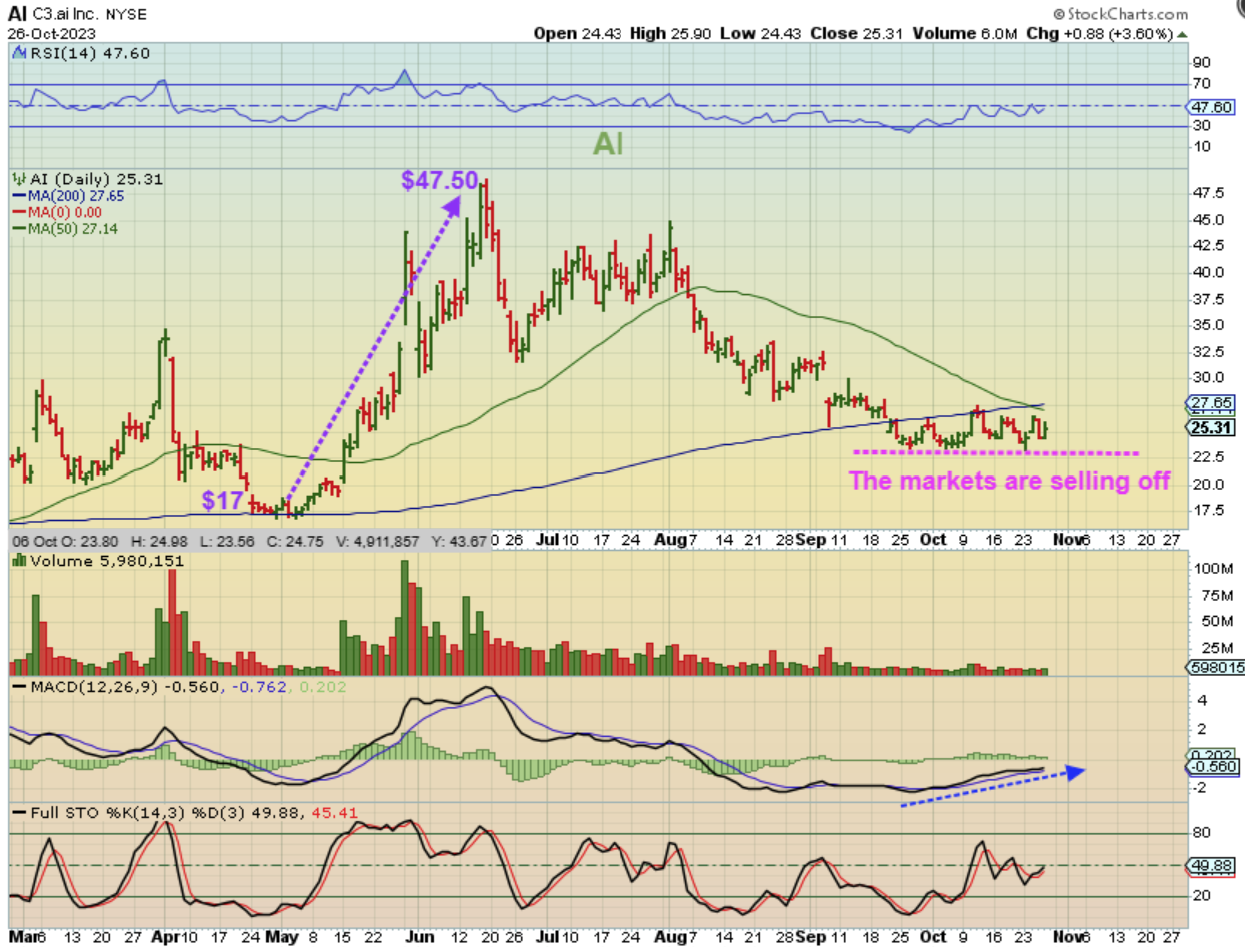
I just wanted to one company with the following chart of AI:
.
AI rallied sharply from $17 to $47.50 earlier in the year. It has been selling off and chopping around ever since it ‘peaked’ in June, but recently it no longer seems to be selling off, even with the Markets selling off. ‘AI‘ has been chopping sideways with the recent market sell off, so I am thinking that when the markets finally turn upward, AI may be a stock that you want on your check list.