Weekend Report September 23: A Market That Falls – Not Always a Bad Thing
The good news is that I like the way things are setting up. The General Markets should find an ICL and move higher and Gold and Silver are setting up great, despite a 10 week rally in the USD. I am away this week, but will have the weekday reports as usual. I want to release this Sunday morning, it is a long report, but it should answer many questions. I do not have time to go back and proof read it if I want to release it now, so if something is unclear you can ask me to clarify in the comments section and I will try when I get back. Thanks!! Enjoy your weekend!
.
I want to start the report by saying that after that Fed Mtg, it became a little more clear that we are going to have a final sell off in the General Markets into an ICL, and that was definitely a possibility mentioned in the reports. We just had to see how that last Daily Cycle played out (Would it break the downtrend and rally confirming that it was leaving behind an ICL or was an A-B-C Drop into that ICL still ahead?). It looks to be the next sell off low.
Also, even though Gold and Silver rallied on Thursday, it looks to me that Miners aren’t following Silver higher again and with the timing of the current daily cycle, they will soon either drop into a higher low to end the first daily cycle and then rally strongly- or the ICL may be ahead for Gold & Silver too. I tend to think that this may be the case, because at the last low when they rallied, we didn’t put in a higher high to break the downtrend. Interestingly, you will see with Precious Metals, the GDX did look like miners had an ICL ( higher high & right translated) and so they may just drop to a higher low, but Silver miners are weak! So did Gold Miners bottom first? Maybe. With Gold and Silver, however, we have L.T. Daily Cycles, so they may drop and break the lows to give us a final daily cycle into an ICL. I will discuss all of this, but as I do I want you to know that I think the General Markets and Miners are going to sharply rally out of the next lows in October (ICL) as shots will be forced to cover. We have had enough time for Gold to build up energy to Break out to all new highs. In other words, after a little more pain, we really should be set up to make great gains.
.
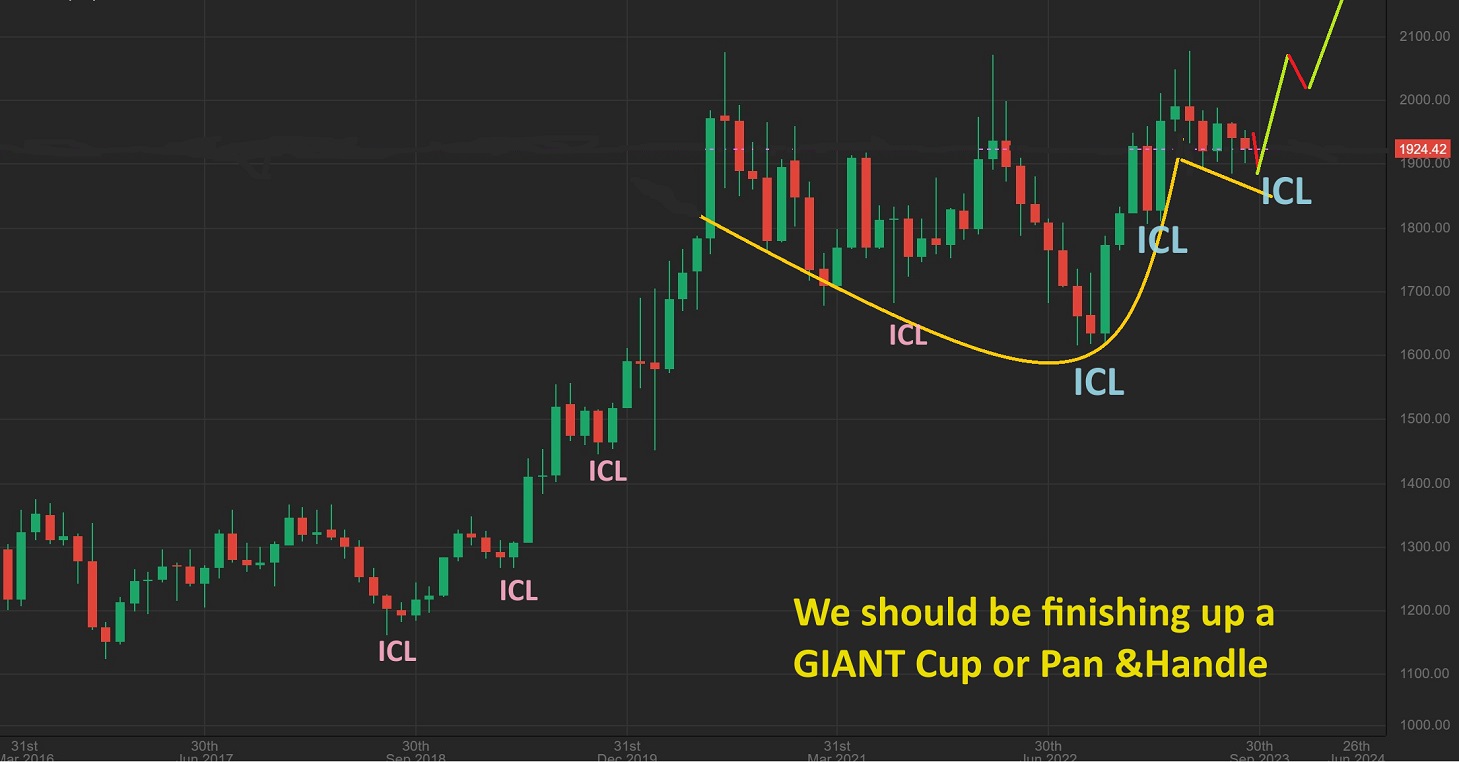
GOLD has formed a giant handle in all of this sideways chop. That sideways chop makes people absolutely HATE this sector, until you step back and see that a giant Cup has now formed a nice slanted handle, and…
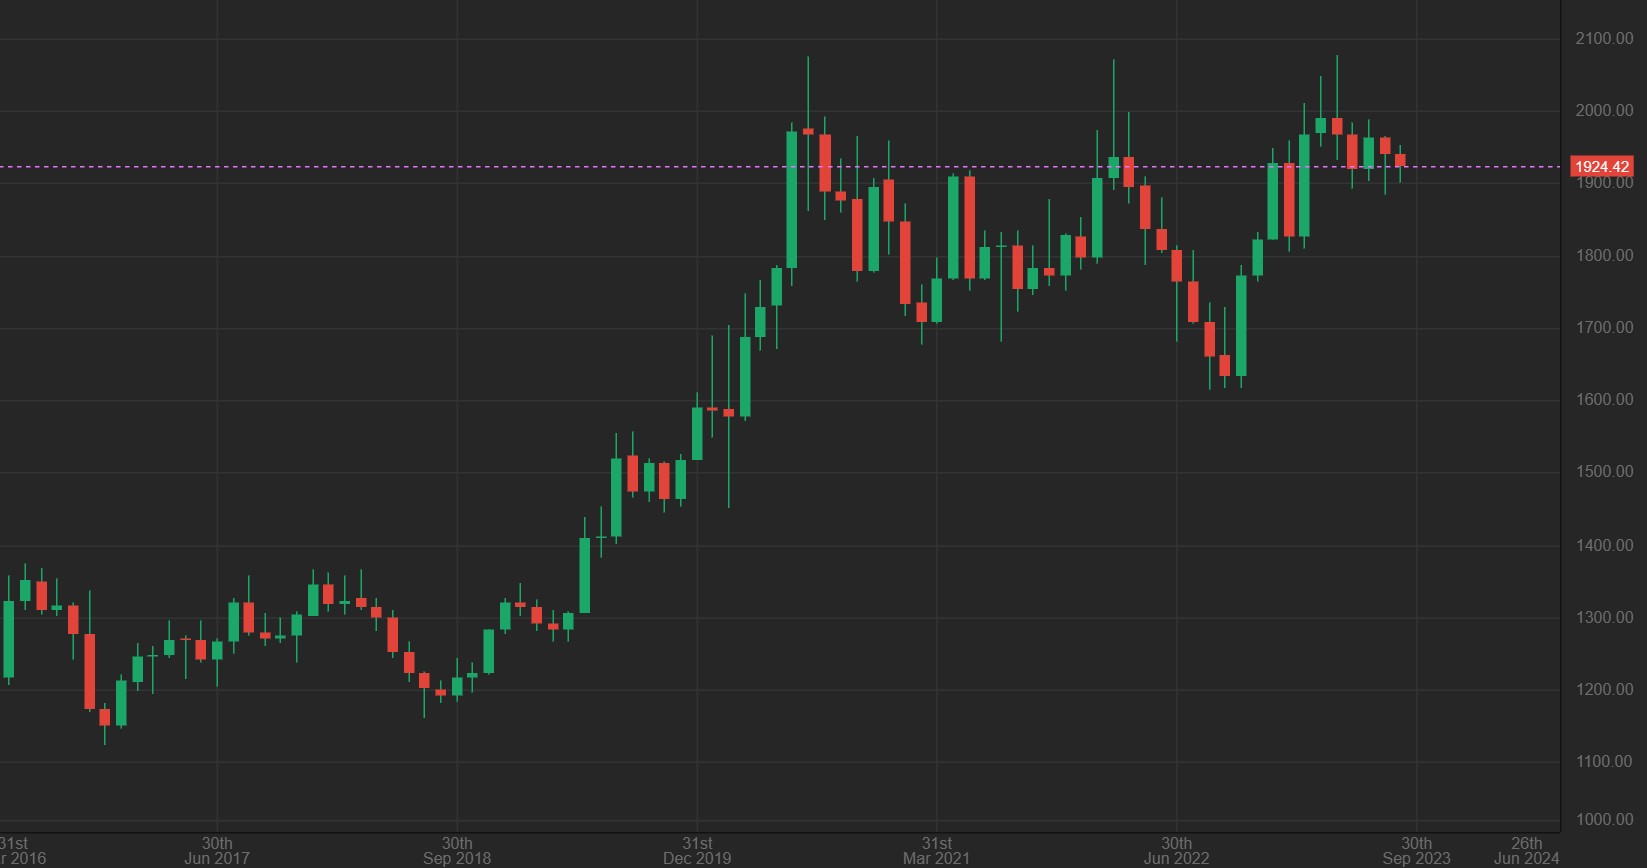
A launch from here should be excellent, whether we get 1 more dip next week or not, and that remains to be seen.
.
SO WE MAY ACTUALLY HAVE THE ICL, BUT EVEN IF NOT, GOLD IS ON DAY 26 AND WE SHOULD BE ENTERING A GREAT TIME TO GO LONG IN JUST A WEEK OR SO, BASED ON DAILY CYCLE TIMING FOR GOLD & SILVER.
.
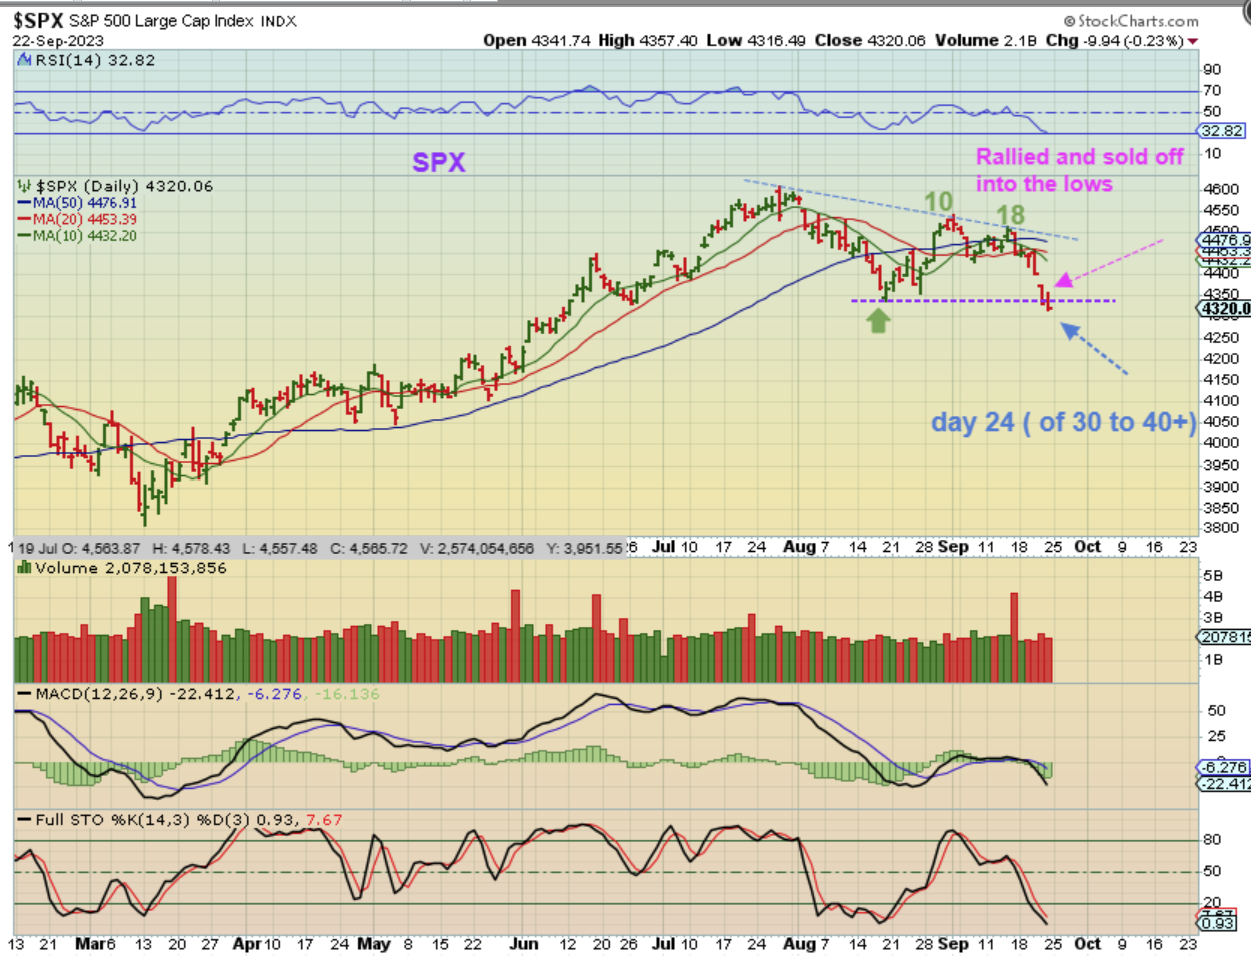
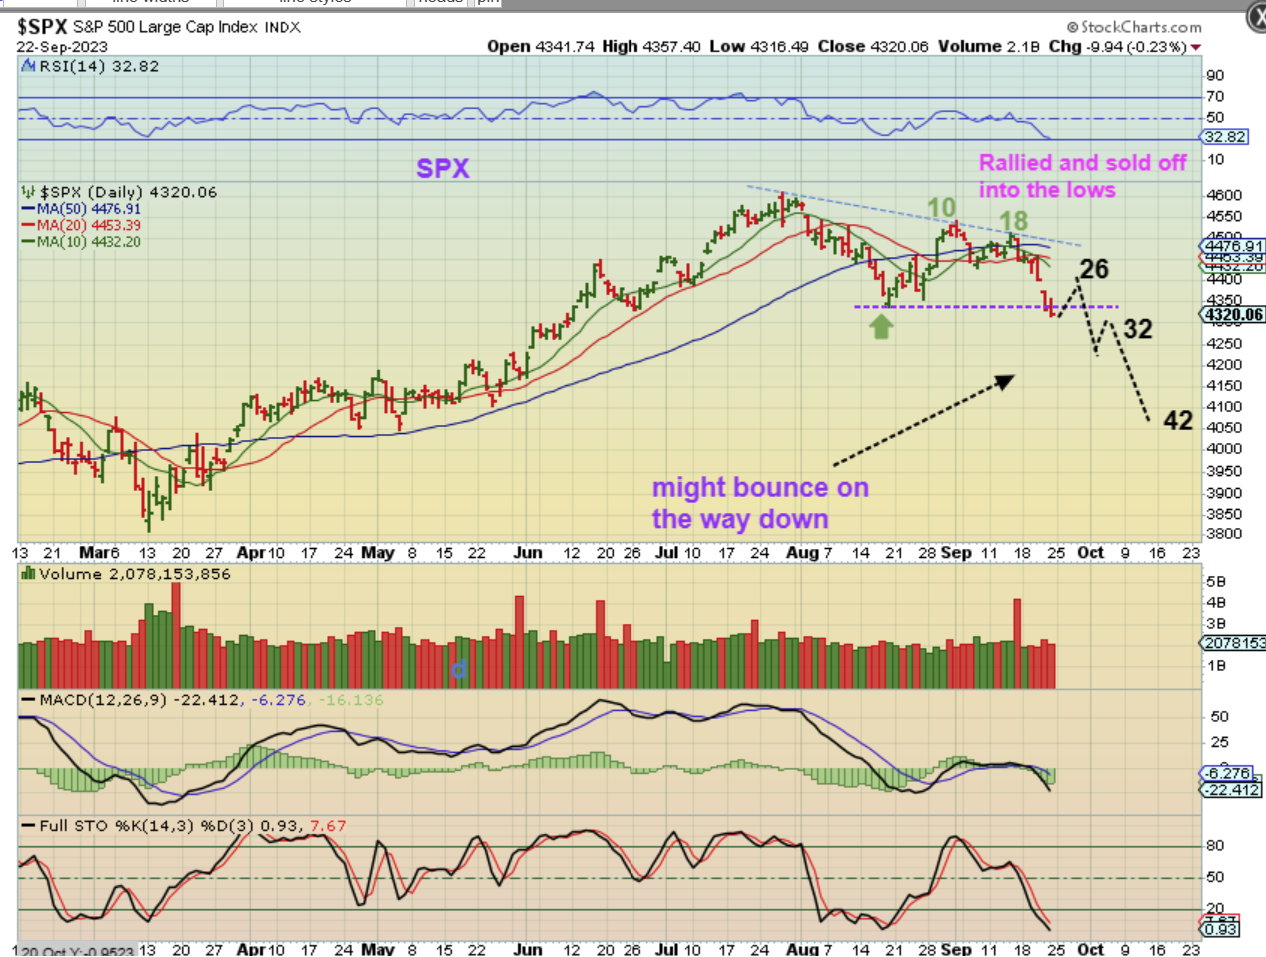
SPX DAILY – We had to buy this low (dcl) in August just in case we rallied to new highs and the bull run continued from there. Now that it is failing, we know that the Intermediate Cycle is in decline, and it is heading into an ICL. On day 23, this can fall for a couple of weeks actually, since the daily cycles can be 30 to over 40 days long.
.
SPX DAILY – So I would be watching the 200sma area for support or a break down and recovery. That is 4190.
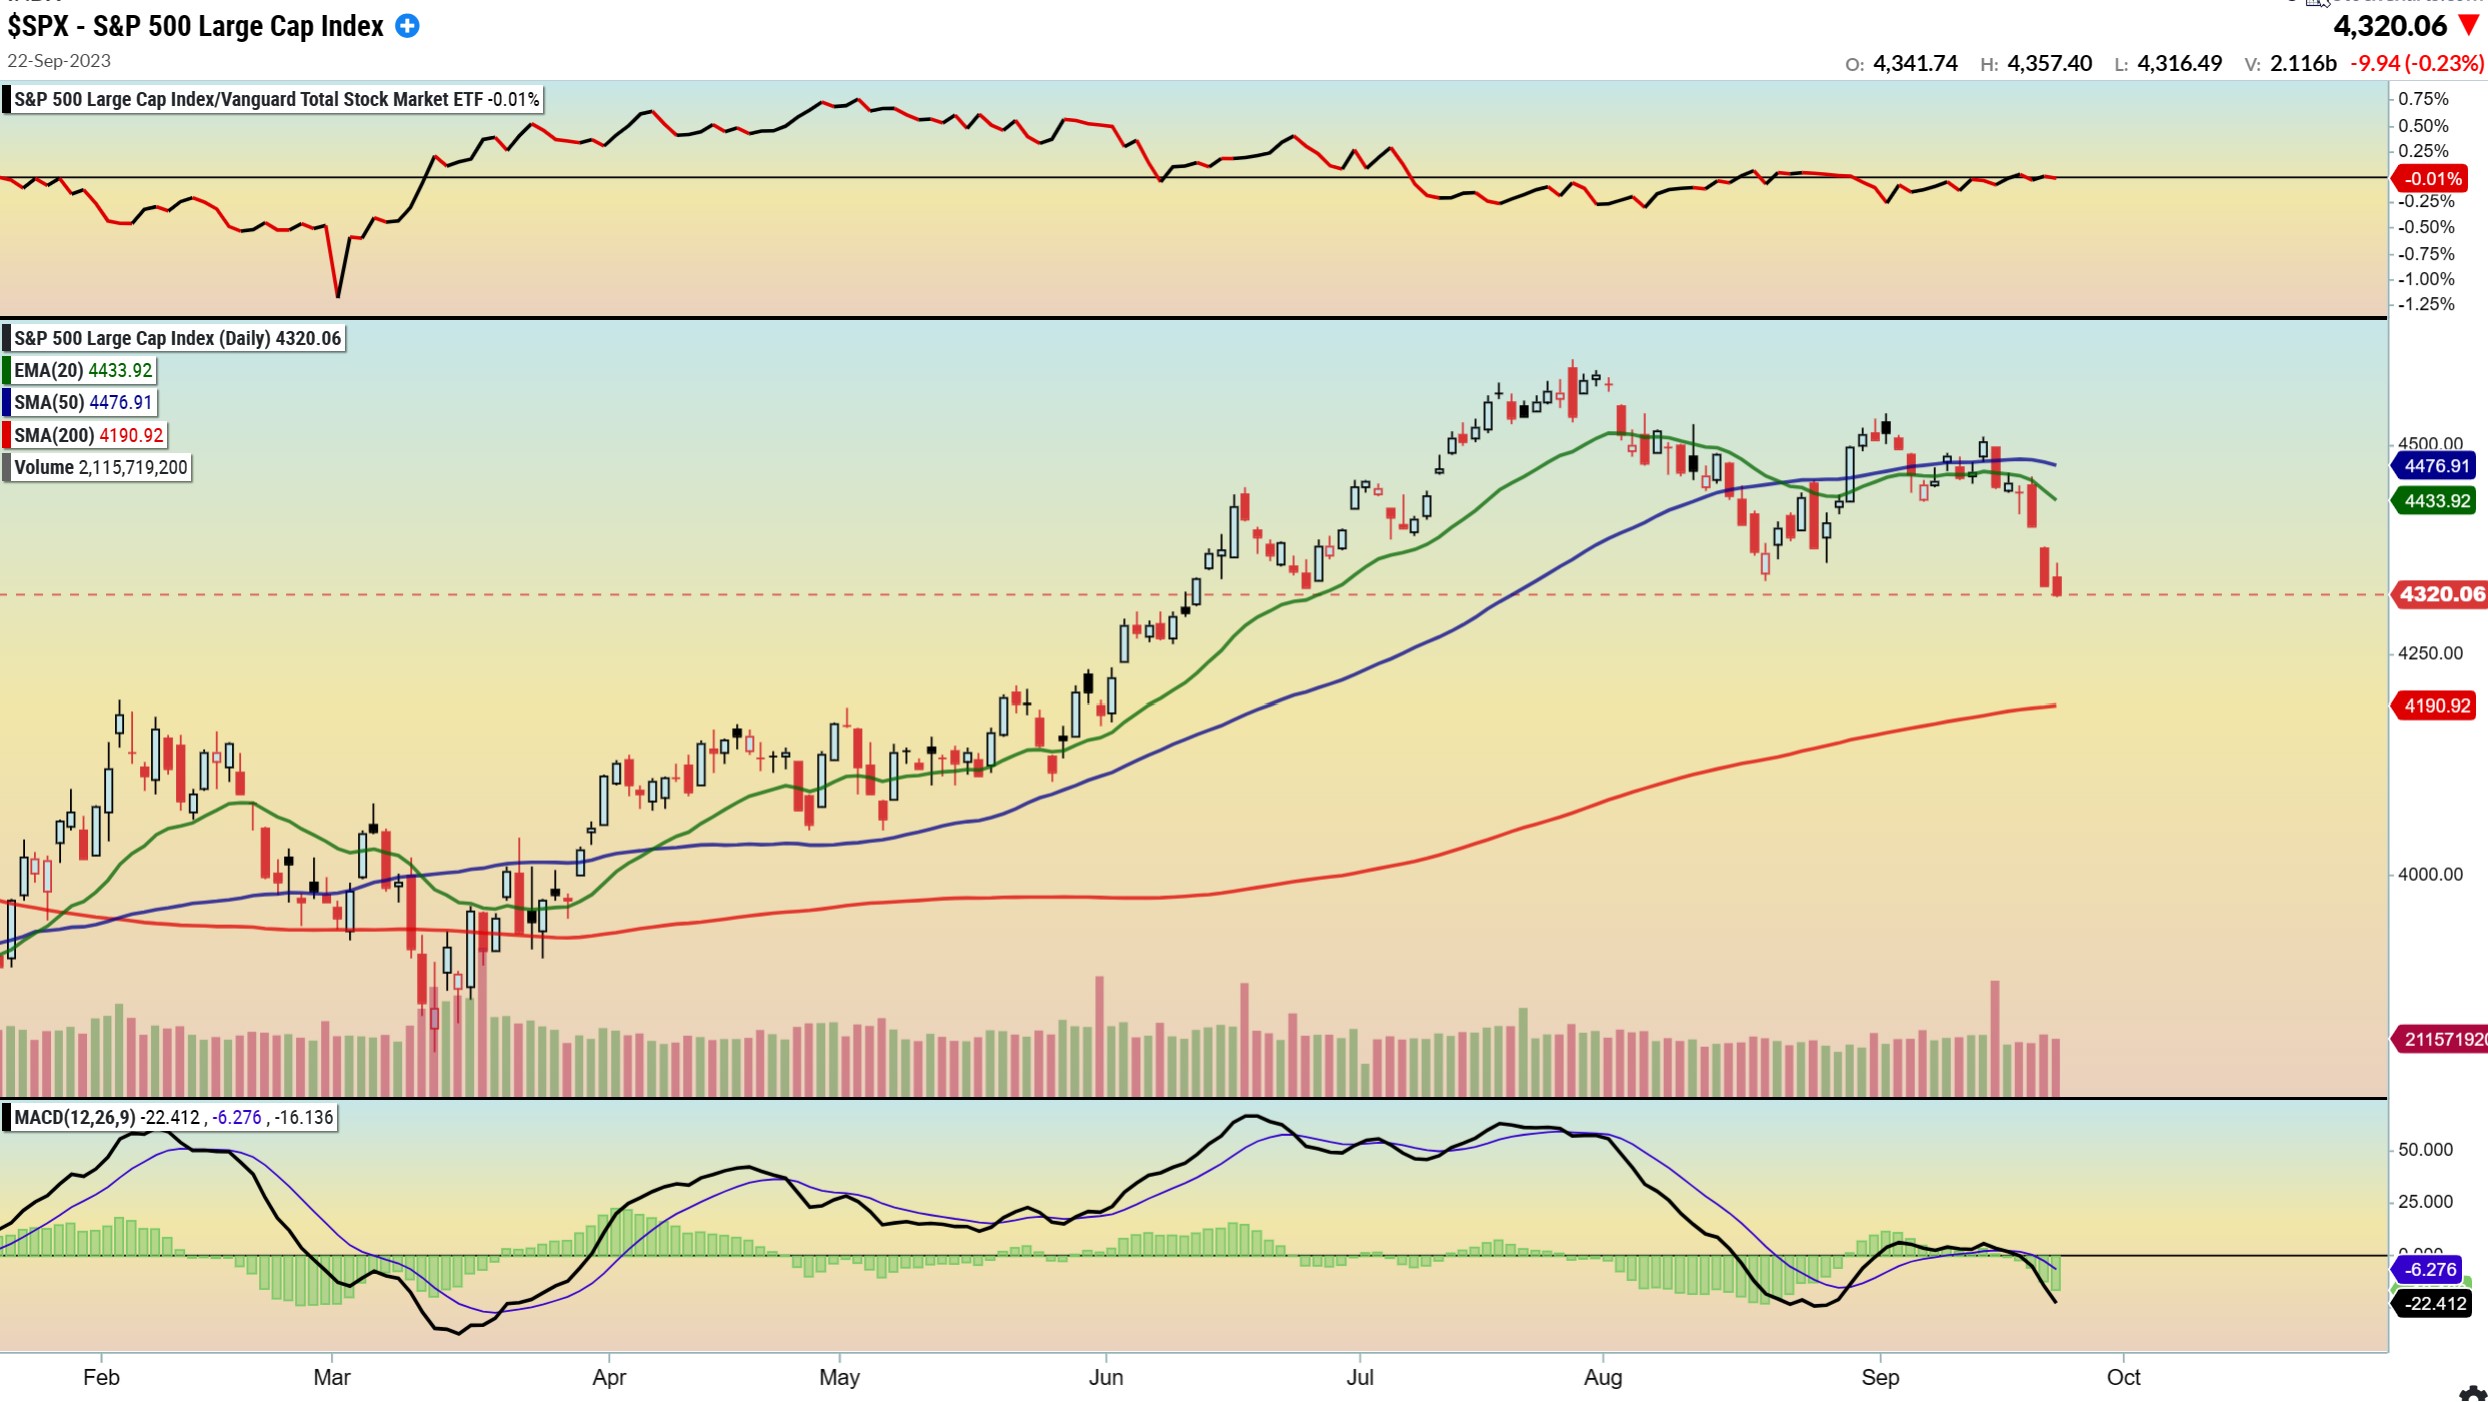
SPX DAILY – It is also possible that with a 40 day daily cycle we have time to break below the 200sma and then quickly recover as a shake out. I will take it day by day and clues will develop to help us to identify that next low to go long. A bounce ( day 26 shown here for example) would also be a good place to go short.
.
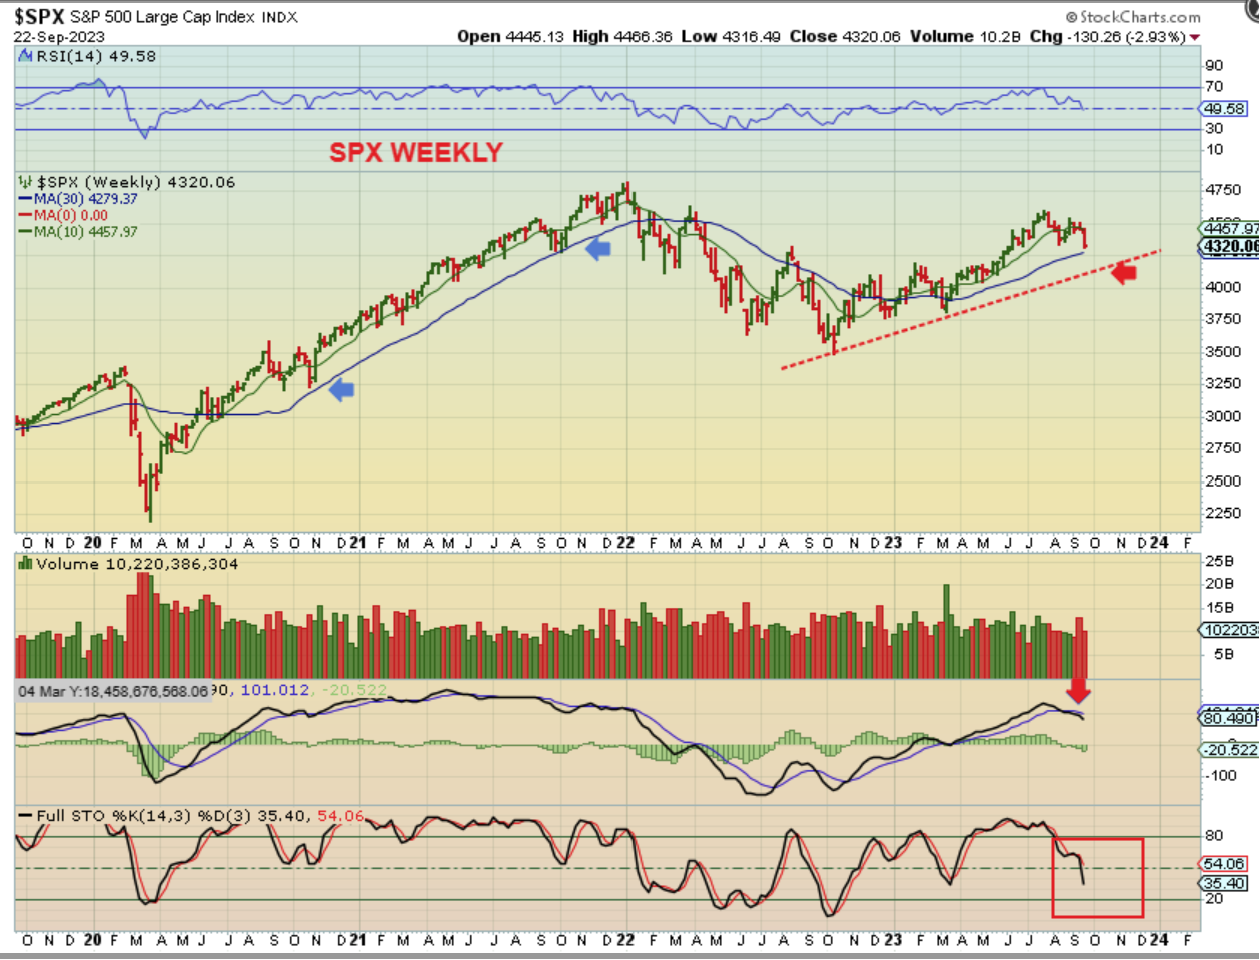
SPX WEEKLY – To be honest, this is a bit interesting. The weekly chart often held at the 30 week ma, and we are almost there. For this to happen now, we would likely bounce and then drop to it similar to October of 2020 ( the first blue arrow). So I will keep both the weekly and daily charts in view.
.
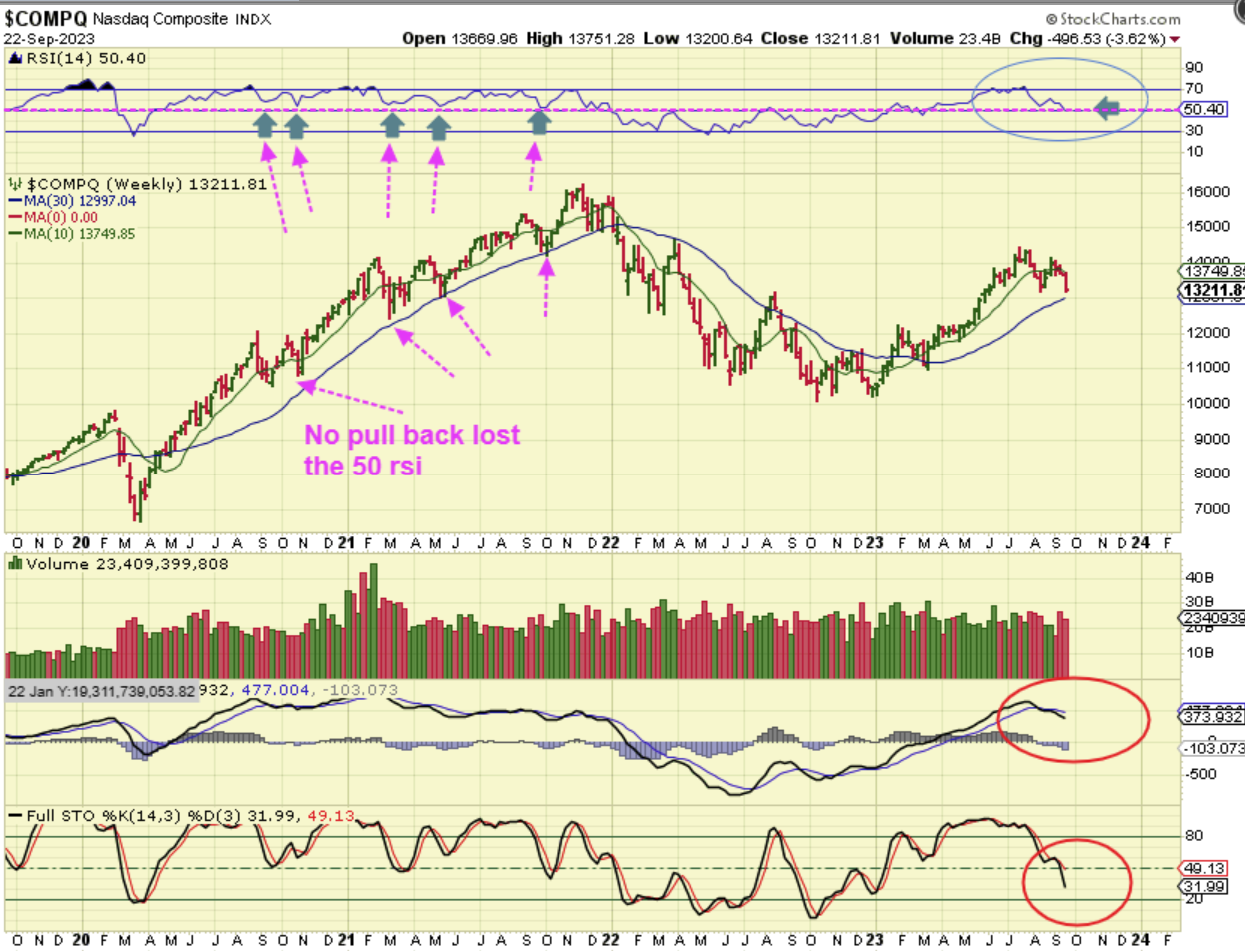
NASDAQ WEEKLY – The Nasdaq Weekly chart shows the same support approaching quickly.
.
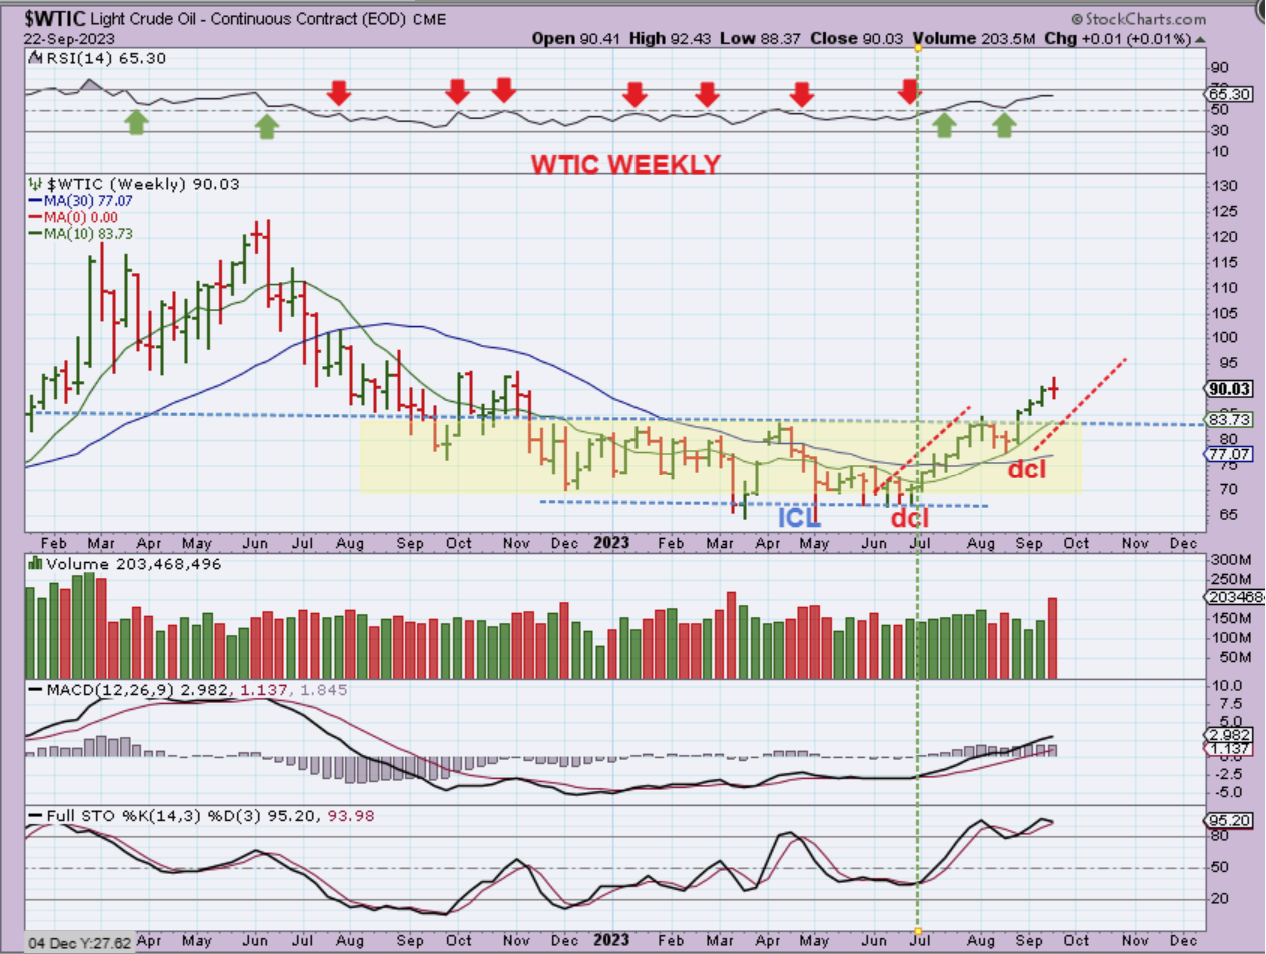
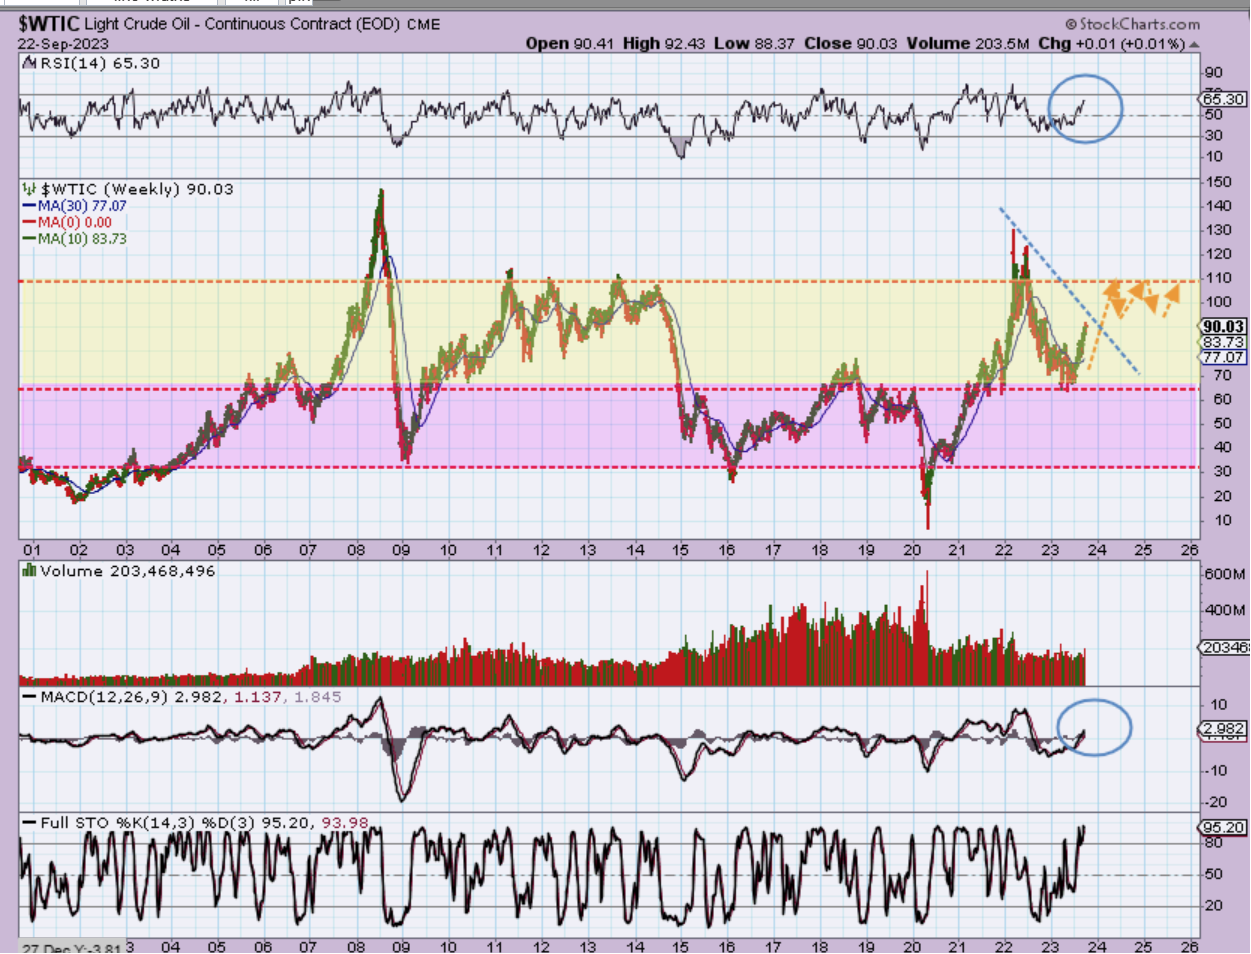
WTIC WEEKLY – Oil had a very choppy bottoming process and just when everyone hated Oil, it took off higher and has been on a great run. Notice also that Oils first daily cycle returned right back to the lows. See the ‘ICL’ to the next ‘ DCL’ . I expect Gold, Silver, and the Miners may be doing this too.
.
WTIC WEEKLY – The downtrend line is roughly $100. Oil may pause and pull back at $100, before continuing higher.
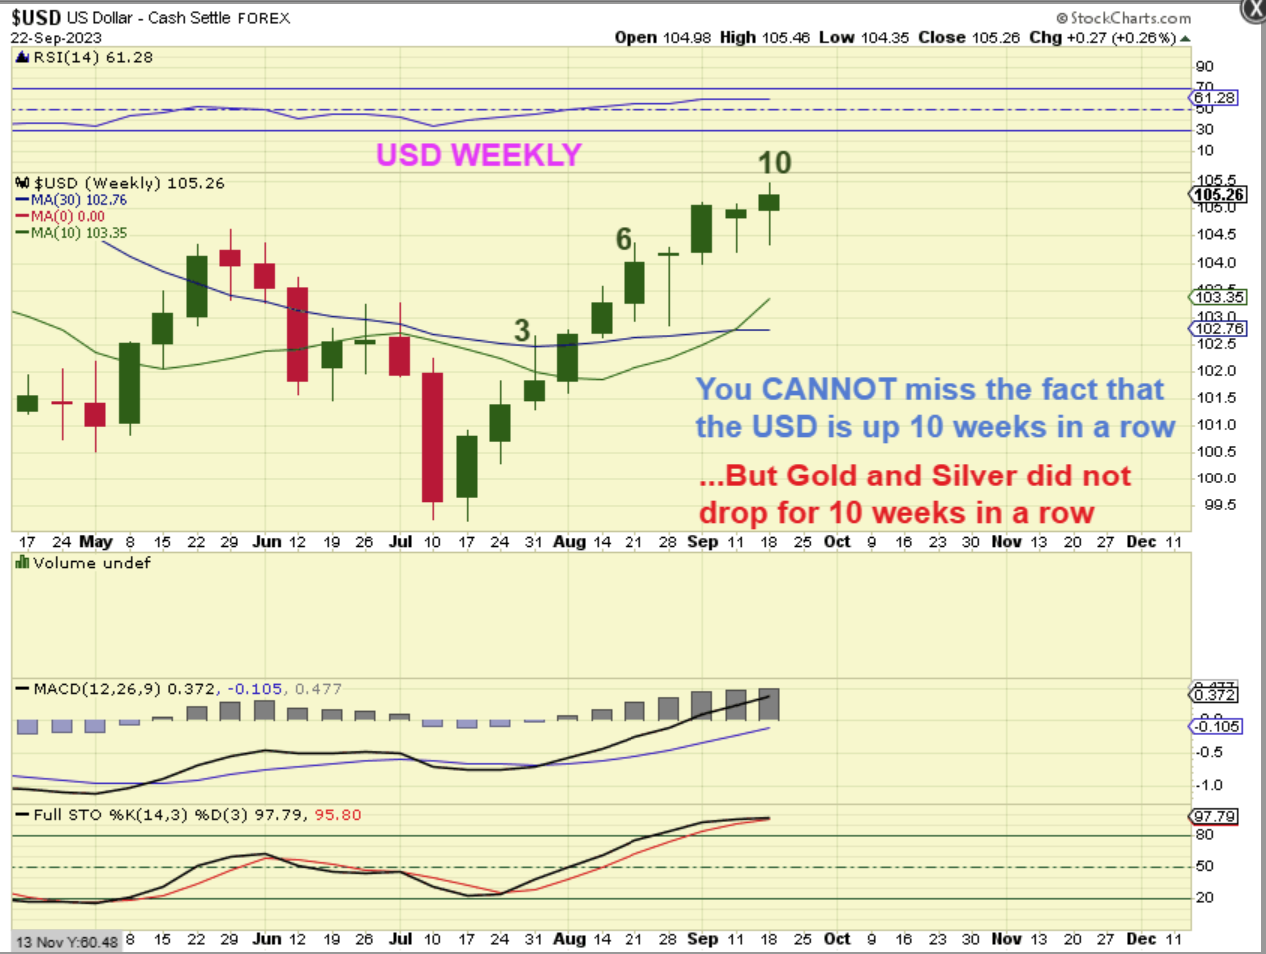
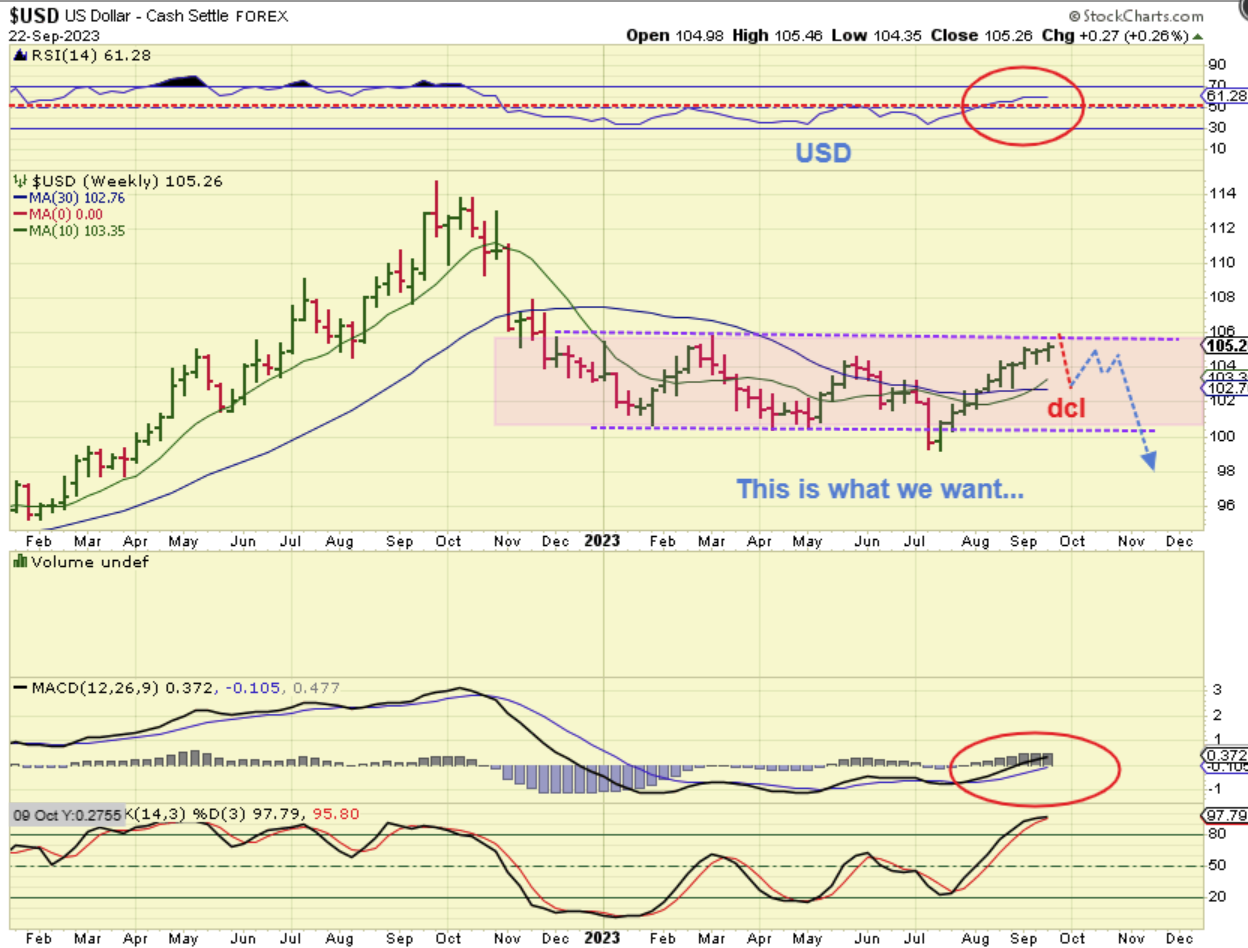
USD WEEKLY – The USD has an ICL and rallied VERY STRONGLY Out of that low. 10 weeks straight up, but the good news is that Gold and Silver are not spending 10 weeks dropping, as shown in my last report.
.
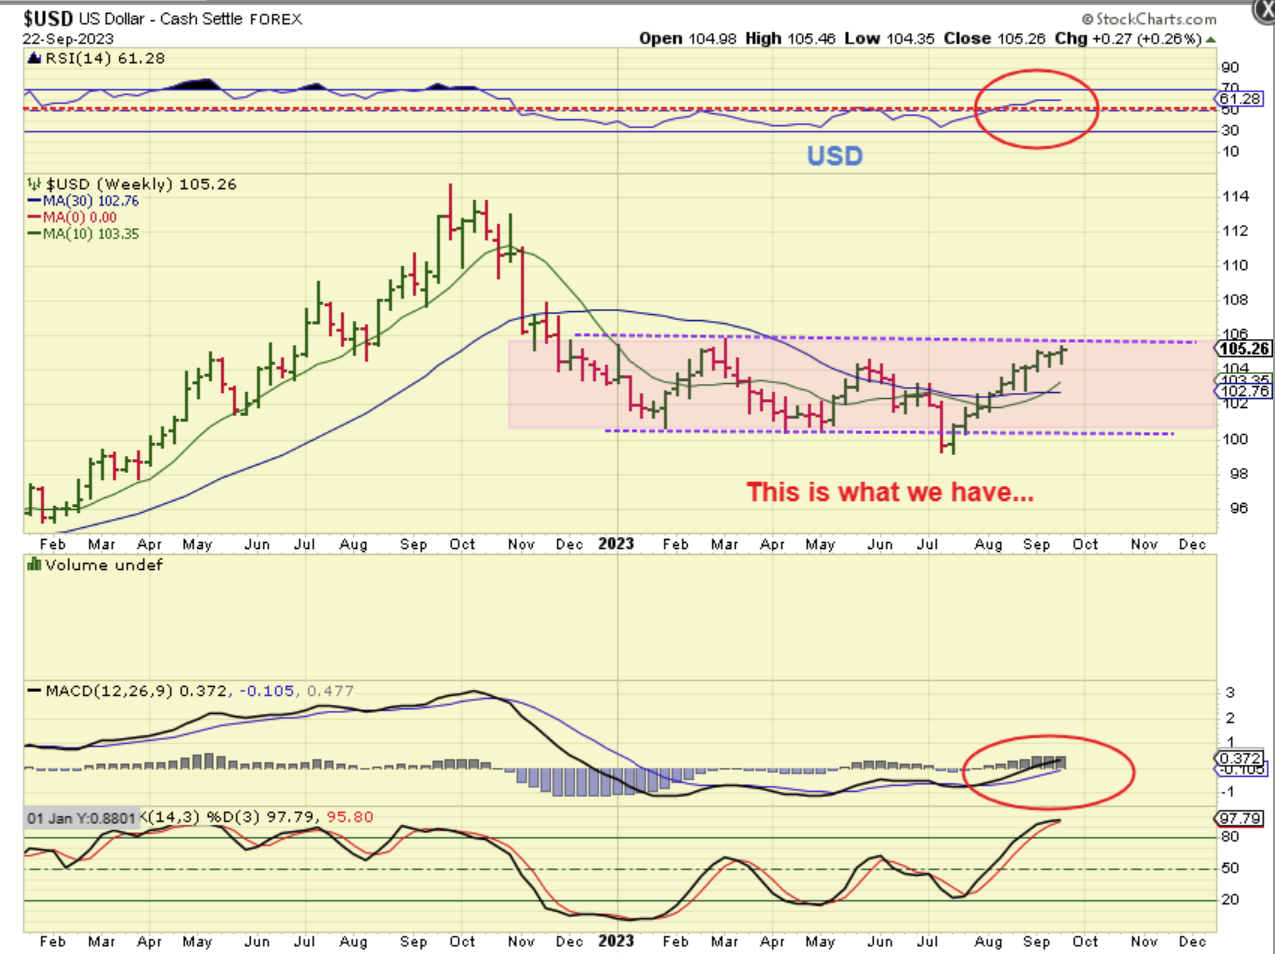
USD WEEKLY– The USD has also broken above the weekly 50 RSI for the first time since the sell off. That shake out low that I’ve mentioned could very well be the low, but again, this can eventually roll over and allow precious metals to rally. They have NOT dropped for 10 weeks in a row, they are decoupling. So this is what we have now…
.
USD WEEKLY – THIS IS VERY POSSIBLE.
The USD can drop into a dcl soon, bounce to a lower high never breaking that $1.06 area, and then drop again to lower dcls. This intermediate cycle would then be selling down into the 3 yr cycle low.
..
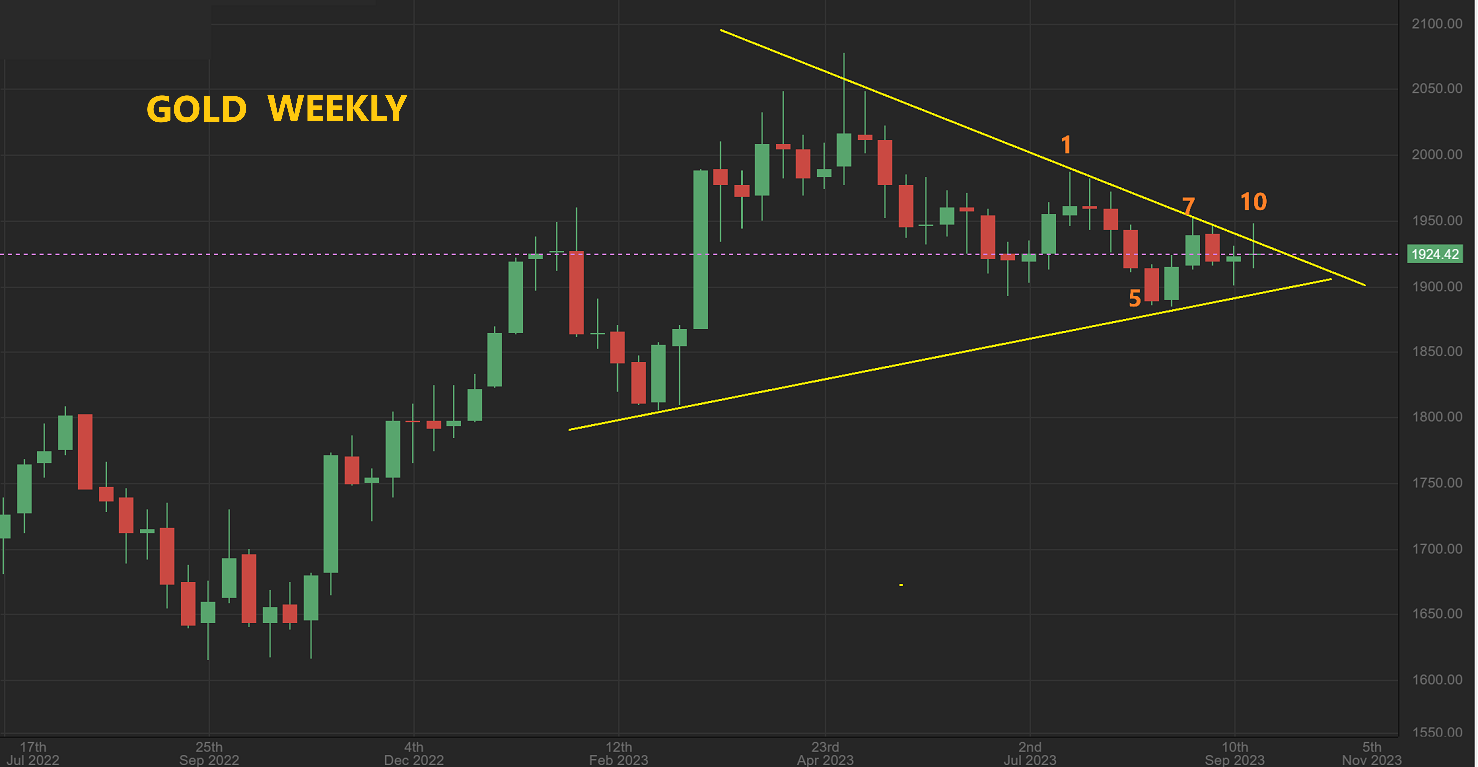
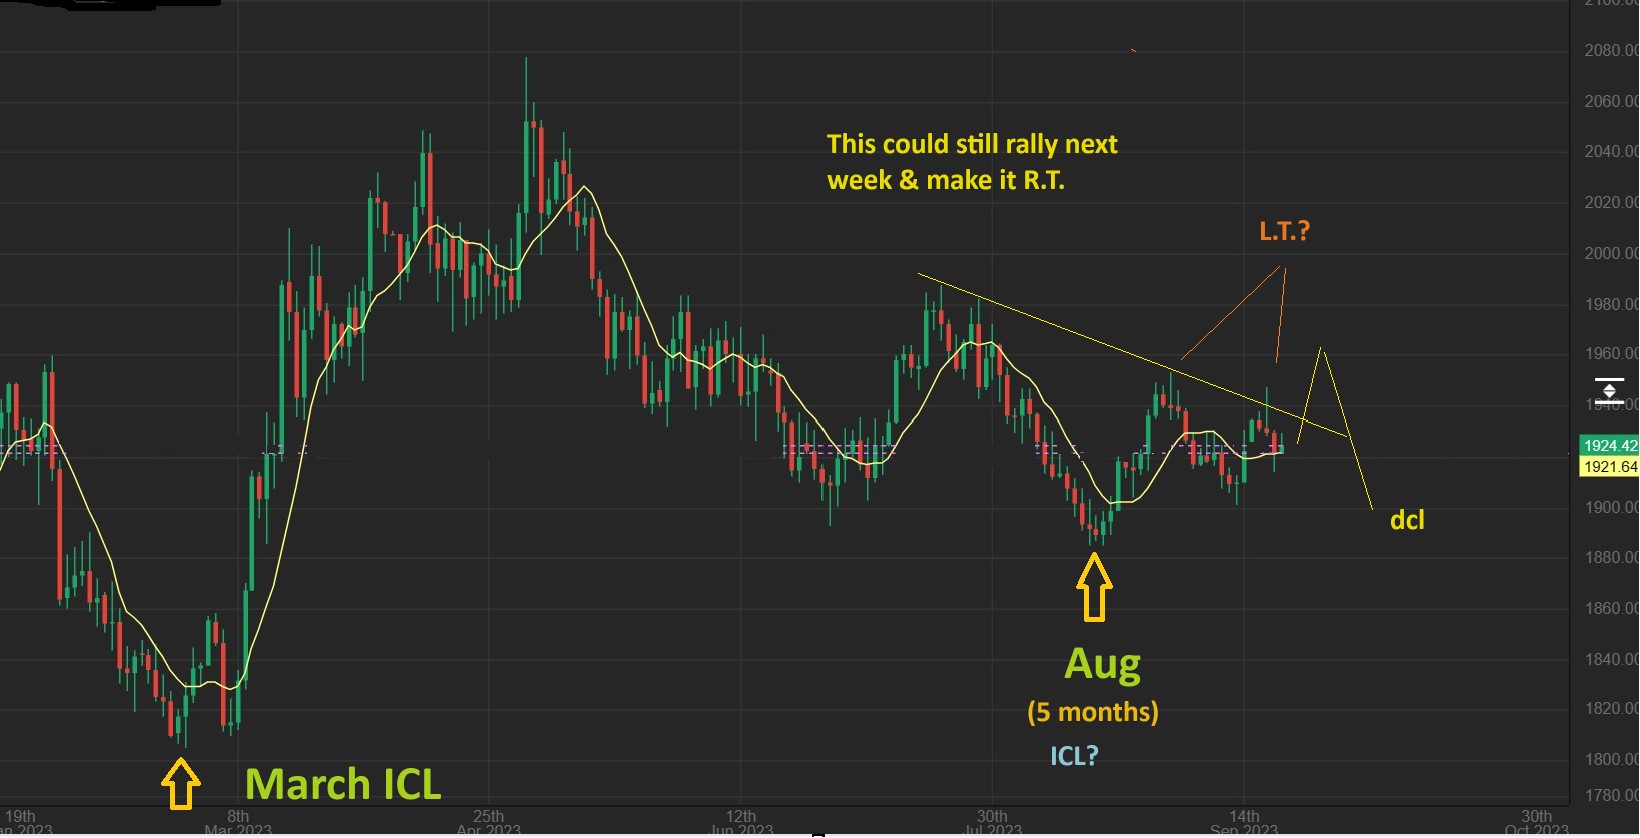
GOLD WEEKLY – I wanted to show you that Gold did NOT drop for 10 weeks in a row with the USD rising for 10 weeks in a row. You can see that 10 weeks ago, when the USD started to rally, Gold did drop for the first 5 weeks, but then it rallied on week 6 & 7 and has formed a triangle since then. It is now ignoring the USD rally to new highs each week.
Note: Gold MIGHT already have the ICL in place or a false break down of the triangle could give us our ICL. We are VERY close, since the last ICL in March was now going on 7 months! GOLD HAS OR WILL PUT IN AN ICL VERY SOON.
.
.
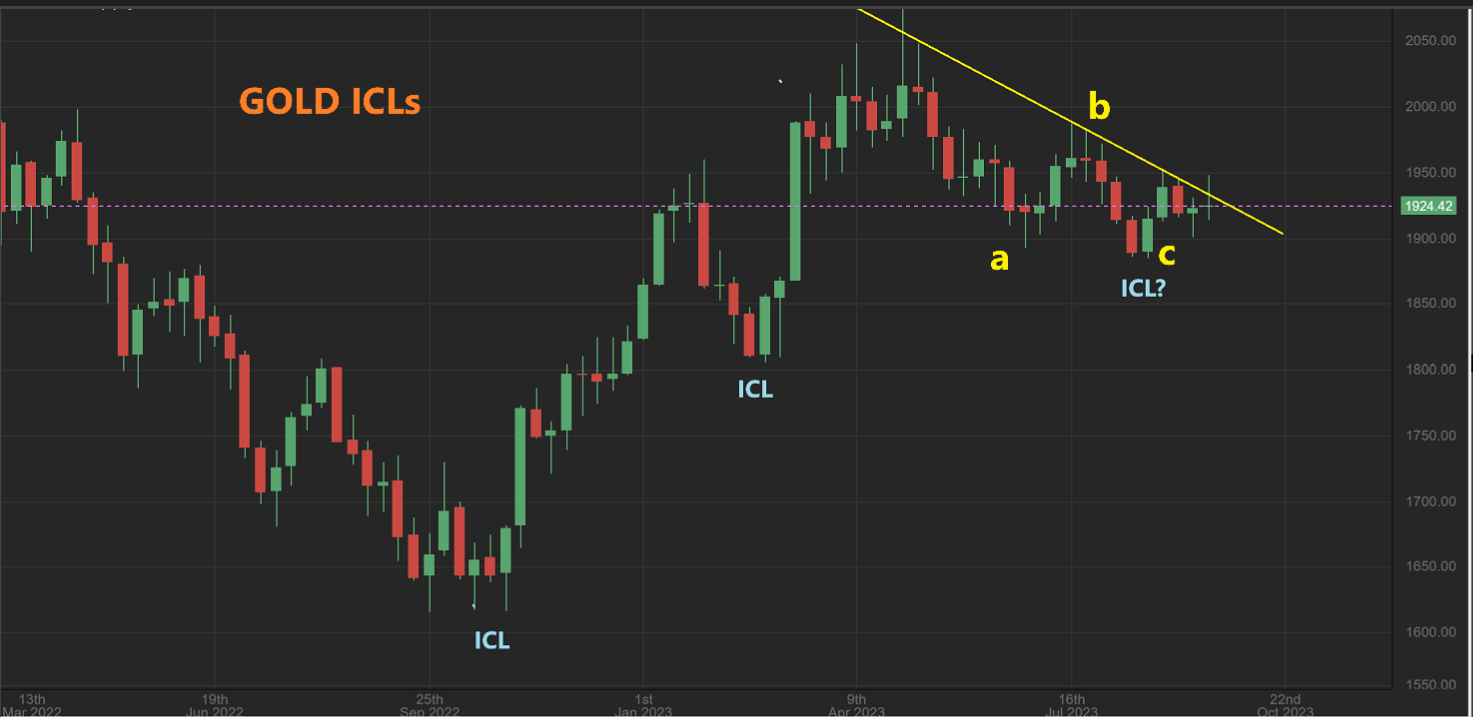
GOLD WEEKLY – So I look for an A-B-C and we do have one. The ICL may be in and we may be seeing a very choppy low in the first daily cycle, similar to Oil.
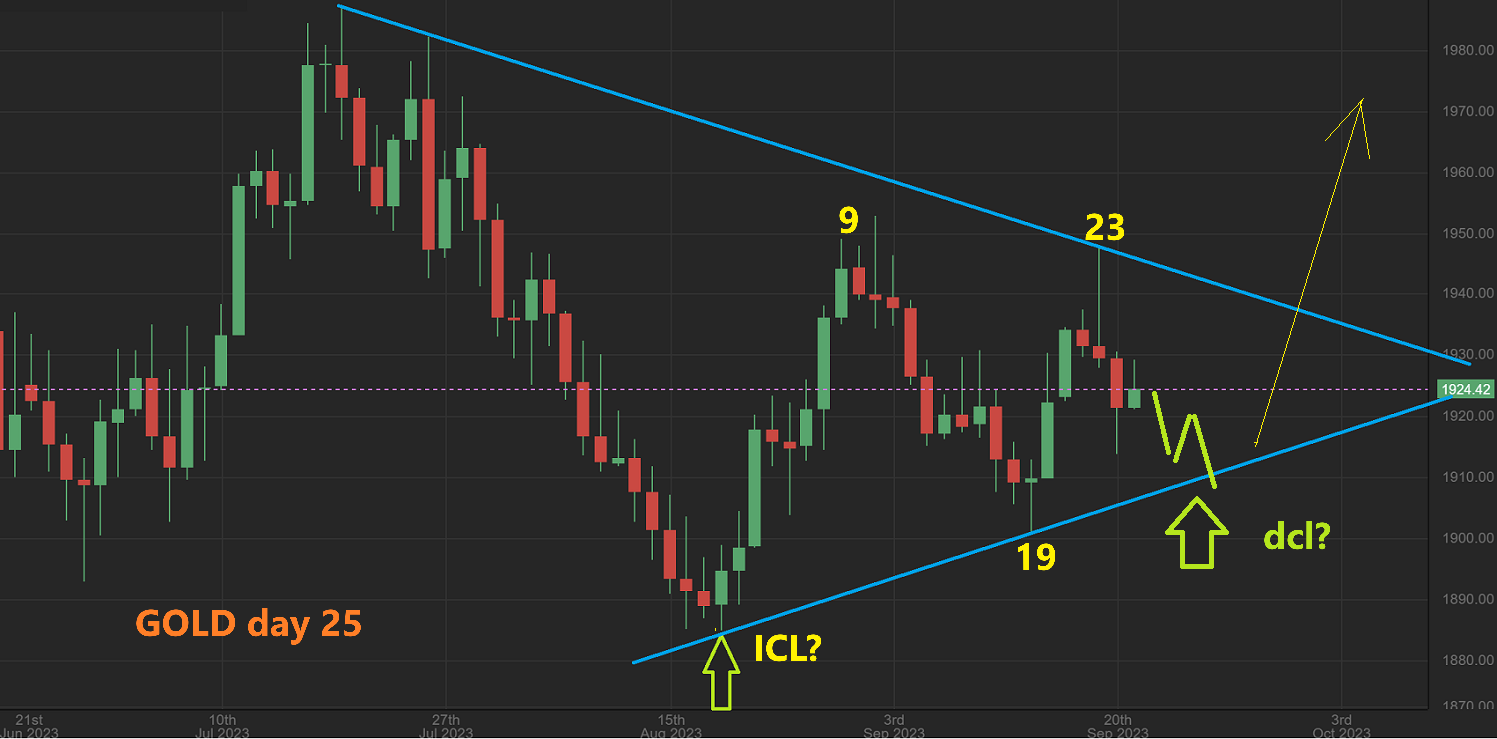
GOLD DAILY – We are on day 26 Monday, so the daily could
1. Give us that higher low if that ICL is already in place with a triangle forming. That would be 6 months after the March ICL. I know that this is L.T. and day 23 didn’t ‘peak’, but Triangles can do that. We also might…
2. Gold might break to a new low and give us an ICL 7 months after that march ICL, but time is running out for the cycles to form an ICL. This is great news.
GOLD DAILY – SO 2 DAILY CHARTS FOR GOLDS NEXT POSSIBLE MOVE WOULD BE :
1. Gold could push higher in this daily cycle and give us a peak and then a drop into a dcl. This is less likely since we are on day 26 Monday, but it could happen if the USD drops.
GOLDS NEXT POSSIBLE MOVE #2
Gold has the lowest low in August 5 months after March. It seems likely that it could drop to undercut that low and give us an ICL 7 months after March (early Oct). Either way, an ICL is in place over overdue, and that is VERY GOOD NEWS.
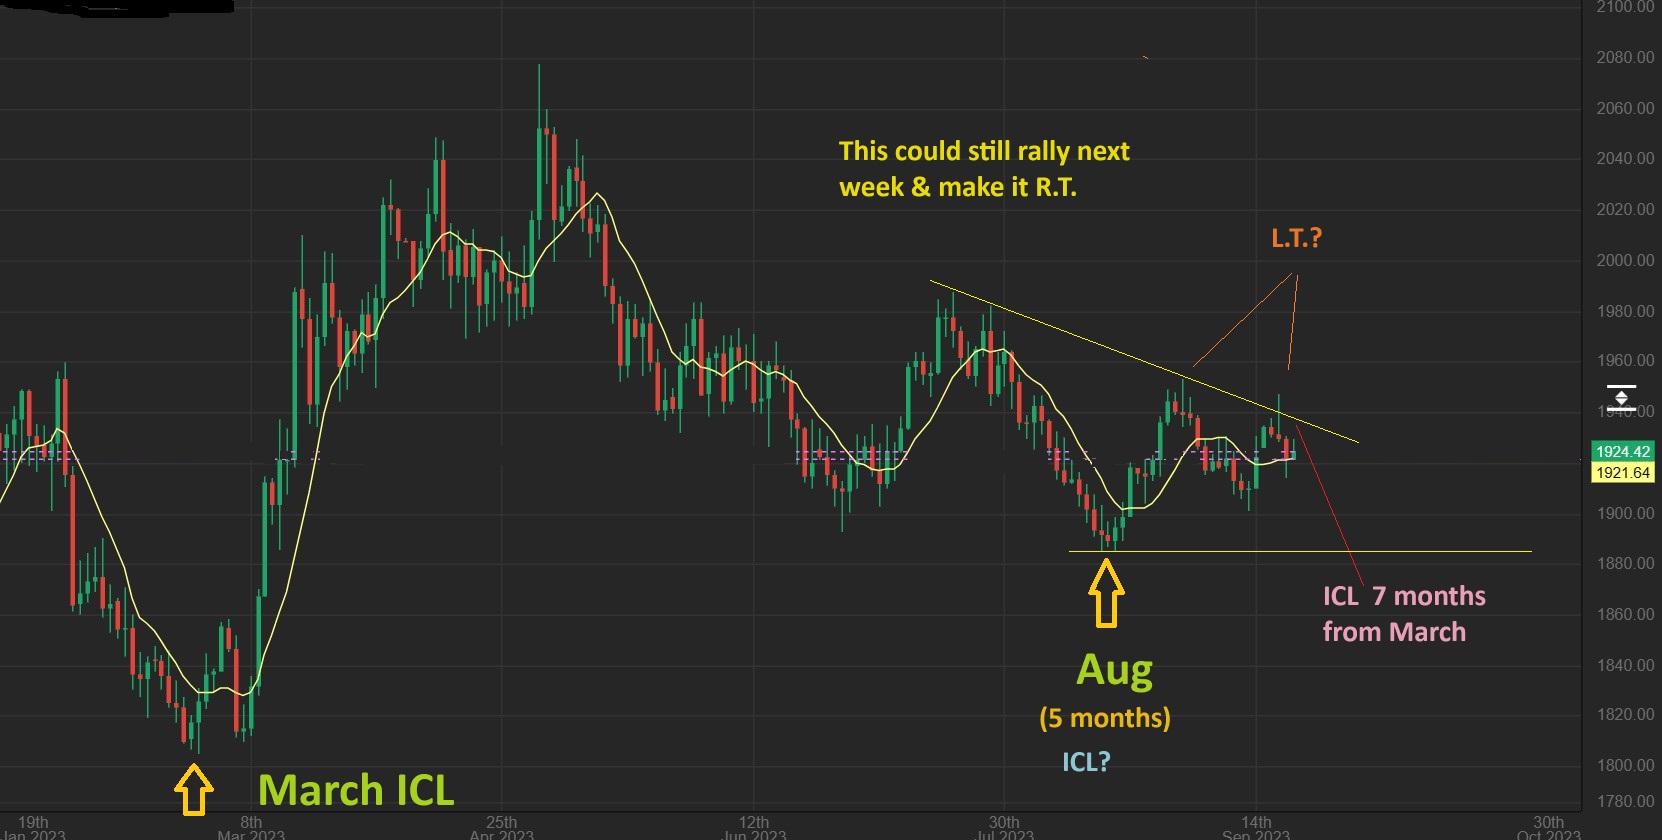
GOLD WEEKLY – We could see this as an ICL forming 7 months from March ICL. Normal 5 waves do not have a long 1 and 2 short waves for 3 & 5 , so it really makes me wonder about an ICL already in place and a triangle in Gold has formed…

.
It really makes me wonder about an ICL having already been put in place. A ‘tringle formation’ in Gold may just be giving it that L.T. look, but Gold can have a first daily cycle as a triangle that bottoms higher soon & breaks out higher for the 2nd daily cycle. Some Miners look to have bottomed too, like HMY, ASI, KGC, etc, but they are choppy.
.
So Gold is a bit unclear with Cycles, because it has 2 possible scenarios, but the good news is that either one has an ICL in place now at 5 month and some Miners did bottom, or an ICL that is becoming overdue at 7 months. Either case leads to an end of the year rally.
.
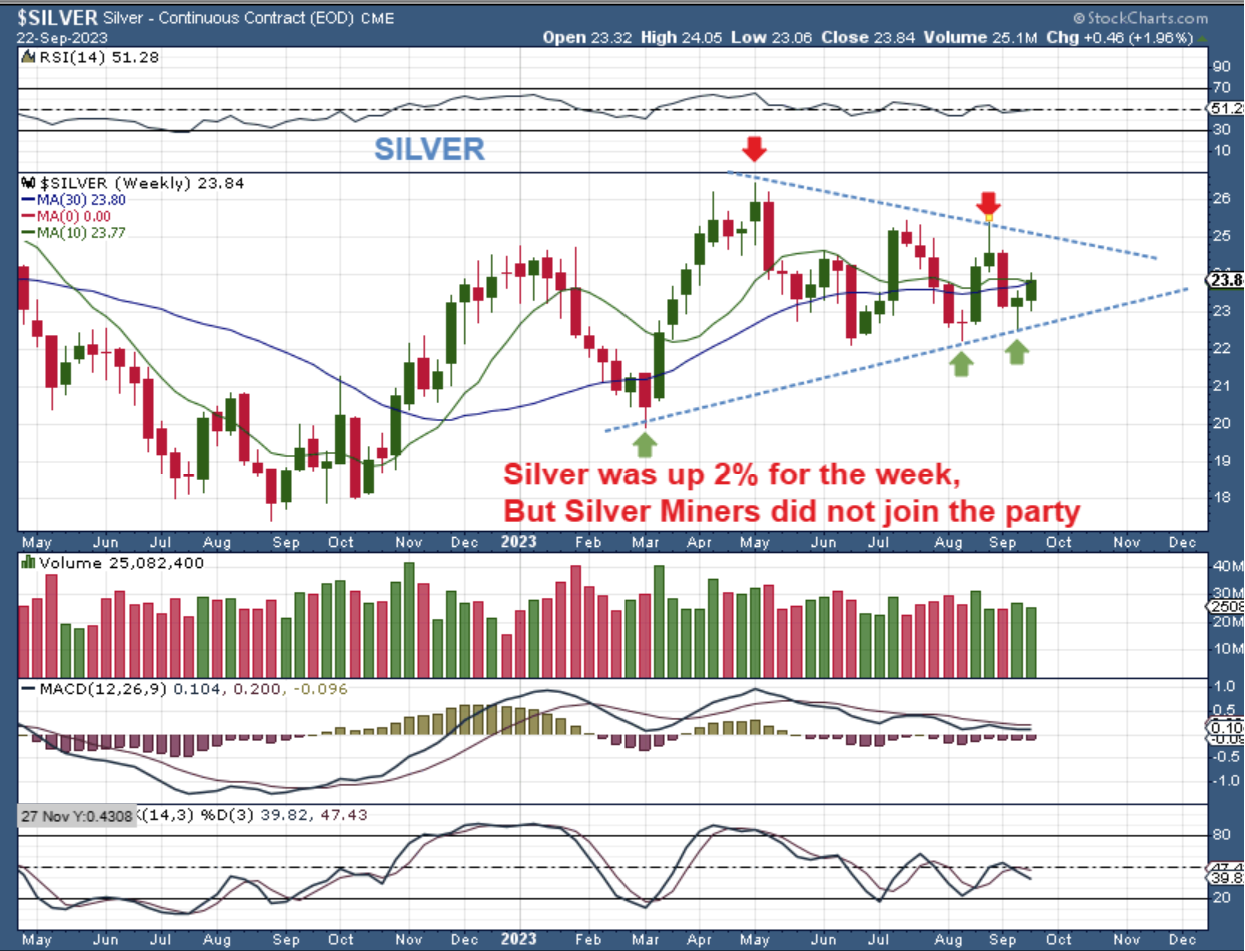
SILVER WEEKLY – Silver has been strong, but it is basically just chopping sideways too. This is actually good news, when you think about the USD rising up 10 Weeks in a row. Silver has ignored the USD.
.
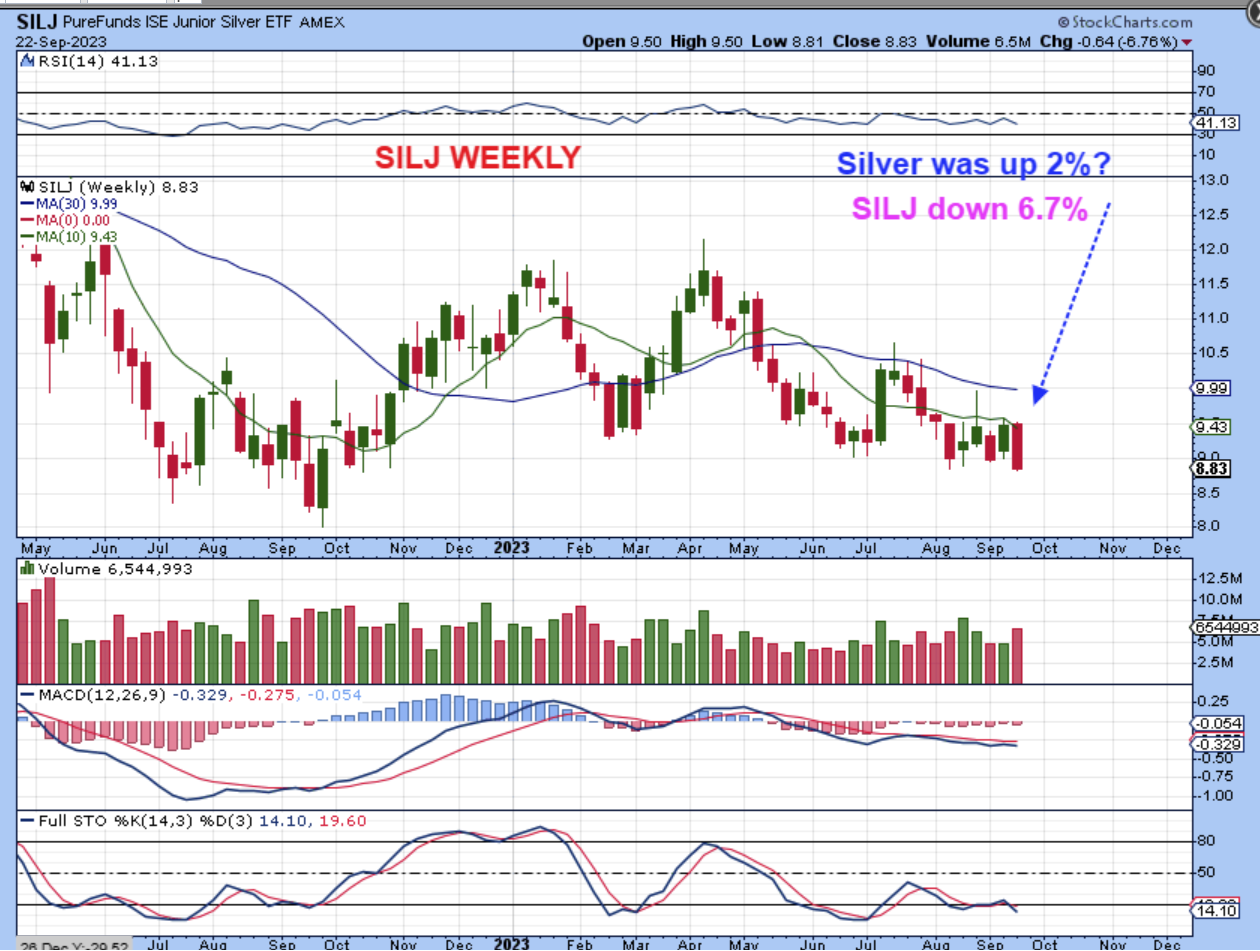
SILJ WEEKLY – ARE SILVER STOCKS EXPECTING SILVER TO DROP INTO AN ICL?? MAYBE. SILJ hit a new low on Friday, giving us this ugly weekly chart for Silver stocks. Silver didn’t look bad though.
.
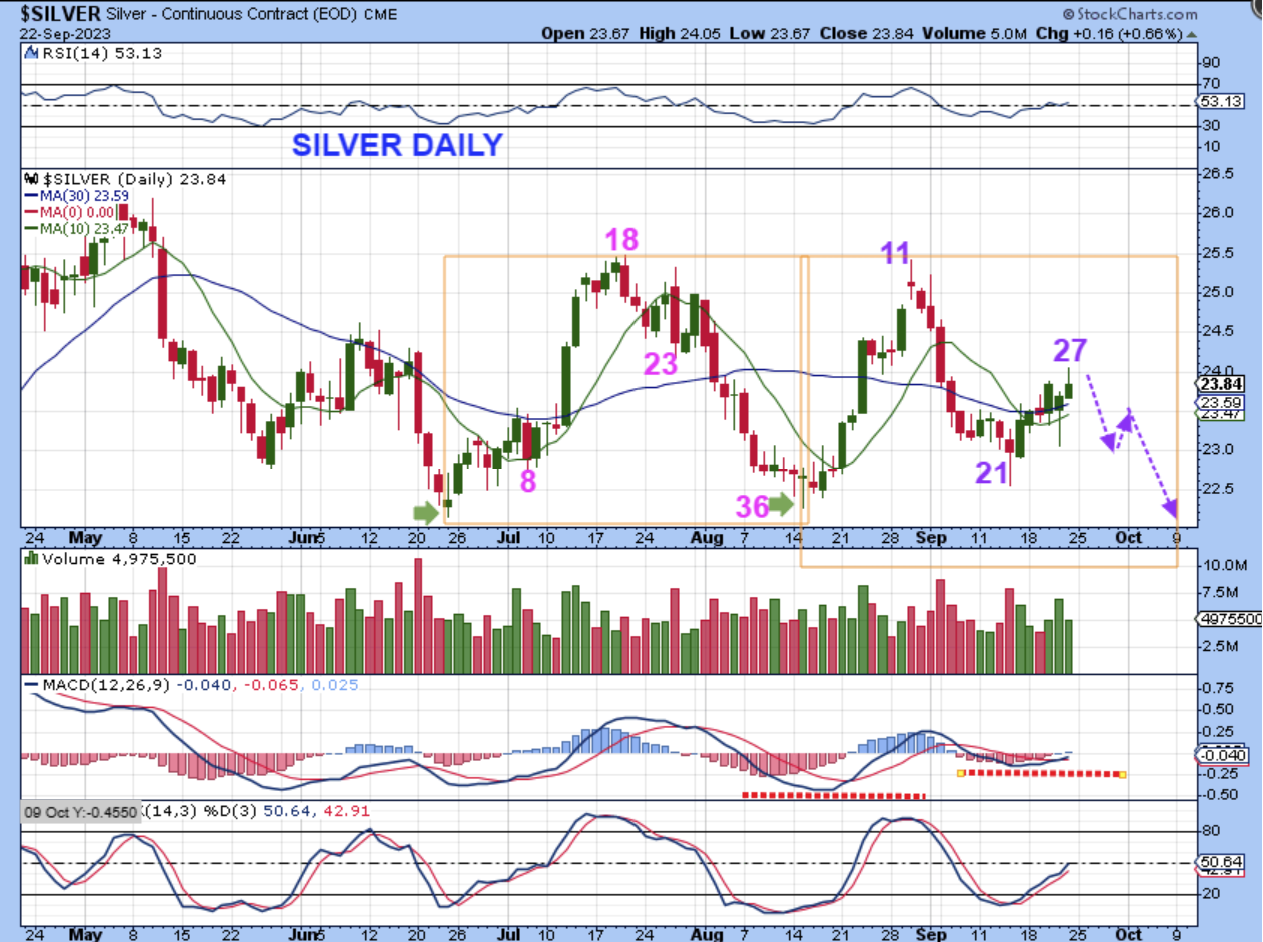
LET’S TAKE A LOOK AT SILVER DAILY CYCLE COUNTS –
1. Silver looks like it has a first daily cycle that was 36 days long, peaked at day 18, and almost touched the August lows but did not break them. That may not be a first daily cycle though, when you look at the current one.
2. We are currently on day 27, but we have a peak on day 11. I would expect Silver to break that high if this was a 2nd daily cycle, right? But Silver stocks look very weak, with many still at the lows. So we either rally to new highs in a 2nd daily cycle or we certainly have time to drop into a lower and break that day 36 low from August and THAT would be the real ICL.
.
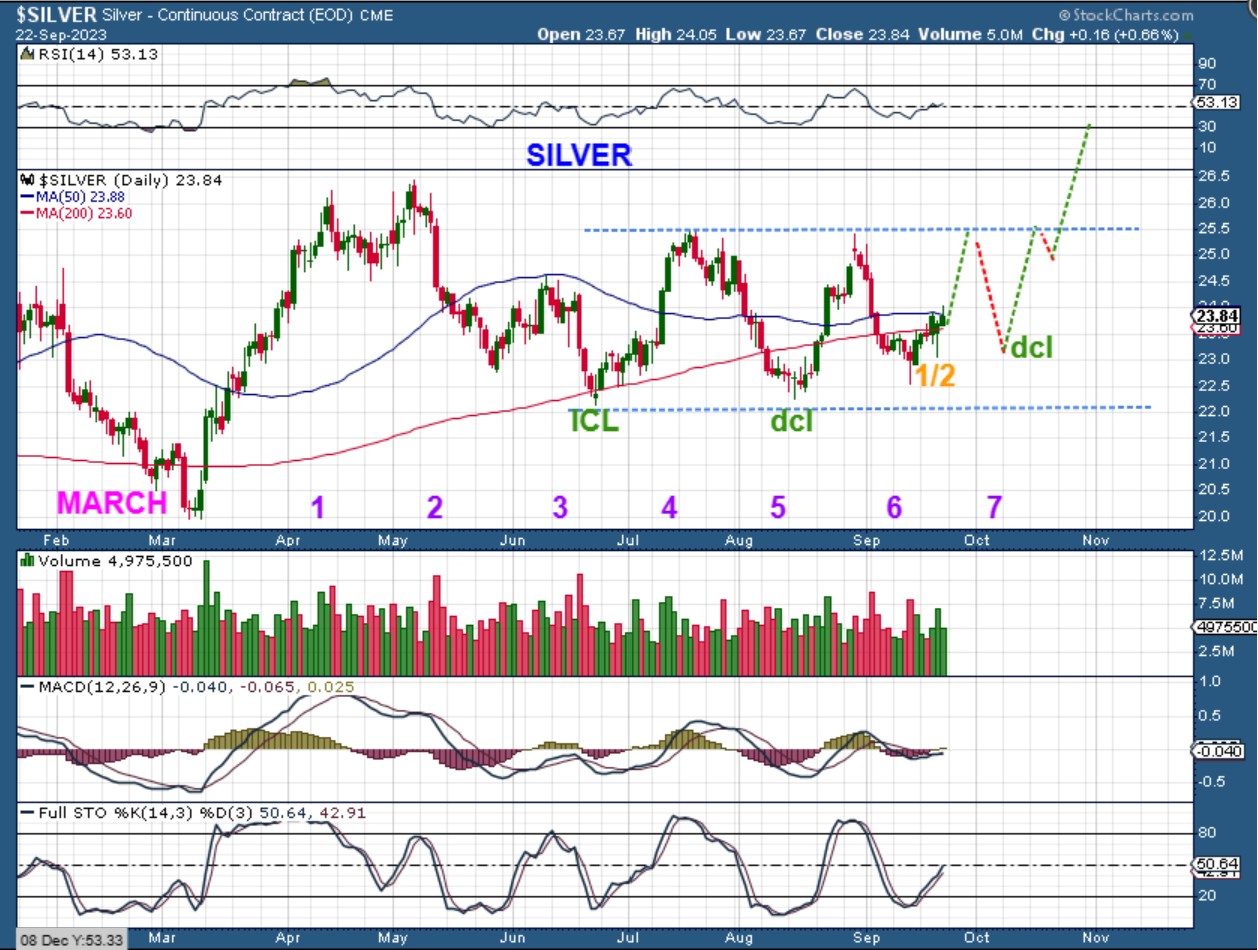
This is a VERY choppy bottom, much like we saw in Oil until it finally broke out higher. Is the ICL ahead , 7 months forward from the March ICL? This does seem likely despite the fact that June lows have not been broken yet. The other idea was…
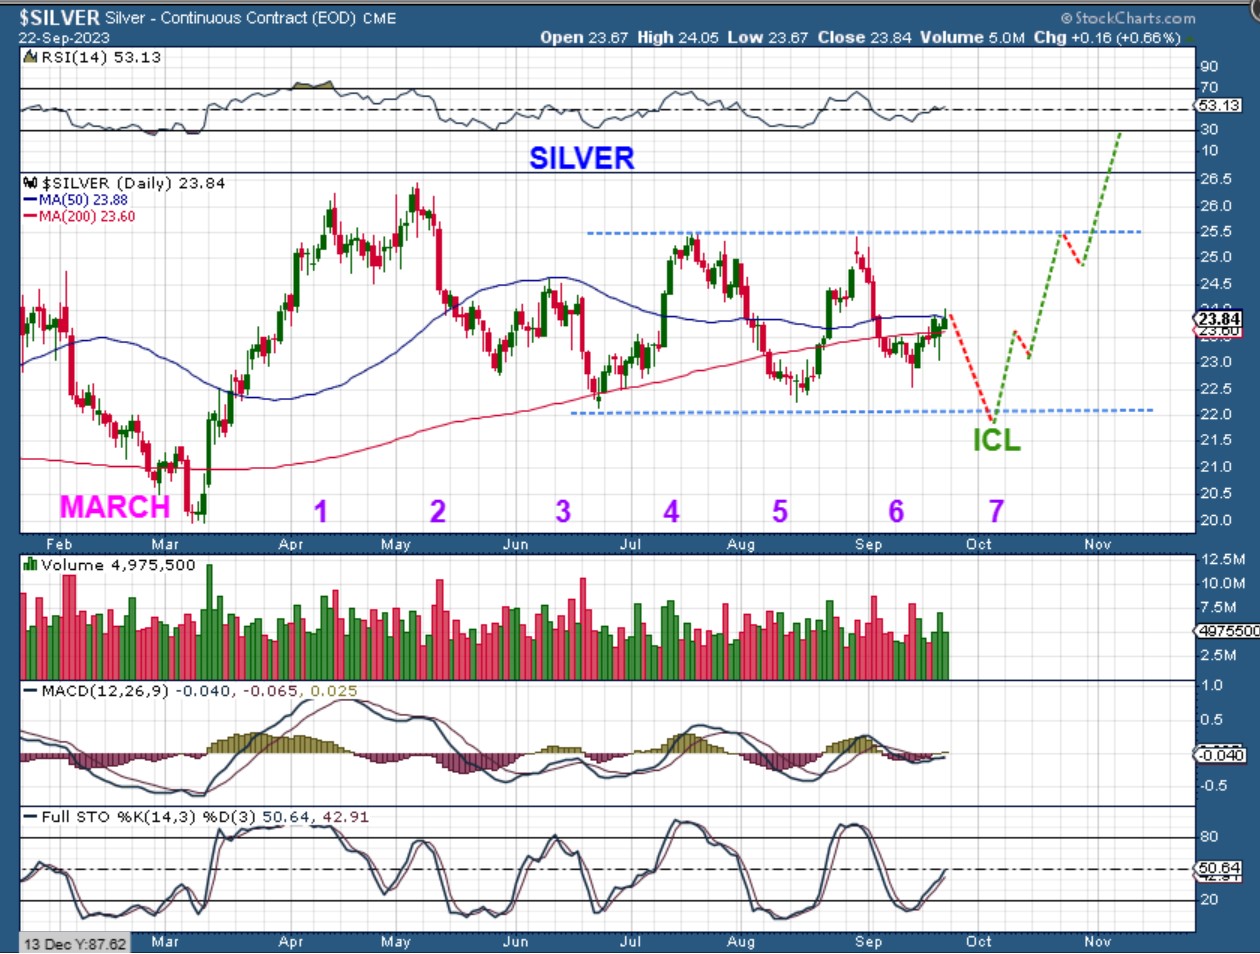
The other idea was that the June lows are still the lowest low and we just keep making higher lows until it finally breaks out. THIS is why I use GOLD to look at Cycle counts above the idea of using Silver or the Miners. They can overextend or undercut at times and it seems to make the counts unclear until later. Gold is more reliable.
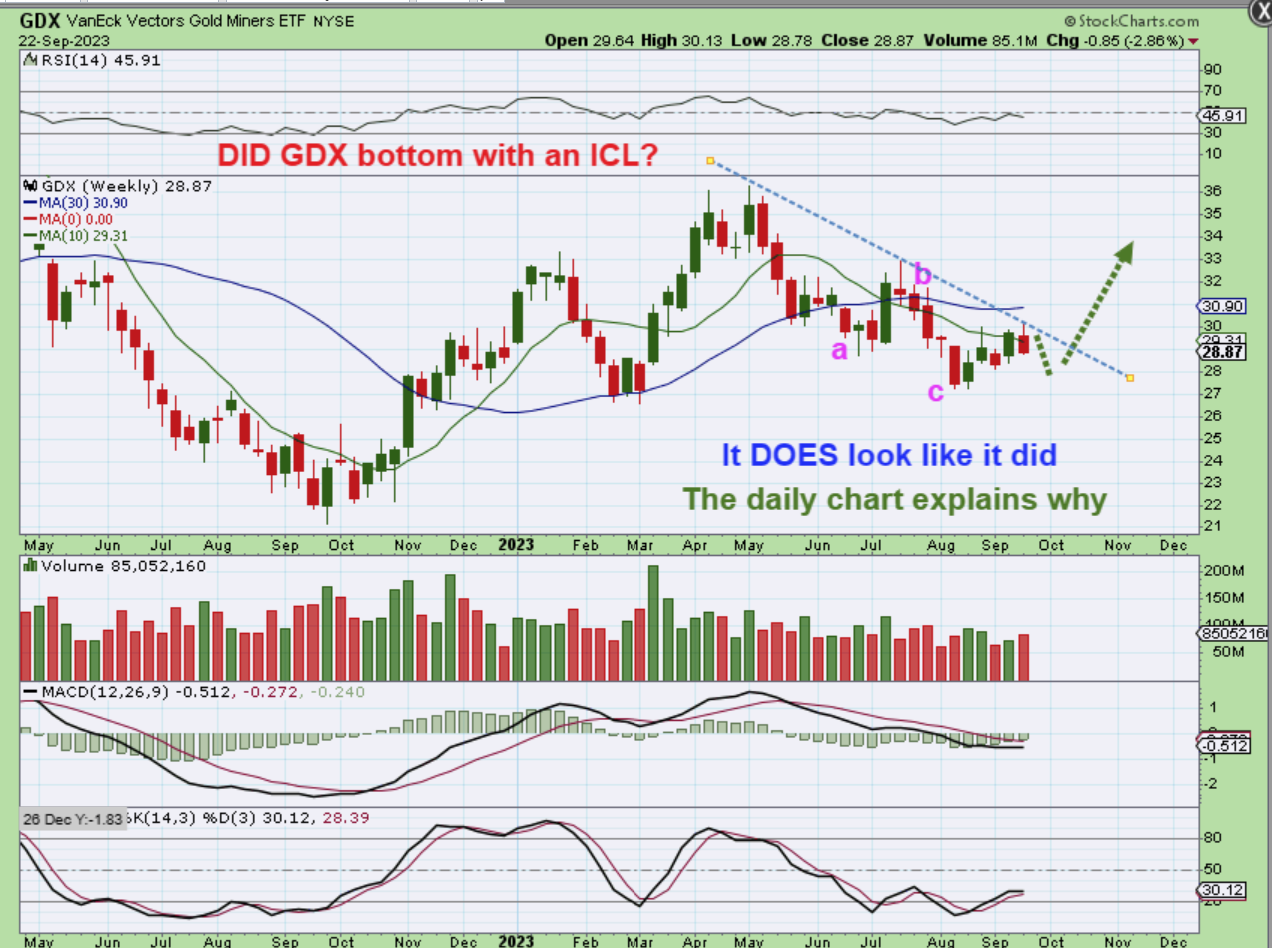
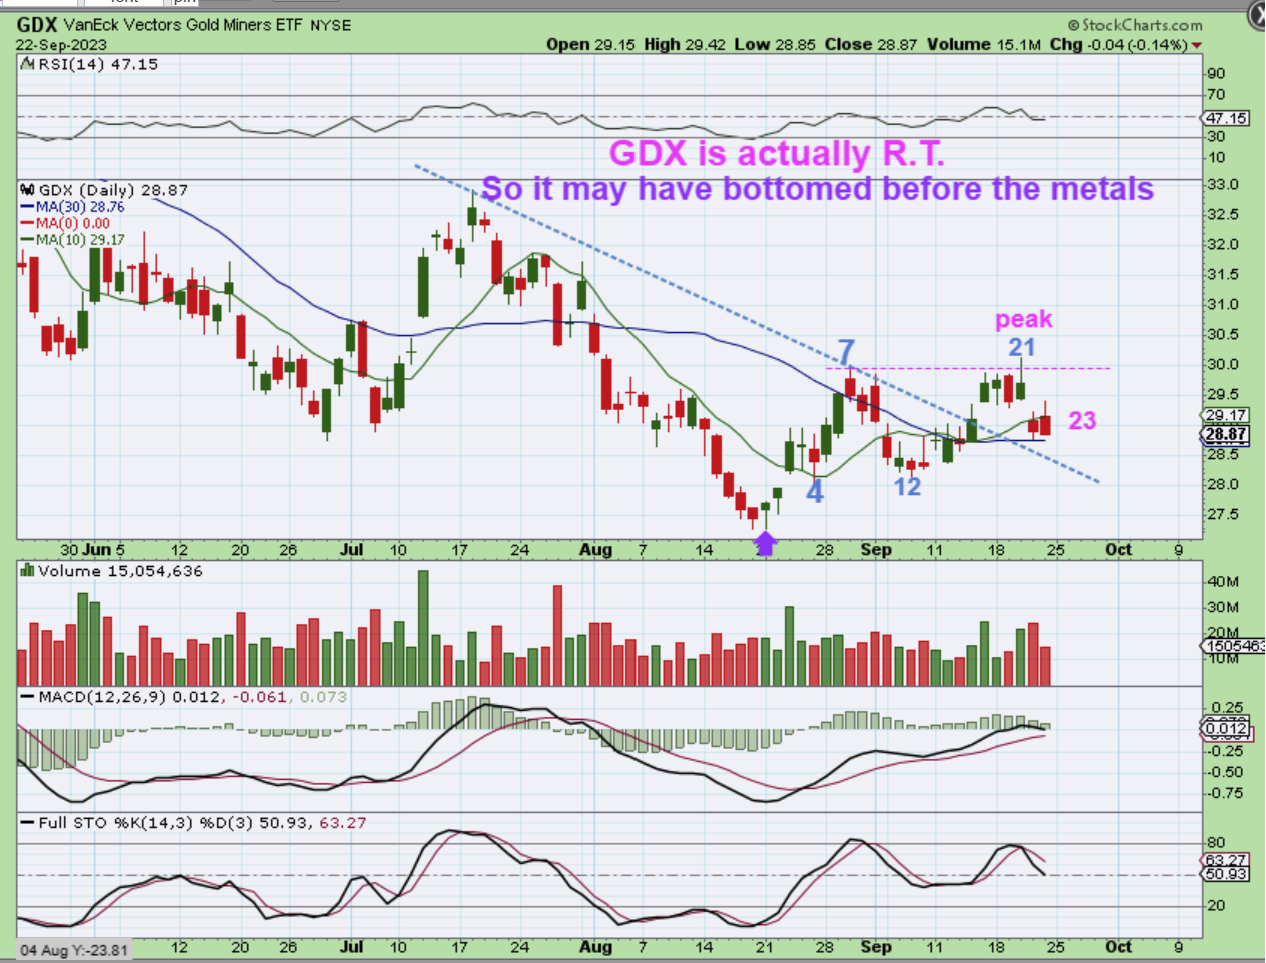
GDX WEEKLY – GDX did have an A-B-C low that could have been an ICL. So far it has run up to the downtrend line and pulled back a bit. I expect a pull back with that rejection at the trendline, but I also think that it would help to look at the daily chart too.
.
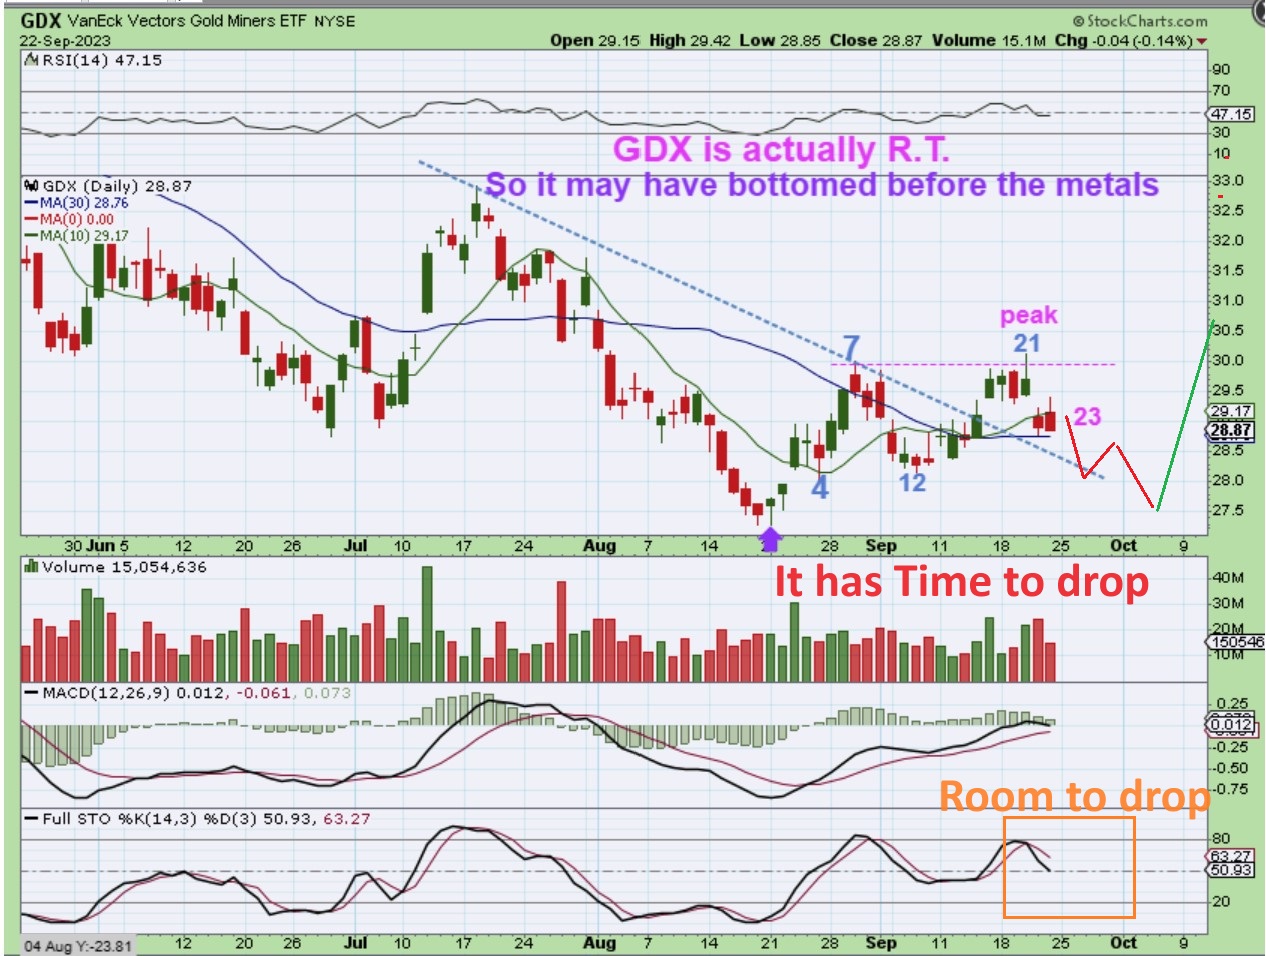
GDX DAILY – You may recall when I said that Miners began to lead the metals. Well, GDX has a day 21 peak, so it is actually a right translated daily cycle. This indicates that an ICL could have formed with that a-b-c drop in the Above weekly chart. If so, then even if we drop, we should not break the August lows, we should get a higher low with this day 21 peak. That also indicates that Miners may have bottomed ahead of Gold & Silver, and this is just a very choppy first daily cycle while it waits for Gold to ICL. So…
.
Miners may have bottomed ahead of Gold & Silver, but they should still drop to a higher low into a dcl. Why? We have that higher high giving us a ‘peak’ on day 21 and this should be right translated. It also broke the downtrend line and may back test it. You may recall that at one point I mentioned that Miners were leading the way higher. So an lows or ‘ICL’ may be in place for GDX. We may see GDX climb down that trendline with more choppy trading. This could form a double bottom into October with a higher low as a choppy first daily cycle.
.
So the General Markets look ready to continue lower in their ICL. That will be a BUY THE DIP scenario and should lead to weeks of upside. The USD has been very strong, but my be ready to pull back soon. That could bottom the General Markets and Gold. Gold, Silver and Miners are a little unclear. It looks like Gold is in a triangle and bottomed in August. If the USD drop, then Gold could break out of that triangle. If the USD chops at the highs, Gold is on day 26 and could drop into an ICL 7 months ahead of the March ICL. Silver looks fairly strong, Miners look to have bottomed, but silver miners are weak. We do have a mixed picture that will clear up over time. ANY SCENARIO still points to a year end rally for gold. I have more below, enjoy your weekend!
.
~ALEX
.
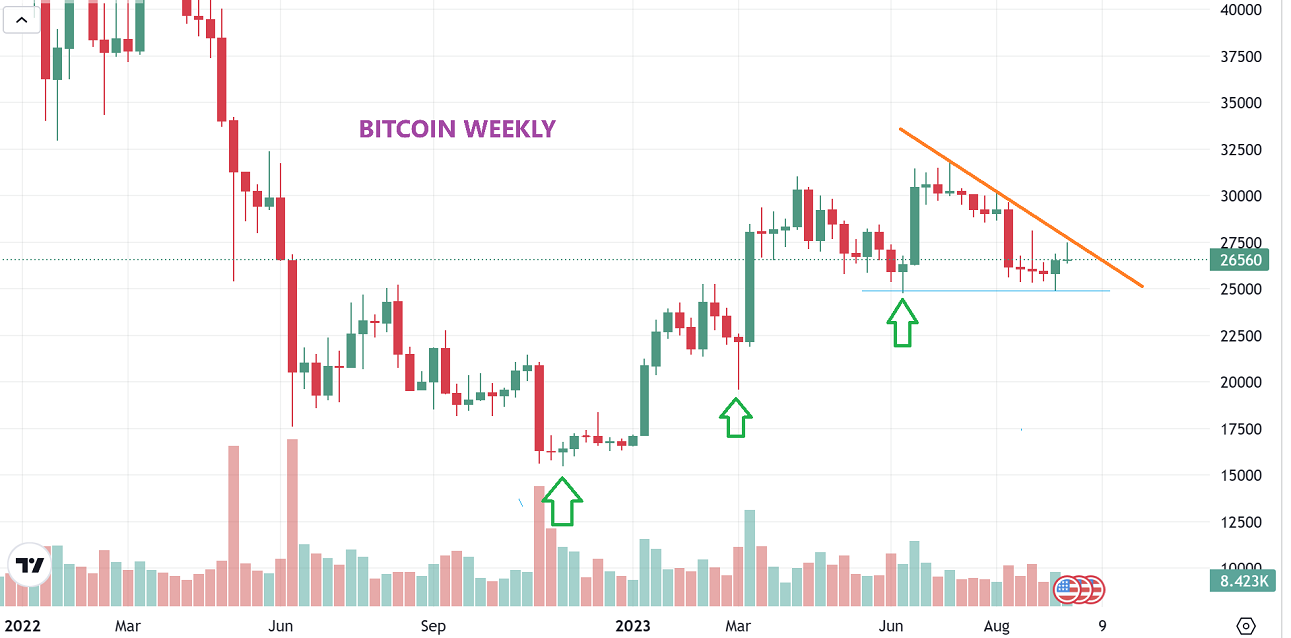
BITCOIN WEEKLY – Crypto Stocks are at new recent lows and did not buy into the bounce in Bitcoin. Bitcoin needs time in my opinion, unless it can break out soon.
,
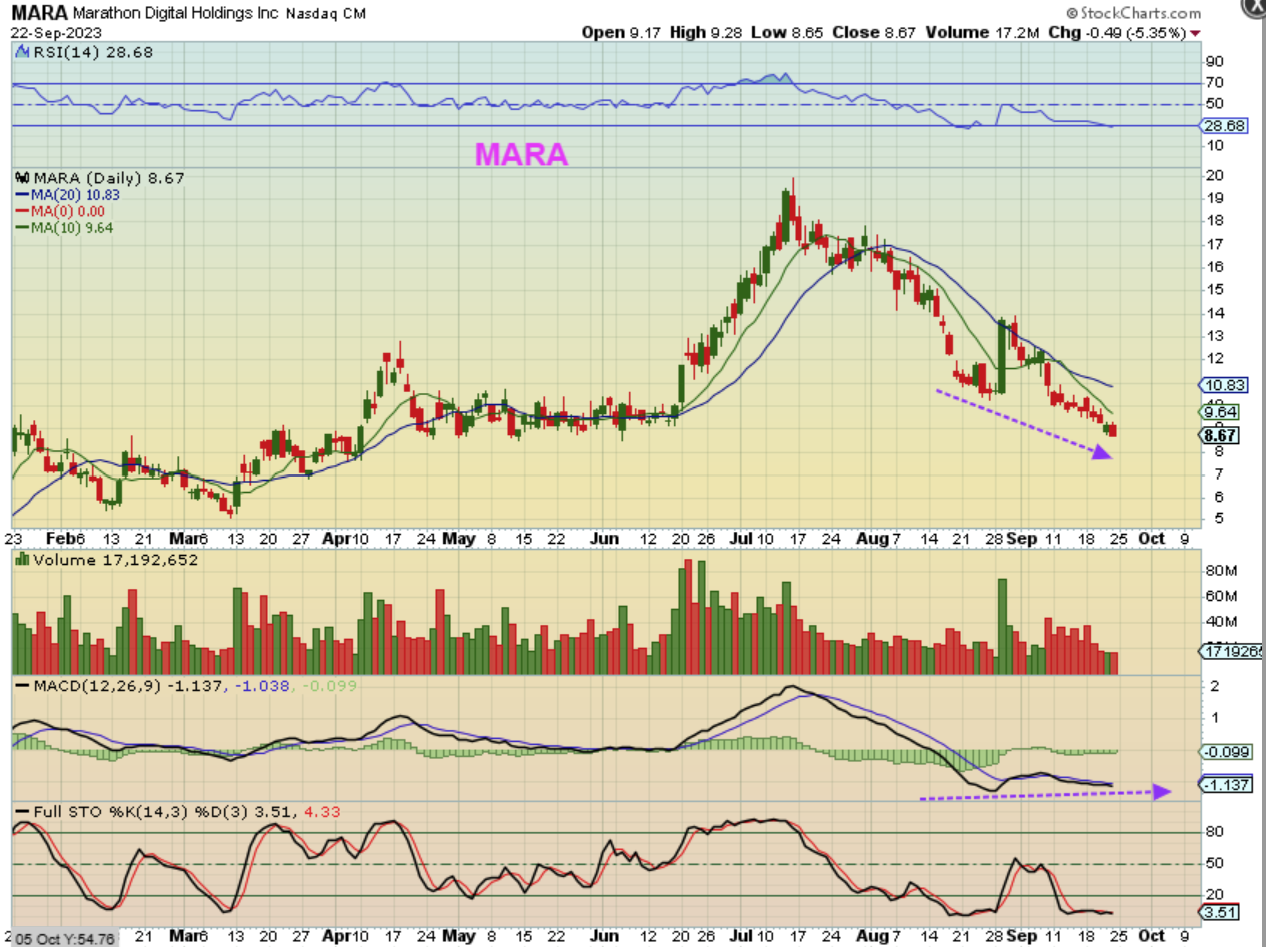
MARA DAILY – MARA & RIOT are at new lows, but there is divergence so a bounce may be coming. Is it a final low? That is very hard to tell, but buying with a stop could be an option WHEN THE TURN STARTS TO UNFOLD.
.
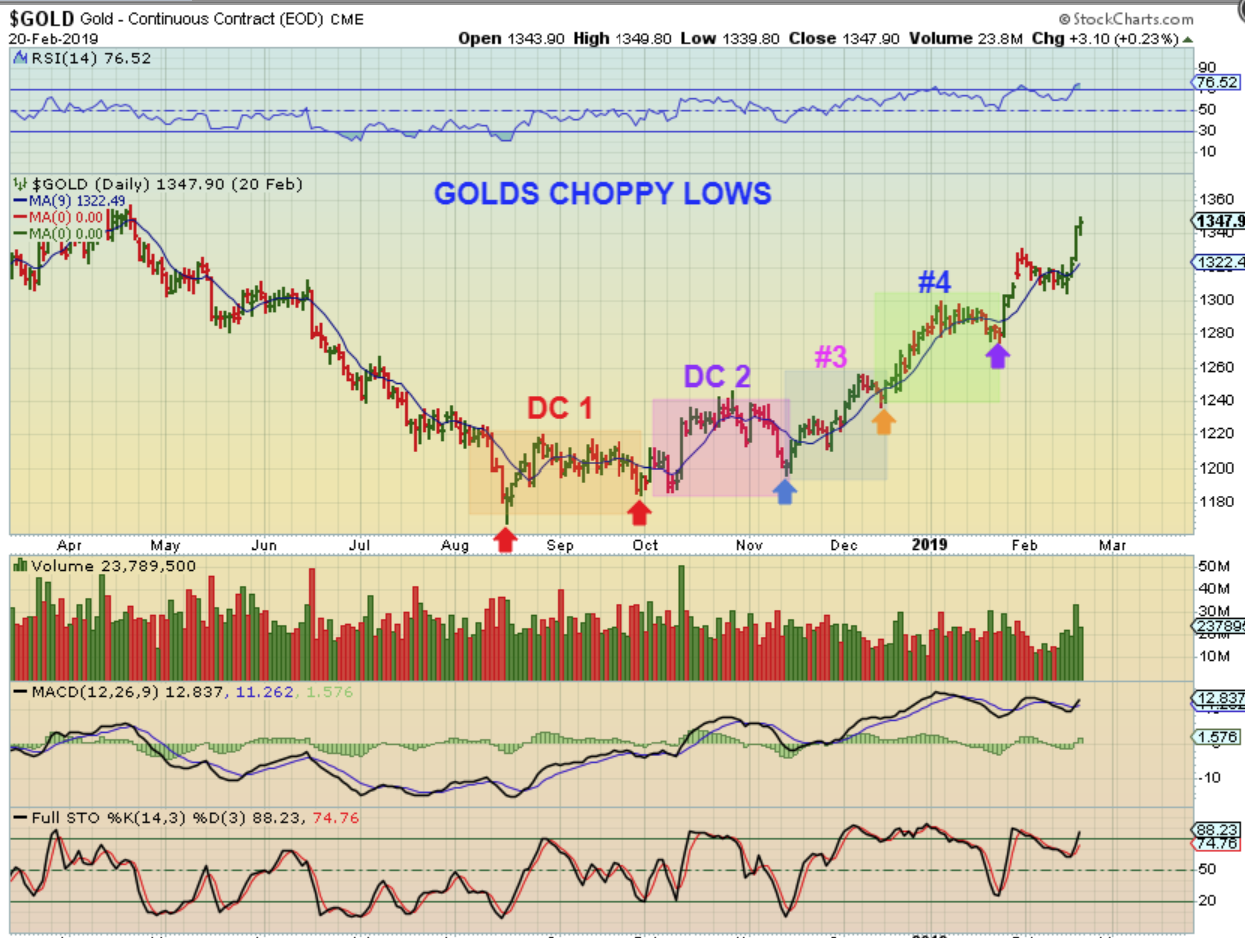
I WANT TO SHOW YOU WHAT I TOLD YOU ABOUT LAST WEEK. I SAID THAT I HAVE SEEN VERY CHOPPY BOTTOMIMNG PROCESSES IN GOLD & MINERS. SOMEONE WROTE IN AND ASKED IF I COULD EXPLAIN THAT MORE, SO WHY DON’T I SHOW YOU THAT HERE.
.
There was a strong rally in 2018 into 2019.
.
GOLD DAILY CHOPPY BOTTOM – This is similar to now. Gold bottomed in August 2018, but we still didn’t know if we would get one more drop to an ICL in October or not, because it was choppy and headed back to the lows.
1. We got a higher low in October rallied up, but guess what? Take a look and you’ll see that it sold off too.
2. We then got a higher low in November, but price had dropped sharply into that 2nd dcl and Gold looked Horrible! The first and 2nd daily cycles both dropped sharply into their dcl, but this turned into a very strong year end rally that went right into 2019.
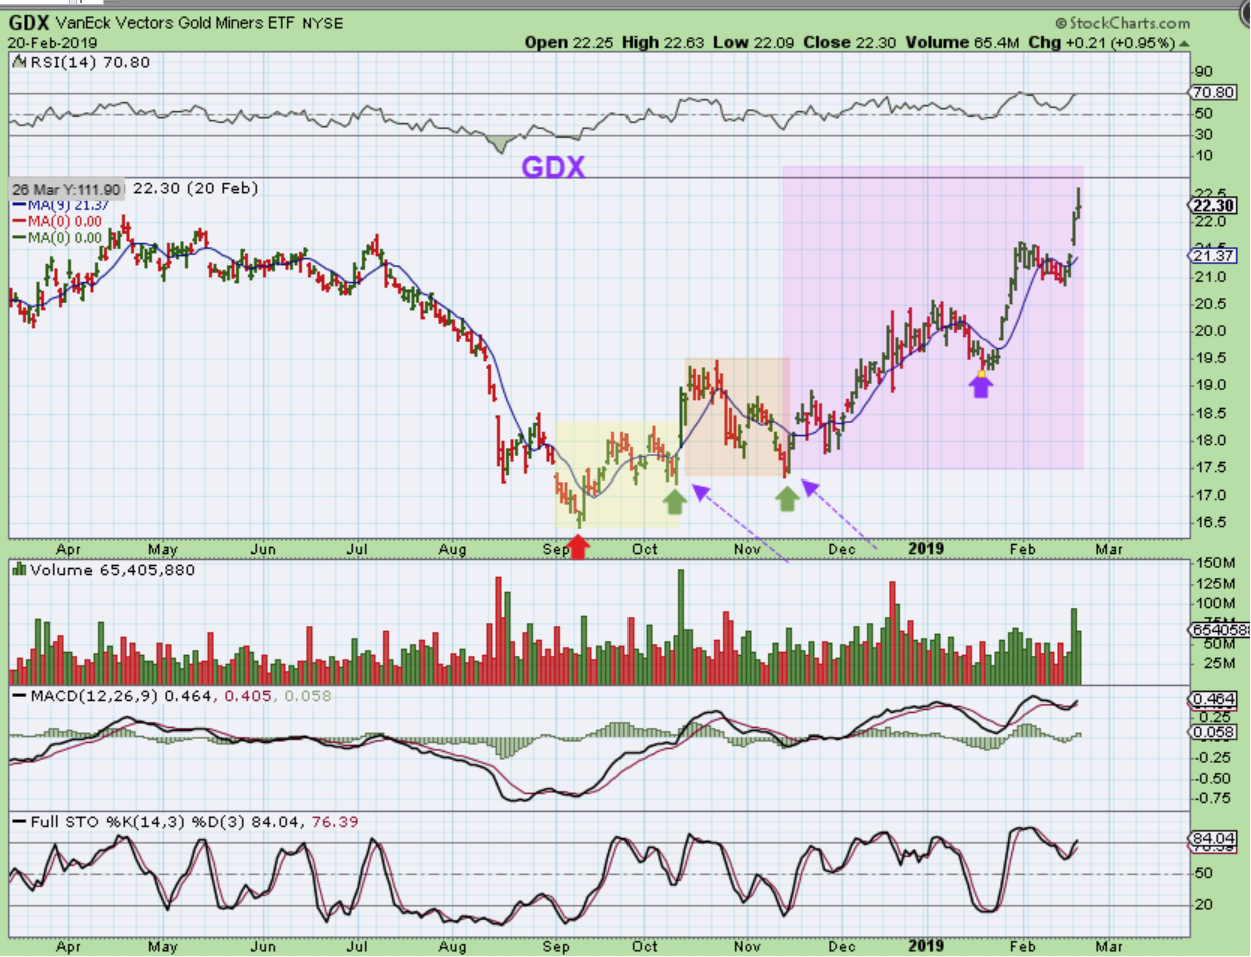
3. THIS BOTTOMING PROCESS is why we cannot let the current chop near the lows scare us. We need to see the bigger picture. GDX is next…
GDX Crashed into that Aug Bottom, bounced, and broke to new lows in September , even though Gold didnt. That was The Bottom though. There was a strong rally in 2018 into 2019, but notice how it started out choppy in September to October to November. In November it crashed and ALMOST took out the first dcl, but then Miners rallied higher into year end and into 2019.