Thursday September 28th – Waiting For That Bottom
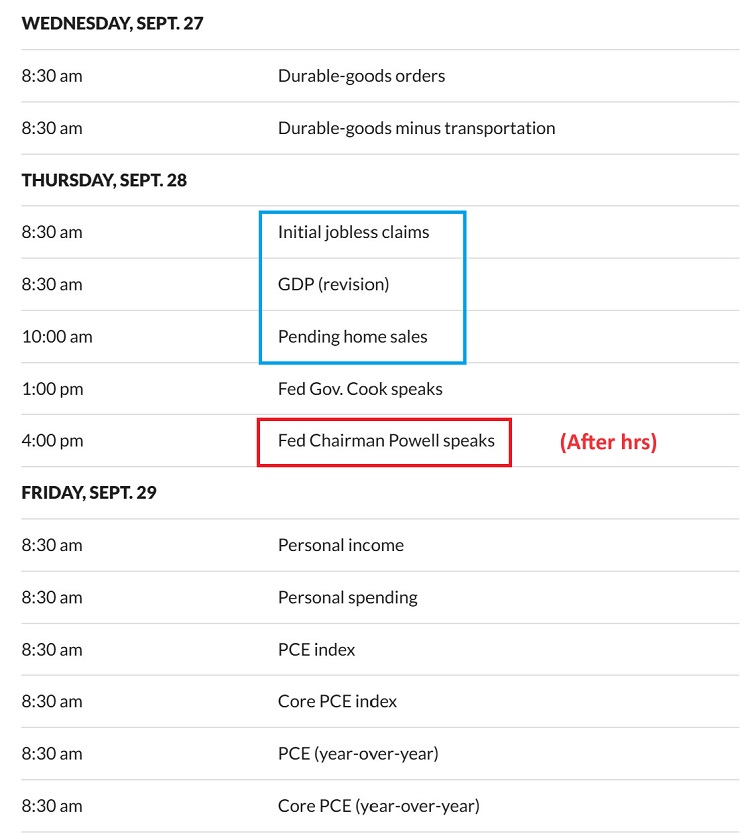
Today is Thursday and the Data being released today usually moves the markets one way or the other.
I saw a reversal candle in the The General Markets, so if it has follow through and pushes higher, I still think that it could just be a bounce ( and The Fed speaks after the markets close today). The cycle count is still a little short for a dcl lately, but Gold is pretty close to dcl zone, so let’s take a look.
.
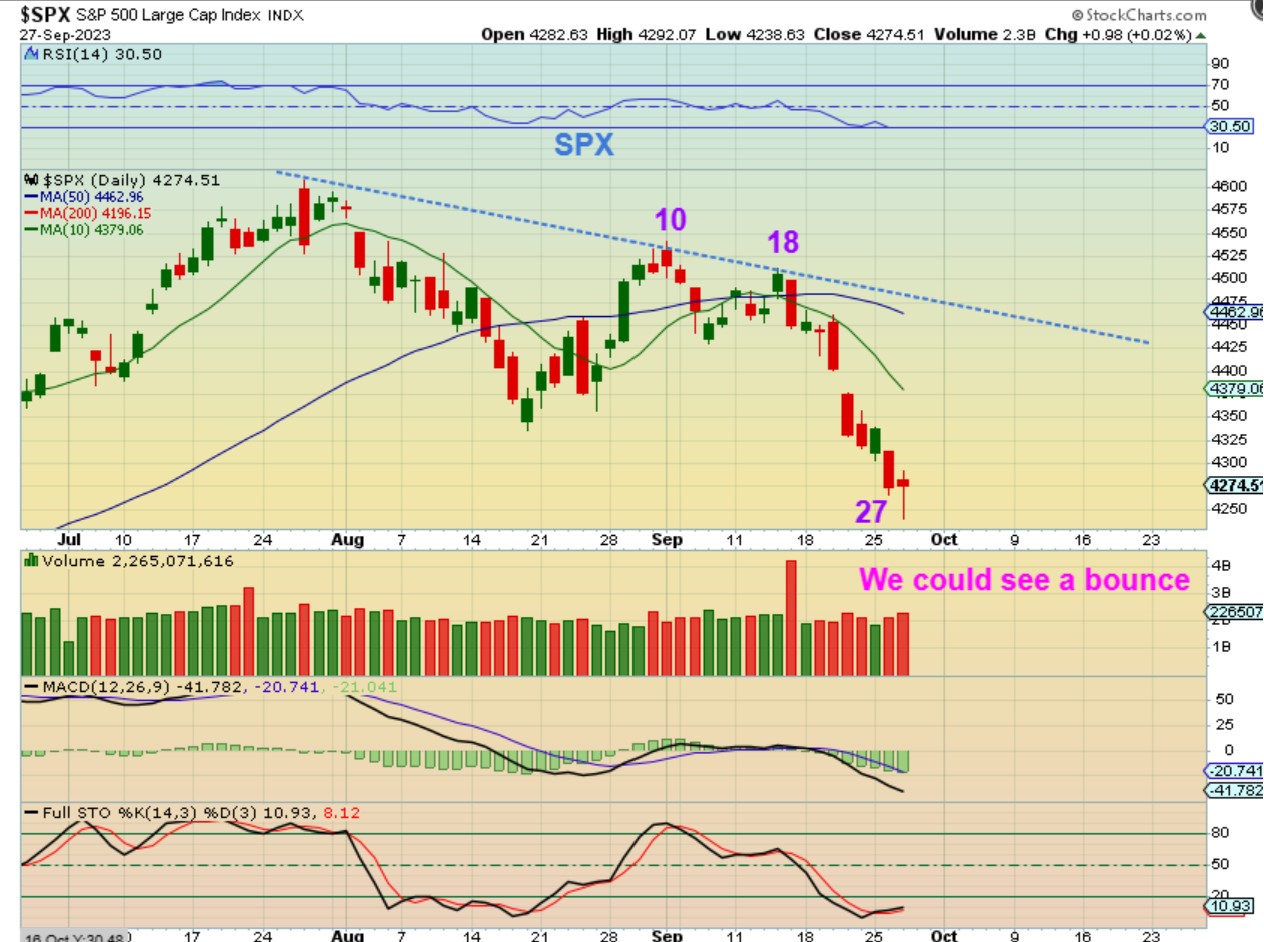
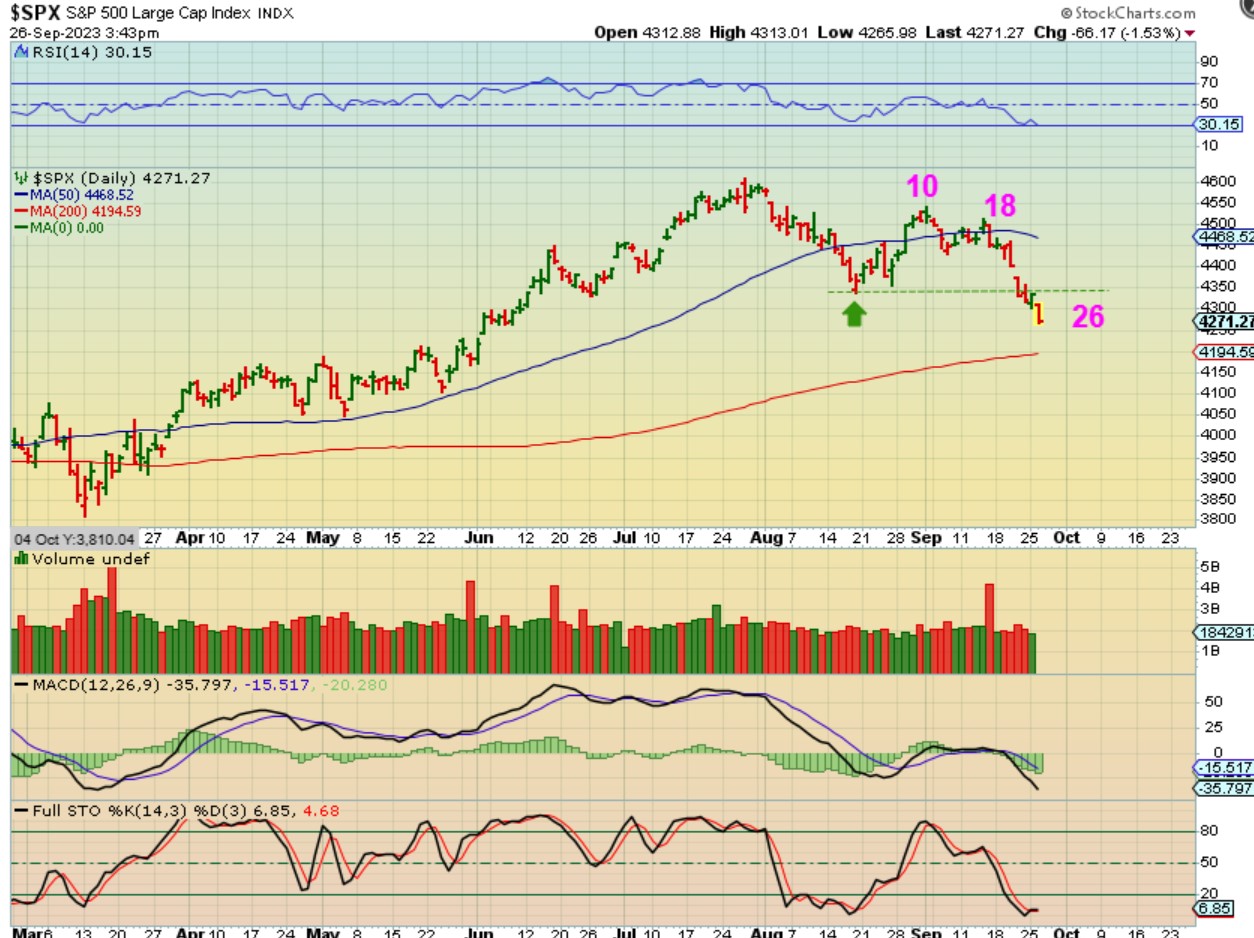
The SPX moved higher after the open on Wednesday, and then it sold off quite a bit midday, but it rallied into the close and gave us a reversal candle. COULD THIS be a DCL? It is possible, but I seriously doubt it. Day 27 is quite short and we even have had a couple of ‘day 50’ dcls in 2023, so I tend to believe that we will see a bounce and then a move to lower lows. In recent reports…
.
In recent reports I have mentioned that a break below the 200sma is possible as a shake out for an ICL. This chart was from yesterday.
.
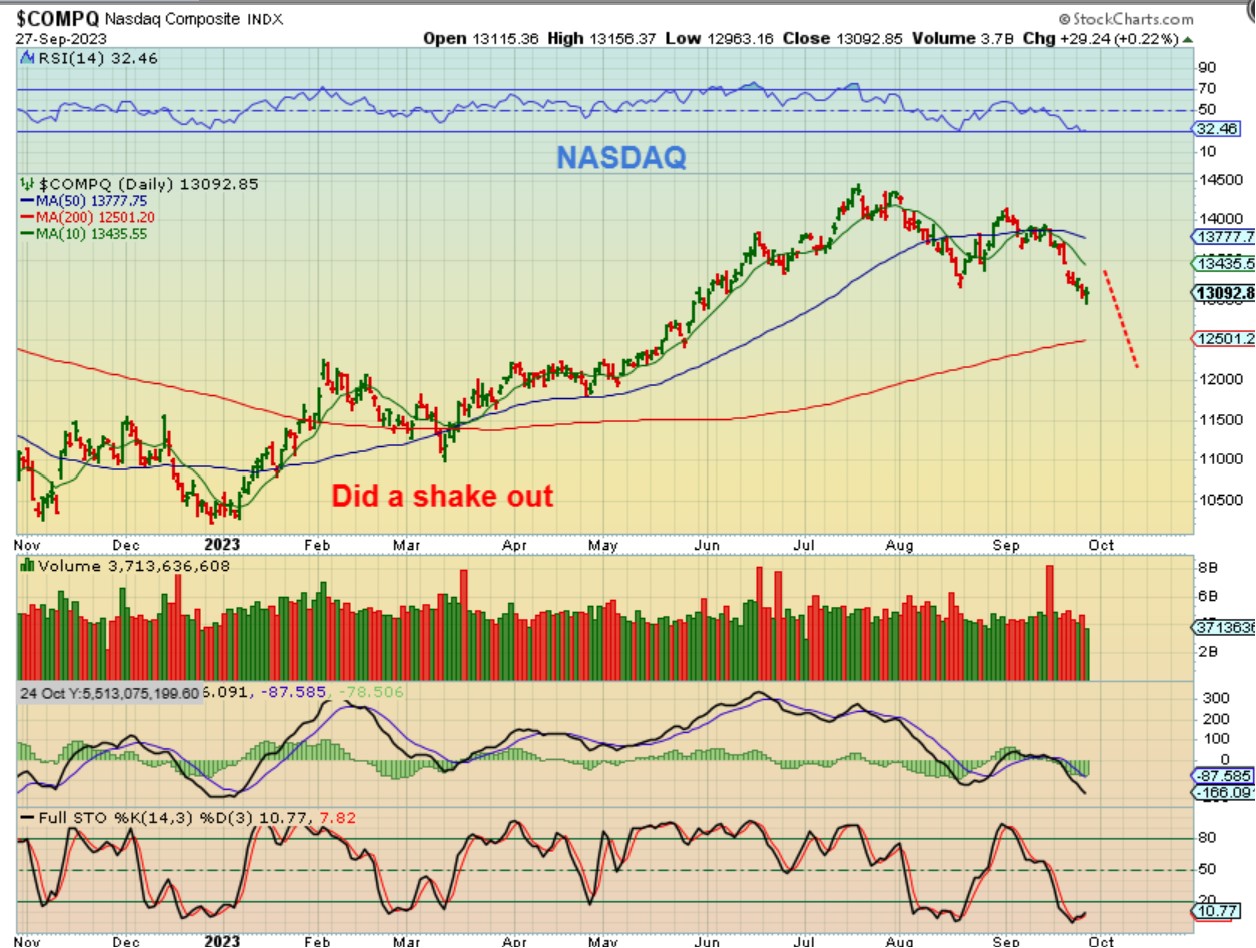
This is The NASDAQ and it also has a reversal candle and closed up 29 points. I am pointing out the shake out at the 200 sma at the March ICL.
.
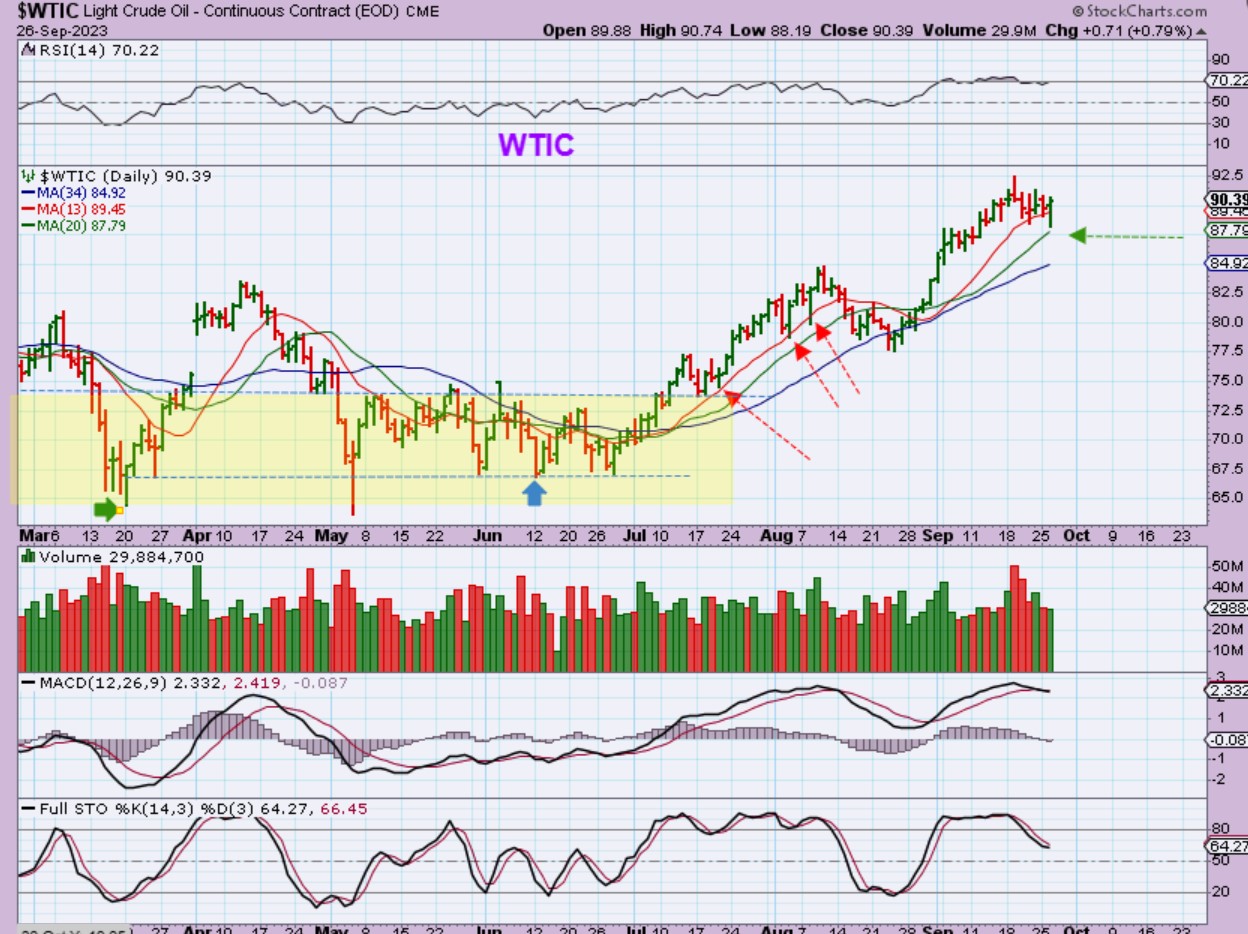
YESTERDAY I SAID:
WTIC – Oil has a pretty solid looking reversal at the 20 sma on Tuesday. It has been chopping sideways lately as a possible 1/2 cycle low.
.
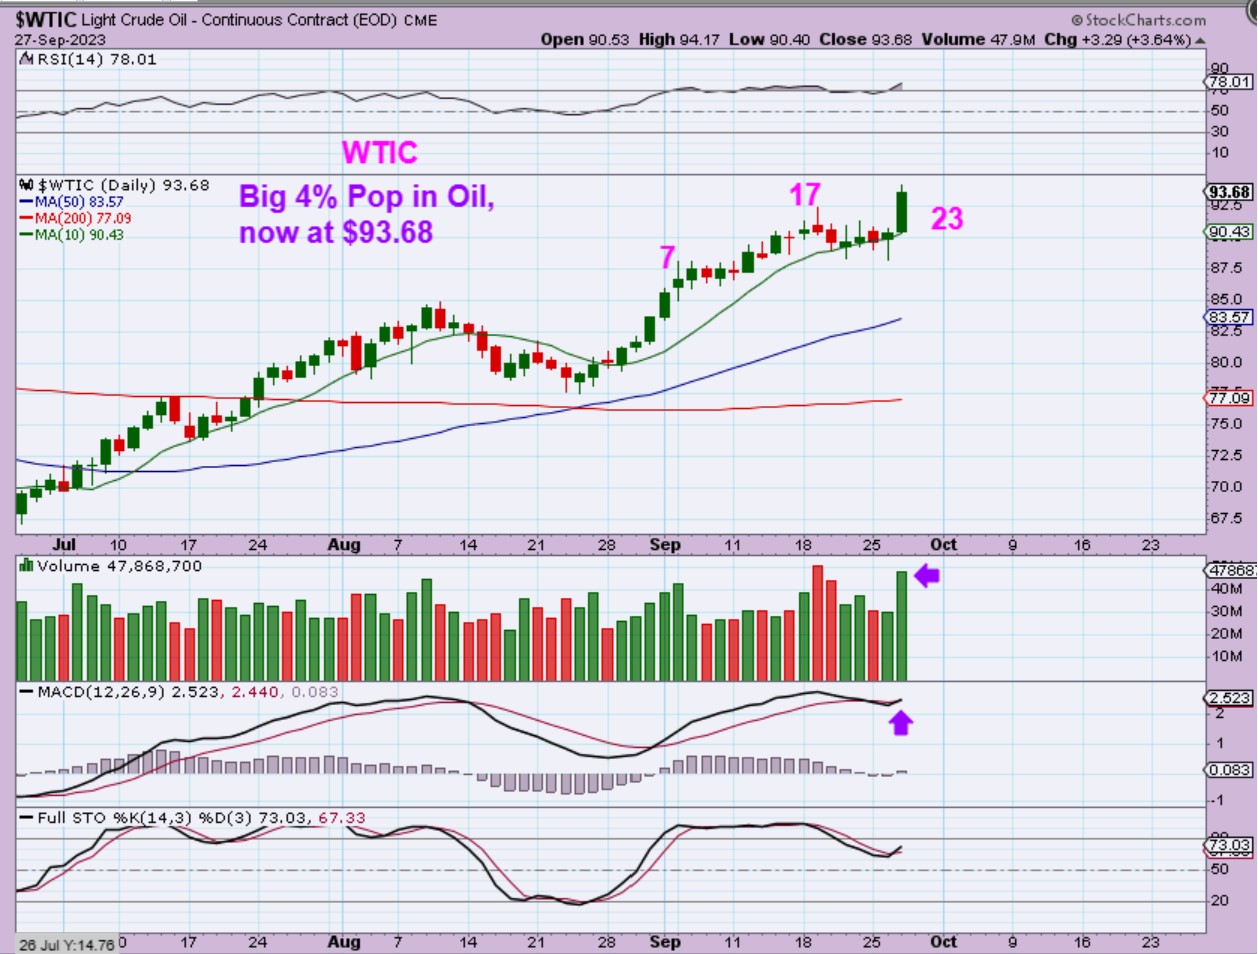
WTIC burst higher yesterday, with almost 4% gains! That is a big move and brought Oil up to $94 intraday.
.
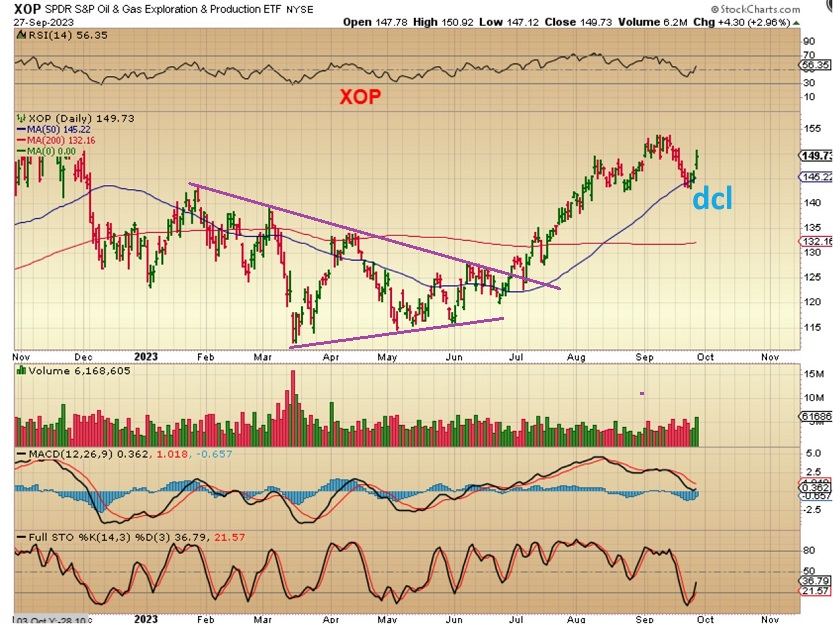
XOP The Oil Stocks had been dropping as Oil chopped sideways, and it looks like the XOP has now put in a dcl at the 50sma. This looks great, but as a cautionary note, Oil and the Oil Stocks have an ICL in place back in March, so this might be the daily cycle that peaks before we start to see a round top and a dip into the next ICL. Daily cycles with Oil can last 50 days and that extended Intermediate Cycles too. ICL to ICL can be 8 months to a year apart, but the ‘peak’ can come with this daily cycle.
.
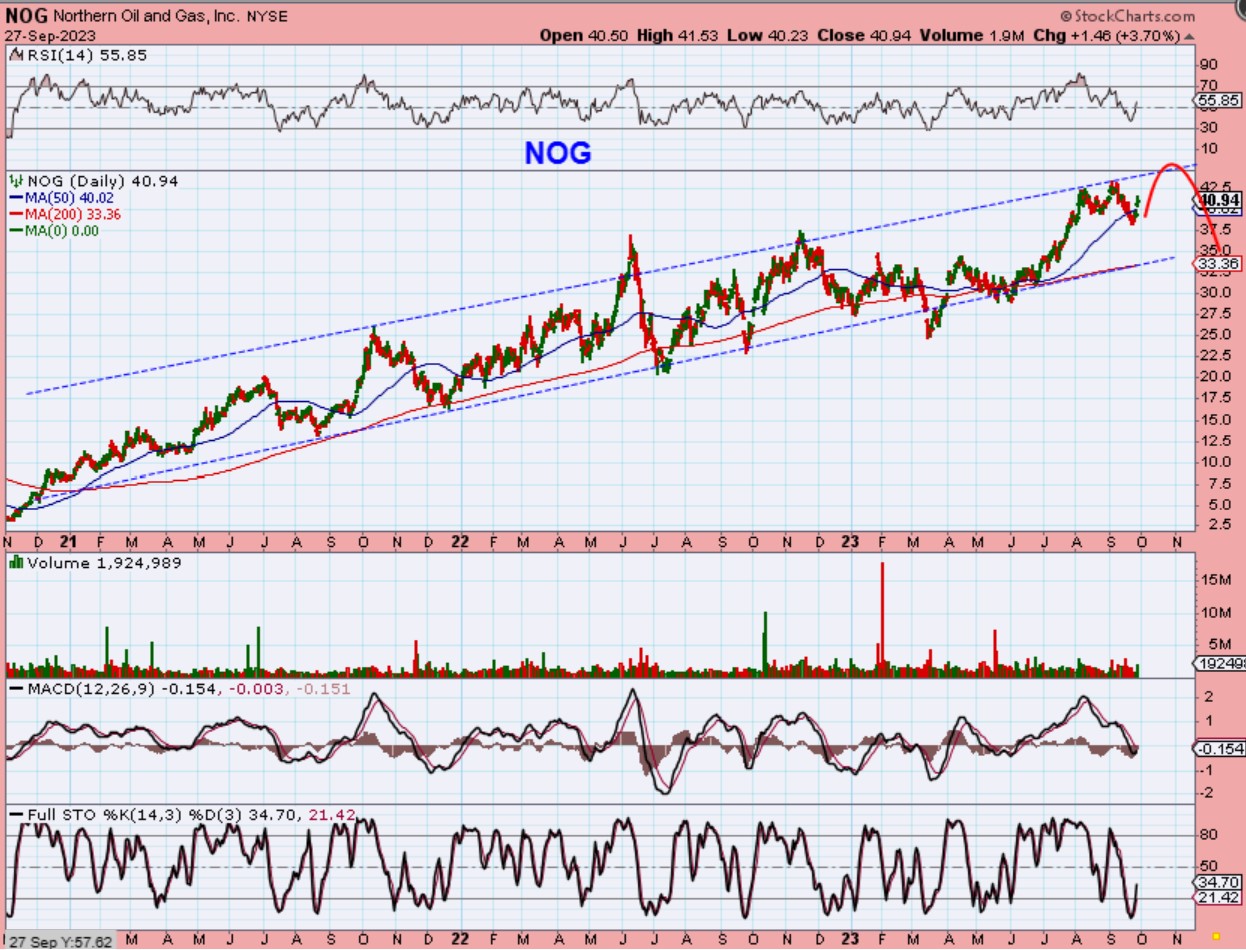
NOG So take a look at NOG for example, we could see a move higher to the upper trend line and then it may dip to the lower one. So the Oil stocks are a buy with the reversals at the 50sma, but you may want to lock some in early, after 10 days or so ( or raise stops). We have traded stocks like ERF, APA, NOG, VLO, MRO, etc , and they are almost all reversing at their 50 sma.
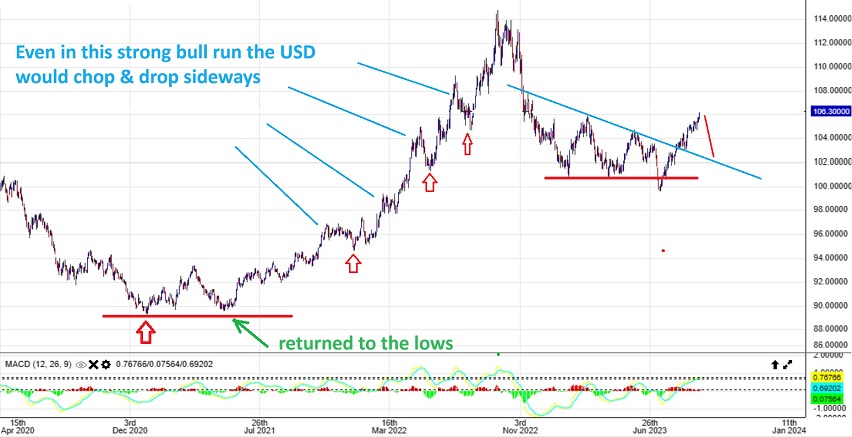
The USD surged again, but it has reached the upper trend line, so it may begin to chop up here and then pull back to a dcl. Taking a step back…
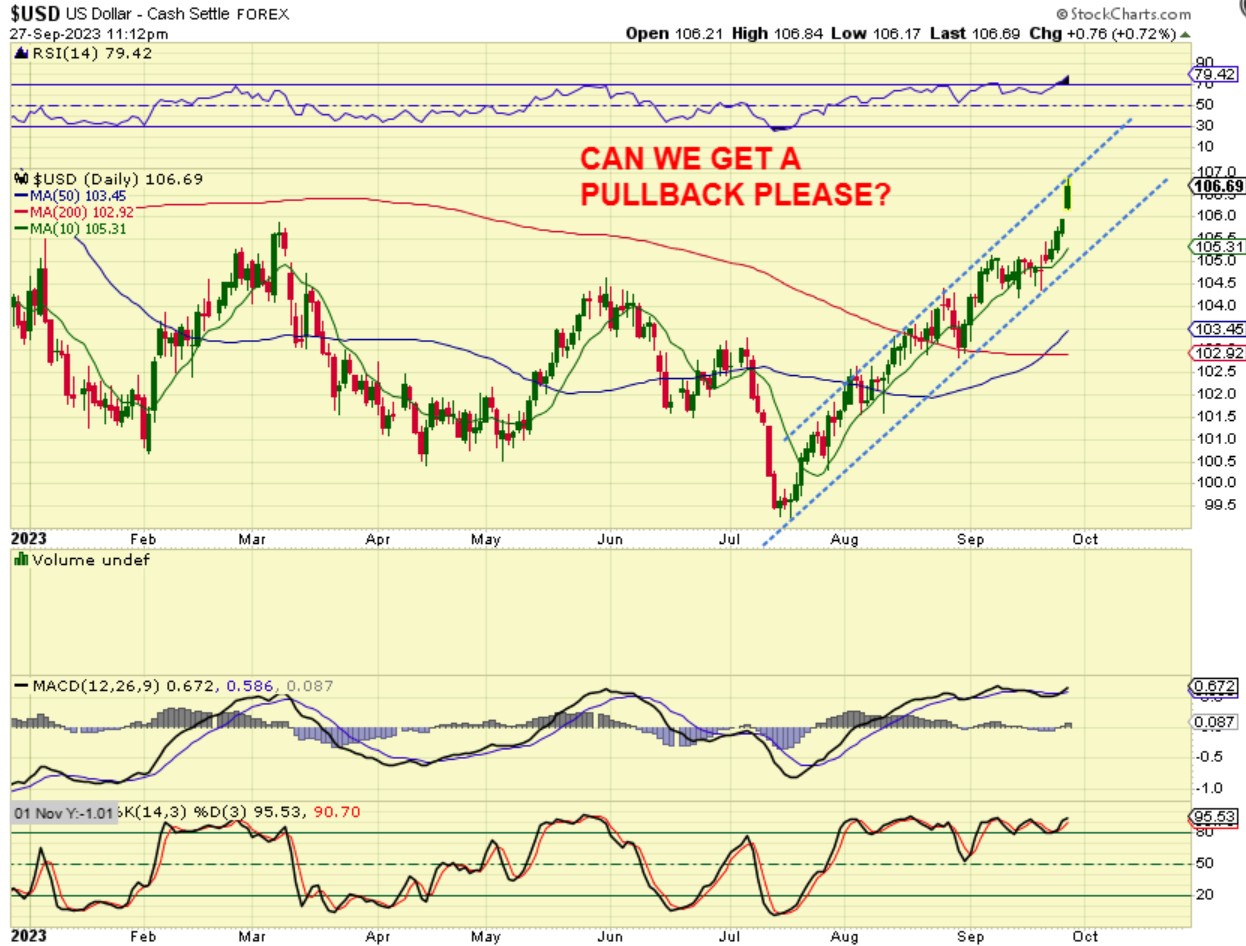
The USD (6 a.m.) is down a bit on Thursday morning and may be in a resistance zone. It may finally be ready to chop and drop into a dcl.
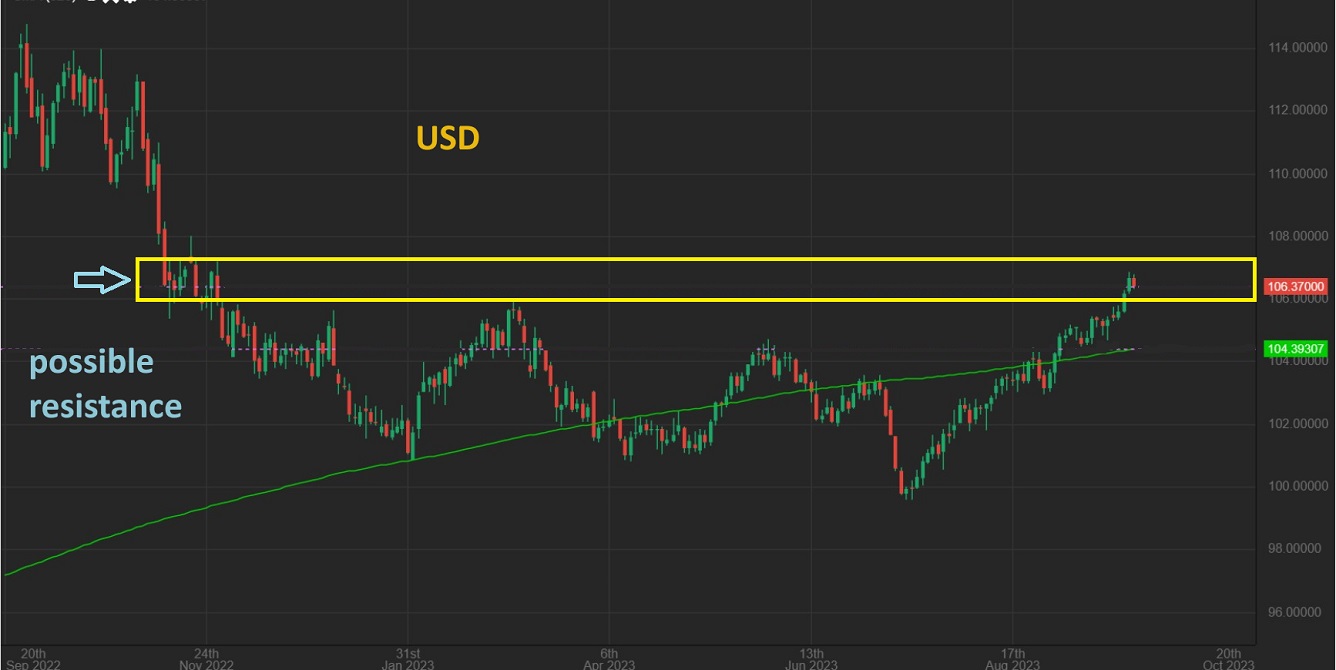
I DREW THIS IDEA YESTERDAY:
This is just an idea of what we could see, a guess, but the point is that the USD cannot just go straight up forever, and when it starts to pull back, I think that is when we will see Gold rally strongly.
.
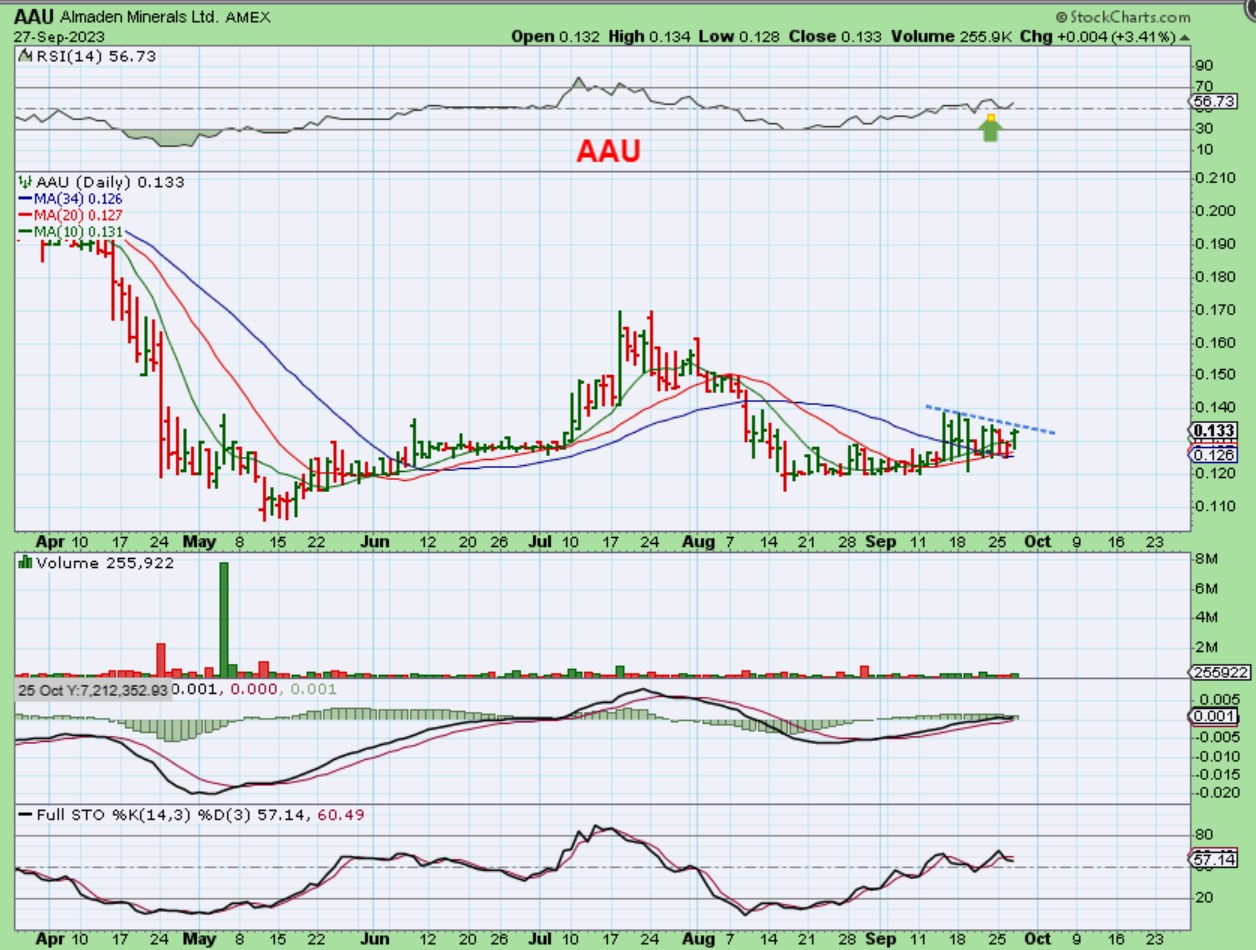
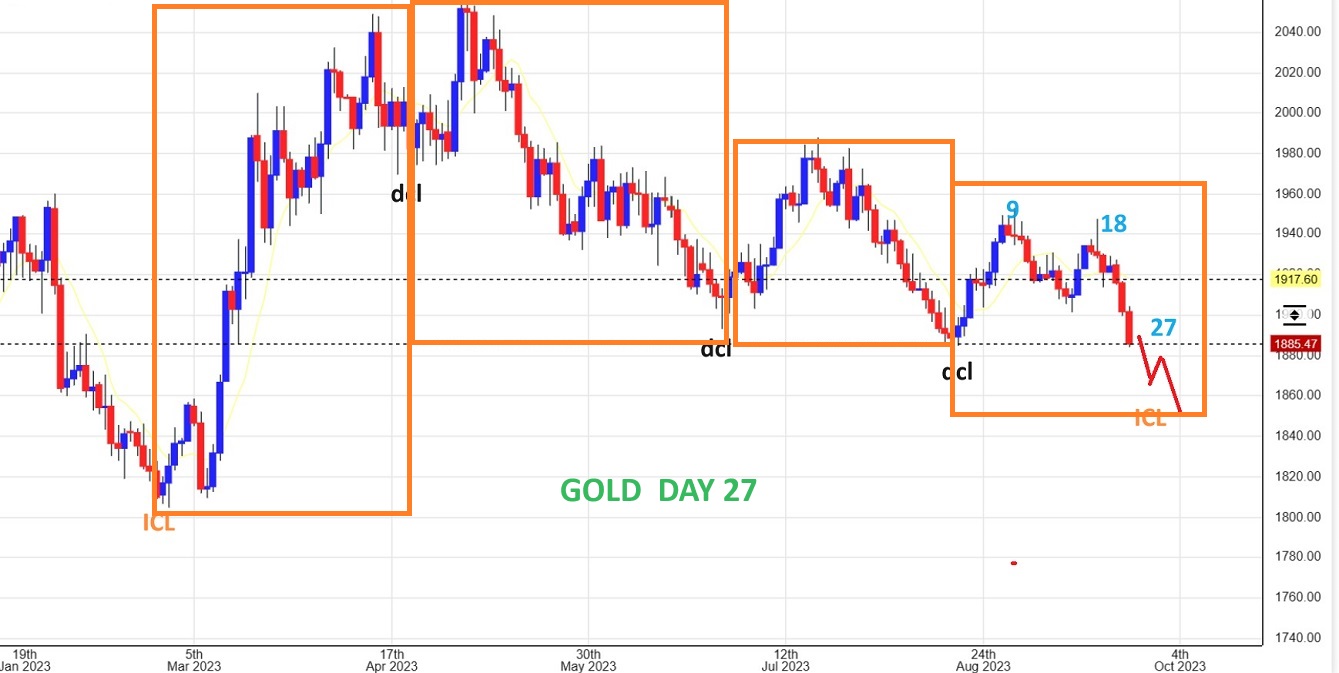
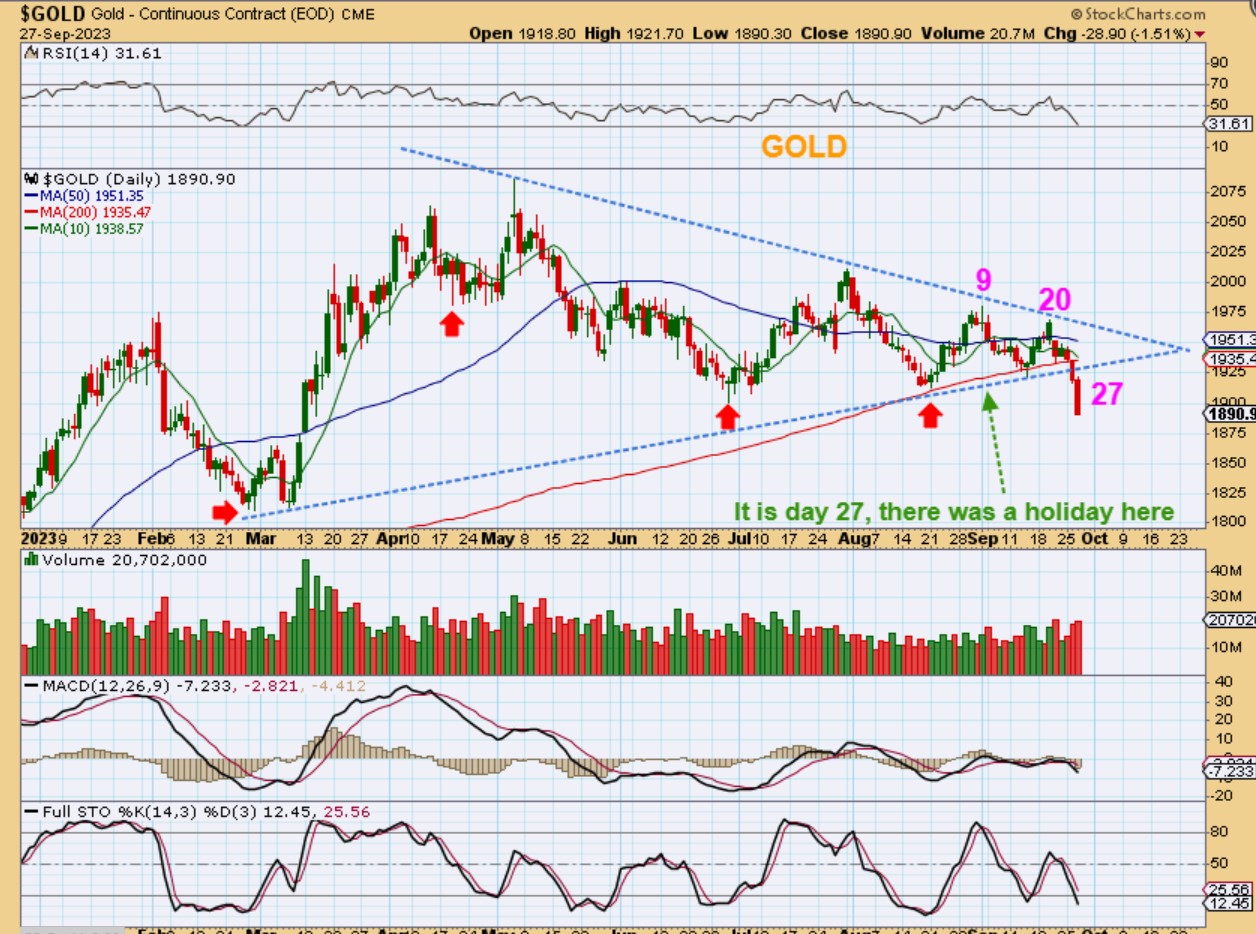
GOLD is on day 27 for spot gold and that usually isnt enough for a dcl to form, I usually expect to see somewhere near day 32, however….if the USD starts to drop, we could see a swing low form. A drop below these lows and a recovery might give us a shake out too. Honestly, I’d like to see the normal 5-7 day sell off and then a snap back rally as a shake out.
On the Stockcharts chart, GOLD already appears to have broken the last couple of lows as a stop run, and it lost the 200sma as a shake out if it is recovered. I expect more selling, but we could be close to a DCL/ICL.
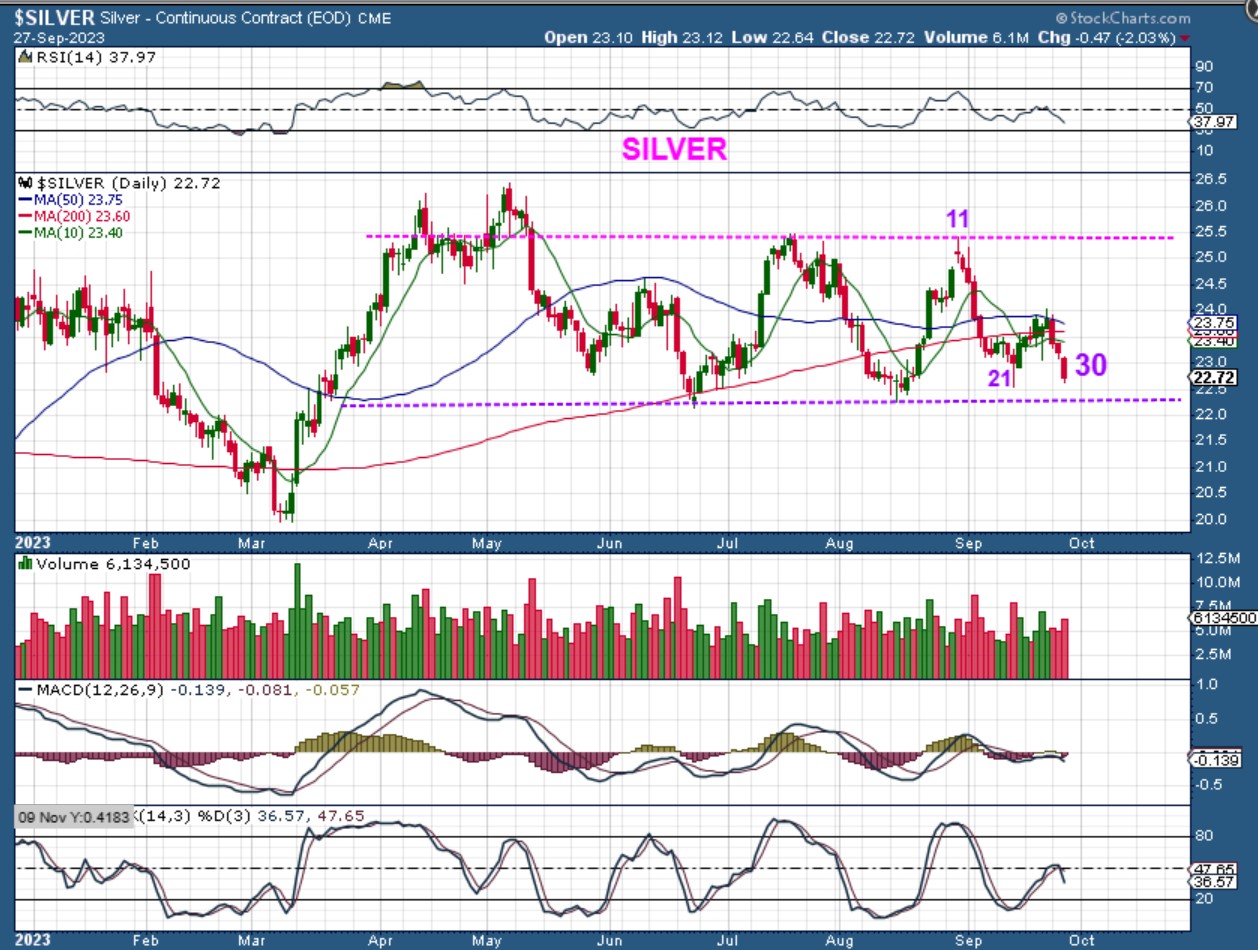
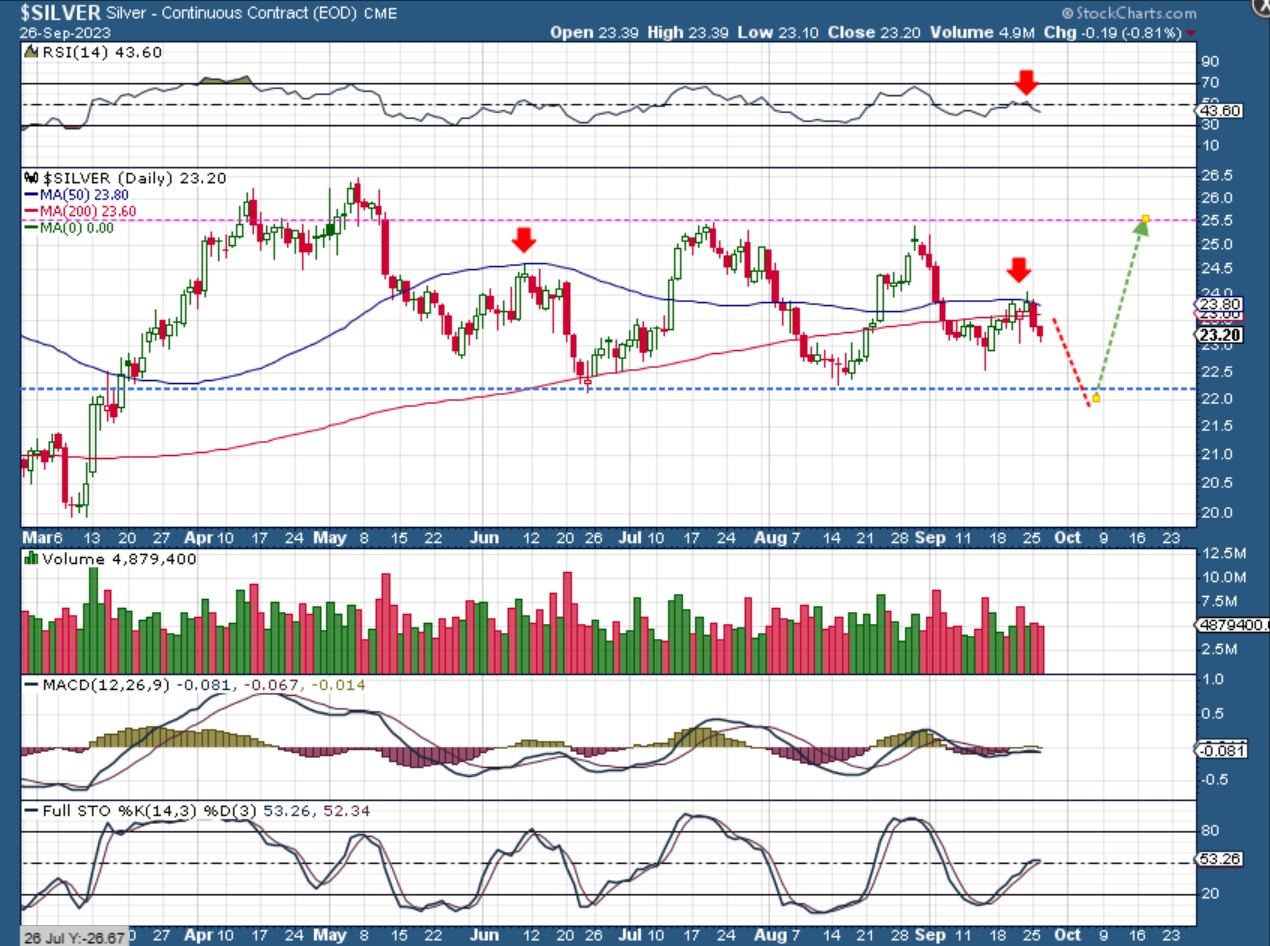
SILVER is on day 30. It would seem likely that we would get a run of the stops by breaking the lows.
.
SILVER: This was in yesterdays report as a visual of a stop run possibility.
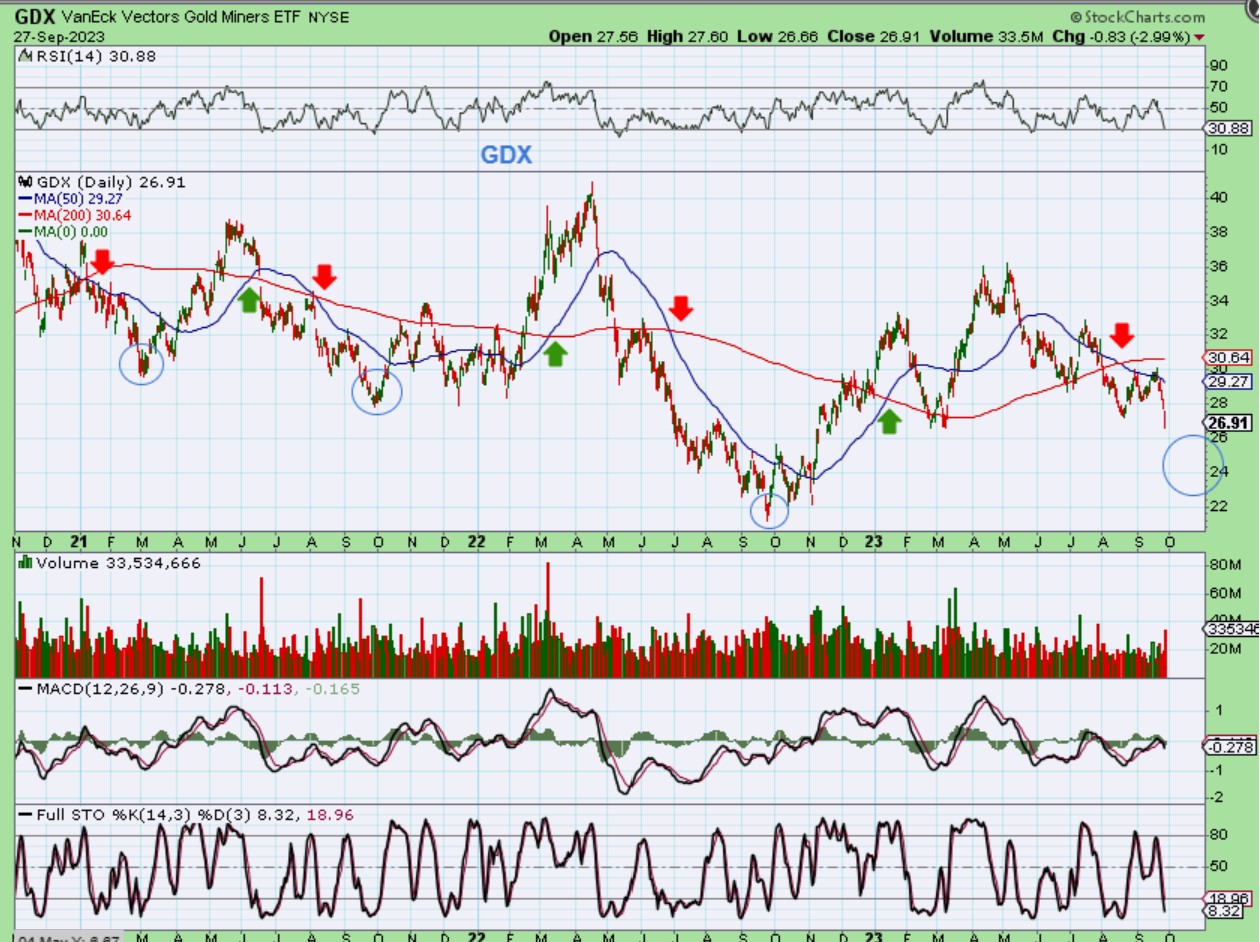
GDX has the 50sma crossing under the 200sma, and I have heard people say that this is extremely bearish. I hear about the Golden Cross as bullish and this opposite move as bearish a lot, but I do not see it as predicting future movement. Notice here that shortly after the past cross downs (Red arrows) Price often bottomed a couple of weeks later and then rallied. We got that cross a couple of weeks ago.
.
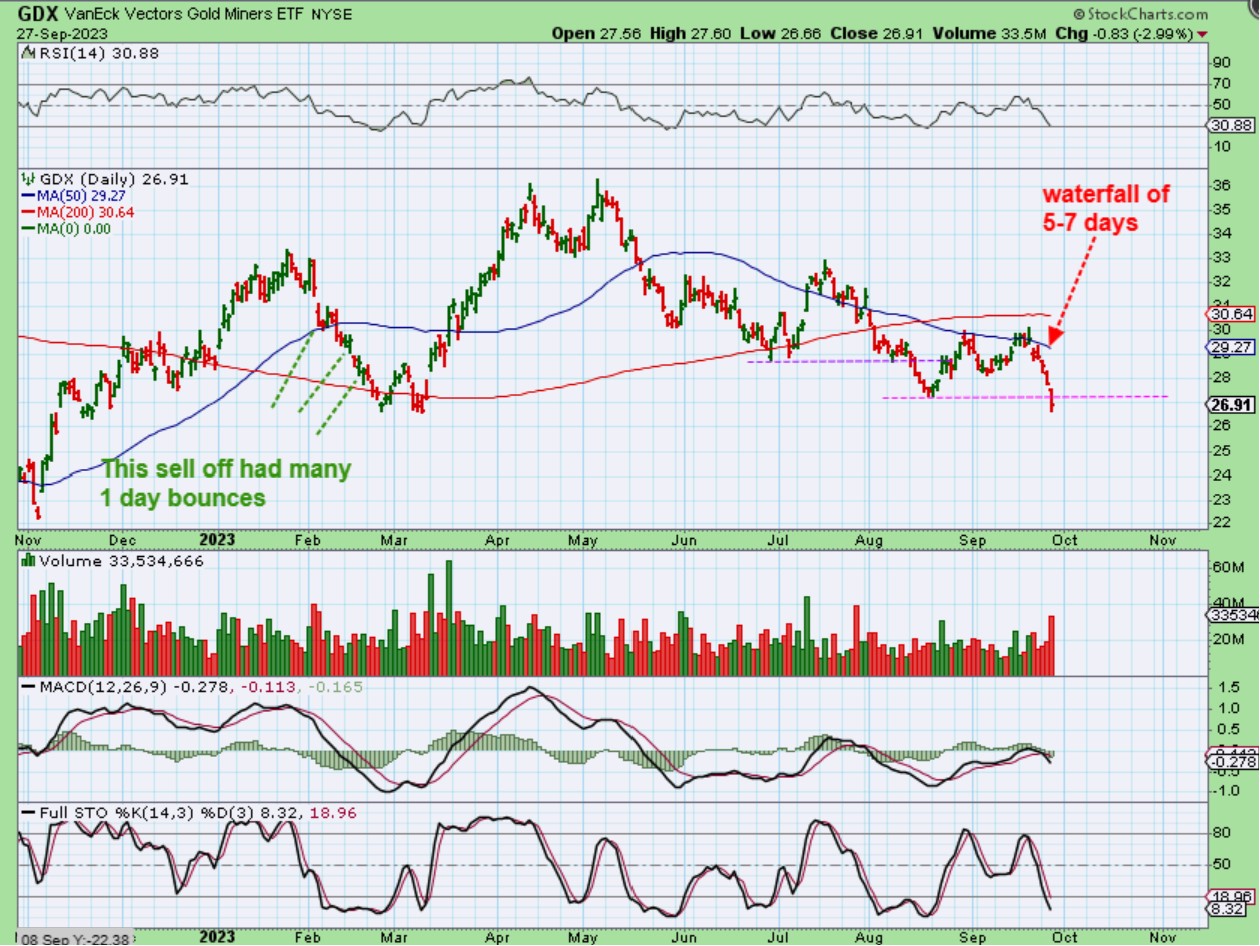
THE WATERFALL SELL OFF:
.
It seems that everyone wants to catch the lows or T-H-E- EXACT BOTTOM, and that is a personal choice, but just know that one can get chopped up that way too. That especially isn’t the best idea in a waterfall sell off. We should still be early here with Gold on day 28 today, so let’s say that someone tried to buy Monday, and then again on Tuesday, and then Wednesday—they are getting stopped out and chopped up little by little just to catch the low. It is often best to wait for a good swing low and that may not come until next week. I have been mentioning possibly day 32, and that comes early next week.
.
That said, the question is, “Could we bottom today or maybe tomorrow after the Fed Speech tonight and reverse higher?” Yes, it is possible, but it is considered early. I’m thinking about that USD and wondering if it may finally stall here at resistance and start to roll over into a dcl. If so, we could see Miners start to bottom in a choppy manner. If the USD drops quickly, Miners could v-bottom as a stop run. Should you buy it? That is completely up to you, but the above GDX chart still looks like that waterfall sell off that can run for 5-7 days before it exhausts. The safer buy is a very strong reversal candle or a swing low, especially after it recovers the 10sma.
.
For traders, we could get short term trades in the general markets if they bounce, and as that bounce plays out, we may get a shorting opportunity too (for short term traders). Enjoy your Thursday trading, you want to watch the data release at 8:30, and see if that affects the futures.
.
~ALEX
.
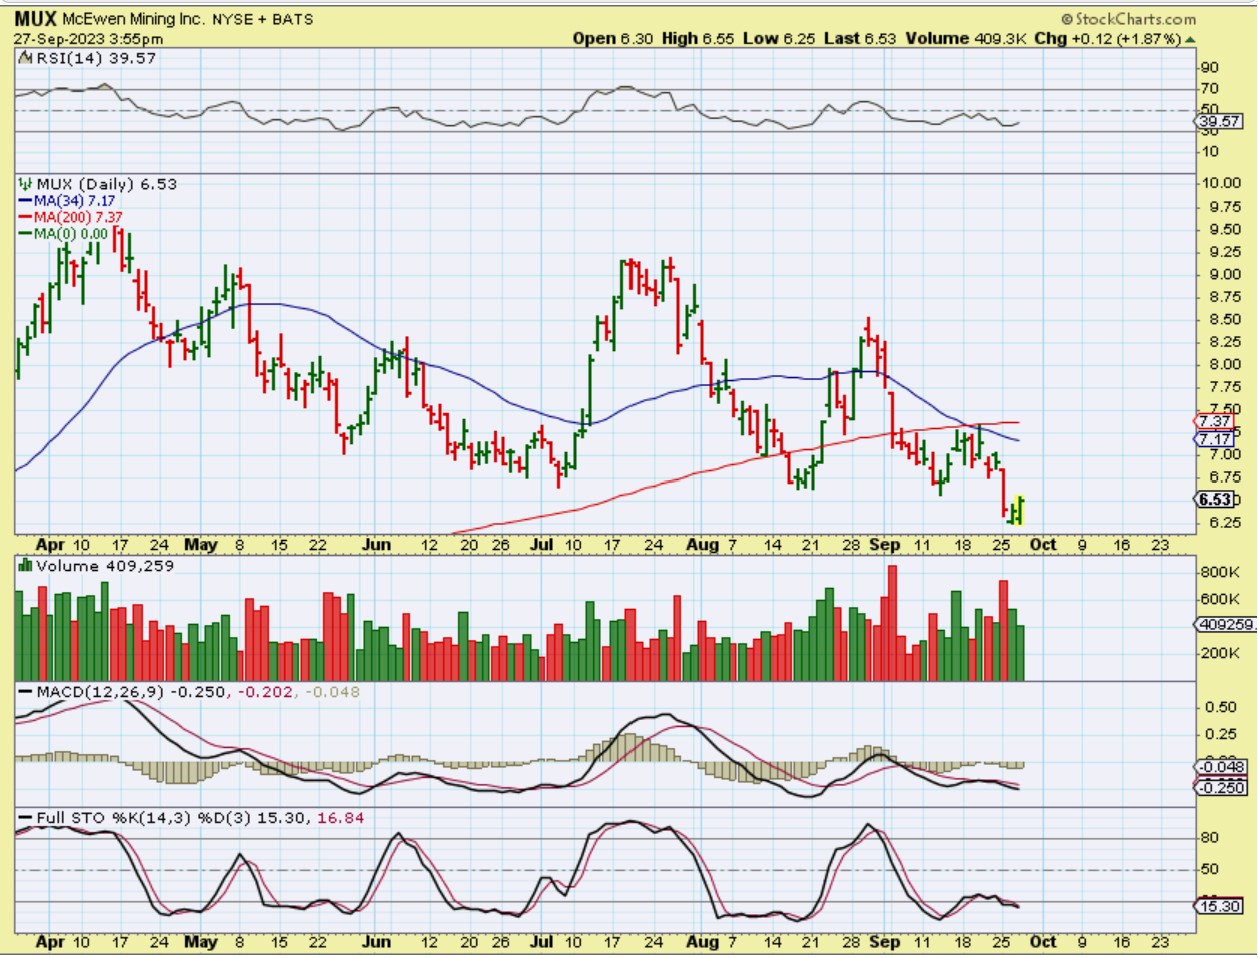
HMY & AU, which looked good right up to yesterday despite the waterfall selling, finally rolled over and were sold off too. That said, other Miners held up after selling off. A couple are seen below. So we have a mixed bag, but it gives hope that Miners may be close to bottoming. I’m not saying that these are a buy yet, but they are worth keeping on a watch list.
.
.