September 7th – Rips and Dips
In this report, I want to just report what I see with the charts alone for 1 thing, but then I also want to think about the recent bullishness of the USD and how that can affect things. For example, we have seen a bullish start to the General Markets and yesterday I wrote that I was expecting a dip. I wrote this…
.
FROM YESTERDAYS REPORT: SPX – The USD popped and then dipped a little, while the General Markets dropped slightly. The chart makes it look like will back test the 50sma (& the 9 or 10sma too).
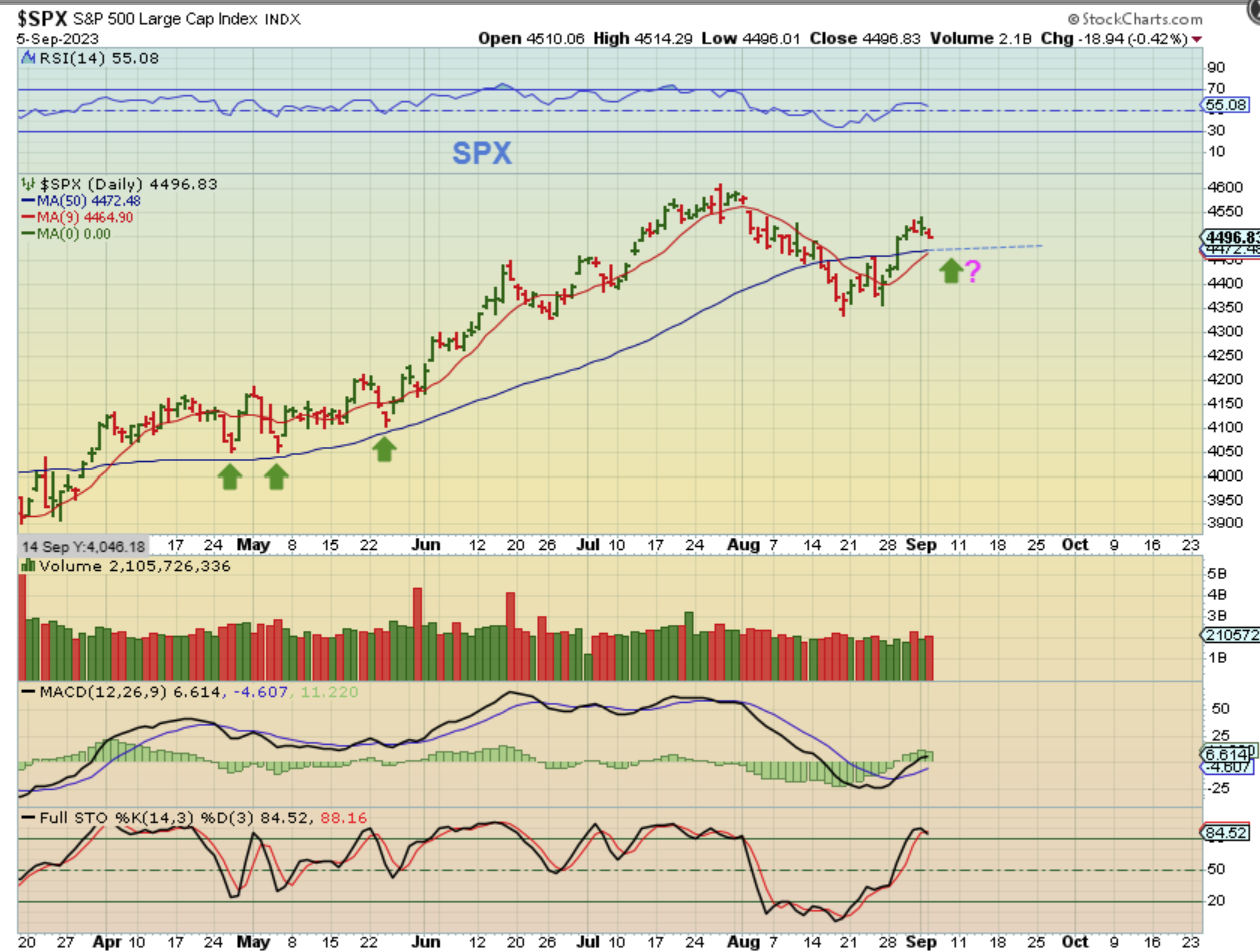
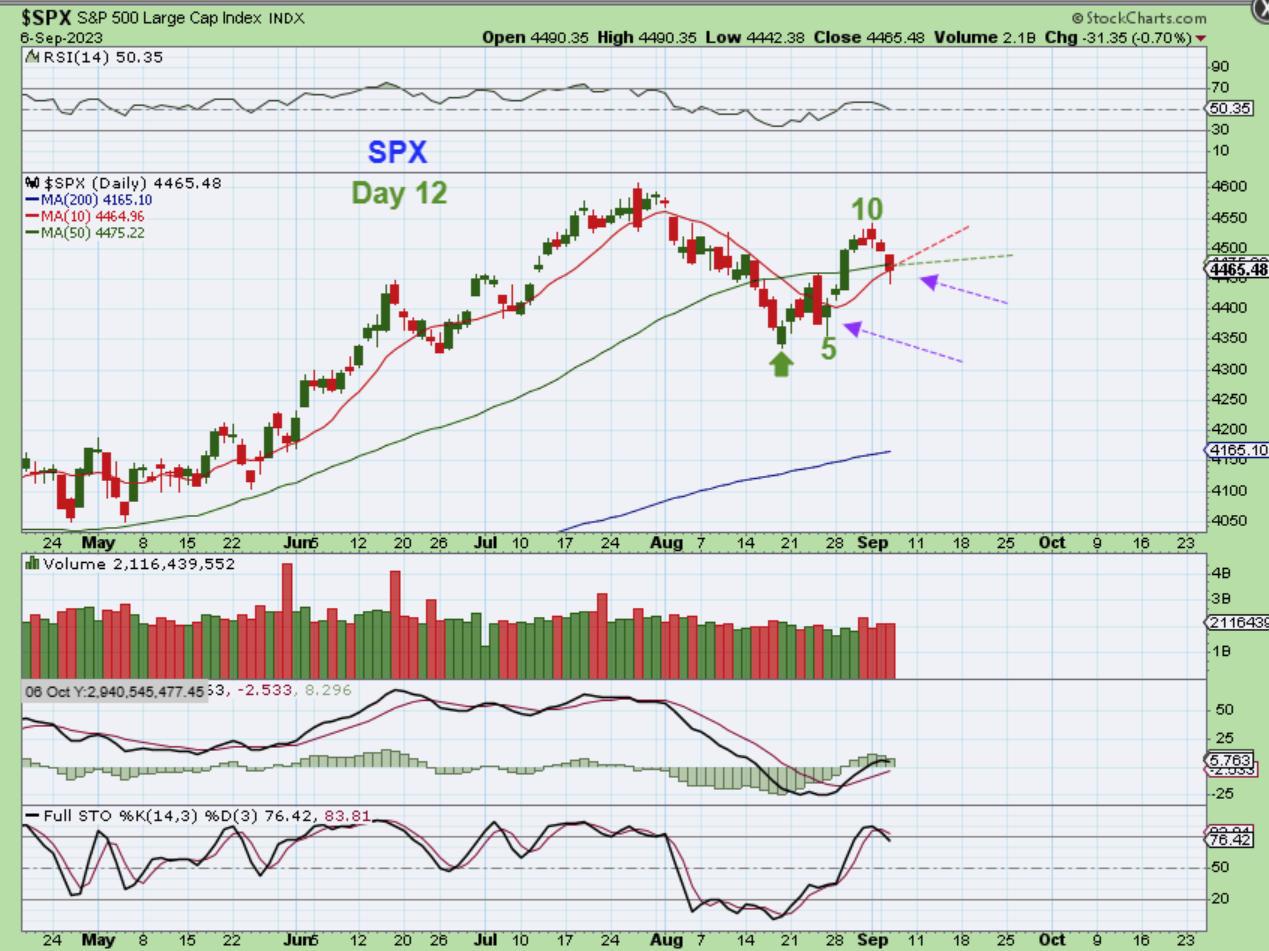
THE SPX dropped deeper than I expected, but it did start to recover into the close. So when I discuss this chart as is, it is bullish and we have a dip into day 12 with a slight break and recovery of the 10 & 50sma. This is fine as is. In fact, it looks like day 5, but I do wonder if the strength of the USD will hinder market progress? So far it hasn’t, but I’m watching for that possibility.
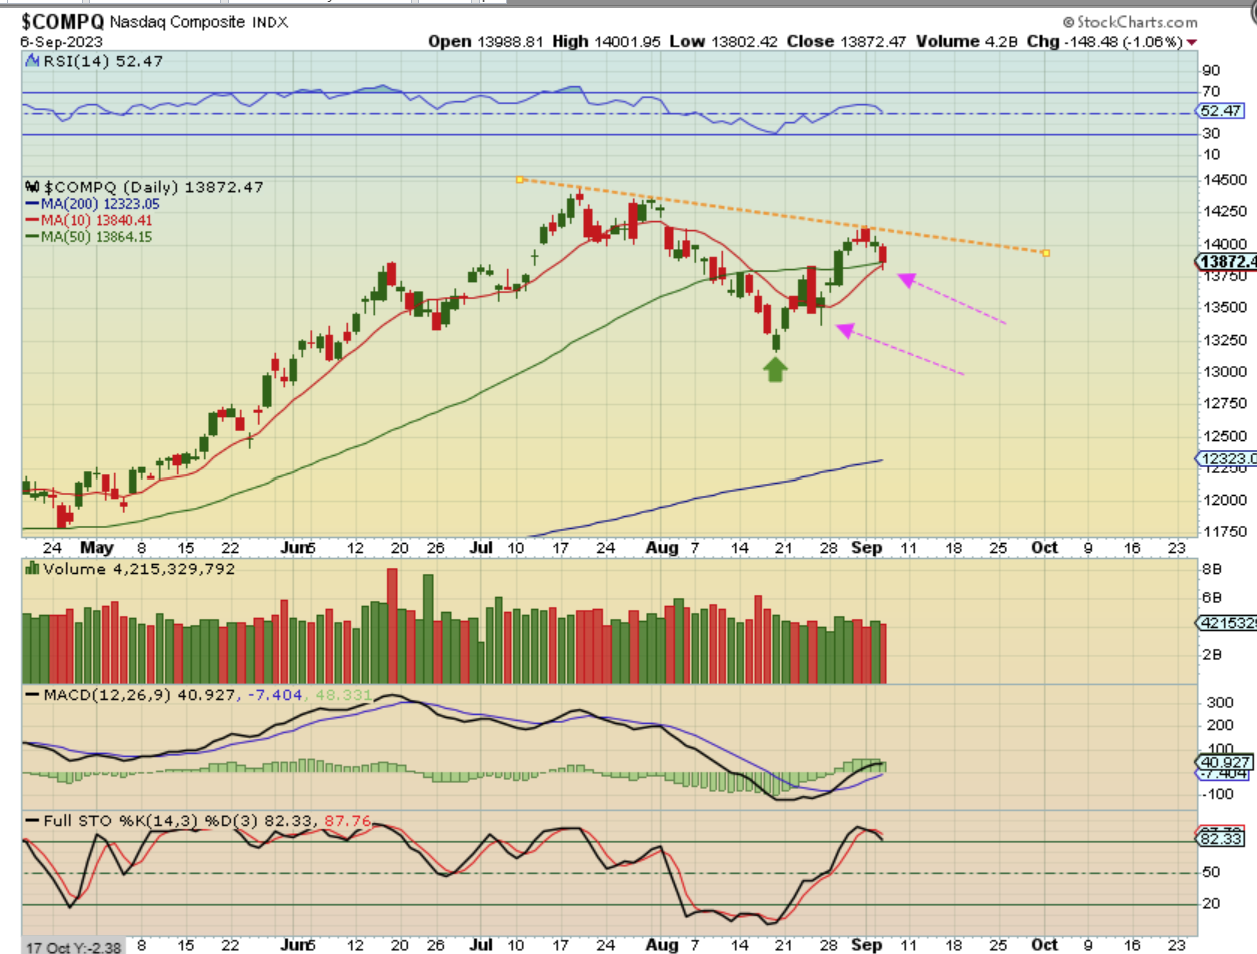
One thing that I am watching would be the trendline in this Nasdaq Chart. The Nasdaq has been strong despite the USD, so I am actually thinking that the General Markets will continue strong, and yesterday we saw price land on and hold the 10 & 50sma. A push higher, especially through that downtrend, confirms this bullish chart. A long leveraged trade would be TQQQ. Also I had a list of stocks to watch on the pullbacks in reports recently. Did you write them down and start a watchlist?
.
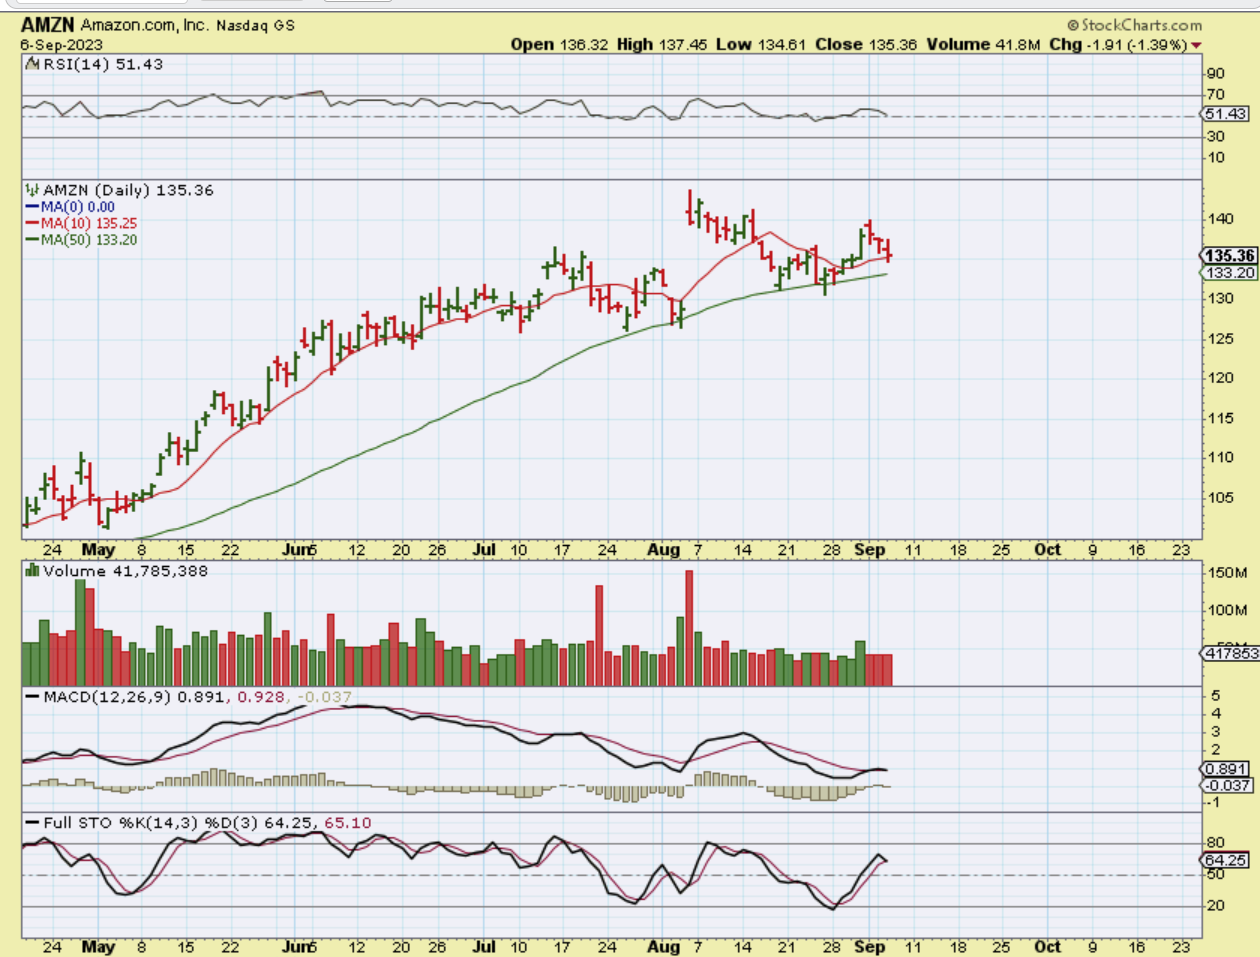
Did you write them down and start a watchlist? I had AMZN, FUBO, GRPN, GCT, and others that you can watch daily and buy either when they reach support or reverse higher with the markets. For example AMZN has been climbing up that 50 sma.
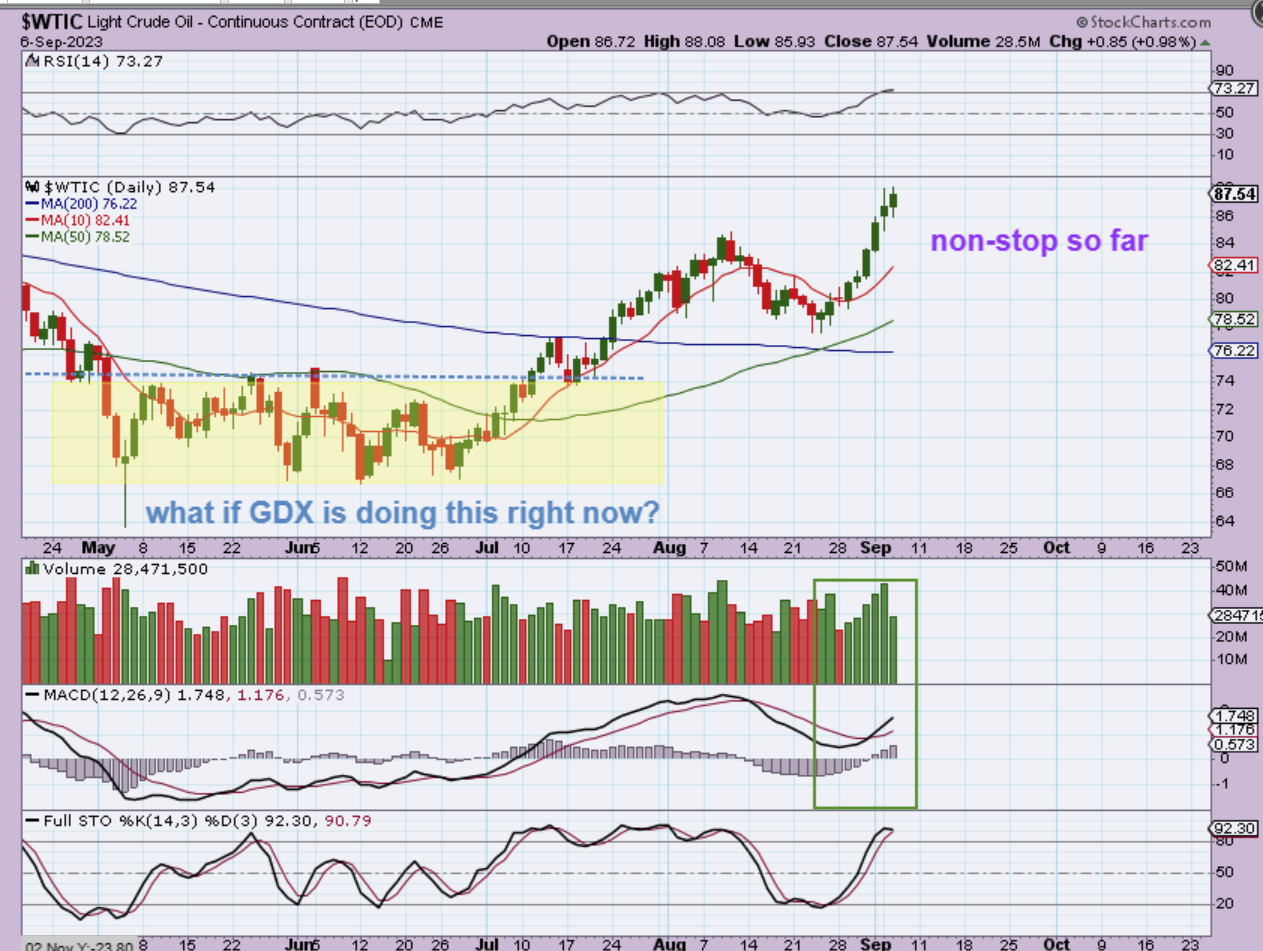
WTIC – Oil has been running higher for about 8 straight days and this was a trade mentioned using USO or UCO, or Oil stocks. This will also obviously be a ‘buy the dip’ candidate in the future too. So…
.
WTIC – So Oil could pull back to the magenta line when the 10sma gets there, or Oil can keep running to the yellow line and then pull back to the 10sma after that. So far Oil went from a Horribly choppy bottom to Bullish. Take a look at that bottoming process again on this chart. With that in mind…
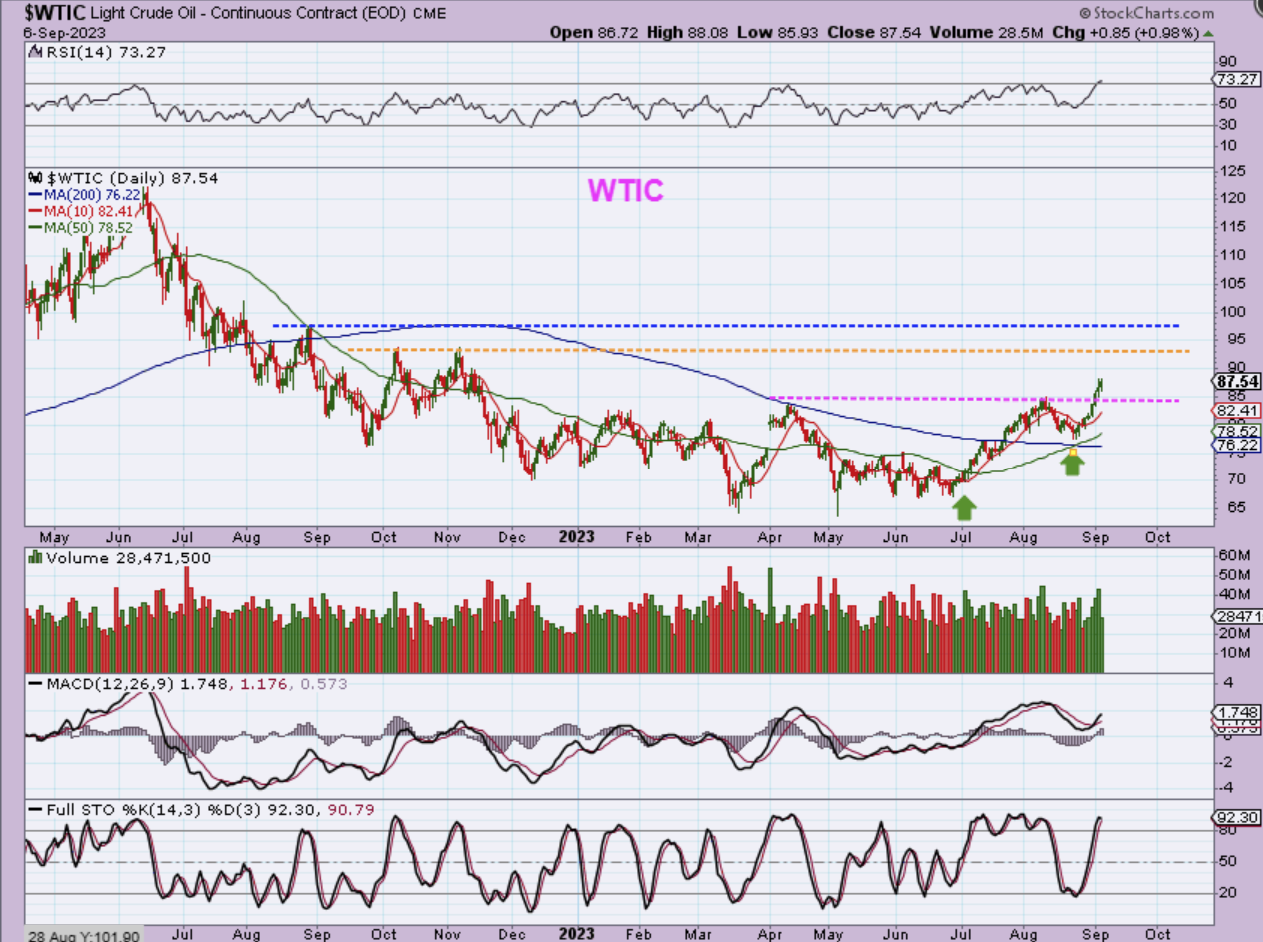
I wrote on this chart: What if this is what Miners are doing right now at the lows? Gold and Silver still look good, but Miners seem to be choppy and frustrating like Oil was. You can see that once it got running, it was easy to enter later too.
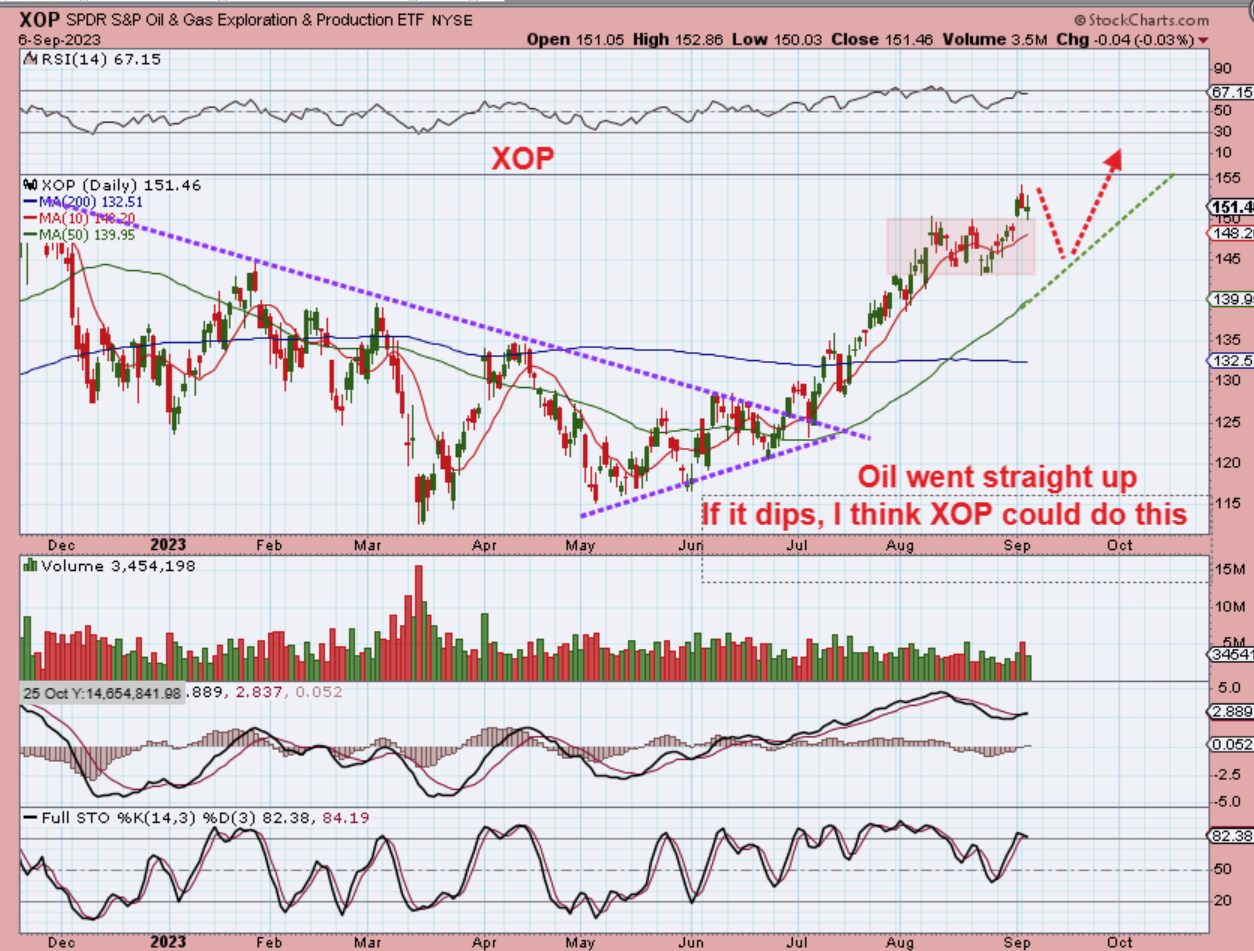
XOP – As for Oil stocks, they have a horrible choppy low too, but once they got running all of that chop was a distant memory. With the XOP now, I am seeing Oil run up day after day while XOP consolidates its’ gains. So if Oil stops going up day after day and pulls back to the 10sma, I think that the XOP would be a buy again on a dip to the 50sma or 10sma.
.
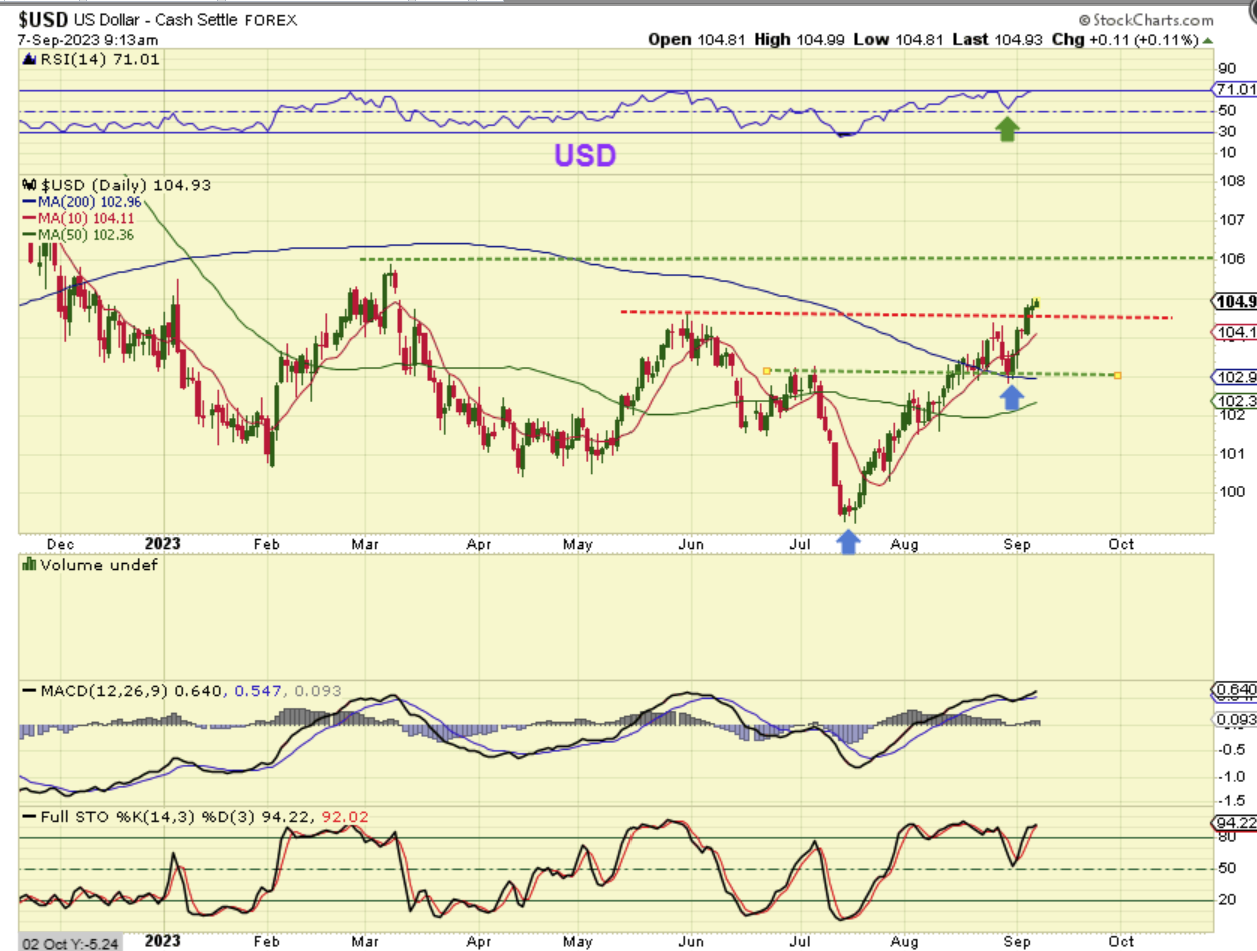
So now we get to The USD and this remains a bullish set up. It went from making ‘lower lows’ & ‘lower highs’ (a downtrend) to a ‘shakeout low’ and now ‘a new high’ above the may highs. THAT HIGHER HIGH makes me conclude that the USD has an ICL at the shake out, and this is daily cycle #2 starting on the back test of the 200 sma. The big question now is:
– Has the Fed Rate Hikes and other factors caused the USD to put in a 3 yr cycle low 6 months early? I think that a break of the 106 green line would convince me that it has. Let me show you what I am thinking here…
.
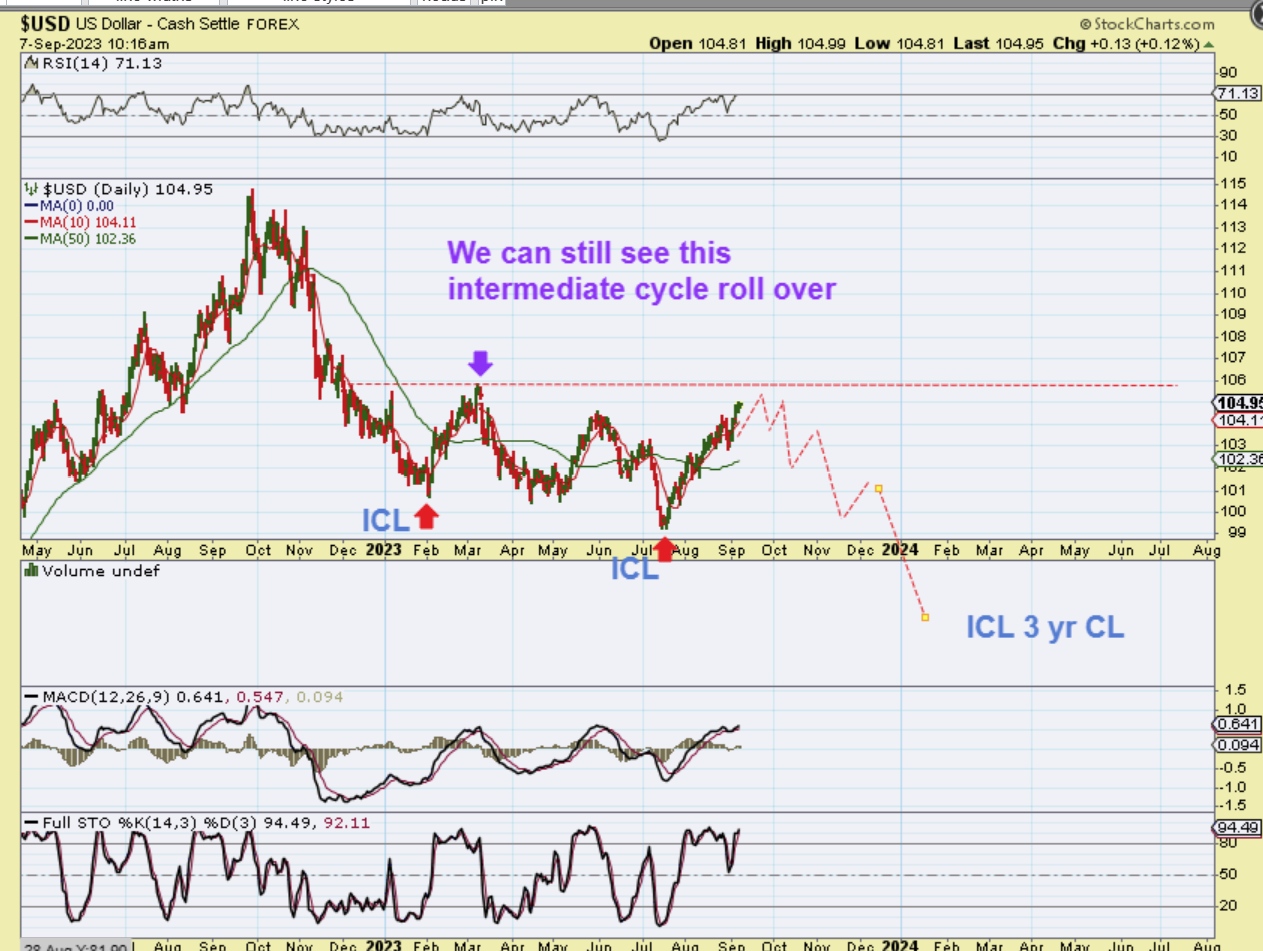
The USD looks to have a crash into an ICL in February. That was followed by a drop into May and then a false rally that rolled over into a July ICL. It doesn’t seem that those Mays lows were an ICL, since the July lows were only 2 months later. So what I am saying is that until we get above that March high we would still have a lower intermediate high. The USD could chop under $106 in this 2nd daily cycle and then drop in a 3rd & 4th daily cycle. SO FAR, GOLD & SILVER are trying to hold up until this rolls over.
.
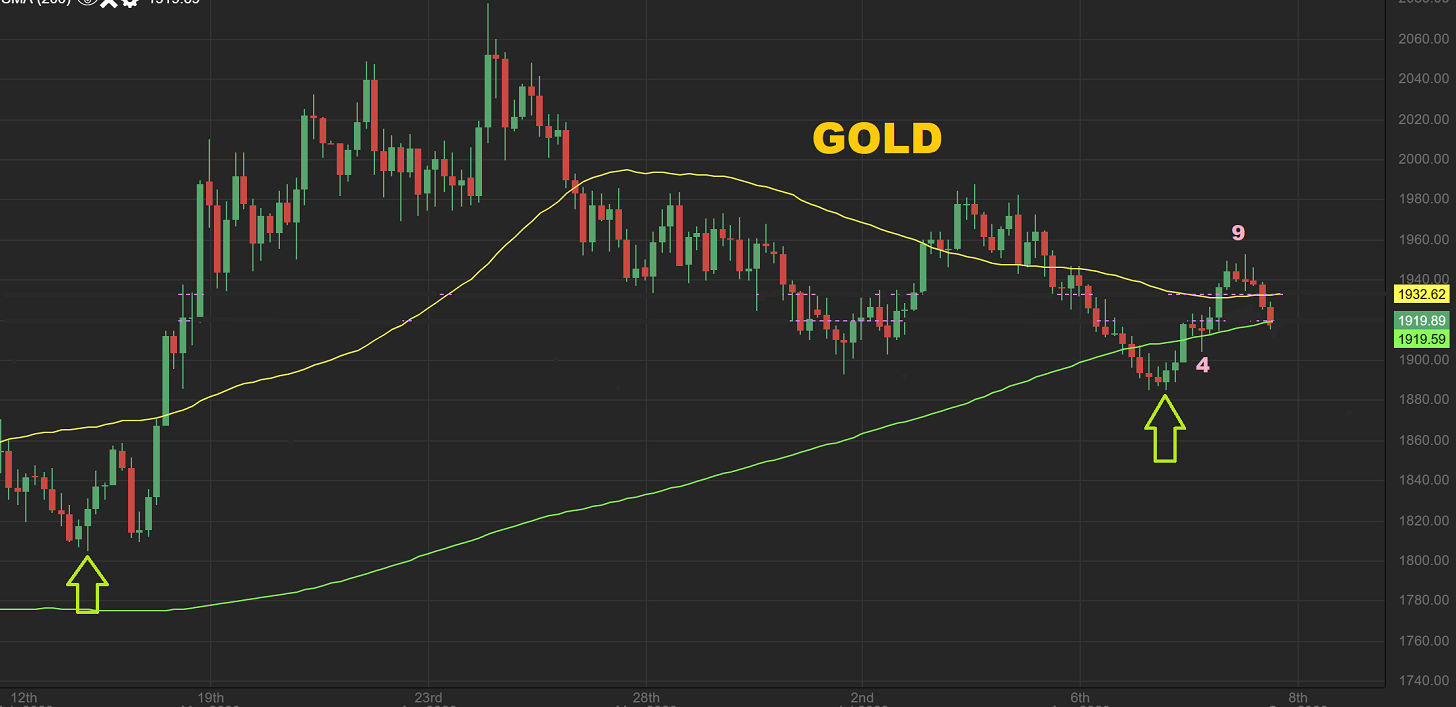
GOLD is trying to hold up, but on day 12 it pierced the 200sma. If the USD rallies, it does seem like Gold could break down. If the USD chops around under $1.06, the Gold could chop around up here. NOTE: IF I DID NOT INCLUDE THE USD IN MY ANALYSIS, I would simply say that so far Gold is still bullish.
SILVER lost the 200sma, and that is a bit discouraging. The Silver miners never performed as well as Silver, so it is as though ‘someone’ knew that Silver wasn’t ready to break out and run yet. So what do we currently have with Silver?
.
Silver is a large 5 month consolidation so far. Silver made its deeper low in May and in July that low was tested as a dcl. Now we are 1/2 way through another daily cycle at day 16. If I was not thinking about the USD, I would still say that Silver has a bullish consolidation. Silver could bounce up, but then could it return to the May and July lows?…
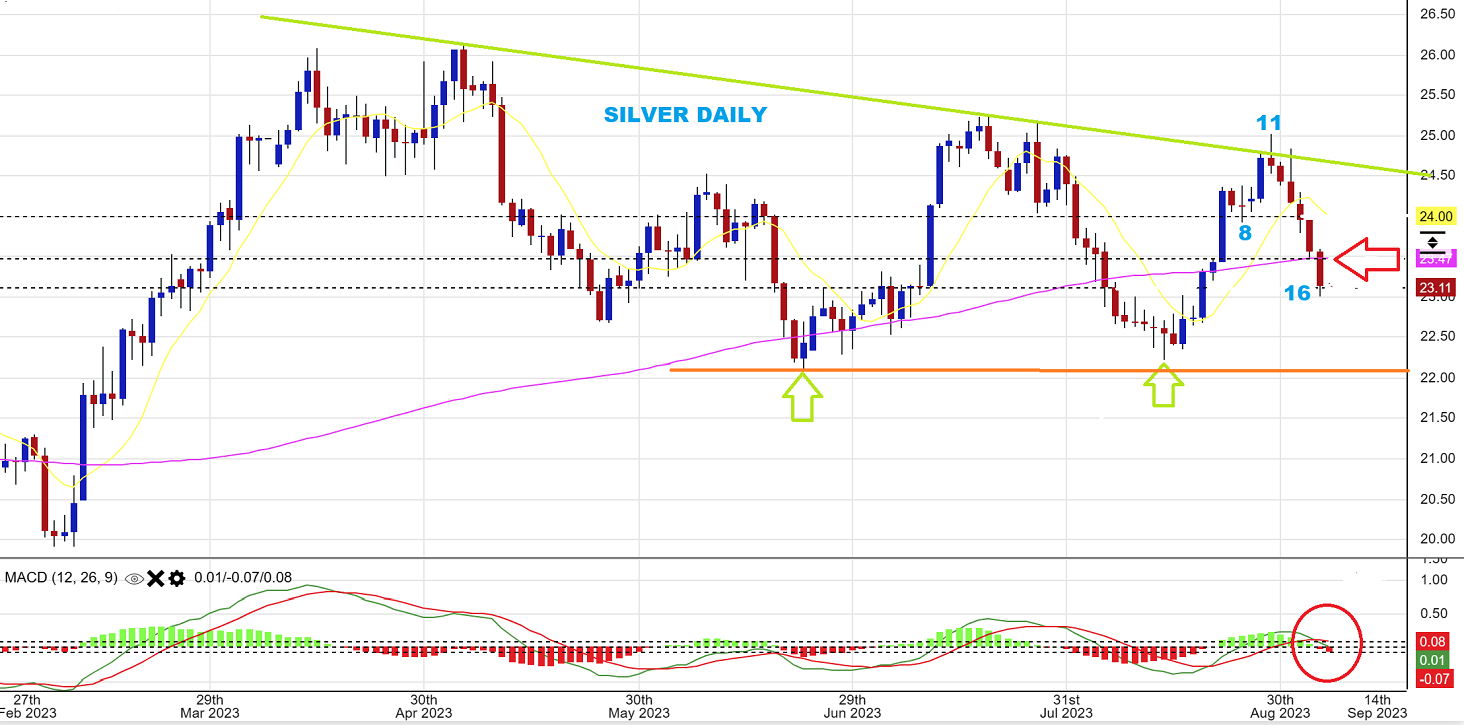
Silver could bounce up, but then could it return to the May and July lows?
.
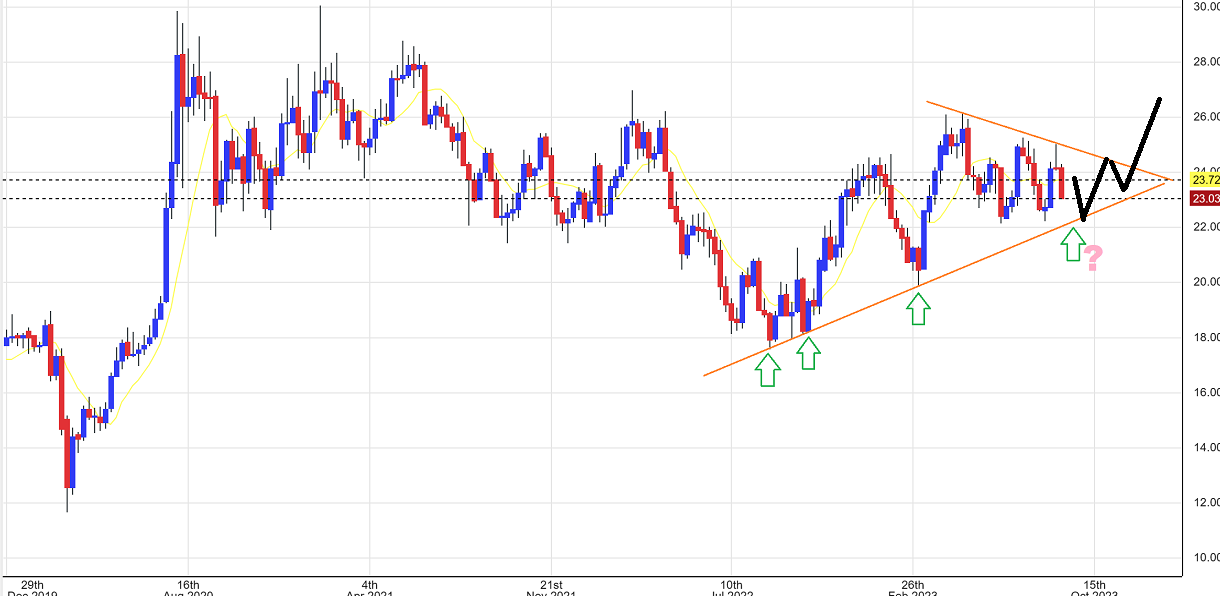
Yes, it could. I stepped back and found this uptrend line that lands right where the May & July lows would be. So yes, we may see Silver return to the lows, and THEN we’ll see if the Silver miners start to perk up as Silver bounces back up to the top of this triangle.
.
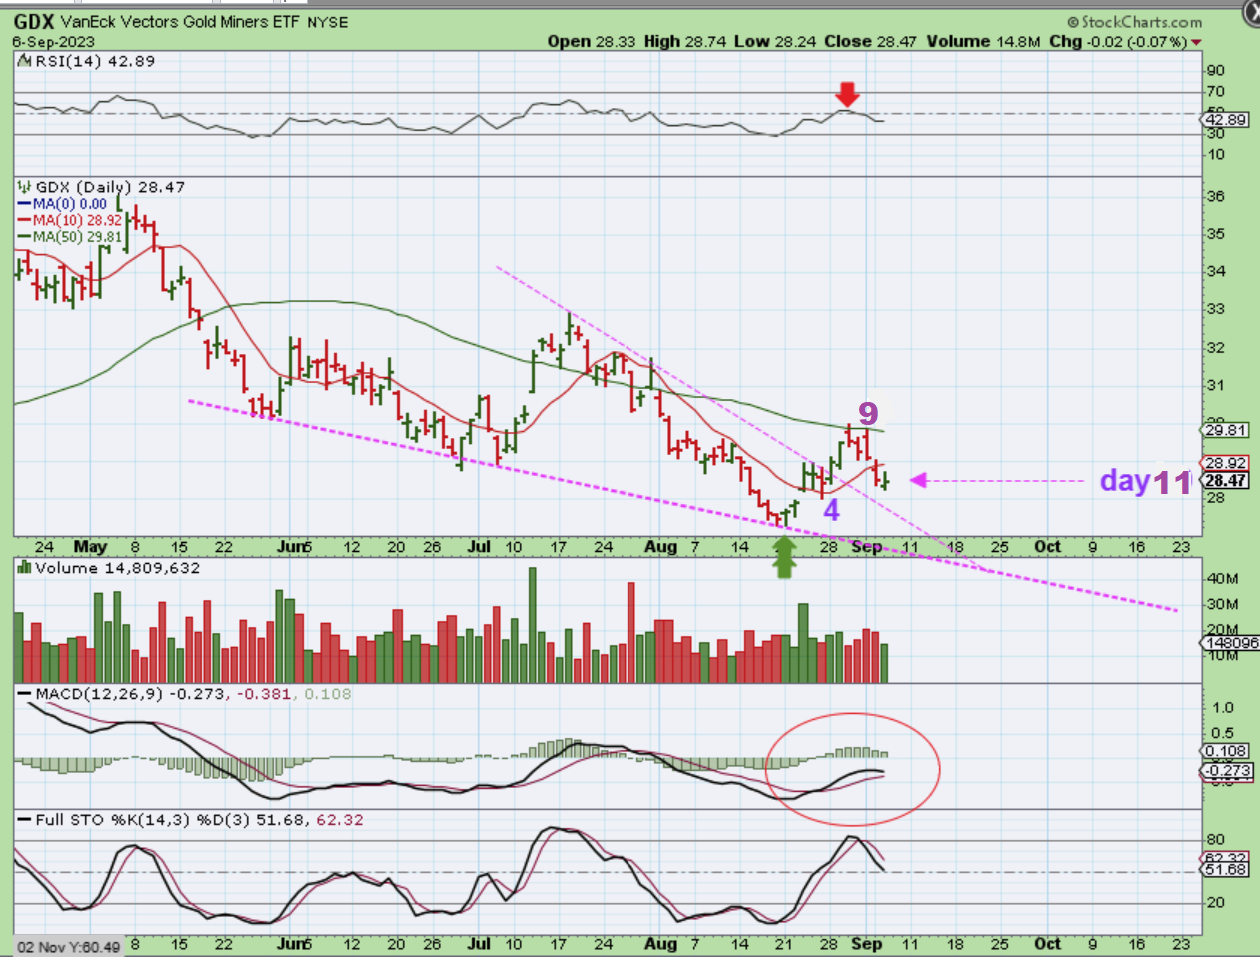
GDX was rejected at the 50sma on 2 separate days and then lost the 10sma. The MACD looks good, but the RSI was stopped at the 50% area so far. This looks like day 11 for The GDX. If Gold and Silver push higher, this may try to get above that 50sma again. If they chop sideways, we can expect the same here.
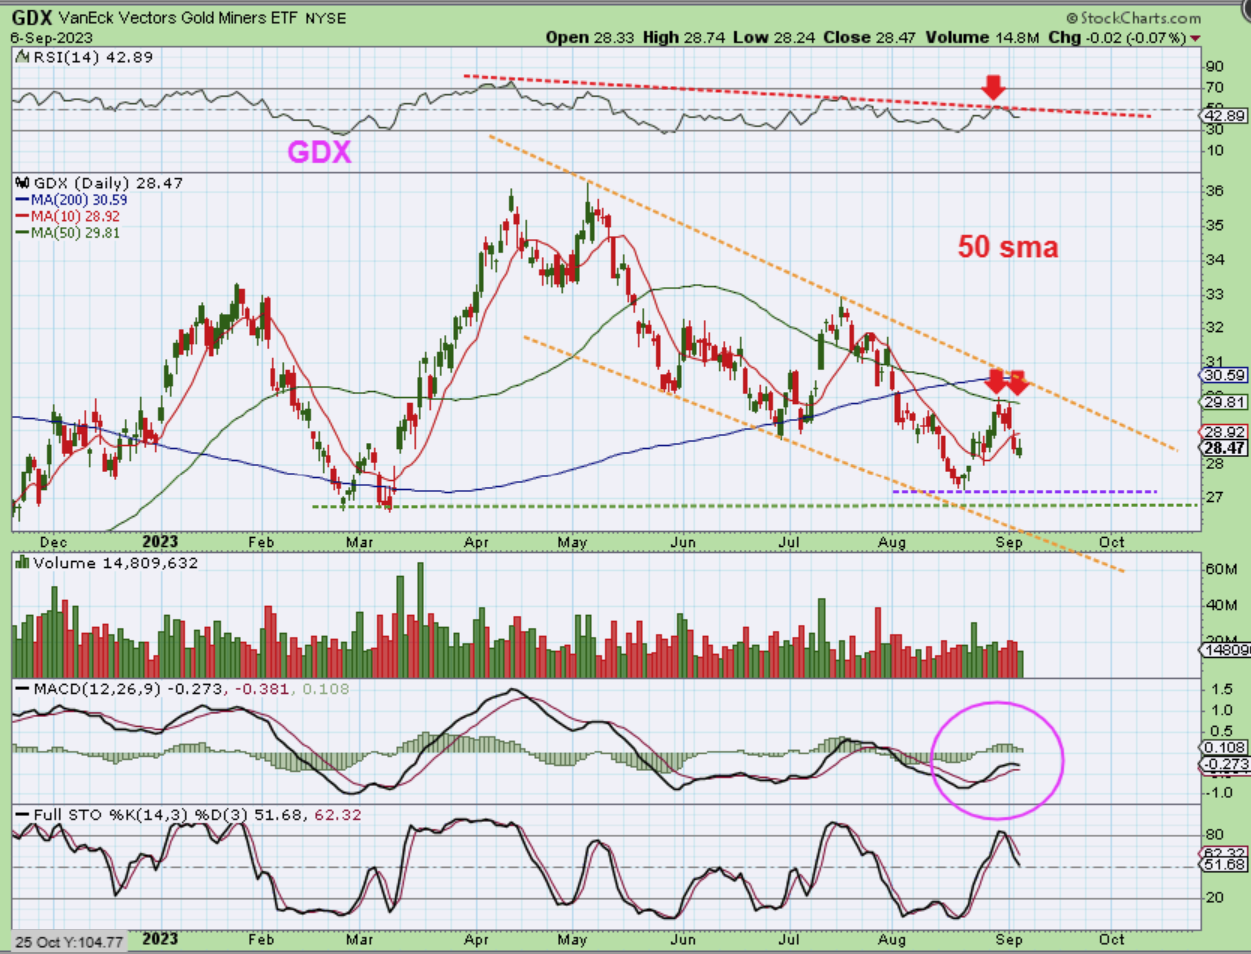
If I were to just look at this chart of The GDX without thinking about the USD, I would say that it is still fine. The MACD is fine and it may just be back testing that wedge break, so it needs more time.
.
You can clearly see the difference between just looking at charts to see whether the current set up is either bullish, bearish, or neutral, verses considering the charts with the USD possibly breaking out even higher over time.
.
The General Markets & Oil still look strong so far, despite the strength in the USD. Gold & Silver can be considered as having gone from Bullish to maybe more neutral, but it is that USD that makes things look more concerning, especially if it breaks the former highs near $1.06. The sector rallied out of the lows and I recommended buying a small basket of miners and holding if we have an ICL in place, however things became choppy when the USD broke higher. If you want to watch this choppiness from the sidelines, I can’t blame you. I started selling my silver miners last week, due to the obvious underperformance with Silver looking very strong.
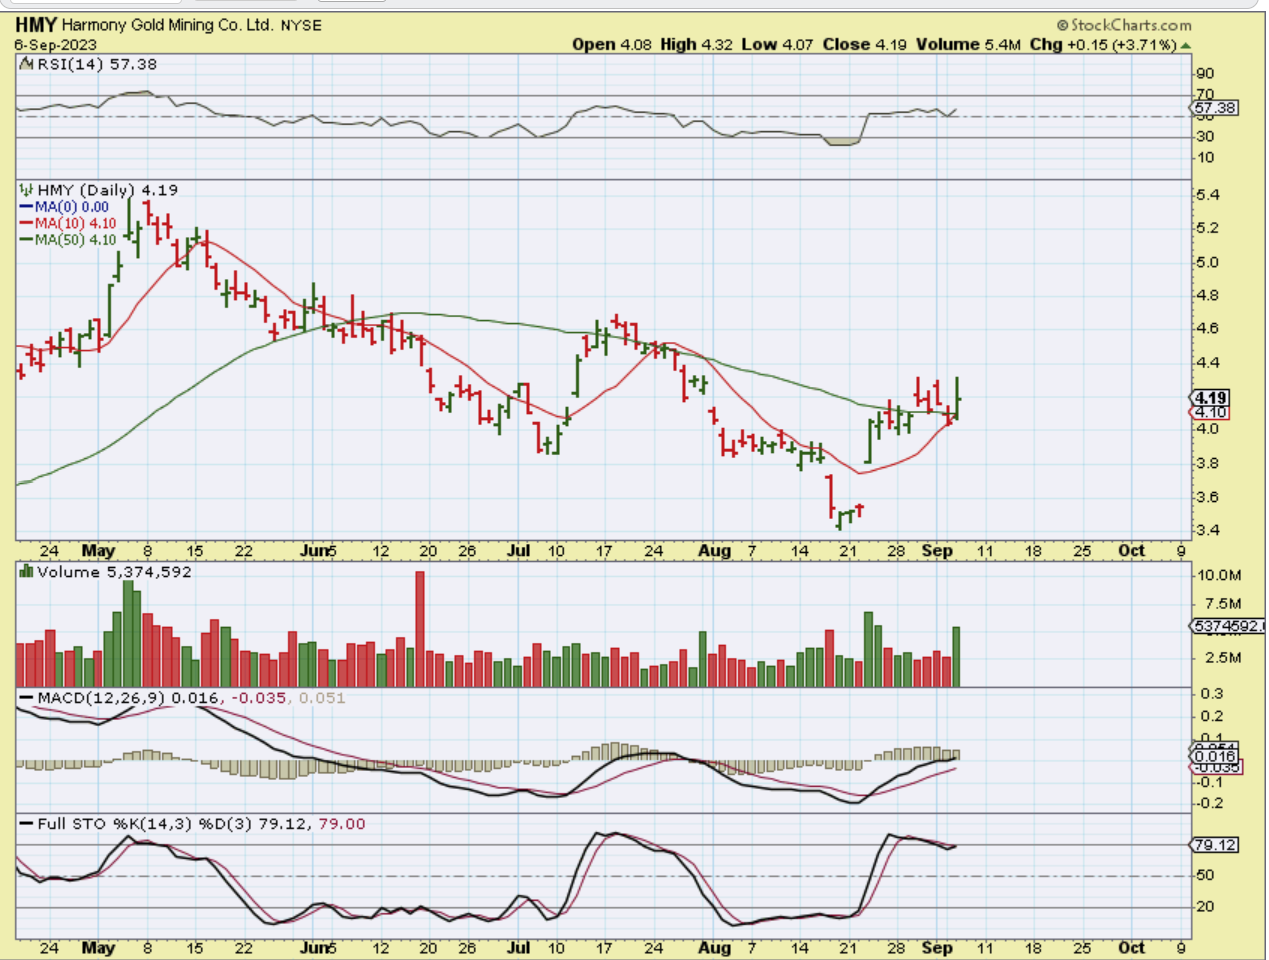
Some Miners like HMY still look ok, others like EXK just don’t, so deciding whether you would like to buy the dip or sell until the choppiness stops, etc is a personal decision. I was very confident when the lows were first in place that we would see some upside, but GDX failing at the 50sma when Gold and Silver were flying higher has made things a bit less bullish short term. The set ups seem more neutral. We need more time to see how this will play out. I will say this however…
.
I will say this however: In the strong 2016 rally that everyone remembers so well, you may recall that Gold bottomed in early Dec 2015 and Miners bottomed in mid Jan 2016 (over 1 month later). So we may be seeing Gold and Silver bottoming now while waiting for the USD to roll over, and GDX may still follow later. We DID see that in 2016, and when they caught up, it was a straight up relentless rally. My point is that it may be choppy and boring now, but we don’t want to completely go to sleep or give up just because Gold & Silver became strong out of the lows and Miners didn’t keep up. They certainly may play catch up soon. For now I personally may trade other areas, like the General Markets or Oil. Enjoy your Thursday trading!
.
~ALEX
And as a reminder
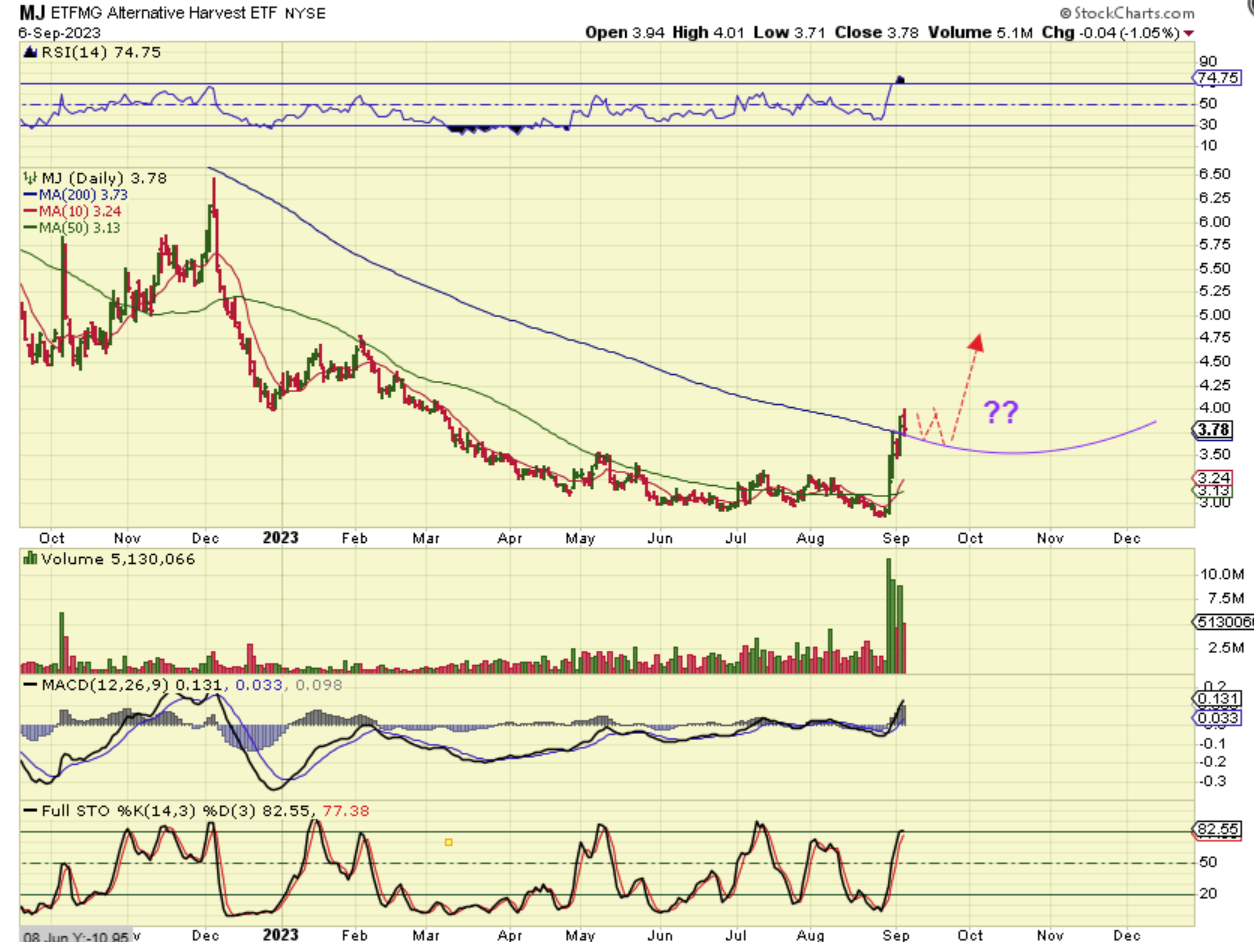
MJ still has this move out of the base that is worth watching (or for some, maybe trading it short term). Will it consolidate with a bull flag and go again? Or break down? It is worth watching. Uranium rallied too.