Wednesday August 9th – We Are Close!
.
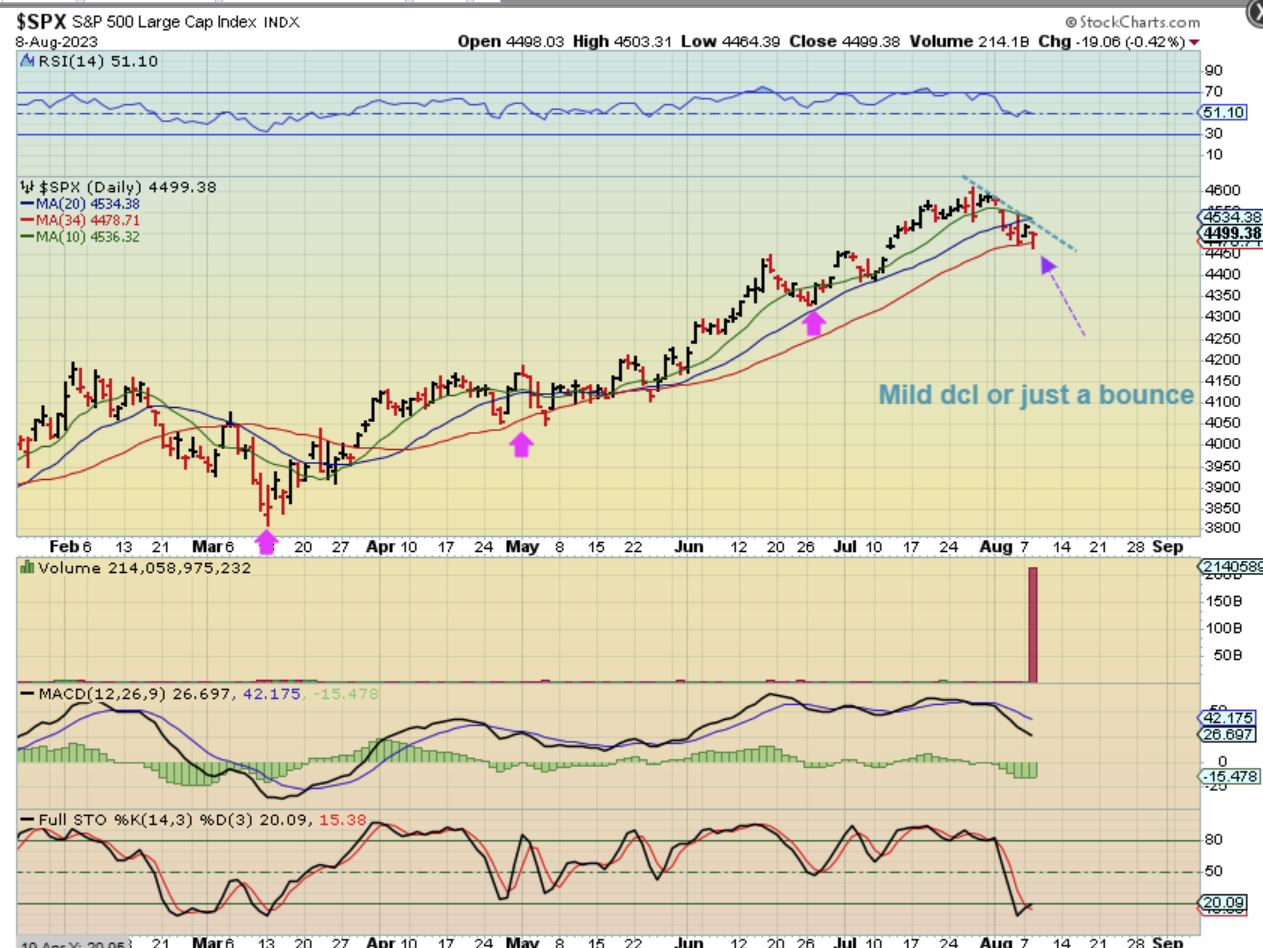
SPX – I was expecting a pullback and we do have one, but is it enough to be a dcl here? Or will we get the deeper dip and eventually an ICL? We are at an interesting point with this pullback, since it is finding support at the 34 sma and the stochastics became oversold. It is either going to break higher and put in a dcl here at support and continue higher as a strong bull run, or it should drop further and break this 34 & the 50sma.
.
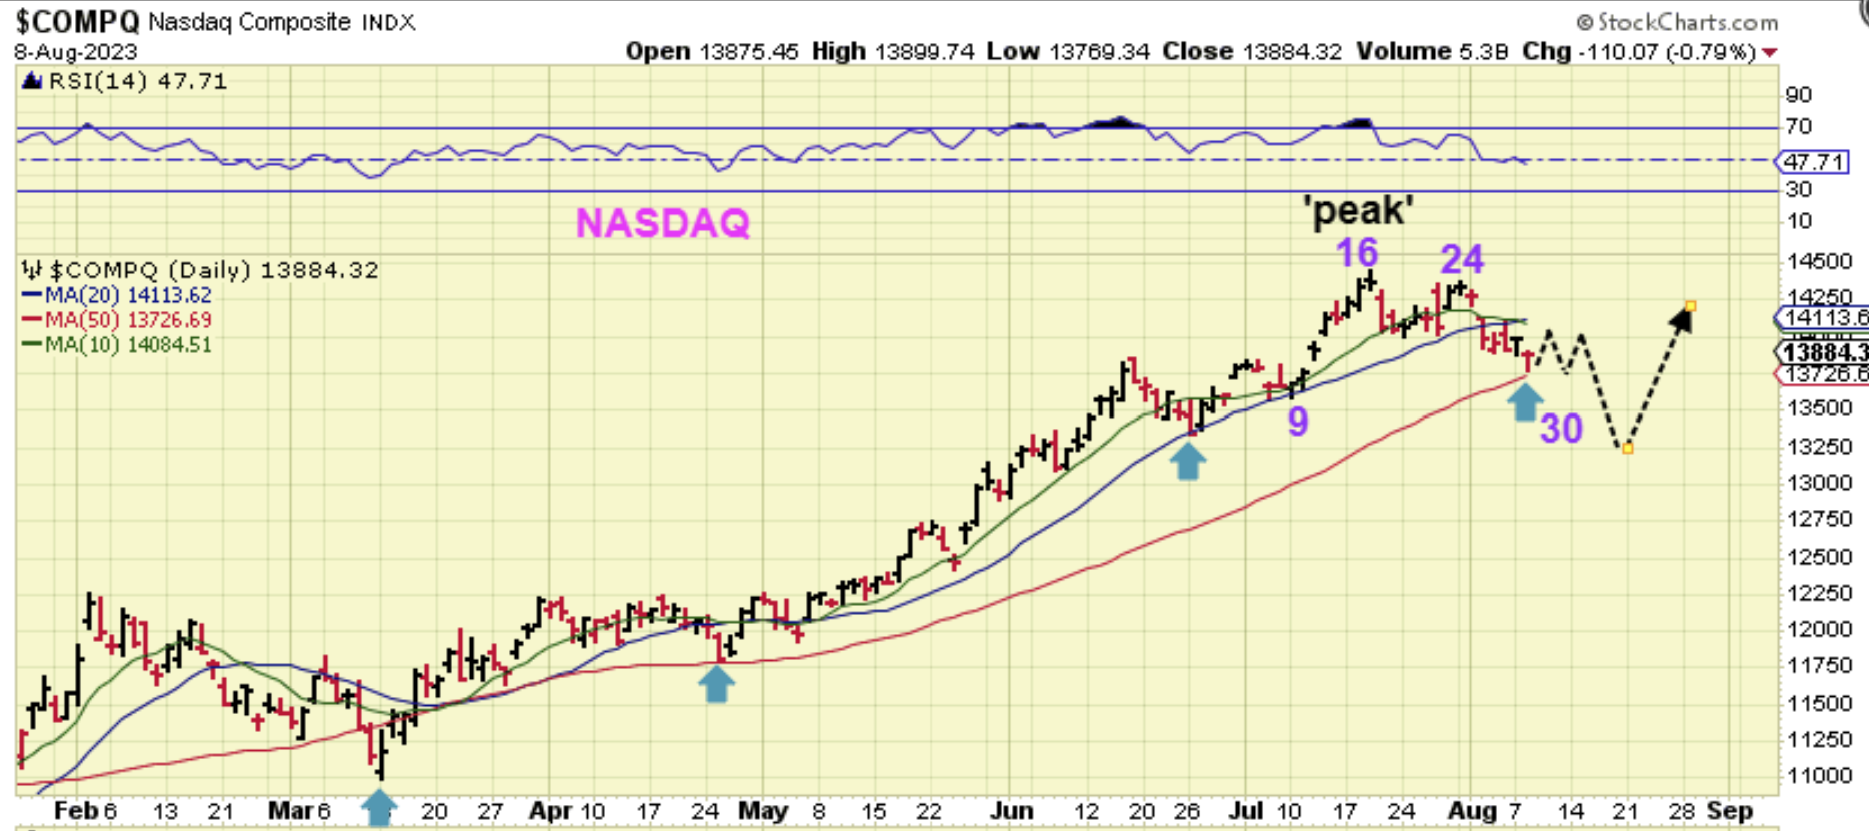
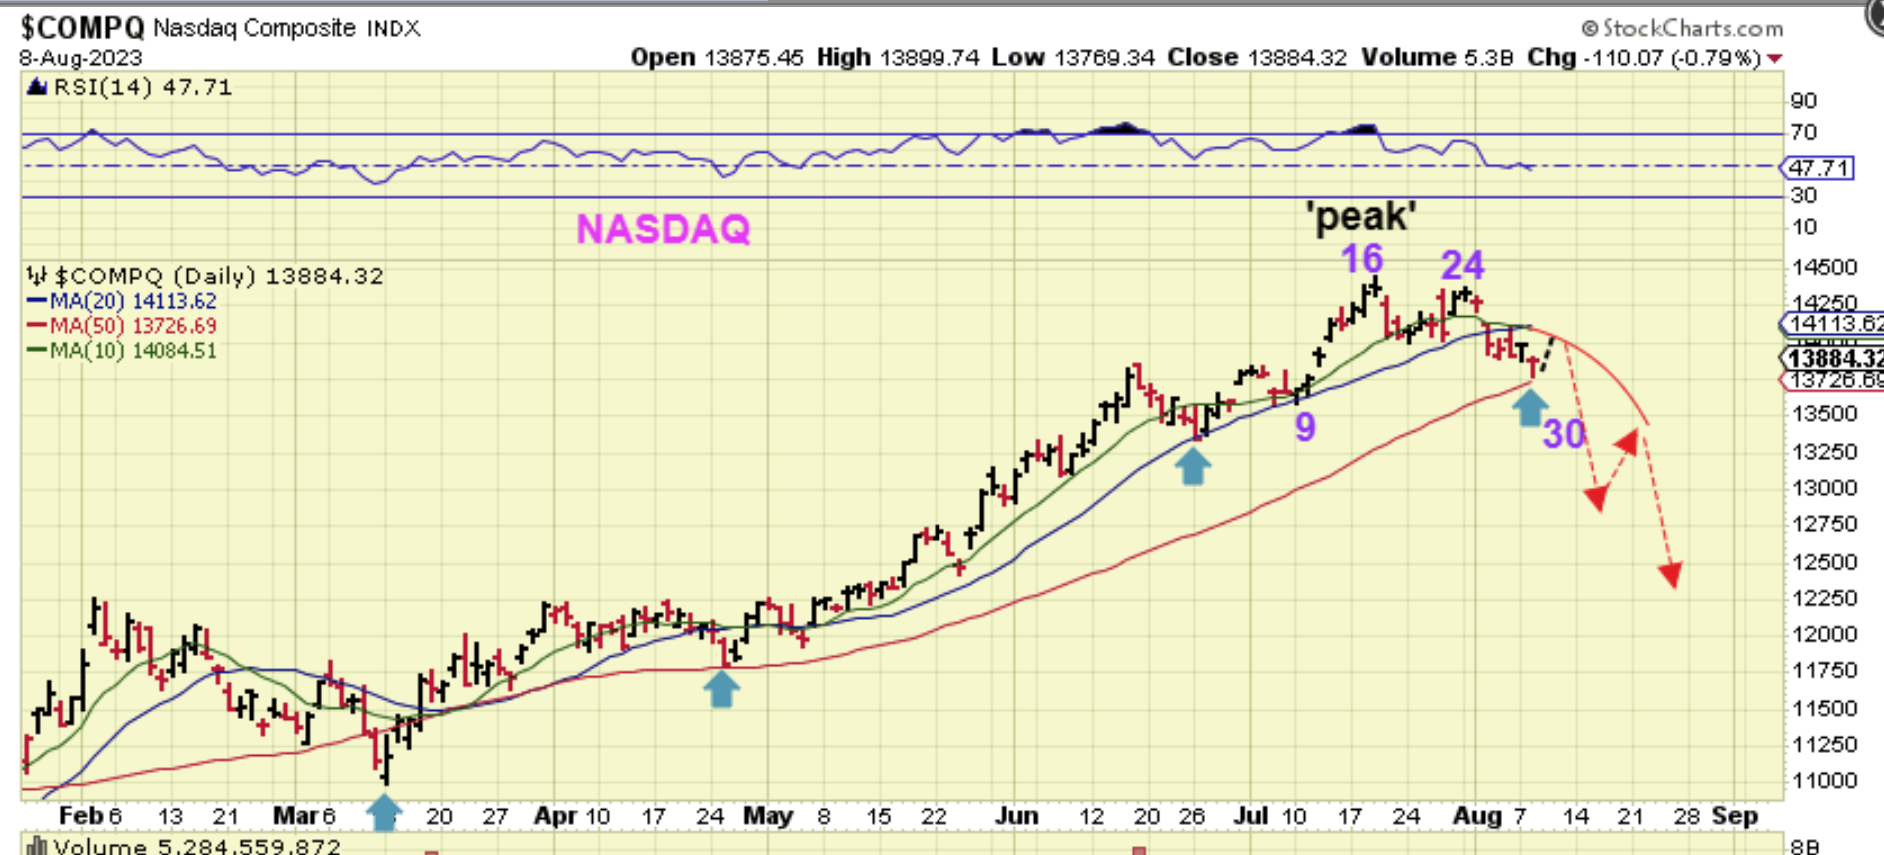
It is the same situation with The NASDAQ, which reversed right at the 50sma yesterday. Is this a day 30 dcl or will it be 40+ days long and bounce & roll over? Let me show you the ideas…
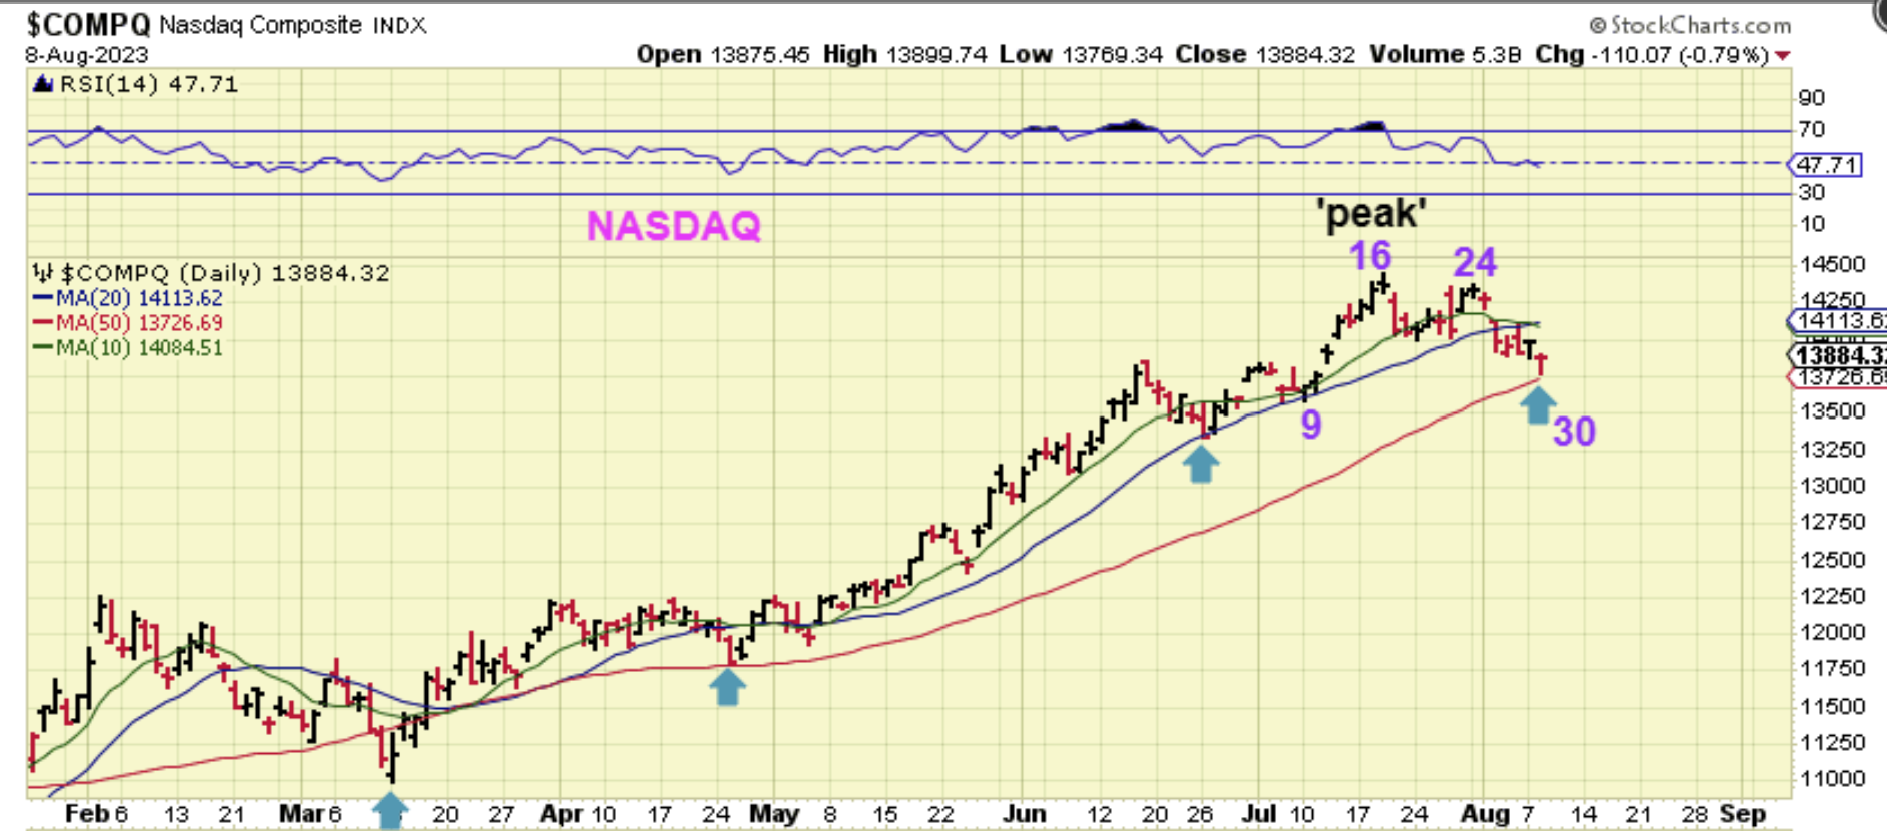
The NASDAQ can bounce here, yet still be capped by the 10 & 20sma and drop even lower. Or…
.
THE NASDAQ could do a very small bounce Wednesday and then sell off on the inflation numbers Thursday and Friday. The last ICL was in March and that was 5 months ago. They often come every 6-7 months, which is September/October. Sentiment was extremely high ( it has fallen back somewhat now).
.
SAME CHART: Sentiment was extremely high, but it has fallen back a little now with this dip, so one more run higher isn’t out of the question. I do see that symmetry-wise, this dip is deeper than the June dip and that usually indicates further weakness. You can short a bounce with a stop at the 10 & 20sma. So far I shorted this drop twice with SQQQ & SOXS, but I did not hold for more than 2 days at a time. It is very hard to short a bull, since Buyers keep stepping in. It becomes a choppy top.
.
This is a clue going forward though: We have a day 16 peak, so this is still R.T. and can push higher, but if it continues to break down, it will then become L.T. at day 33, so if price gets capped at the overhead resistance and it drops again, we are likely going lower. You can short a tag of the 10sma with a tight stop.
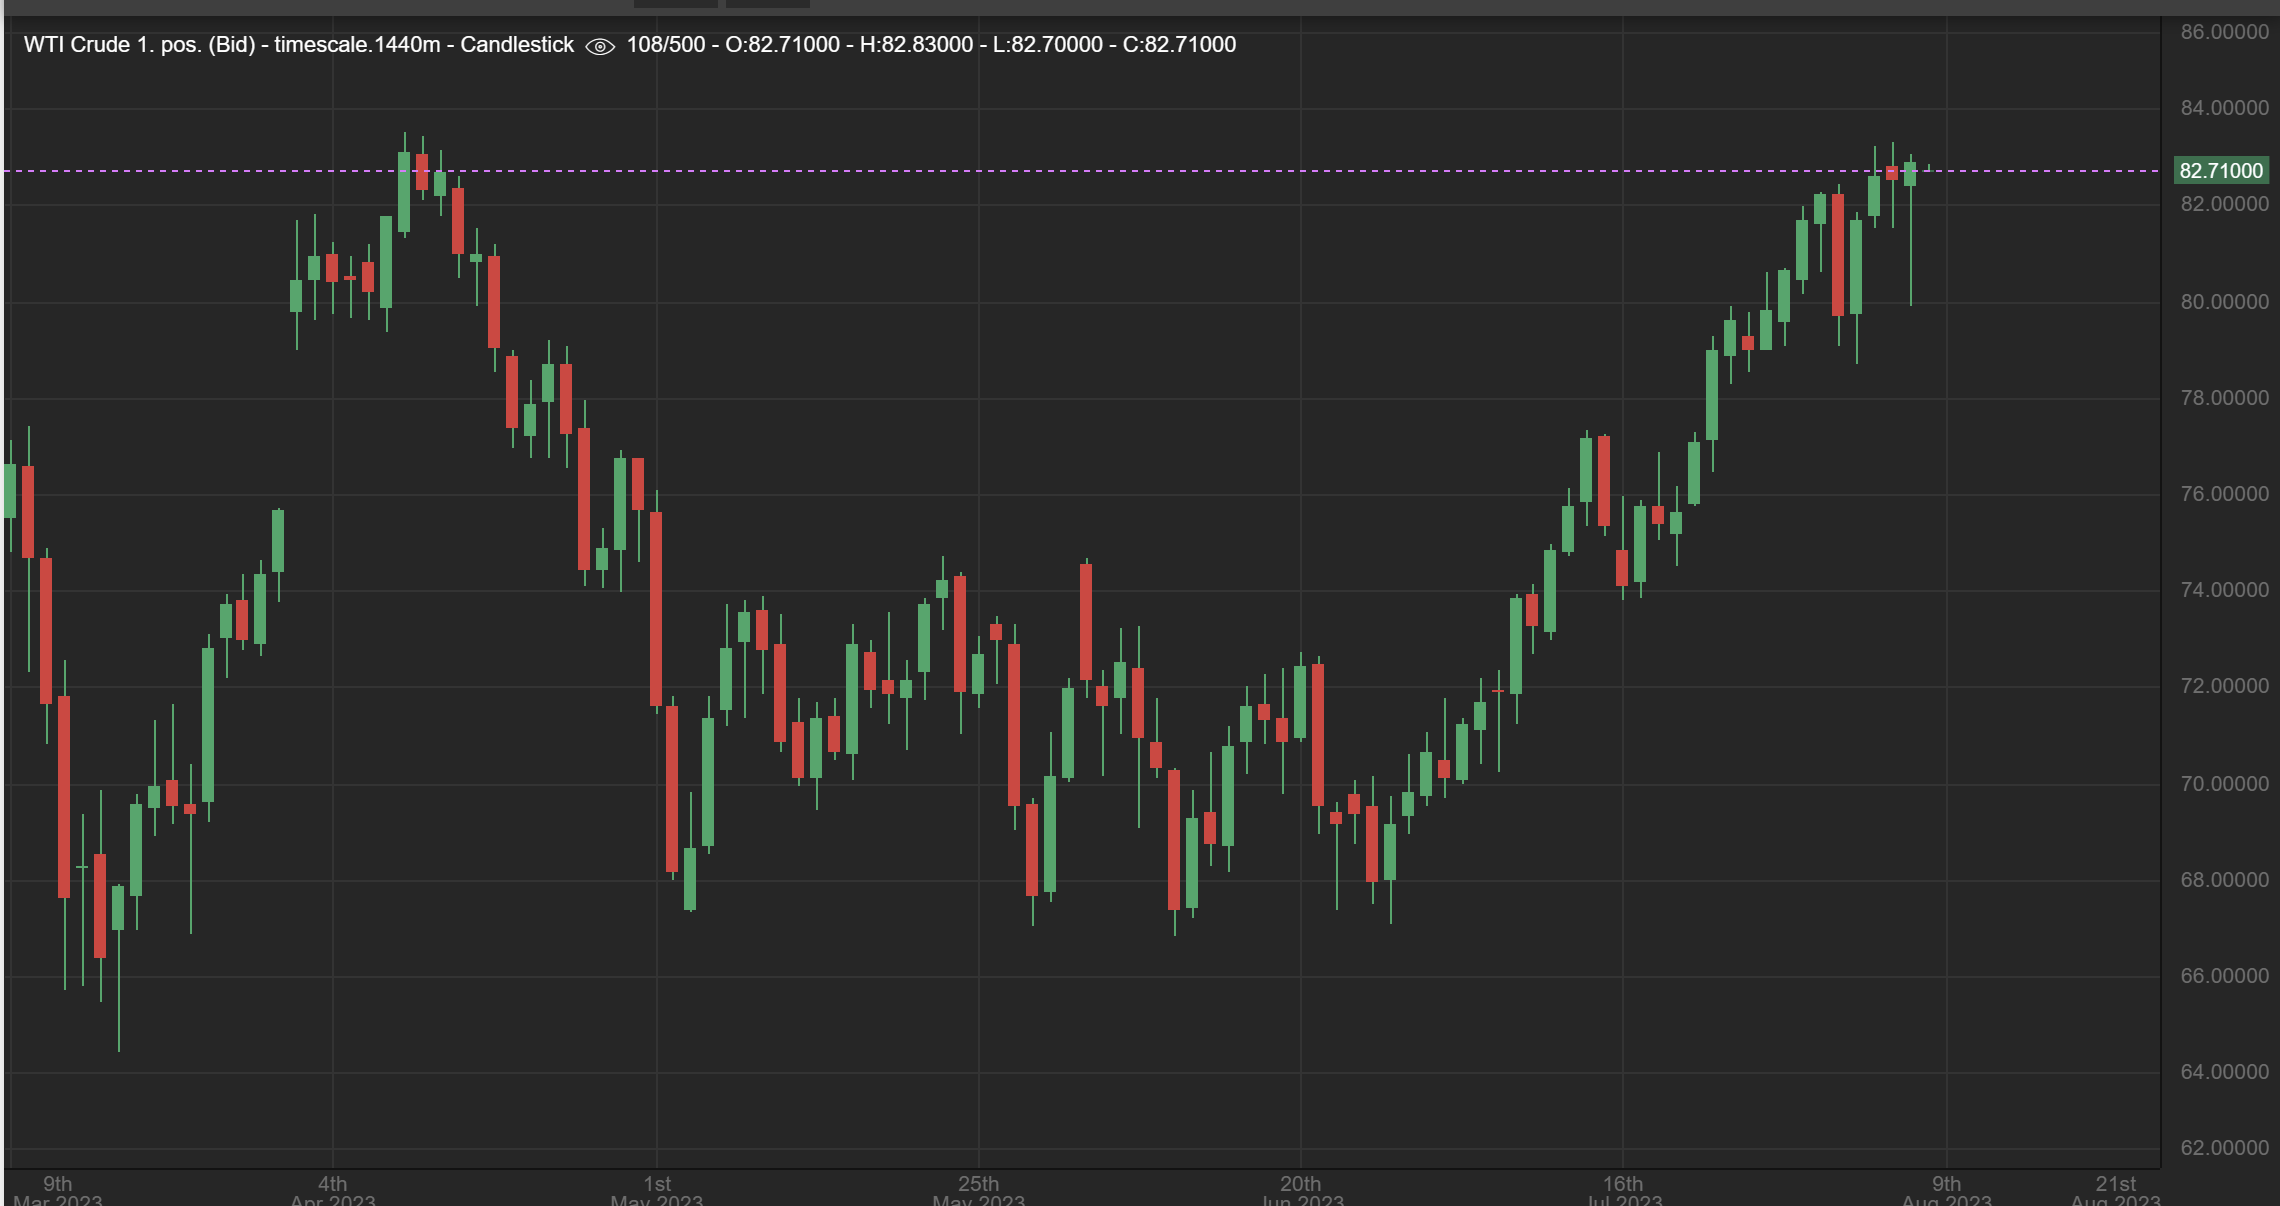
WTIC dropped sharply and recovered. It continues to find support at the 13 sma. I didn’t notice Oil dropping that much in real time, so I wondered if it really did fall that much (over $3) ?, or did this chart make an error? I looked at another charting service and…

OIL really did drop that much and recovered. I think that OIL is trying to break out above this prior high with that price action. Oil & Oil stocks have been strong lately.
.
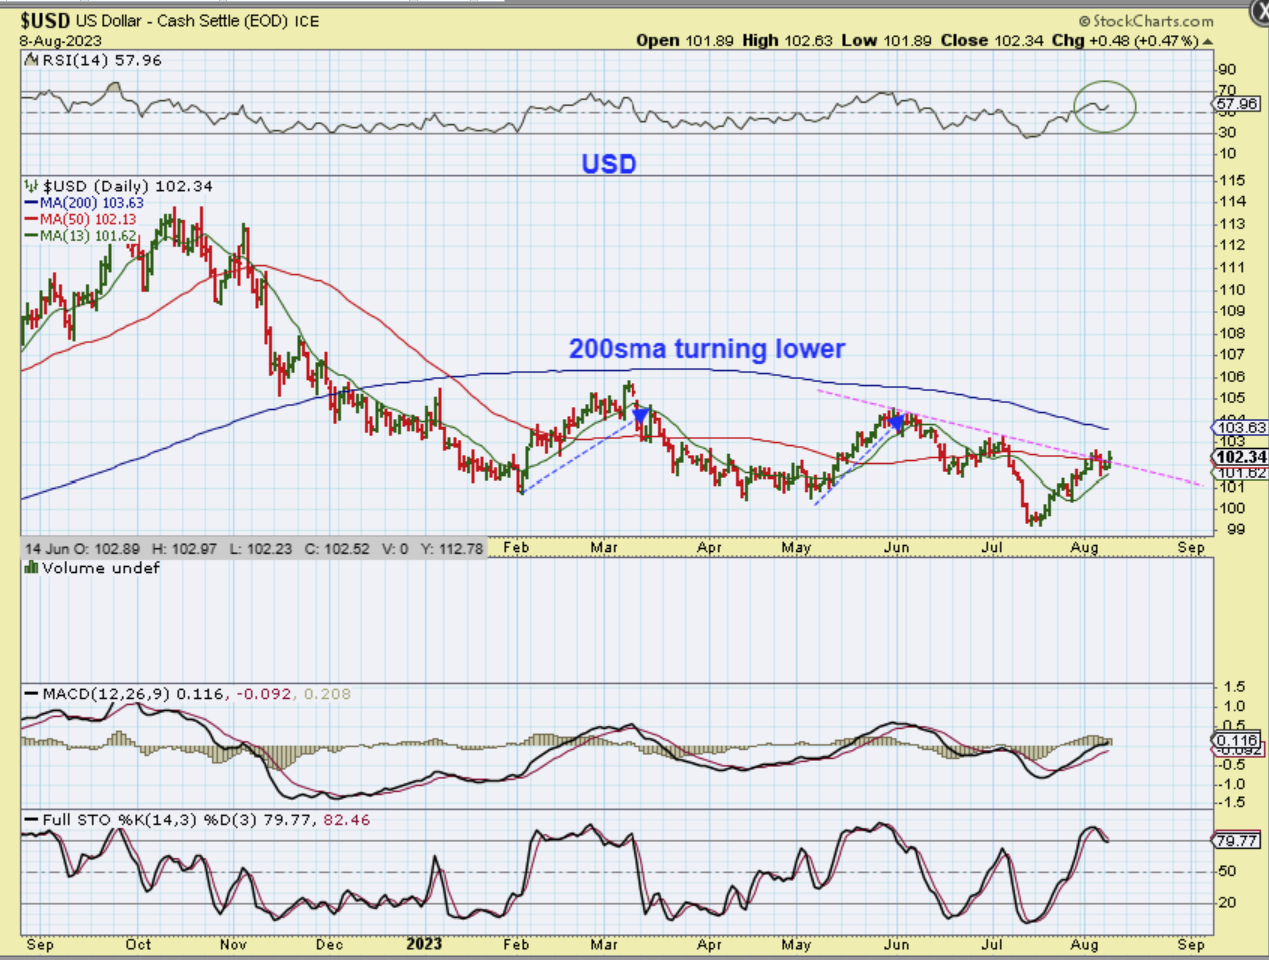
THE USD pushed above the 50sma and the RSI is above the 50% after a back test of 50%, so this actually still reads as bullish until it rolls over again. Notice the green 13 sma and you’ll see that price held there twice on this run. The 200sma has turned lower and that is showing weakness in the long term, but short term the USD has looked bullish.
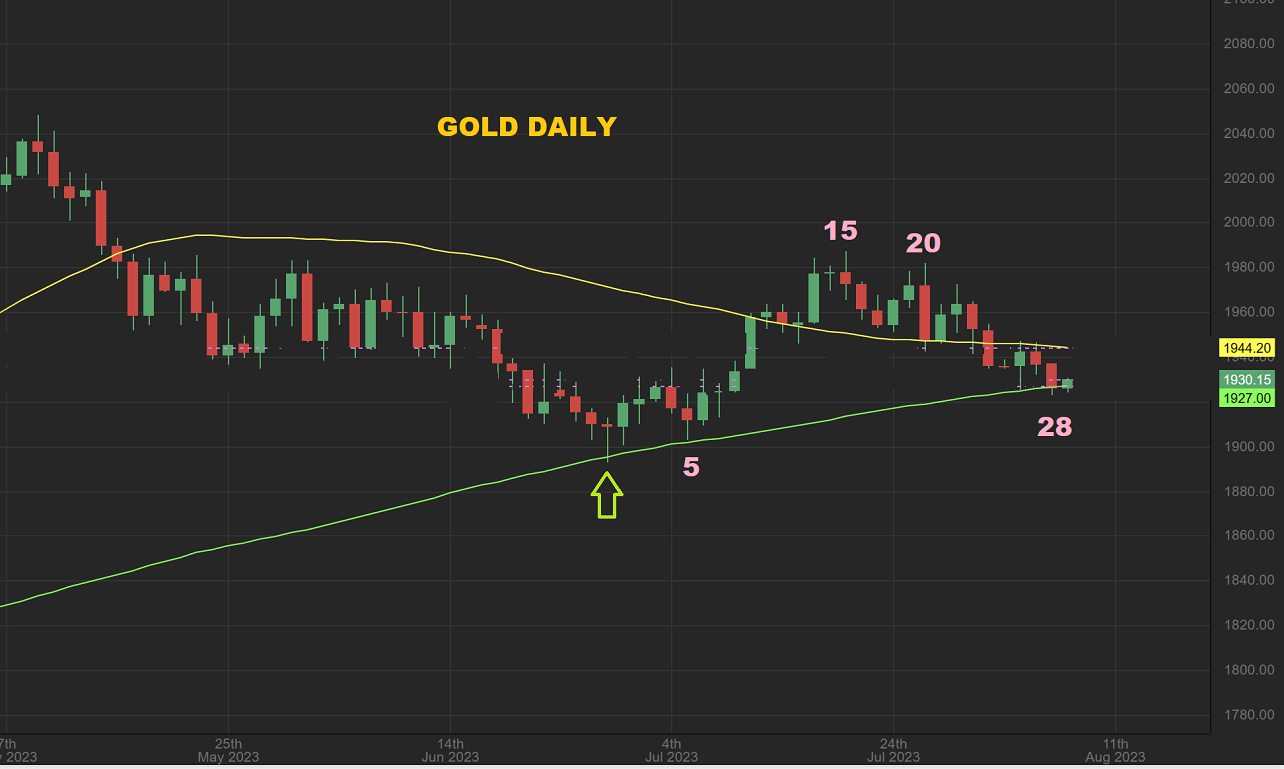
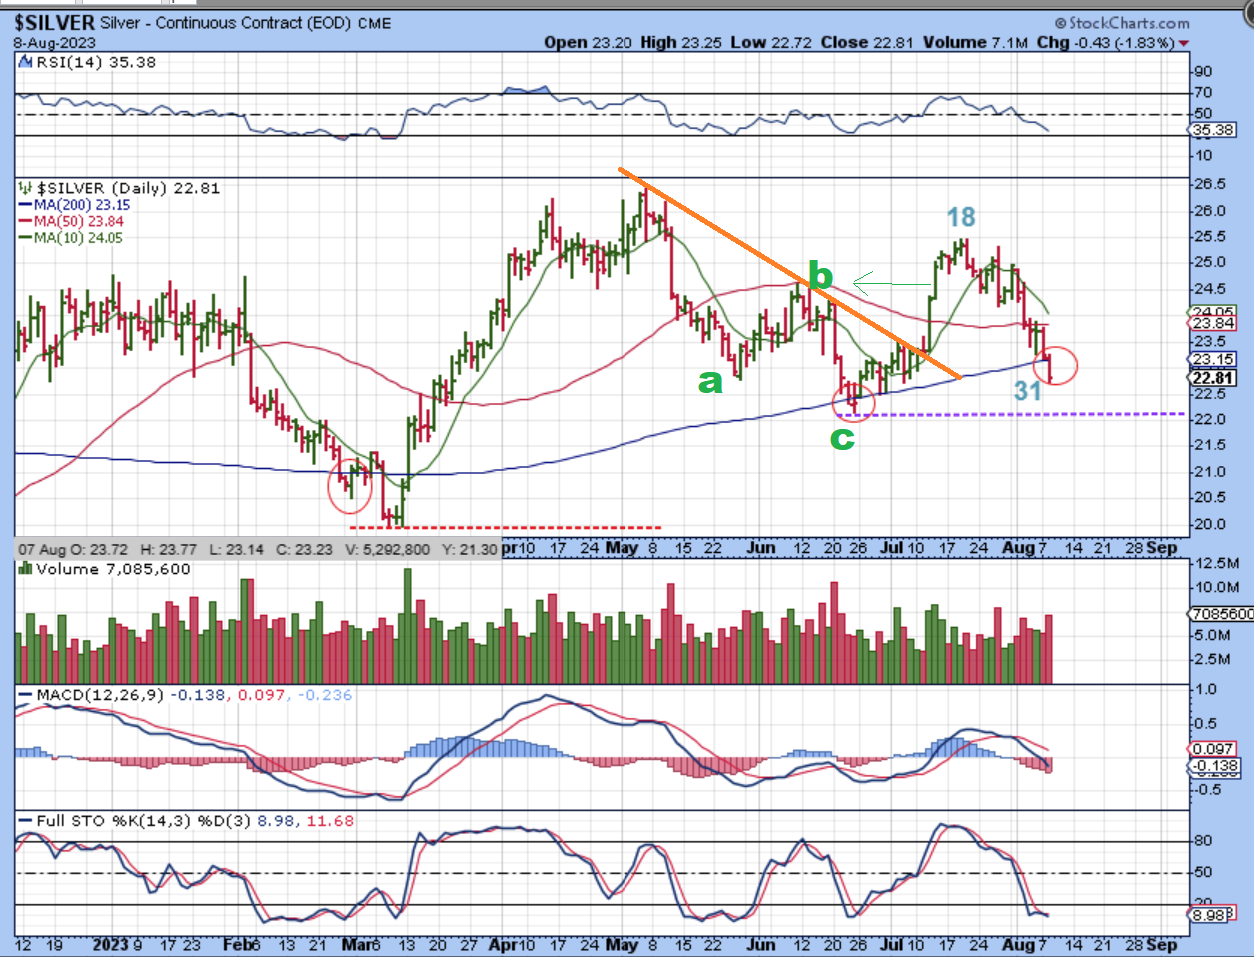
GOLD has a day 28 low and day 29 is Wednesday (The green candle is Wednesday morning). A dcl can form at any time here, because buyers can step in in a Bull run, but usually we see them around day 32. Thursday is day 30 and Friday is day 31. We do see inflation data released on both of those days.
SILVER dropped below the 200sma on Tuesday, but this could recover and become a ‘shake out’. Silver bottomed below the 200sma in June before Gold did, so Silver is on day 32 Wednesday. When I look at Silver…
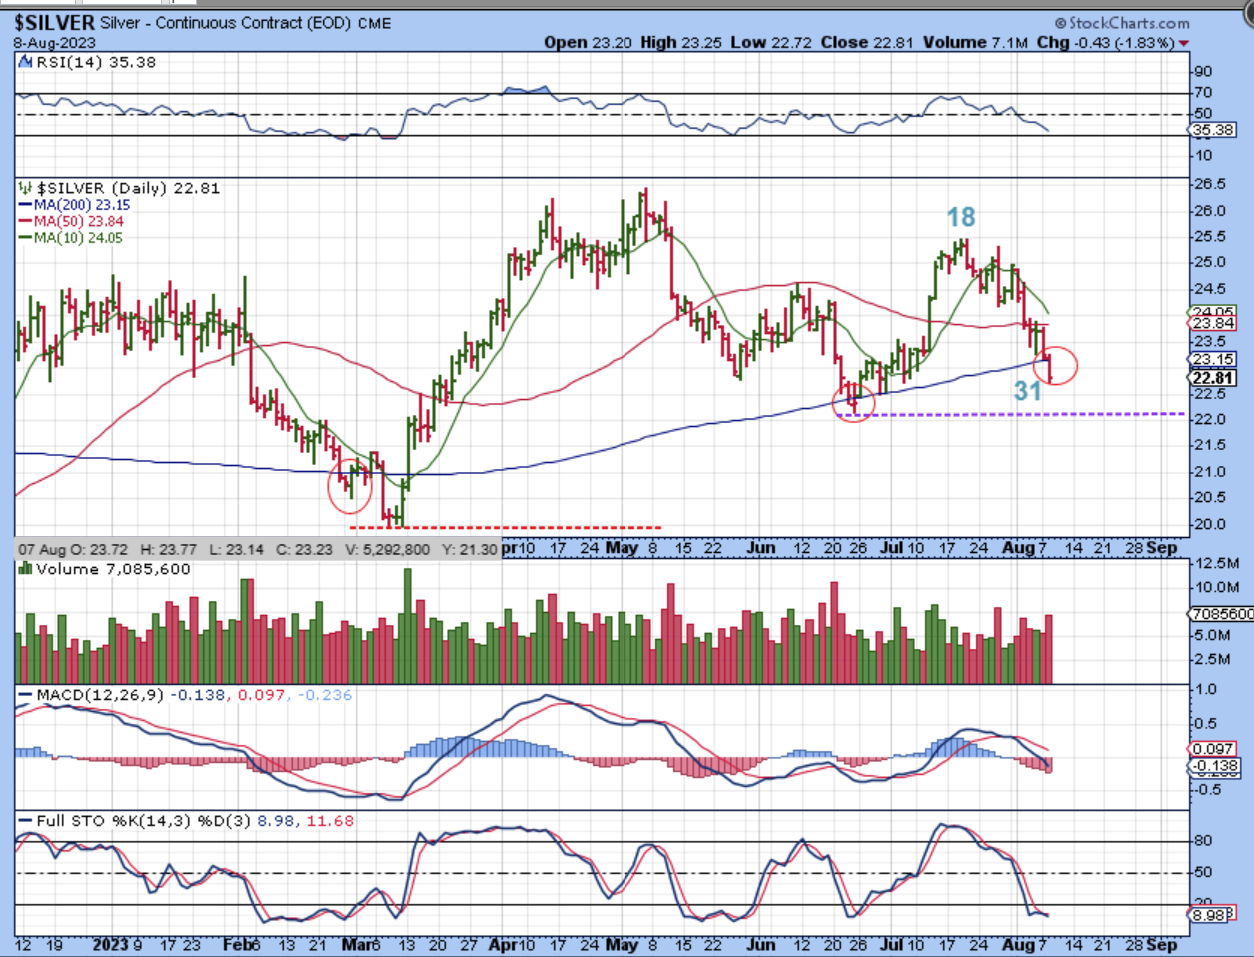
.
When I look at Silver, I still see that it did give signs of putting in an ICL in June when it
1. Put in an a-b-c drop
2. It broke the orange downtrend line and the broke above the 50sma.
3. It then peaked on day 18, which was well above the June highs. Higher highs were put in place, so we need this higher low to hold, but so far it has been undoing all of those gains. We are on day 32.
.
GDX did make a new low by slightly breaking the June lows and recovering. I really only use cycles on the Miners to give me a ‘count’ and I use it for ‘timing’ the length of a daily cycle. I feel that the Miners exaggerate the moves and breaking under Golds ICL & recovering could be a shake out or a stop run. I saw several Miners go green yesterday…
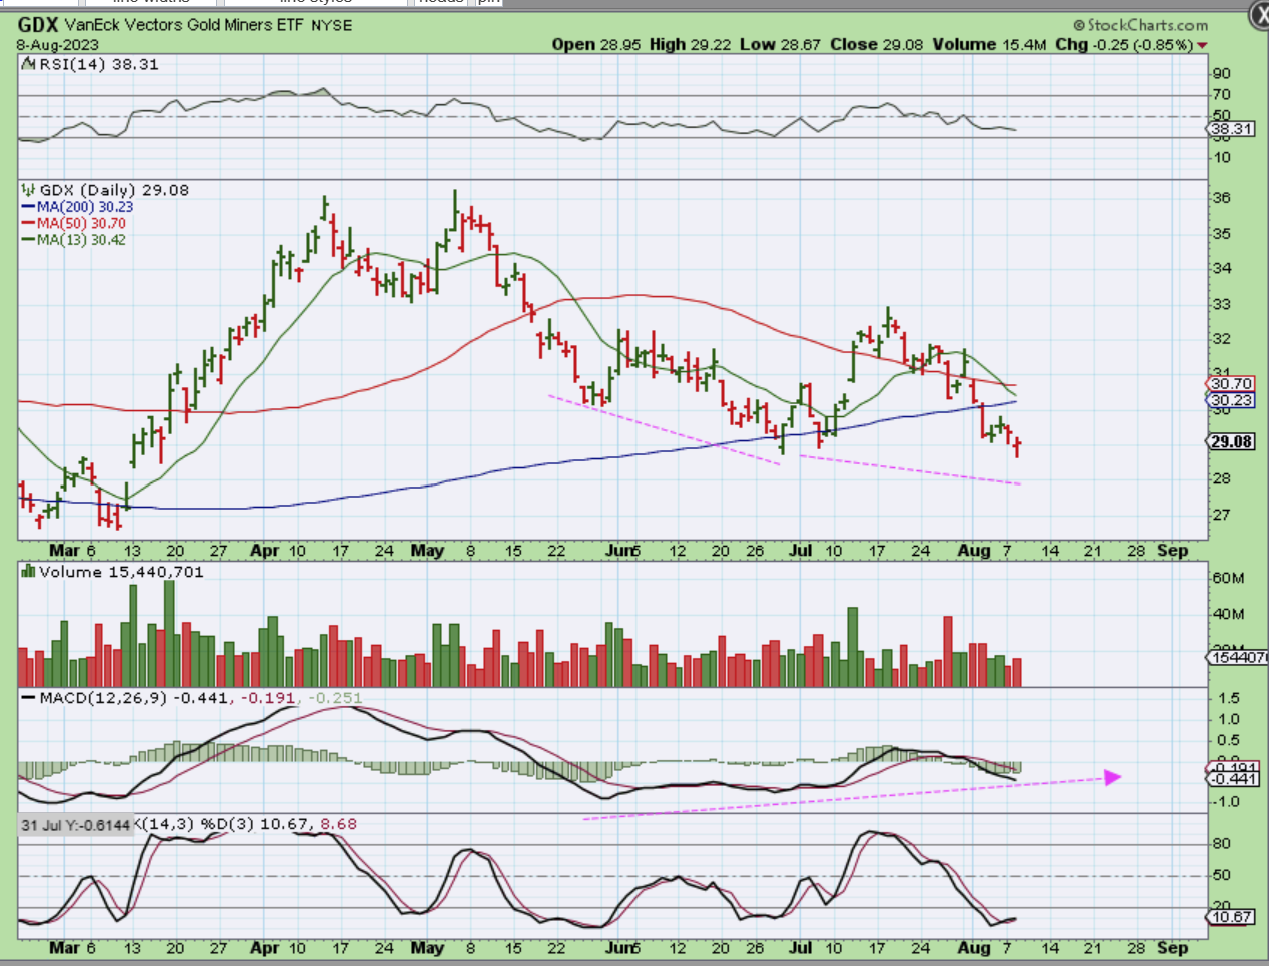
.
I saw several Miners go green yesterday, so I posted this when Gold & Silver were down. With Miners going from Red to Green yesterday, it feels like Buyers are stepping in on the dips. This doesn’t feel like a normal sell off where miners drop fiercely and sell off 10% a day.

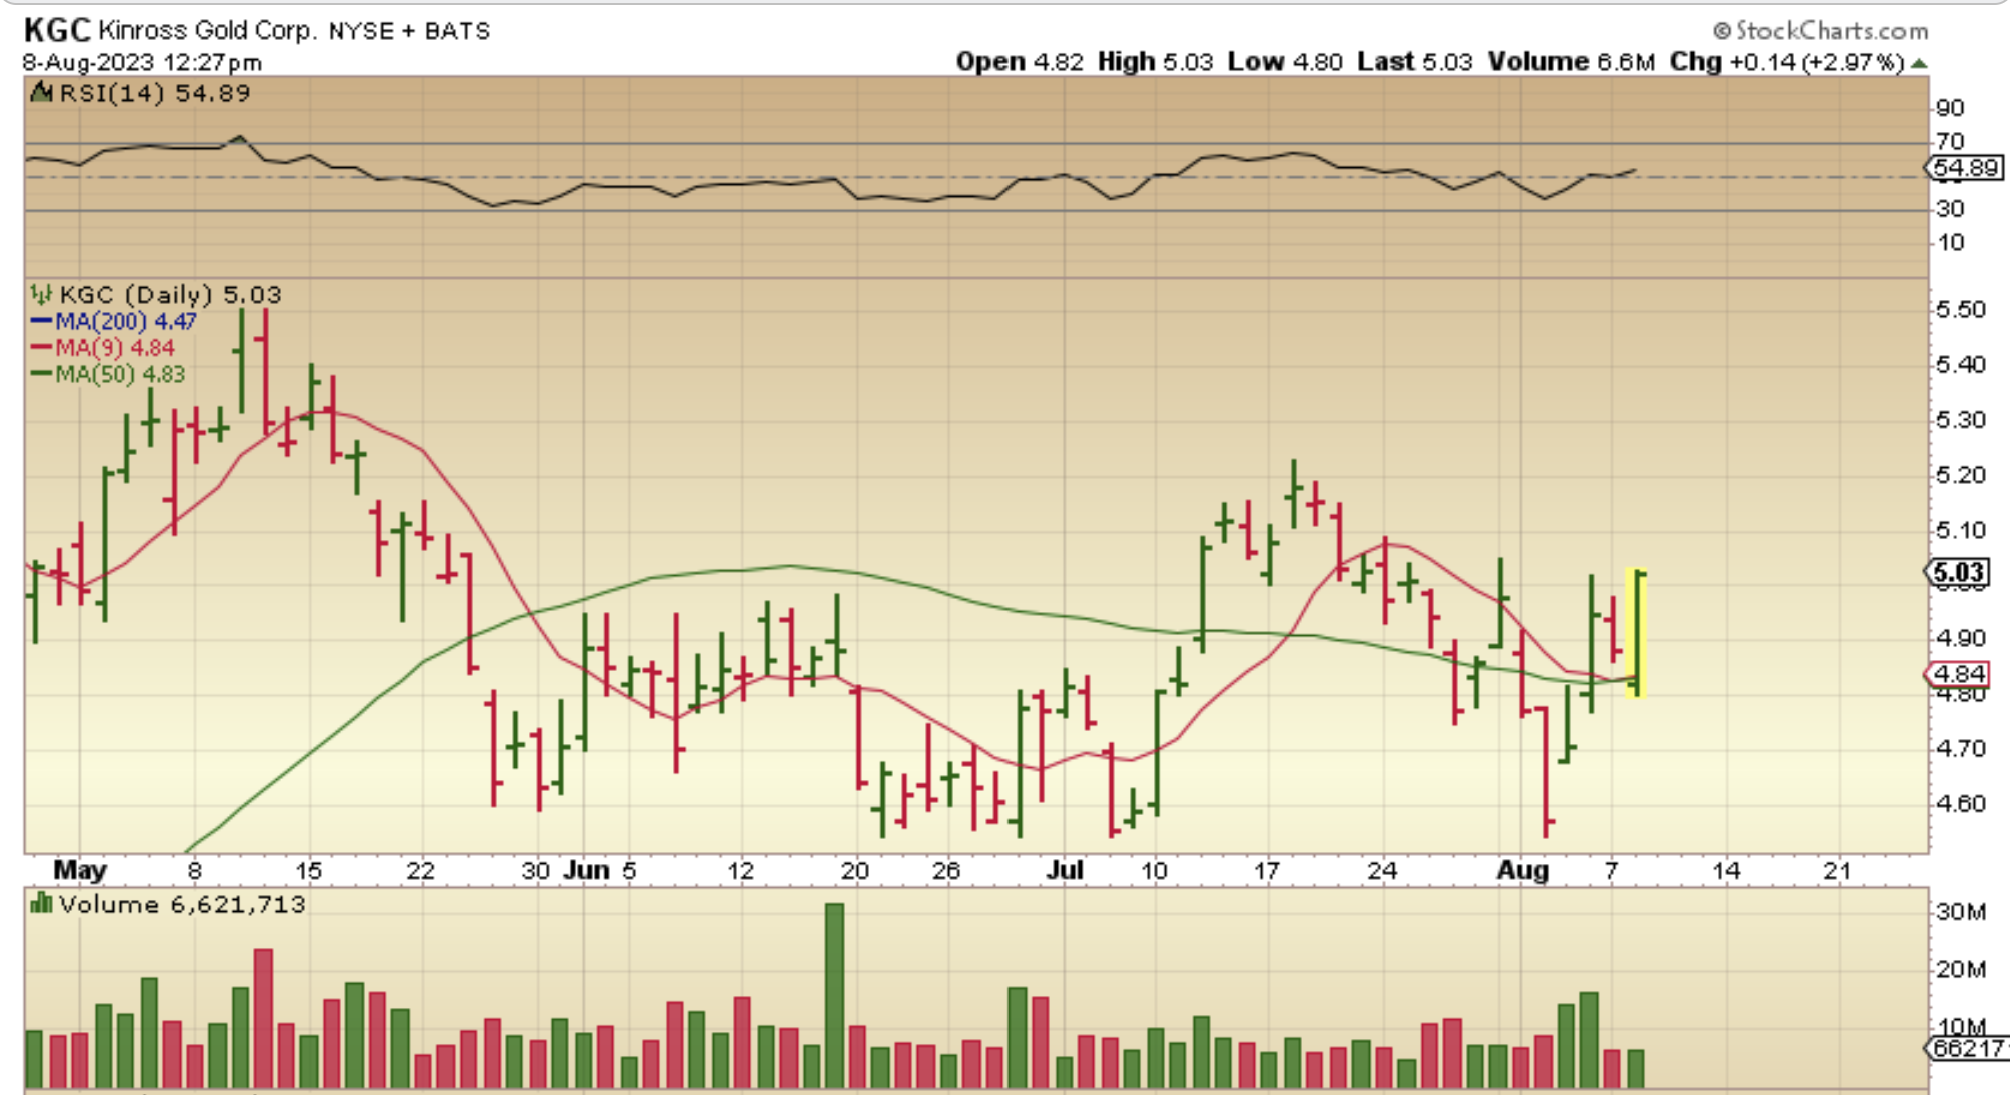
KGC actually continues to look bullish when it dropped to the 50sma with Gold down, and then reversed higher, as seen here.
.
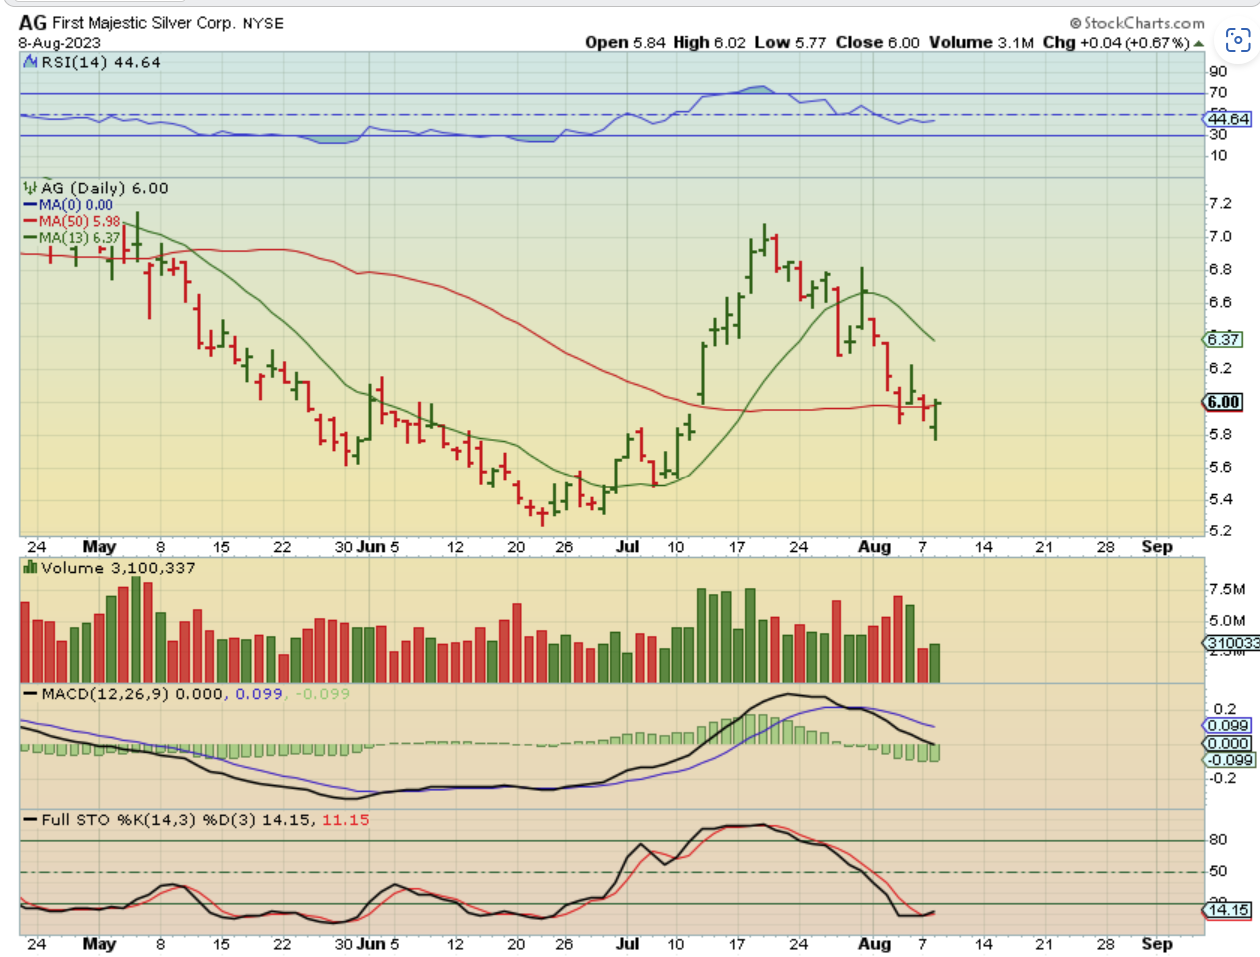
AG – Again, Silver was down quite a bit yesterday, so you would think that if AG Lost the 50sma, it would flush lower and everyone would bail out, right? Miners usually drop 10% in these situations, but AG recovered that 50sma with Silver still selling off, and then went green? FSM dropped and went green too, so This Silver sell off does feel different. It feels like we are close to the sell off lows.
.
There is no major data release today, so we’ll see what happens on Wednesday with the various market sectors. Thursday and Friday we will see CCI and PPI Numbers and that could cause the markets to go either way, especially where the ‘timing’ could be ripe for a change. It ‘feels’ like we are close with the selling of some of the Miners possibly drying up. Enjoy your Wednesday trading!
.
~ALEX
.
I posted this in the comments yesterday, so I just wanted to put it here in case anyone works all day and can’t read those comments.
.
PLX released earnings Monday and dropped and recovered in a big way. It was now pushing on the 50sma Tuesday, and if it closed there that would be a bullish break out. If not, it is still a post – earnings reaction. (Biotech too, so it may ignore a Nasdaq sell down).
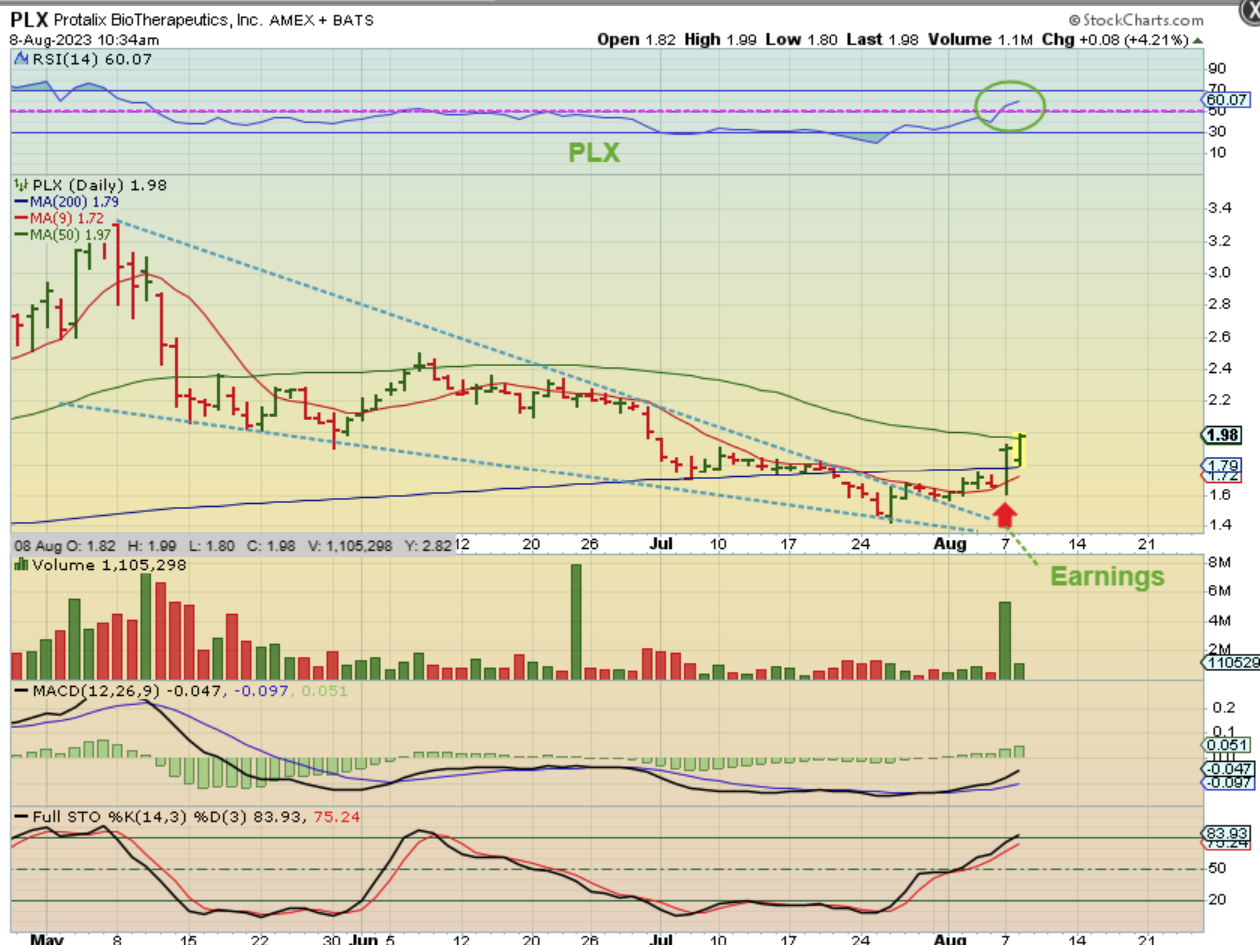
PLX – 2 hrs into trading I pointed out that it was pulling back, but still not an UGLY set up. It remains a bullish break above the 200sma and may crawl to break and continue higher.
.
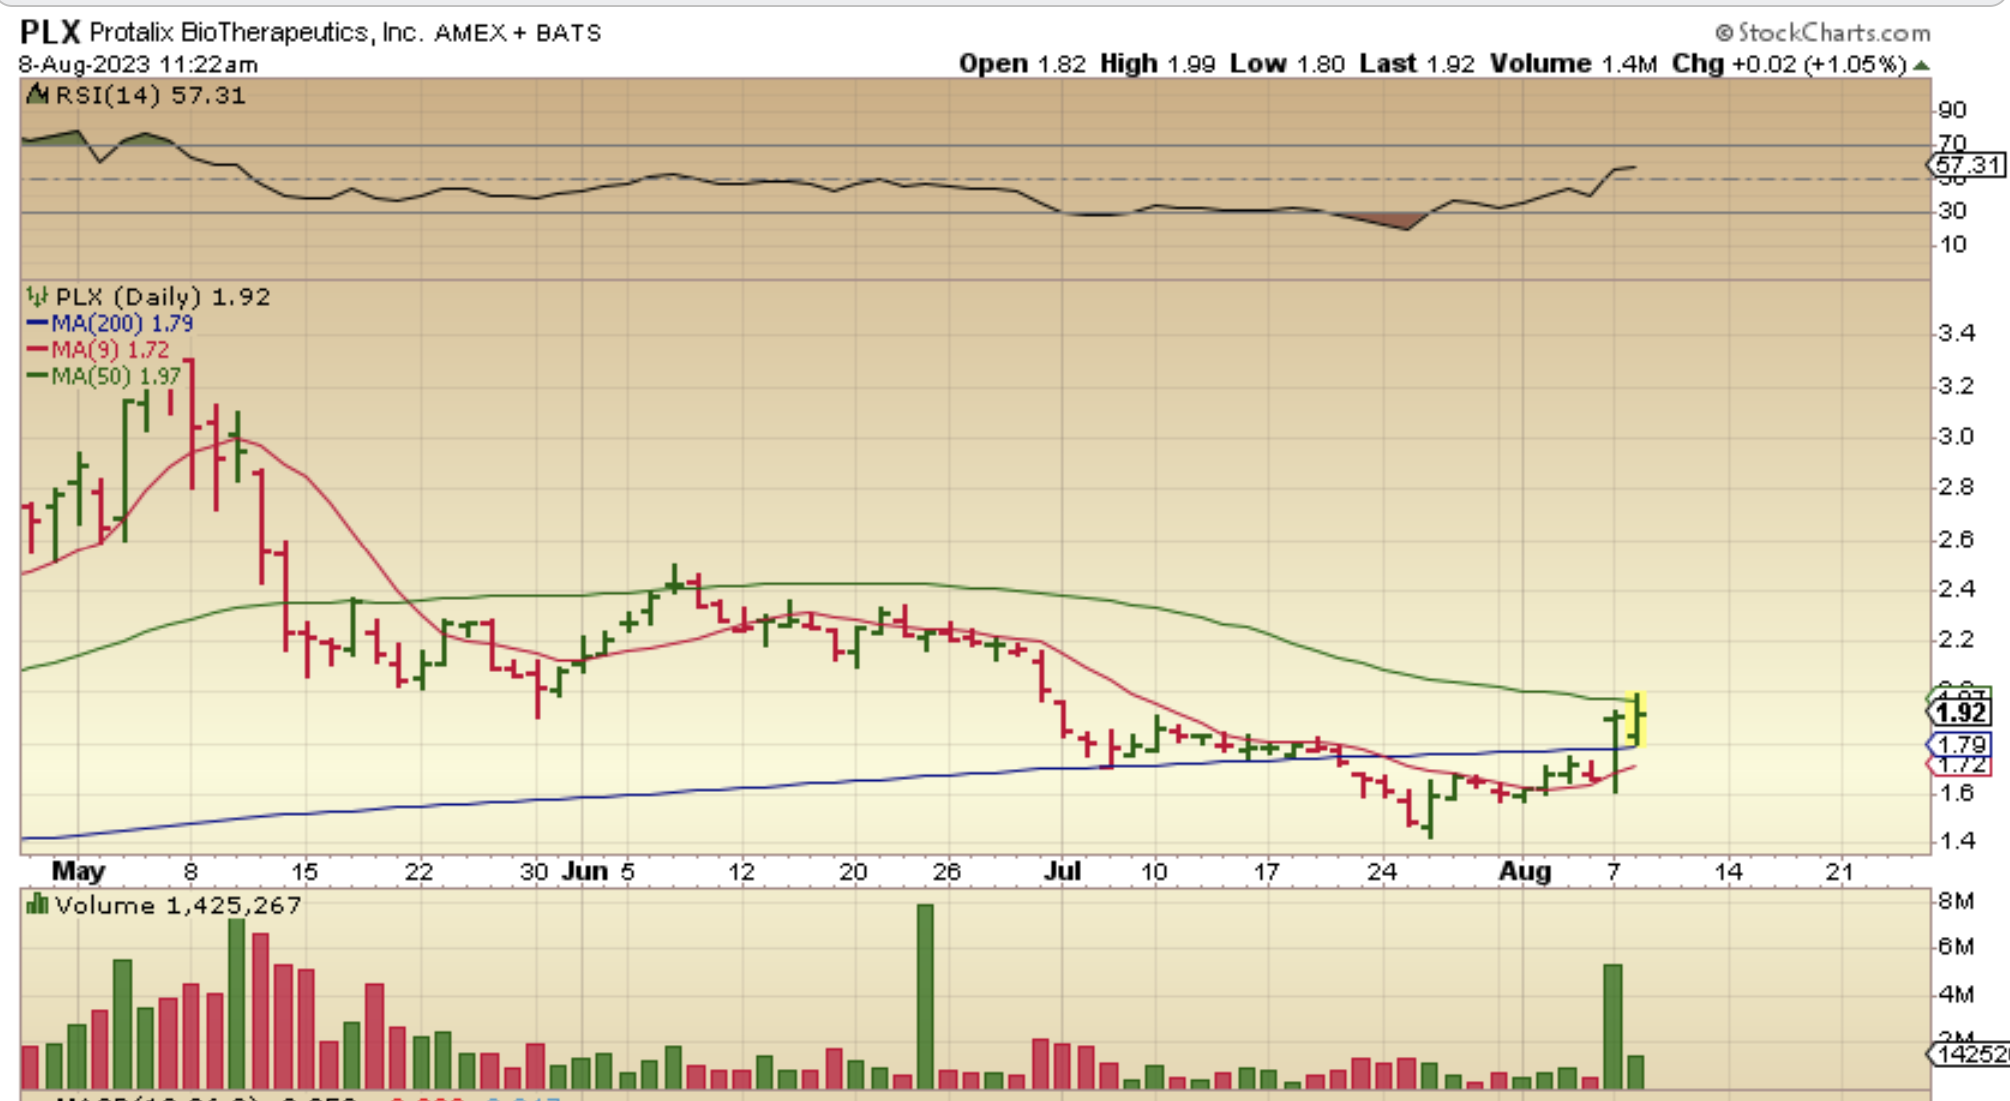
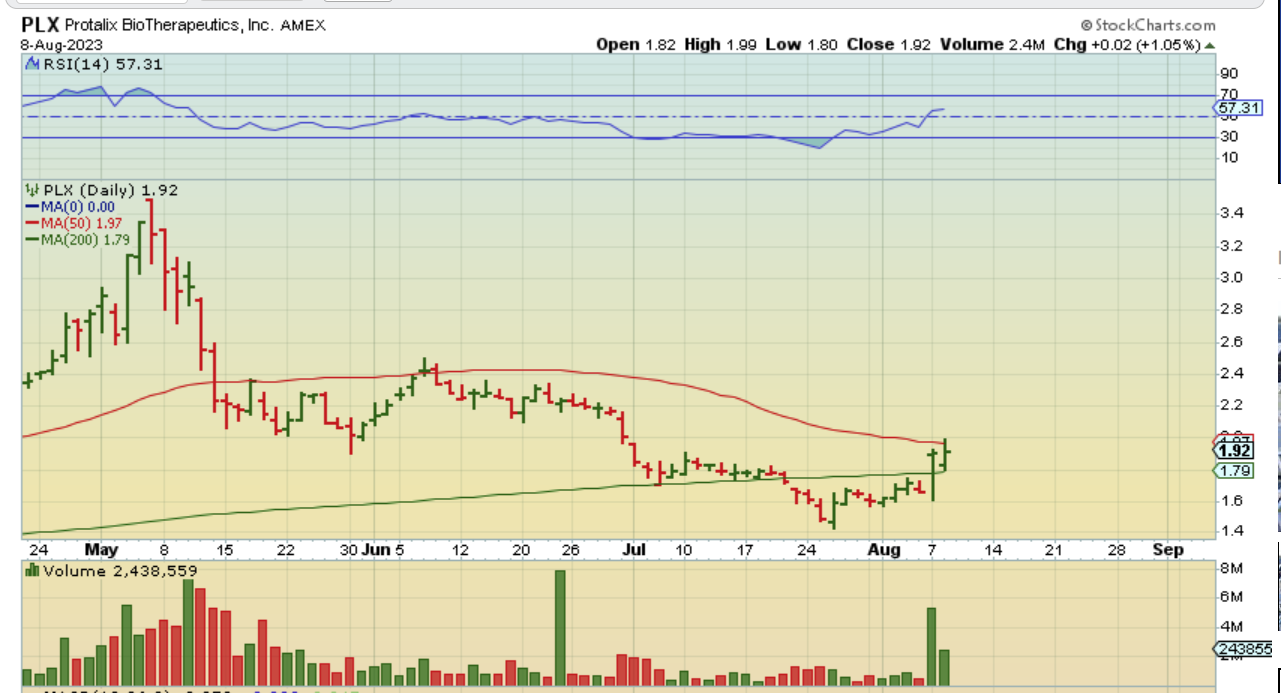
PLX – It closed in this area, and still looks good to me.
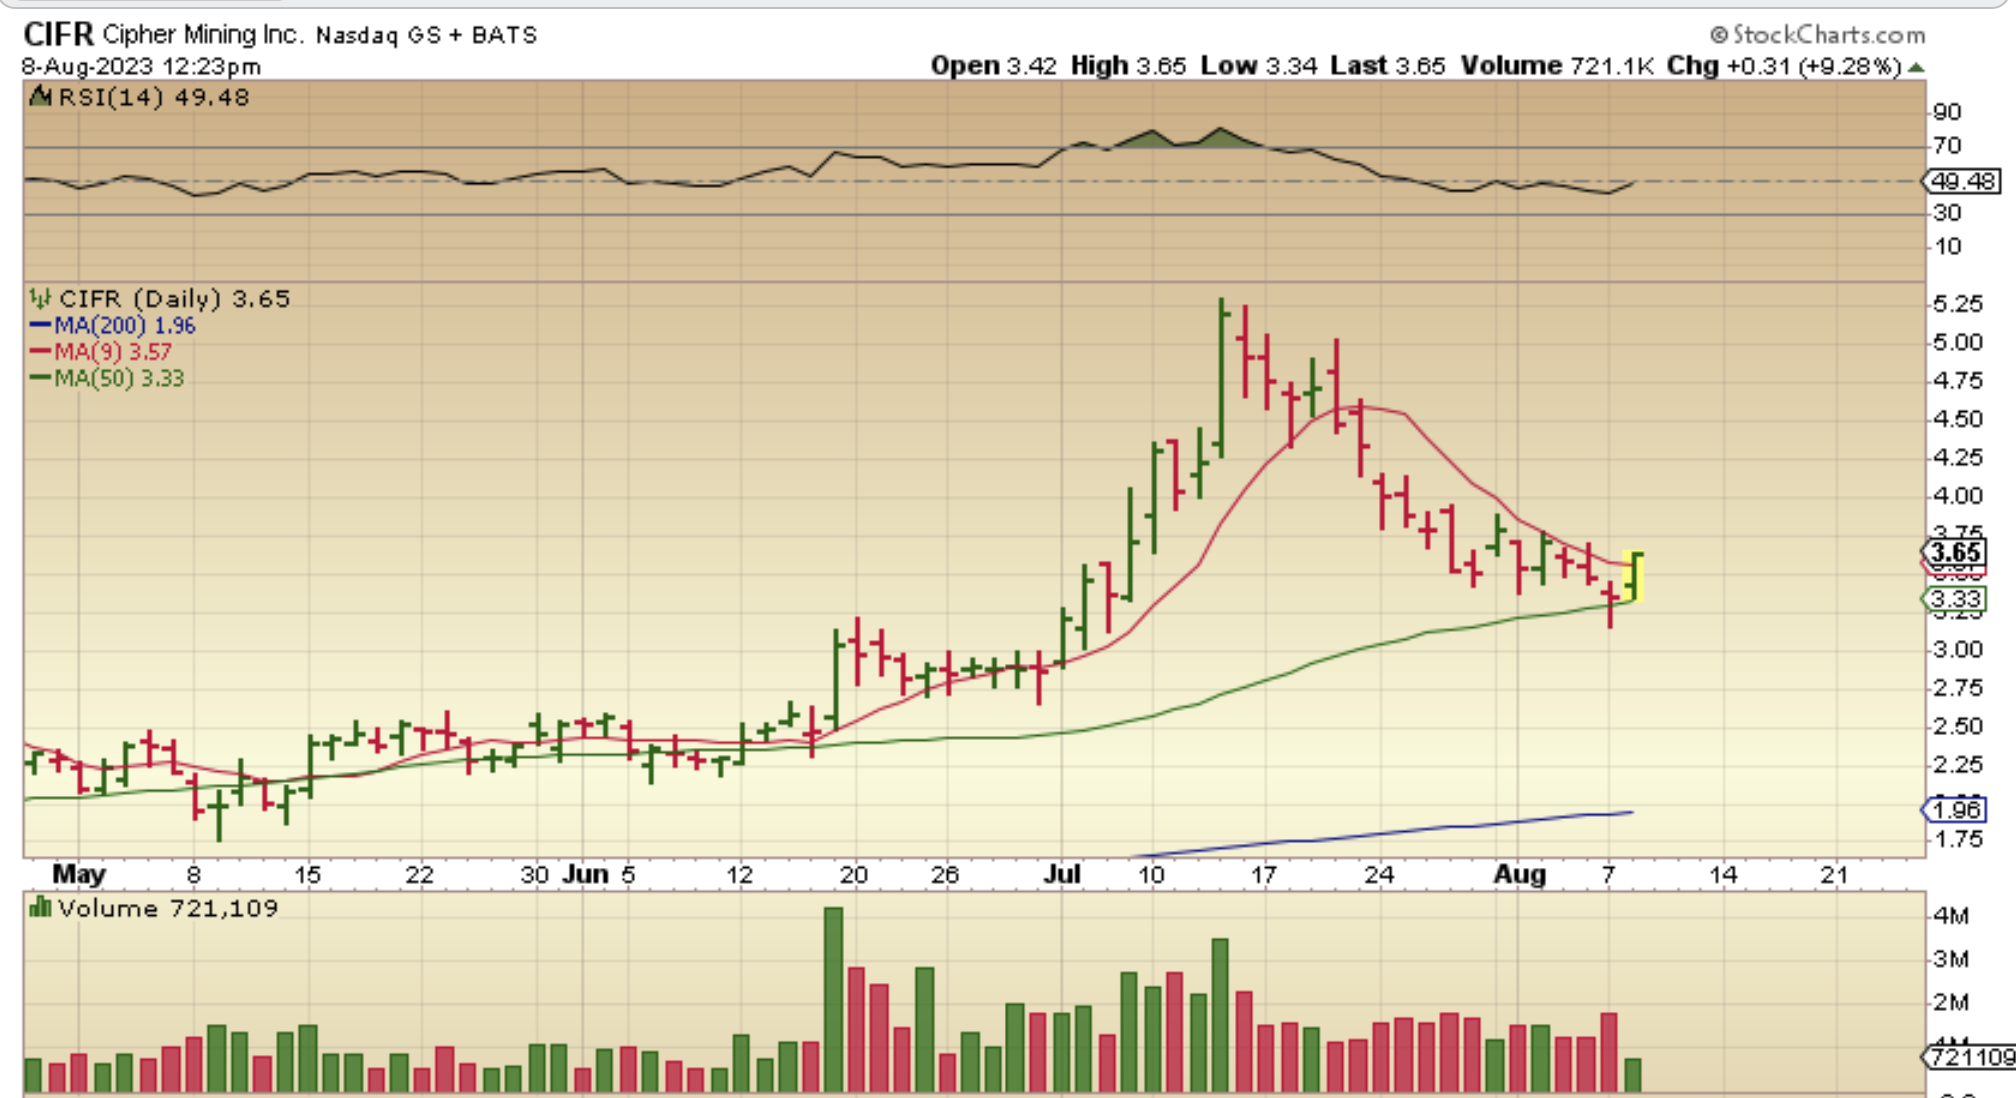
CIFR also released earnings and they looked good. I posted this shake out at the 50sma, and then this dip and recovery after earnings.I said that with this happening and Bitcoins timing near a day 60 low, this may be the lows for CIFR…
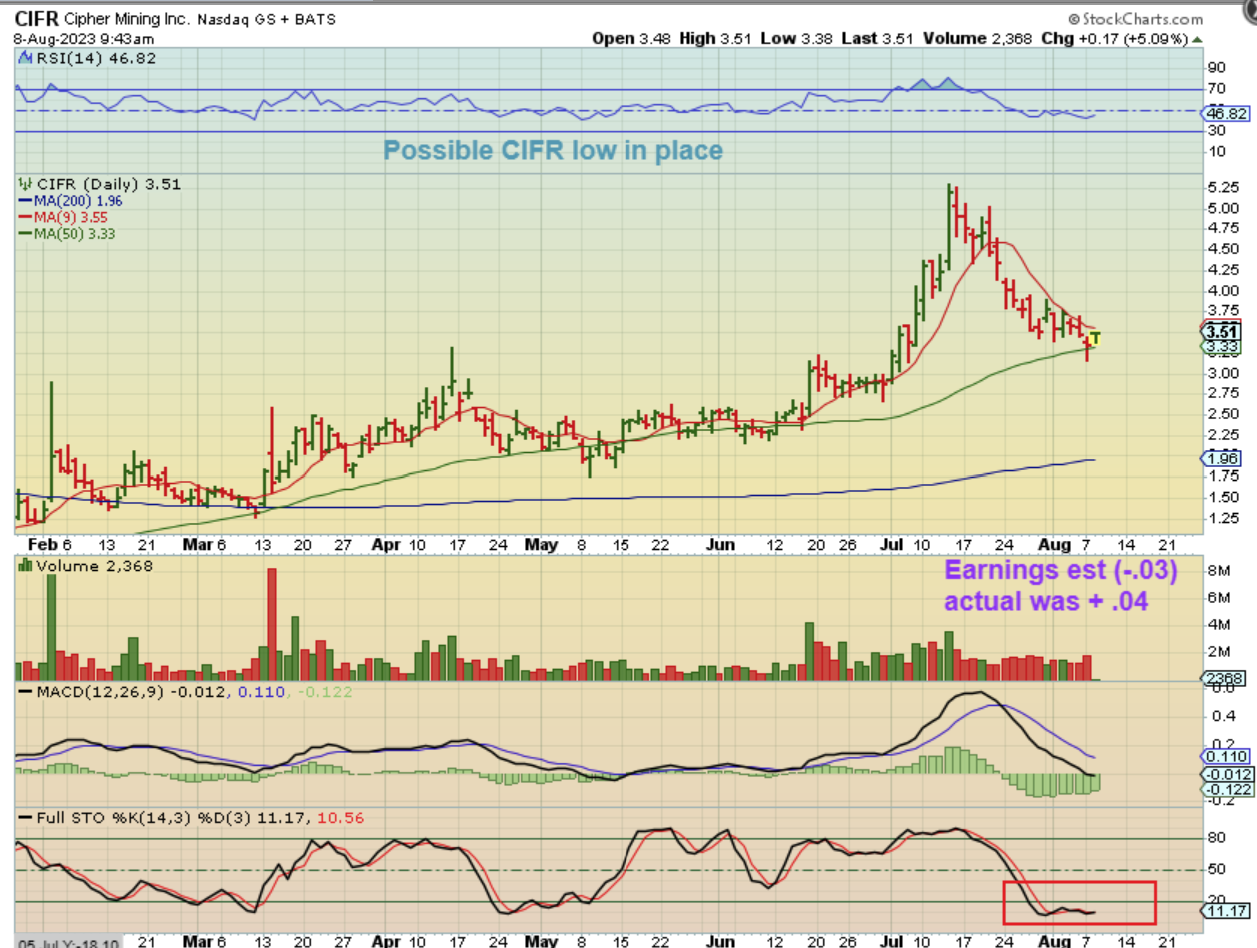
CIFR was then up 9% midday, and it ran up 14% total.
.
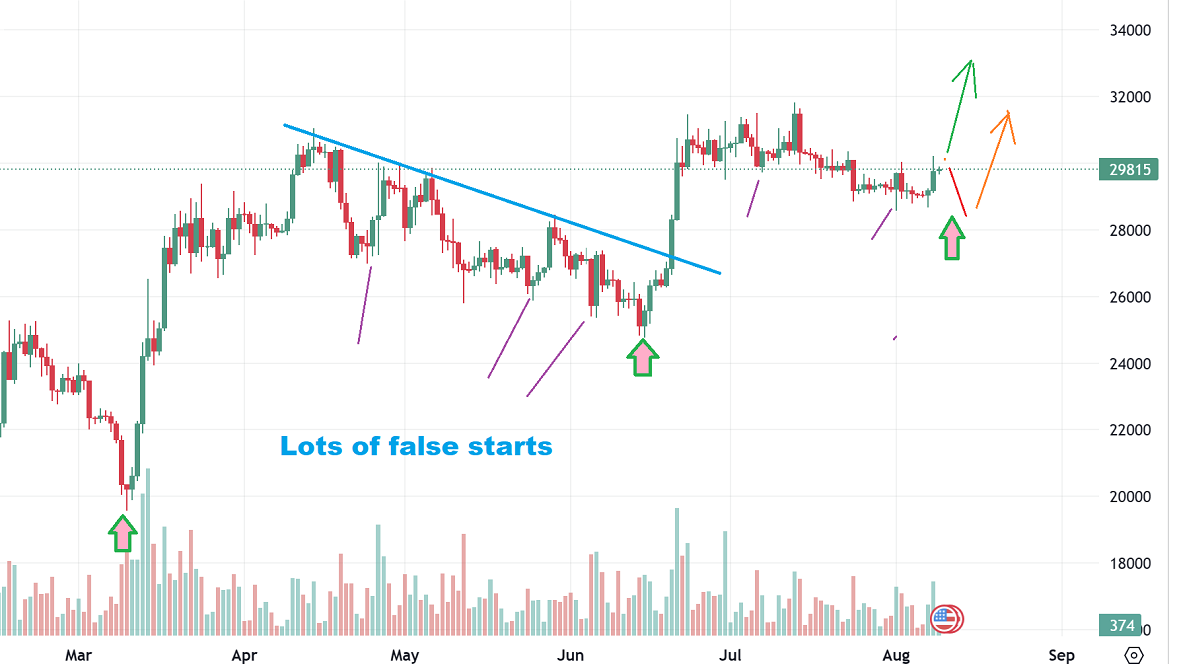
BITCOIN is VERY close to the day 60 mark, so are the lows in and we just rally from here or is this just another false start in a very choppy dip? It is very hard to tell with all of this chop and cycle timing is just a guide. We do not need to see day 60 as a low, but often lows form around day 60. I think that CIFR did just put in its’ lows though, and a few others may follow after earnings. MANY CRYPTO STOCKS HAVE EARNINGS THIS WEEK AND NEXT. MARA released last night and it looked good, but dropped in after hrs. Watch MARA today,
.
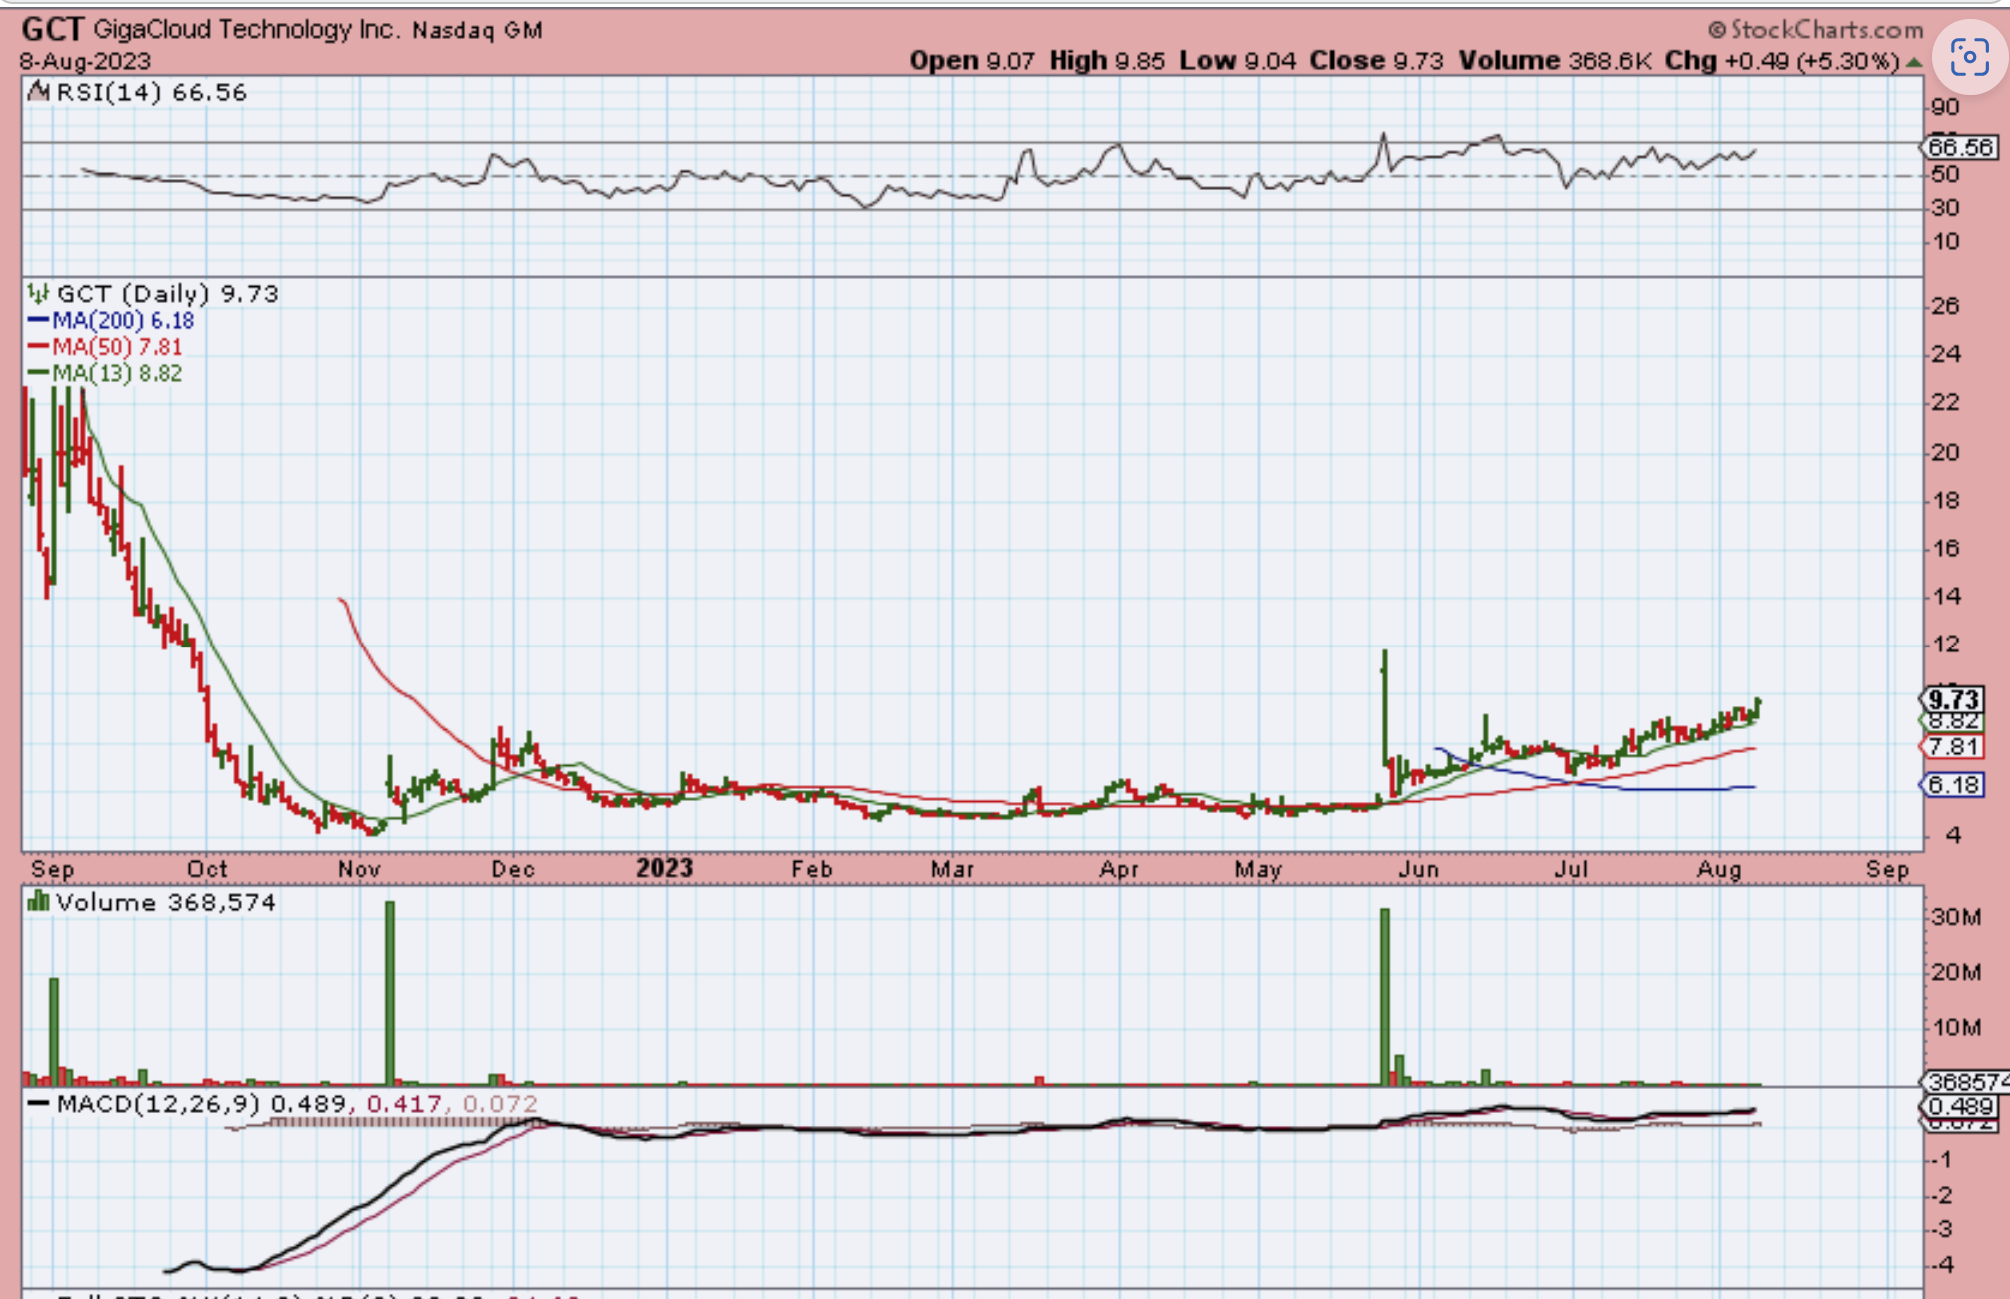
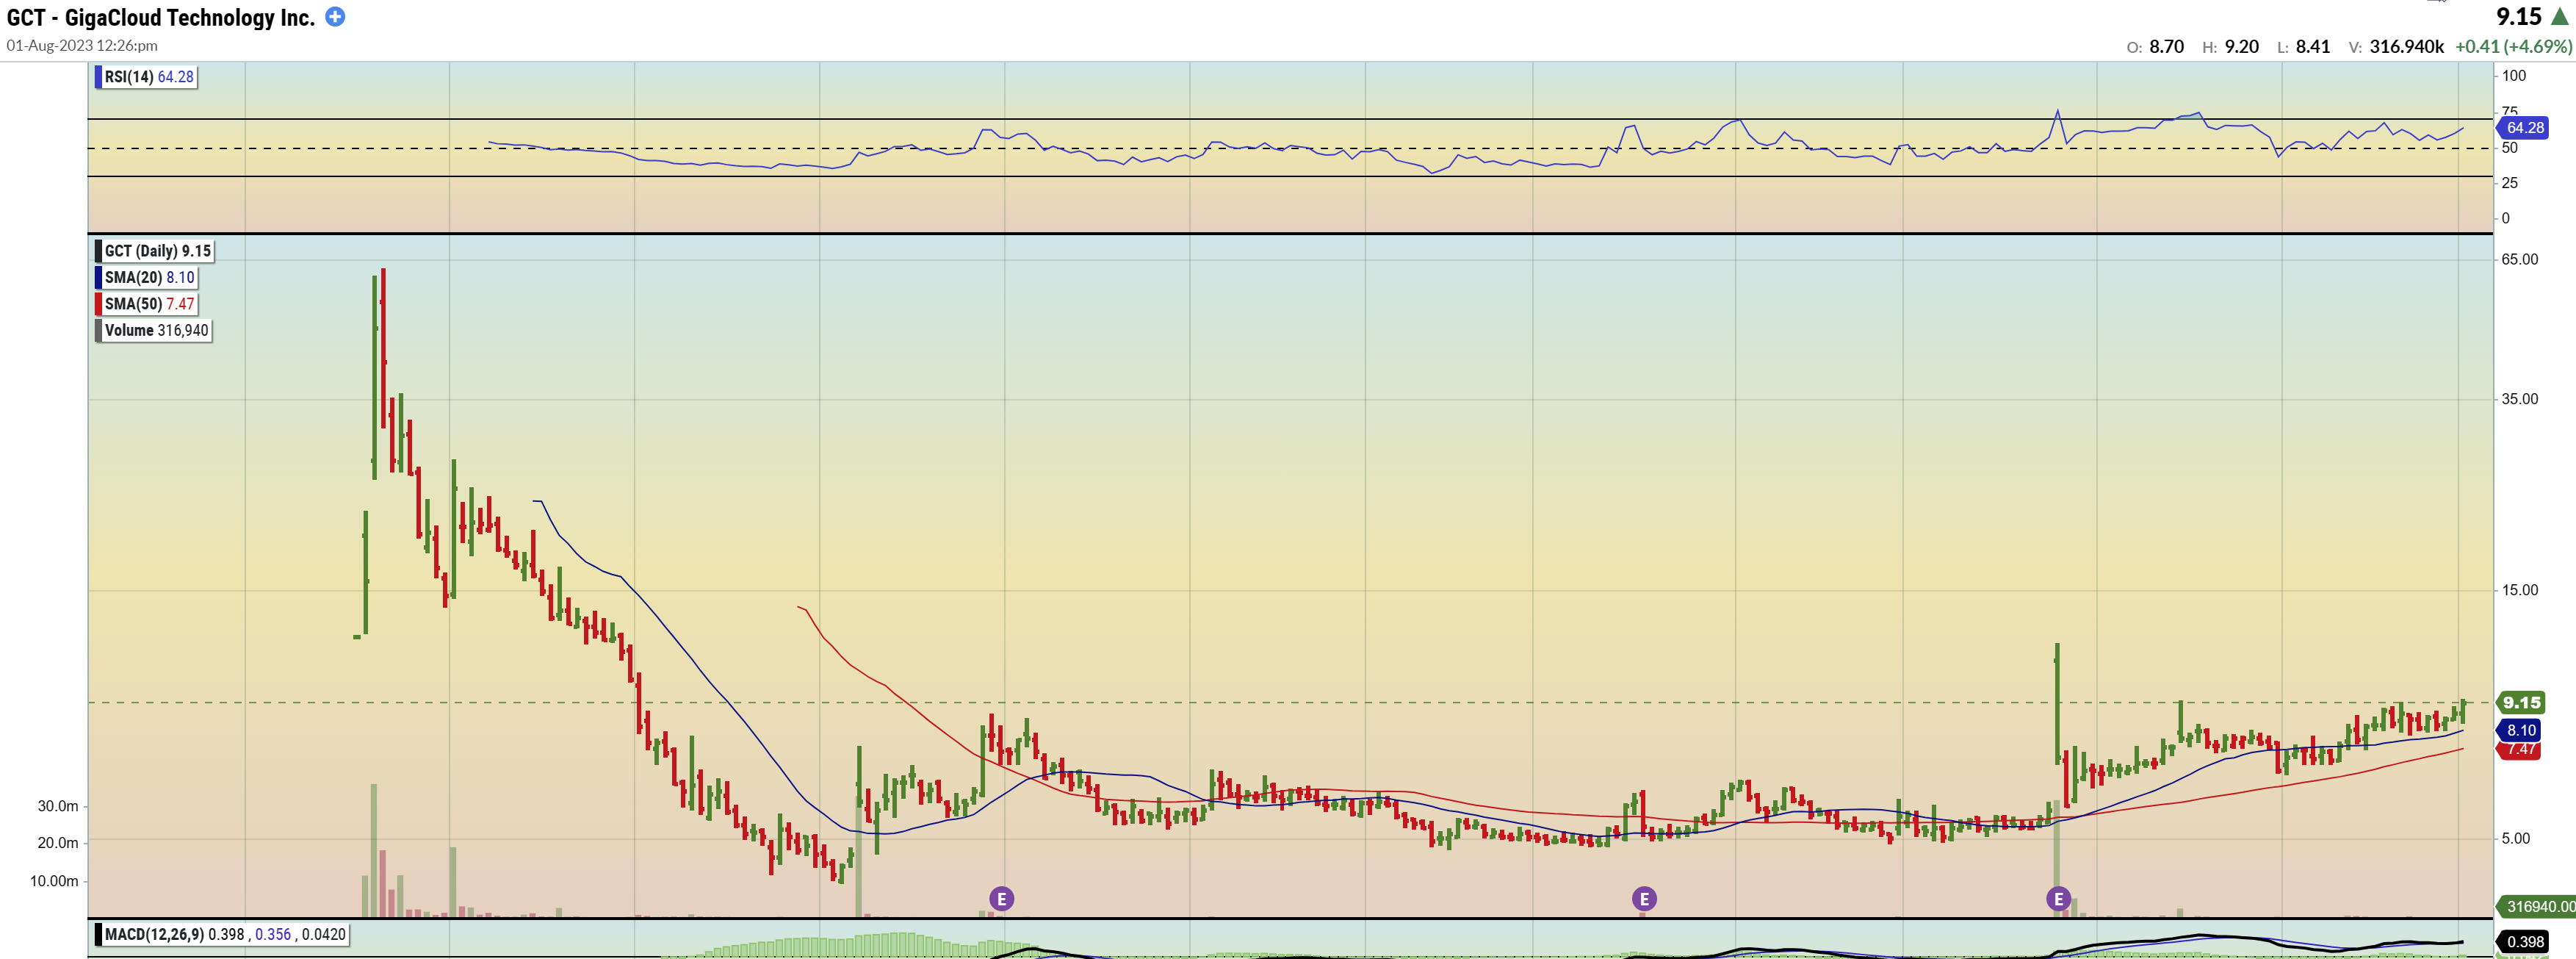
I have been discussing GCT as a nice base that I like. Here it was moving from $7.50 to $8.
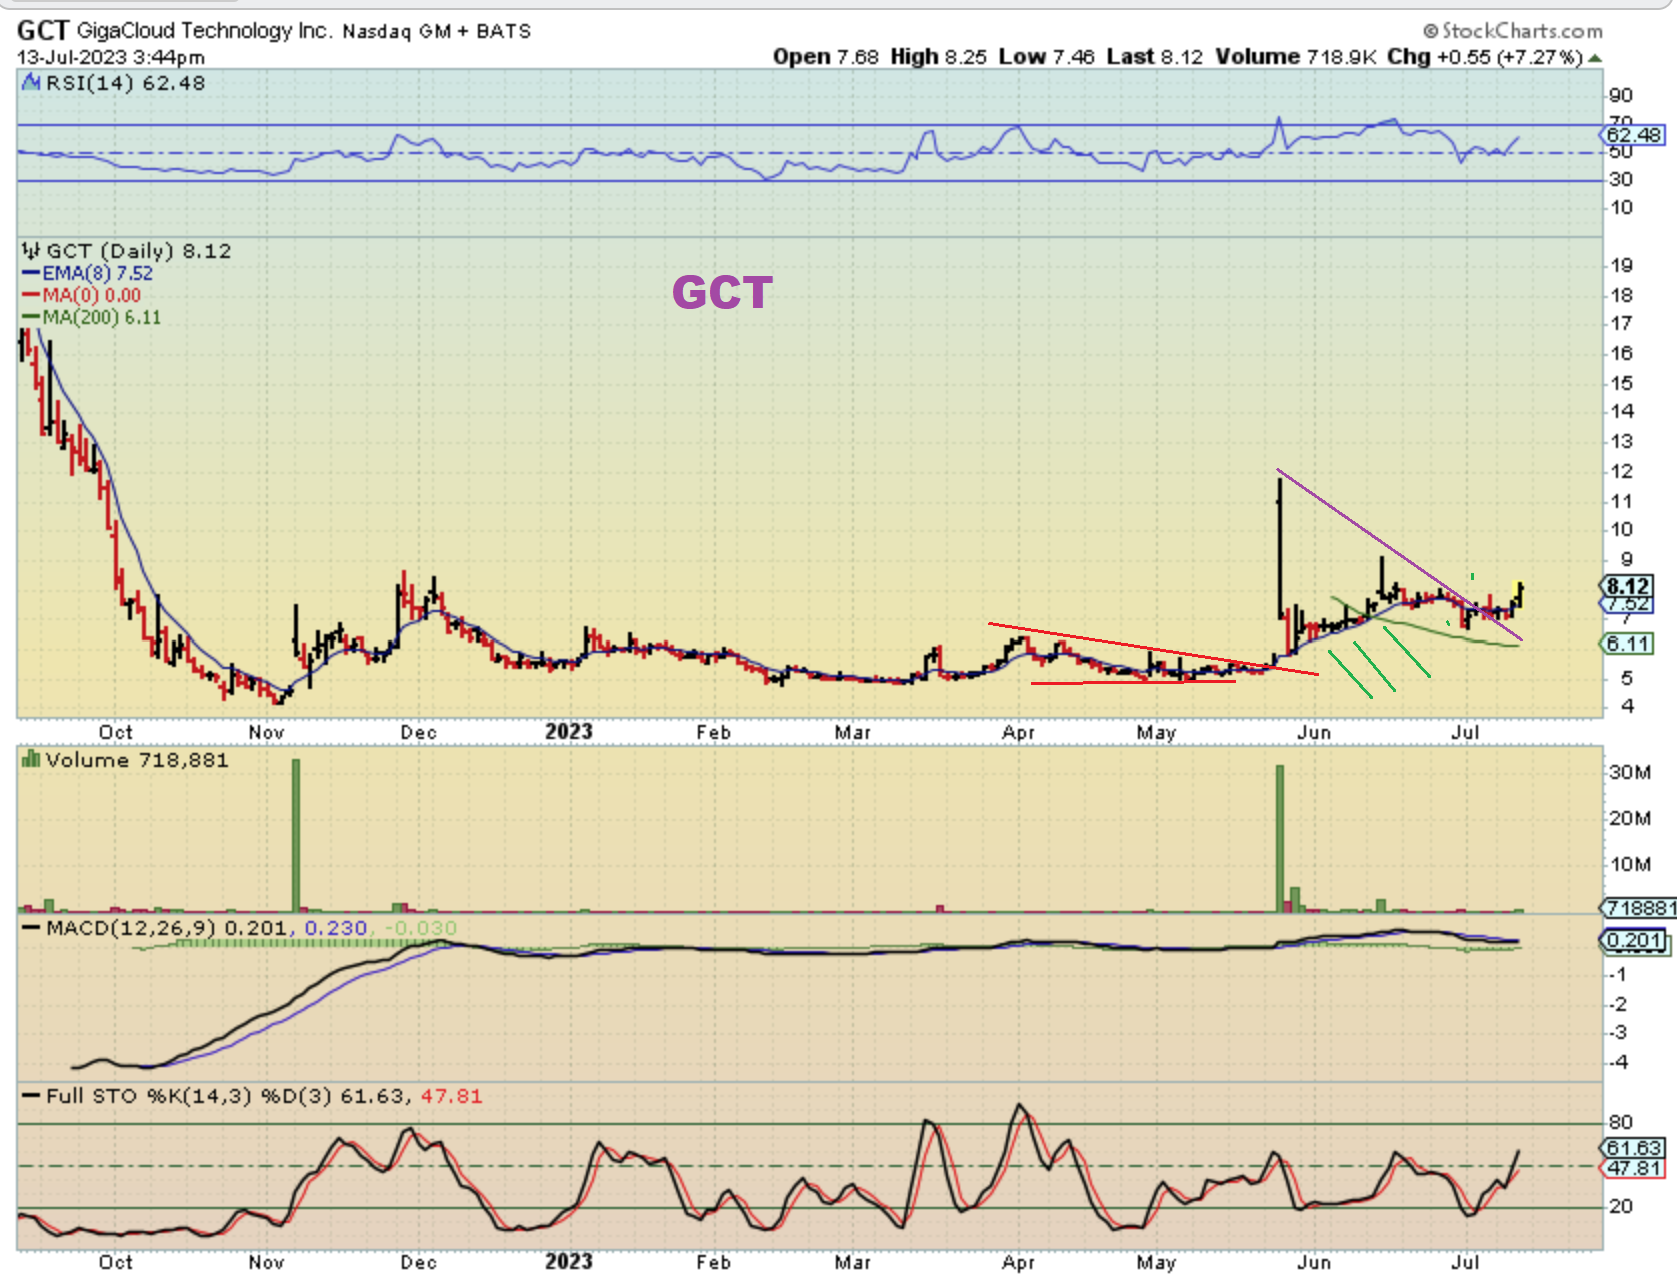
GCT -I used this chart to show the base that I like.
I bought and rode it for a while, but I sold it with some gains, because I knew that the General Markets were going to sell down. That said, GCT keeps moving higher…
.
GCT keeps moving higher and is almost at $10 now. IF YOU OWN IT, EARNINGS COMES OUT AUG 15, but that last Huge Pop was also earnings and it was very well accepted, so you’ll need to decide if you want to hold through earnings? Maybe just sell 1/2? Or sell all?