Wednesday August 23rd – This Really Does Look Like a Bottom
We’ve been discussing the possible bottoming process taking place in the Precious Metals Sector. Signs are continuing to show that Silver did bottom first, and Gold and The Miners look ready to join in. That is great news, but let’s cover the other sectors first.
.
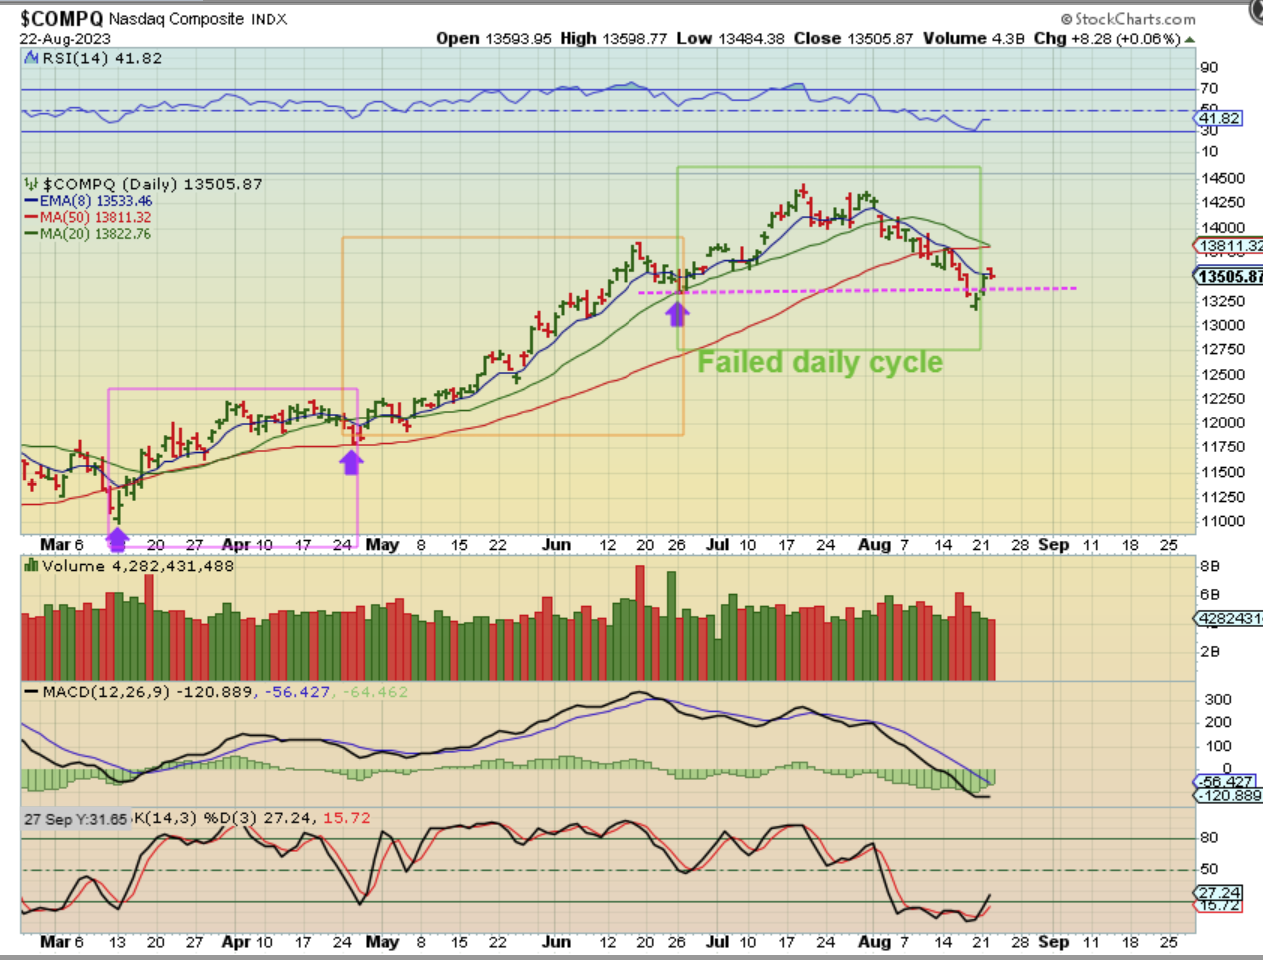
THE NASDAQ broke above the 8 ema & 10sma, but closed back below both (especially the 10sma). We still need time to see if we have a dcl yet, or just a bounce and a lower priced dcl later. The timing is actually ok for either scenario.
.
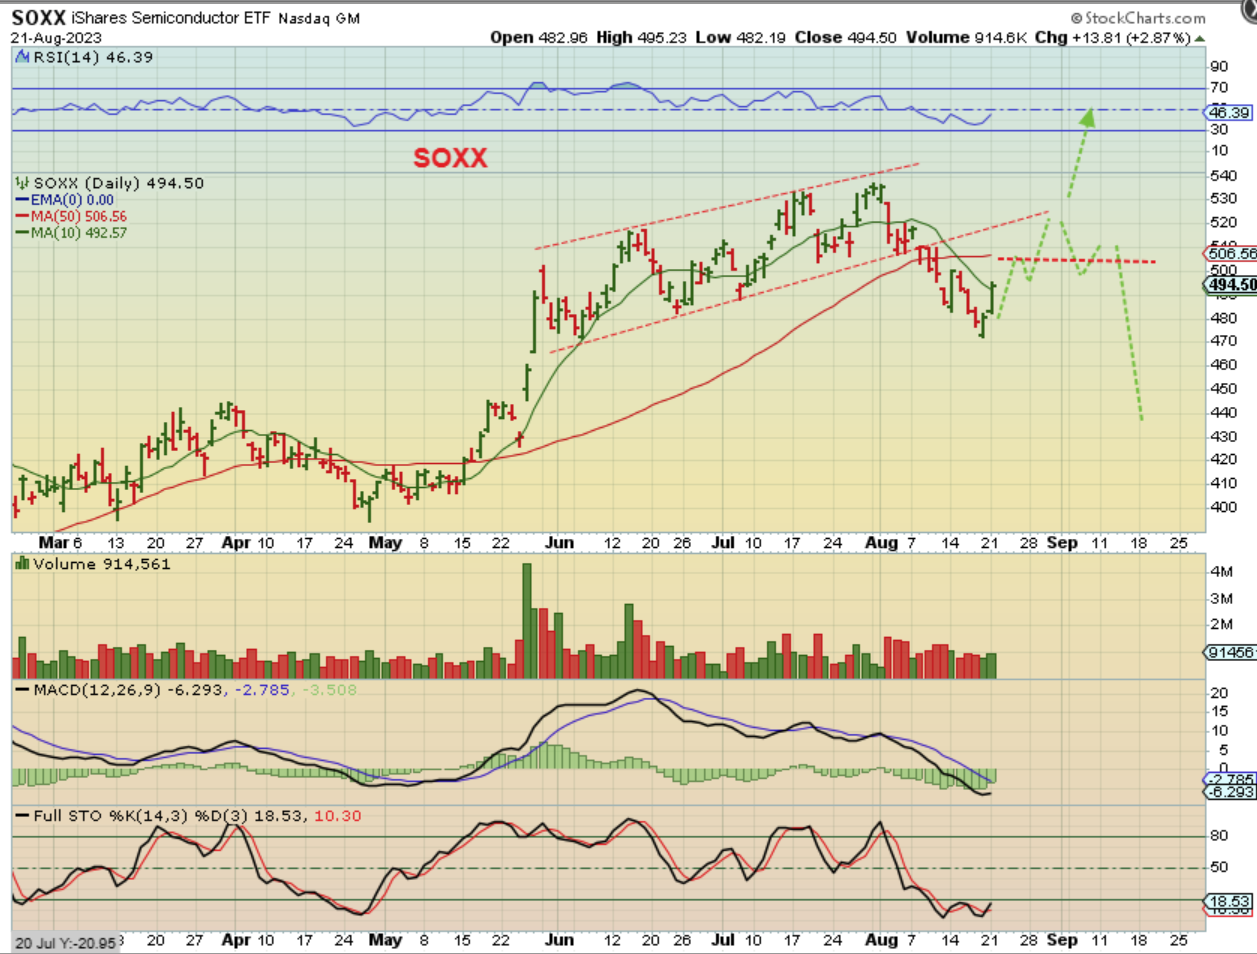
Yesterday I used this chart and mentioned that…
THE SOXX has already closed above the 10sma, so it looks like a dcl may be in place here ( & the SPY & QQQ would also likely be dcls if the SOXX is leading).
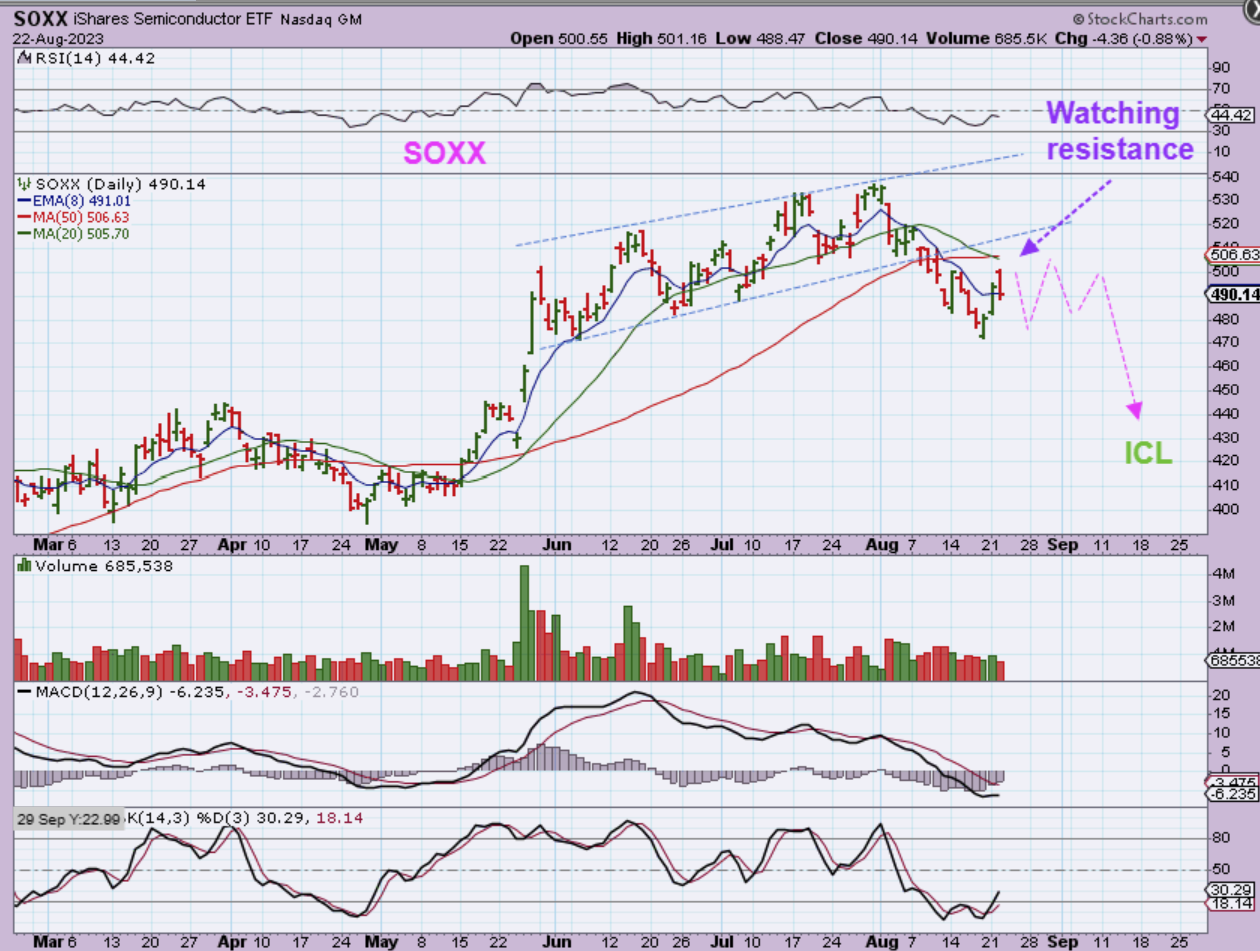
THE SOXX gapped higher and then sold off all day, closing under that 10sma. This can still be the dcl. Take a look at the lows at the end of April and start of May and you’ll see one day above the 8sma then a dip to a higher low in May.
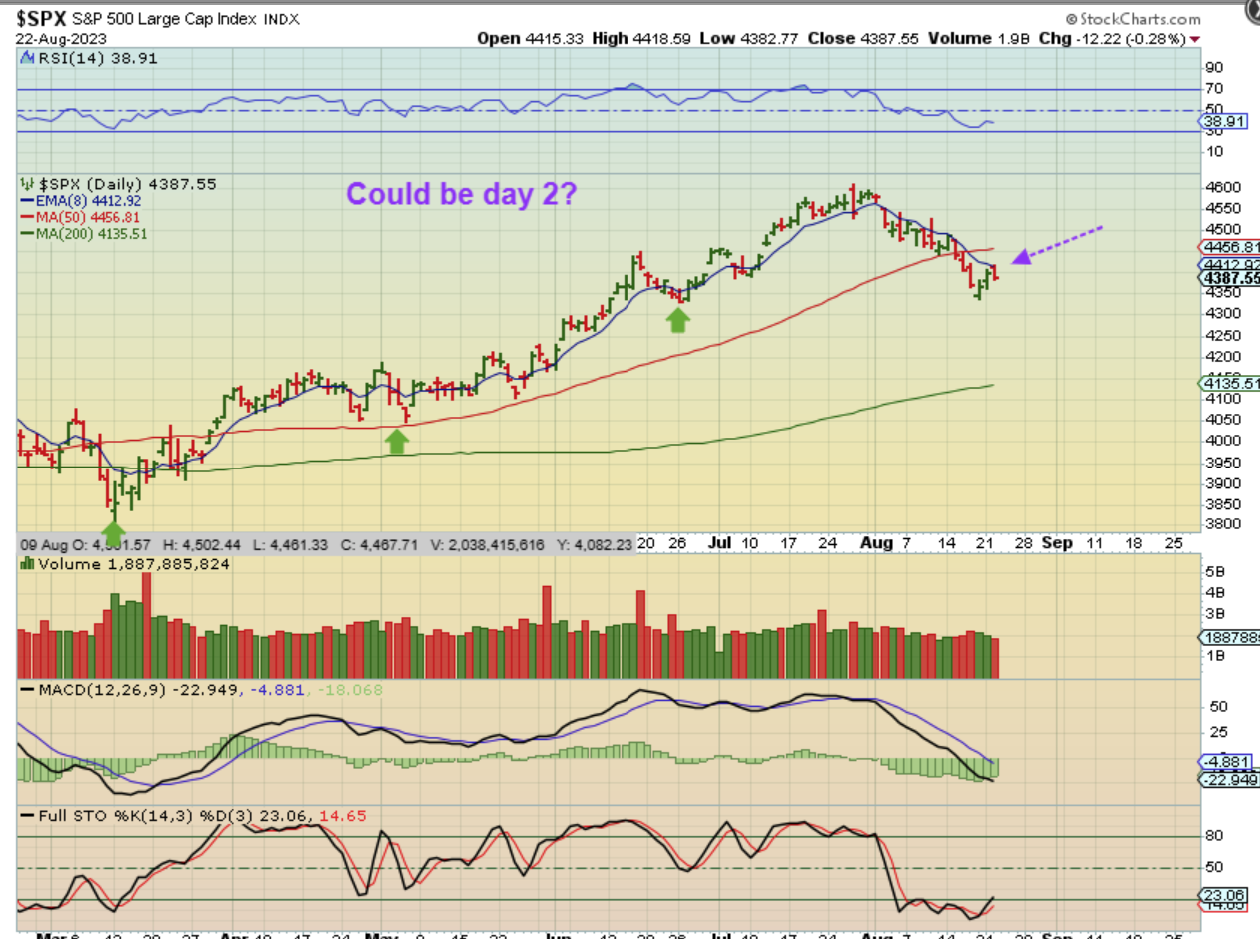
THE SPX reversed at the 8 ema (the 10sma is higher), so we just need more time to know if this is a dcl or not. Anyone going short yesterday would want to use a stop at the 10sma. This could actually be day 2 of a new daily cycle.
.
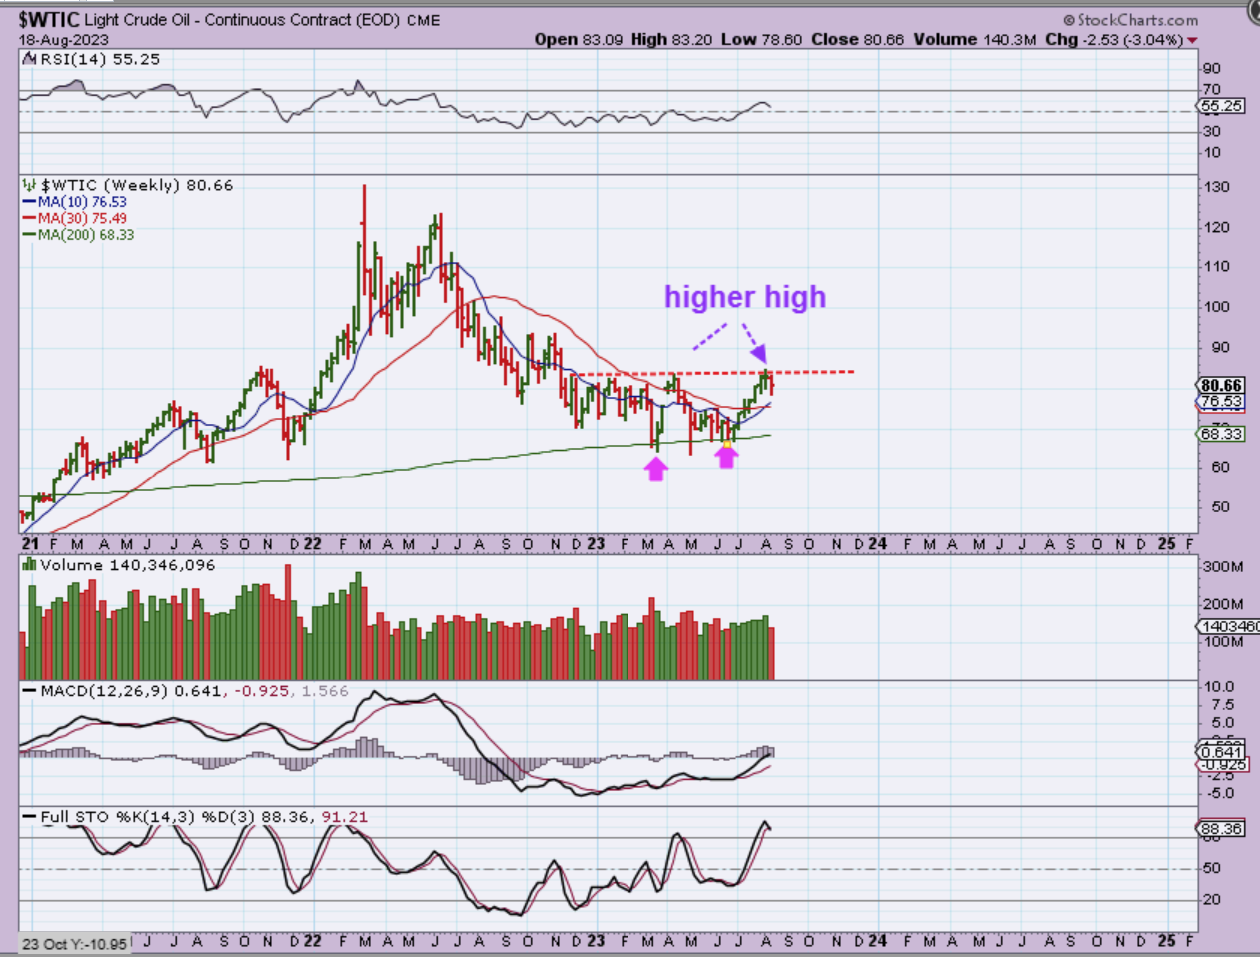
LAST WEEK I MENTIONED OILS RESISTANCE WITH THE WEEKLY OIL CHART:
.
OIL WEEKLY – Oil was rejected at the overhead resistance.
1. We are at resistance and rolled back, and
2. This is overbought on a weekly basis and looks like it could drop further over time.
A breakout higher is a buy, but this may just chop and drift lower before it breaks out.
.
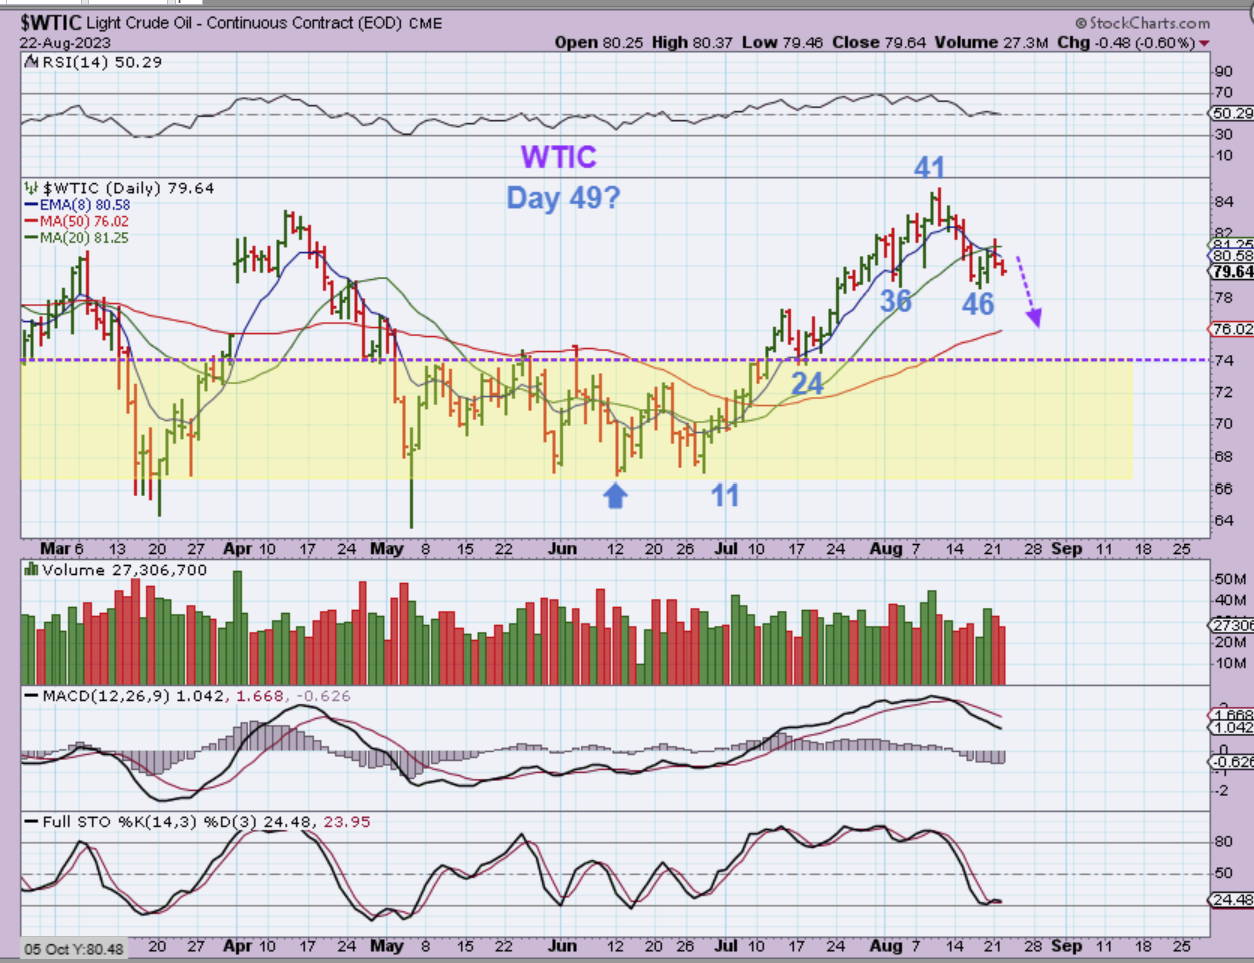
WTIC – Oil has a peak on day 41, so it is very right translated, but it has continued to dip lower into the next dcl. This has been expected and with Oil on day 49, a dcl can come any time now (likely at the 50sma).
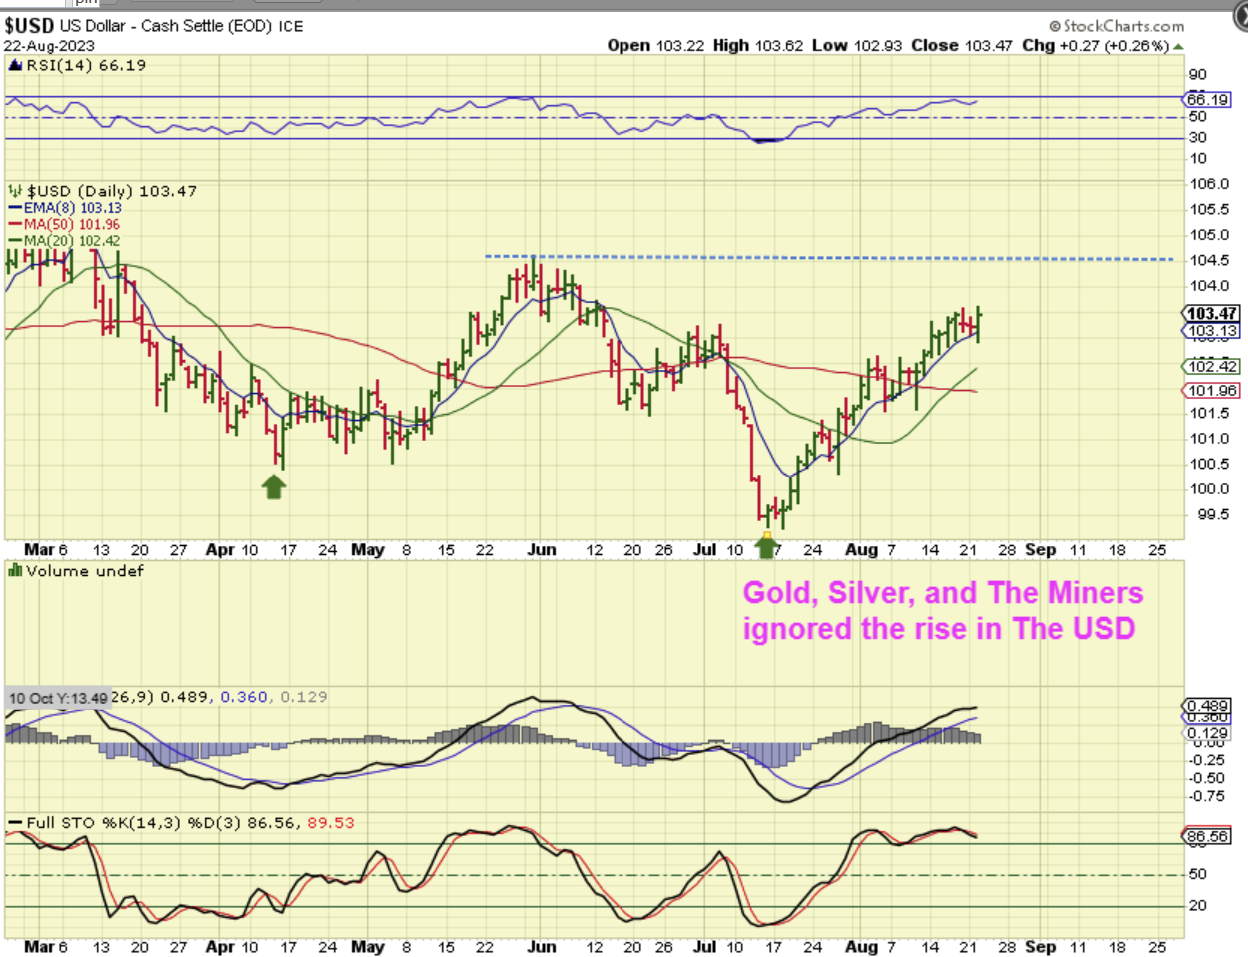
THE USD continued to push higher after a pause, but the good news is that the Precious Metals were not hindered by this…
.
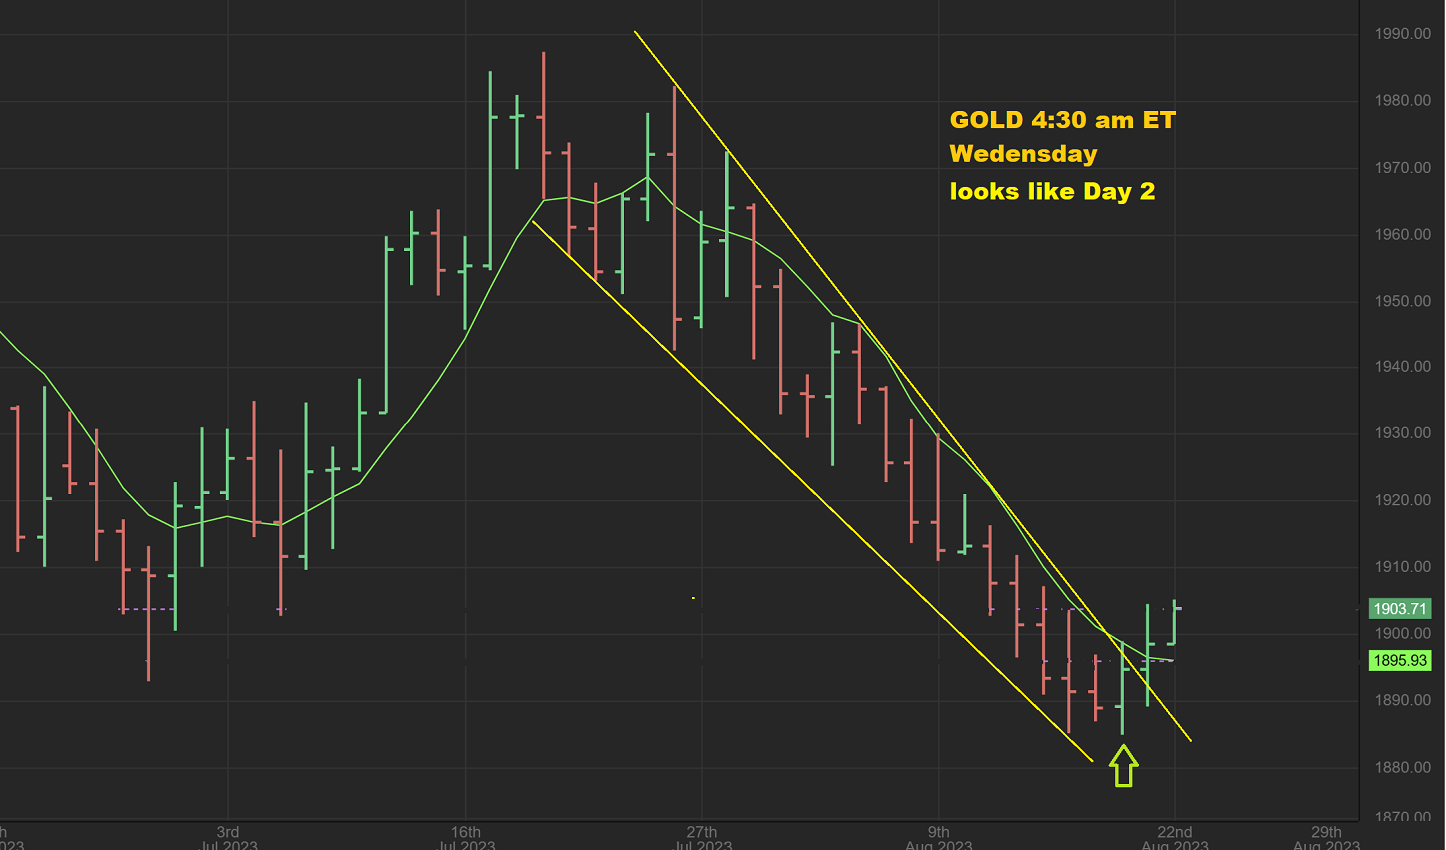
I have family up visiting from Florida this week, therefore I got up early to write my report since did not have time to grab charts last night. So at 4:30 a.m., why not just go to GOLD LIVE at 4:30 am ET?
As you can see, GOLD broke that downtrend yesterday and todays candle is already pushing higher. Again, this happened with the USD higher too, so that is encouraging. This looks like Gold day 2.
.
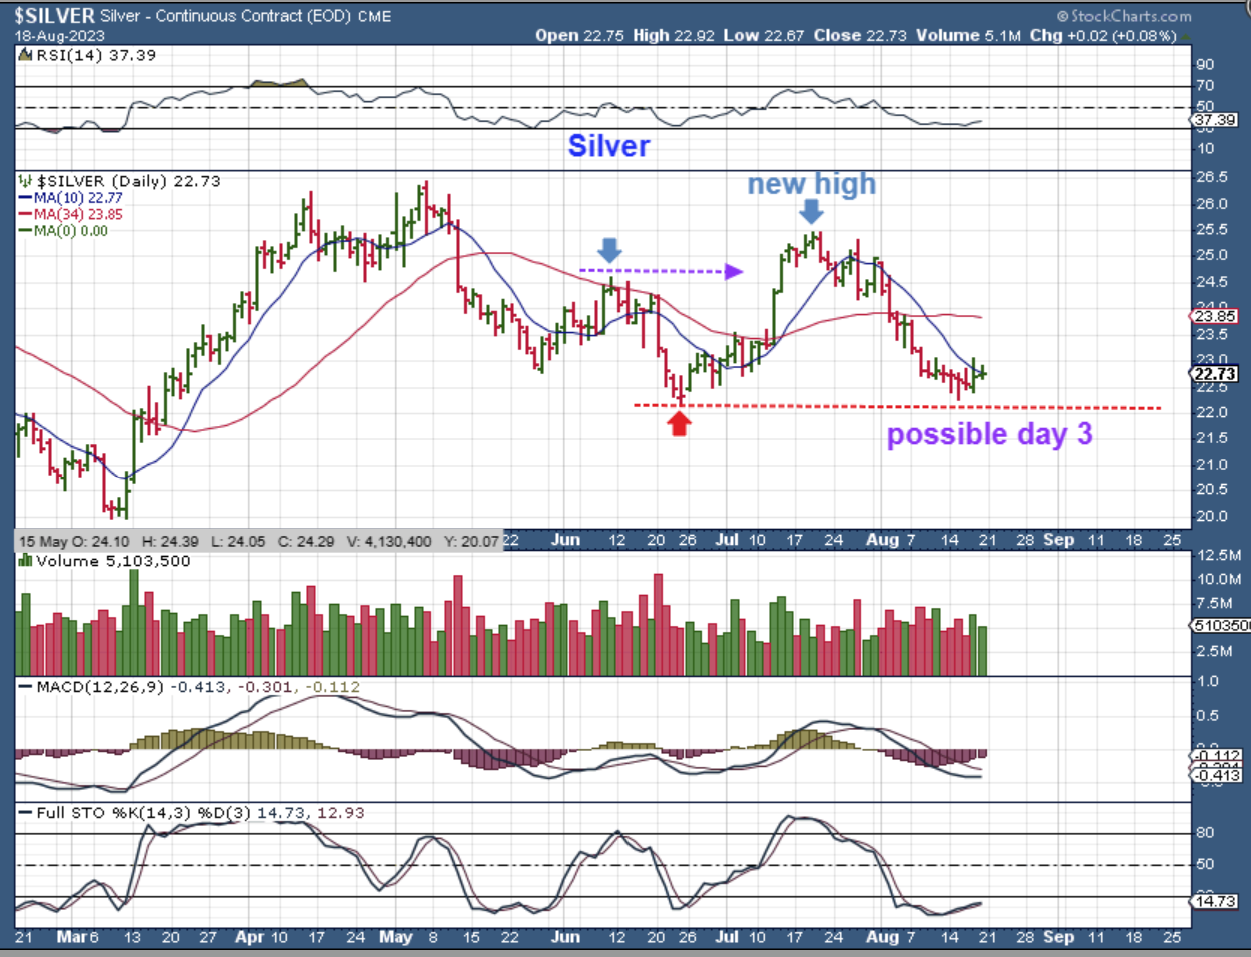
FROM FRIDAYS CHART, I wrote:
SILVER DAILY – I mentioned that Silver may have bottomed ahead of Gold again, because it refuses to break the lows so far. We are late in the count for a dcl and this is possibly already on day 3 as it hangs above the recent swing low. This chart has the same ICL characteristics that formed in June with a ‘new high’ and a ‘downtrend break’,etc. Silver DOES look set up to run higher next week.
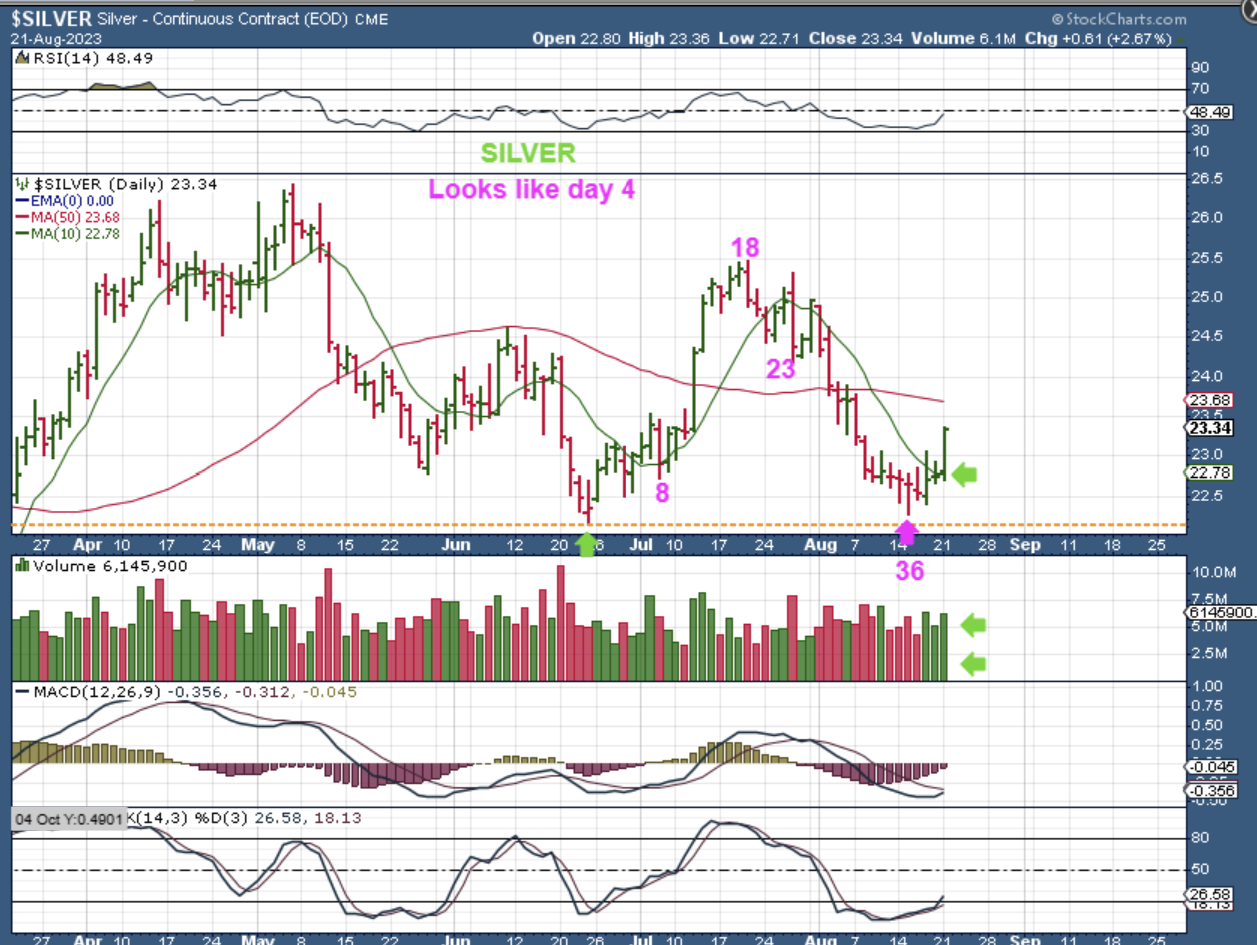
Yesterday I mentioned that Silver was still leading the way. I wrote:
Hello Monday, and it certainly does look to be day 4 for Silver. I do hate that SILJ is not as Bullish as Silver, but that MIGHT be a gift! Silver stocks are hanging at the lows, and could be cheap buys with Silver looking like this.
.
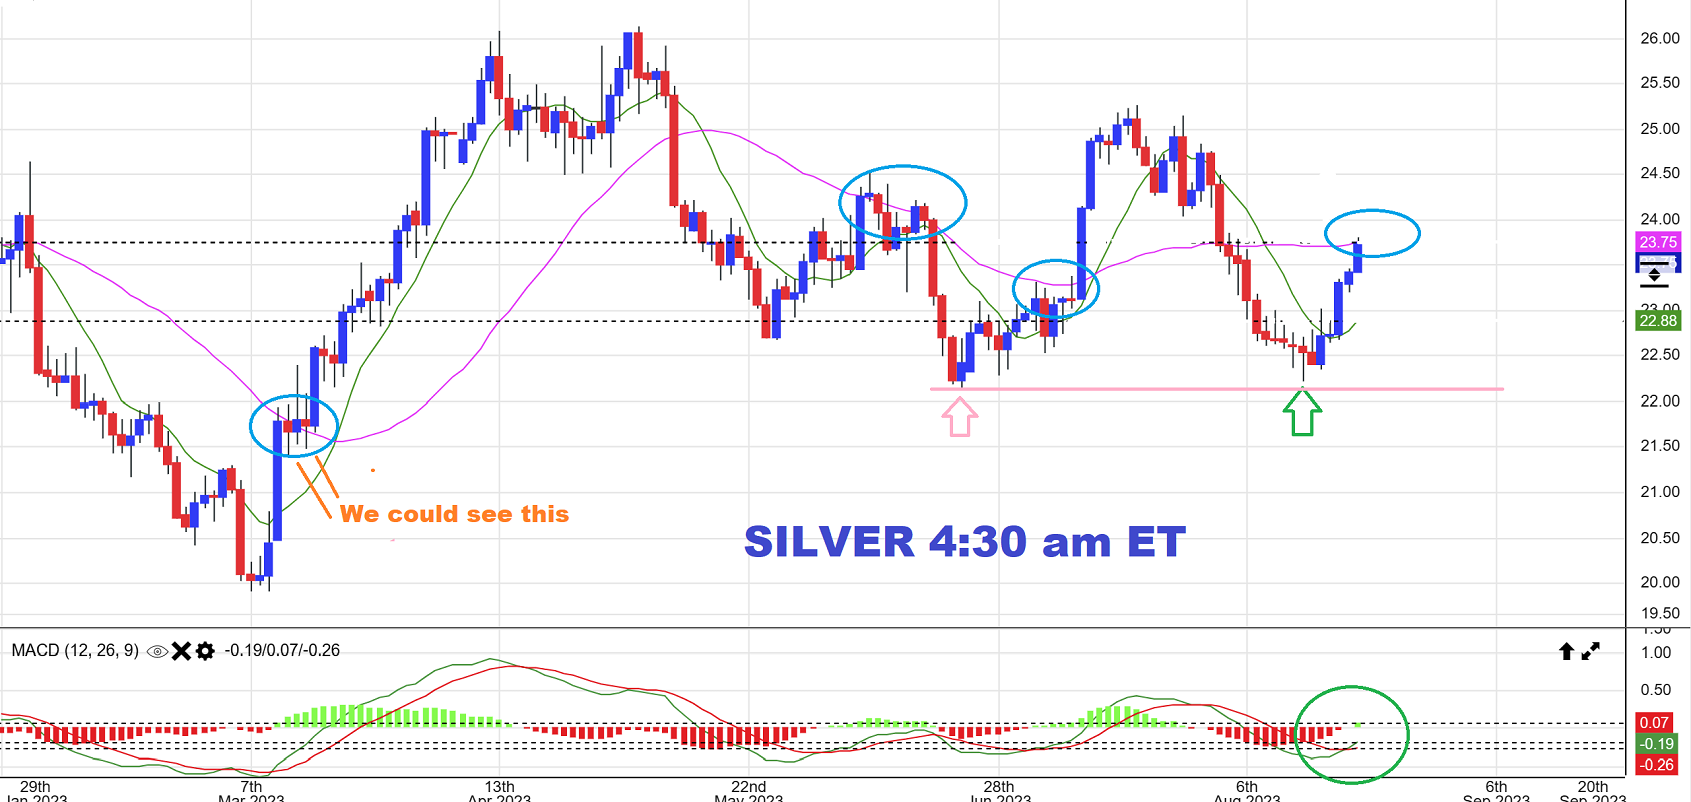
SILVER 4:40 am ET – Silver is starting to surge, but it has reached what has acted as resistance in the past. We might see a little crawl sideways or a pull back after today , we’ll see. I’d LOVE to see the Silver stocks start playing catch up and make a move like this.
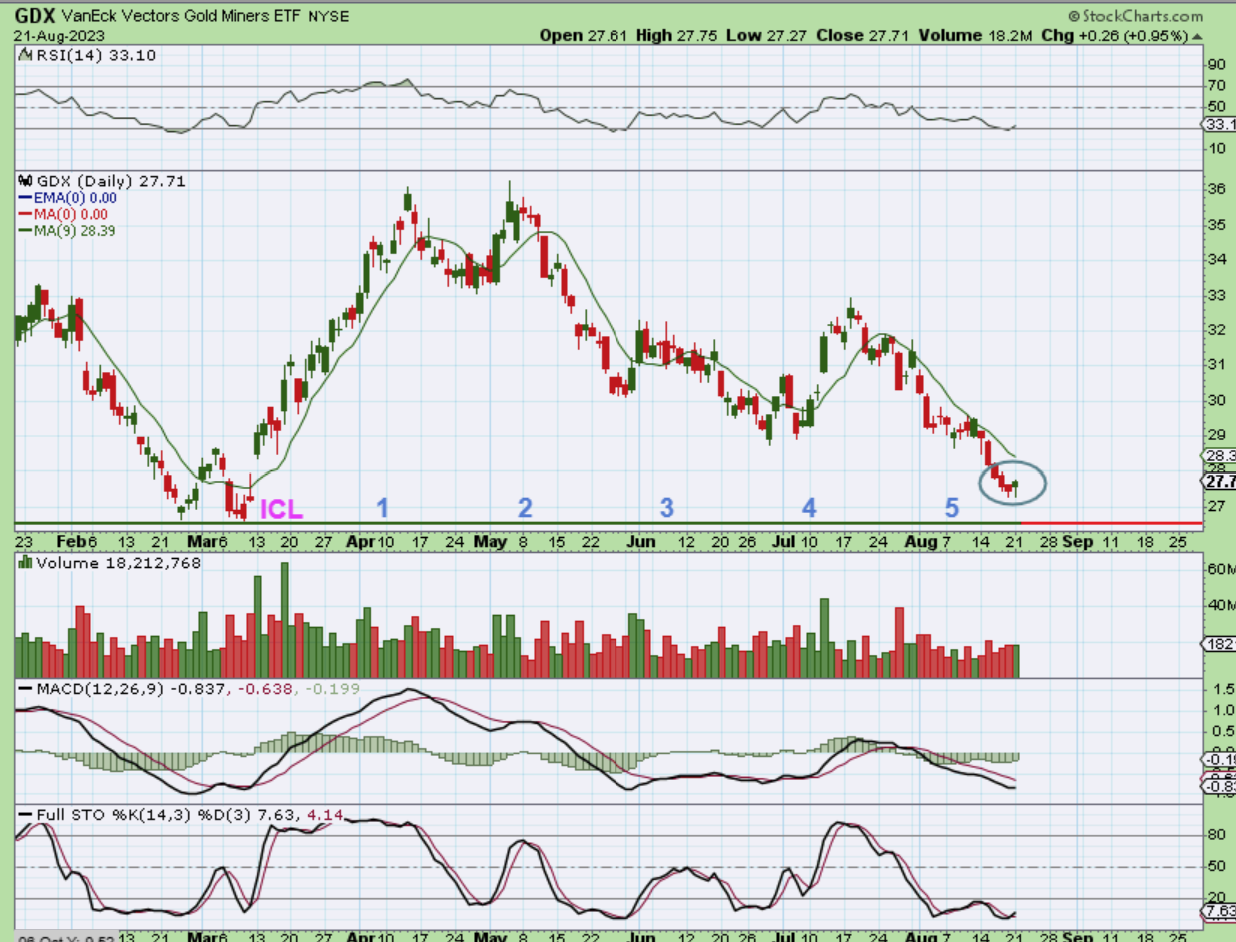
For the big picture of GDX, I have mentioned:
Now I look at the March ICL and we can view this as a drop into an ICL at almost 6 months. 6 months from ICL to ICL is very normal.
.
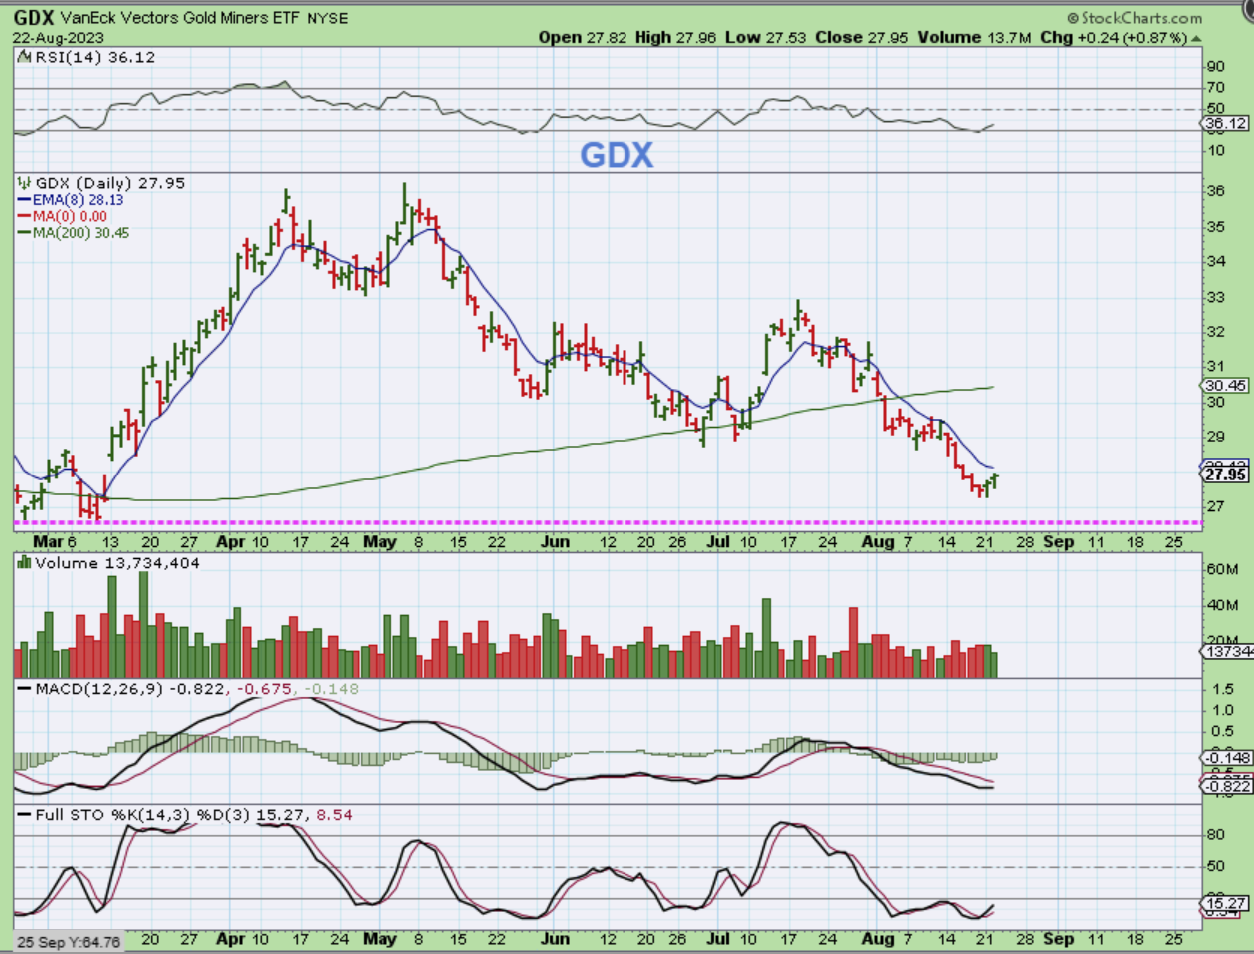
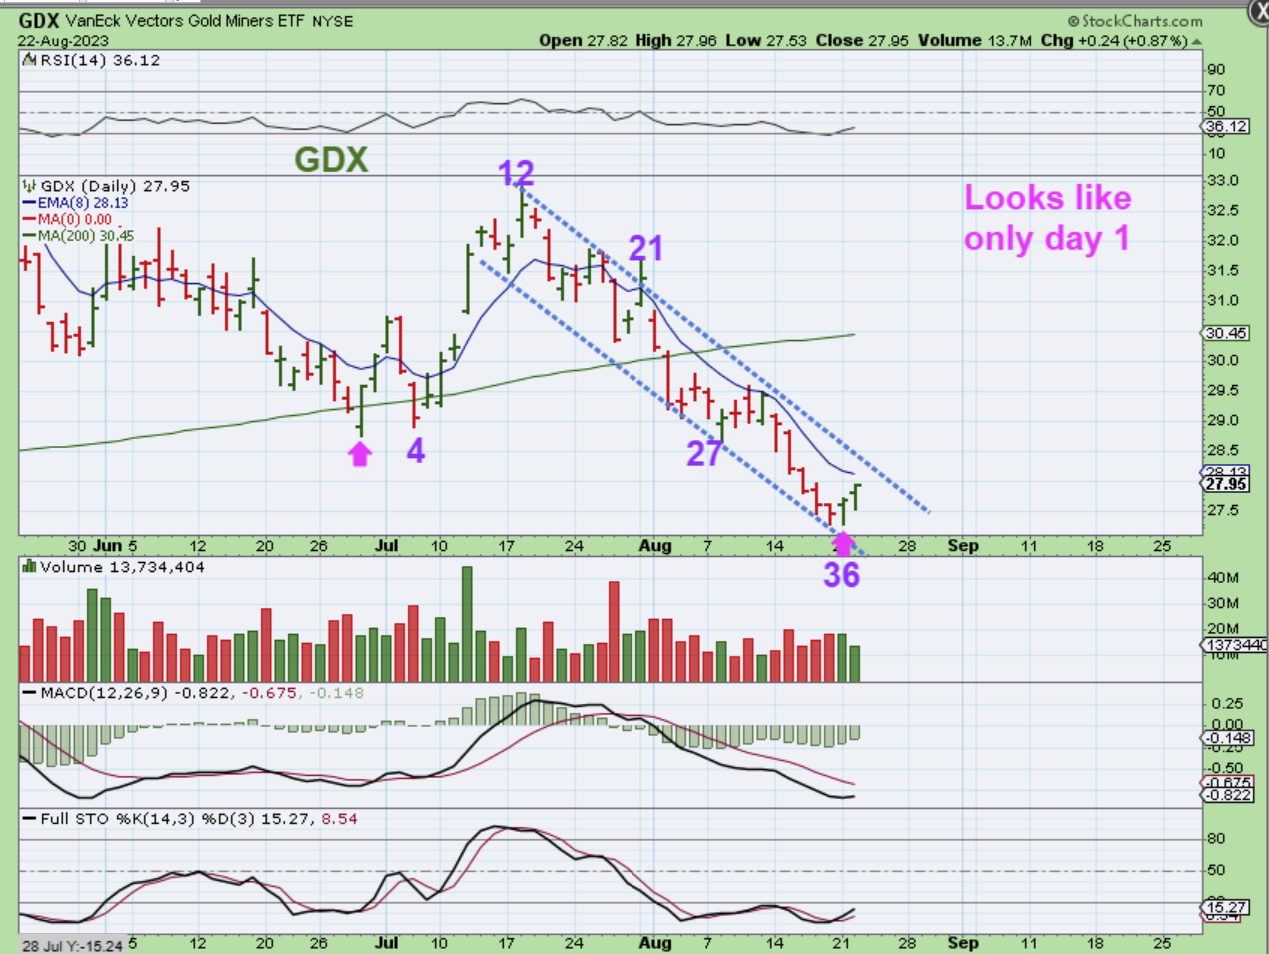
On Tuesday GDX gapped open higher, sold off and dropped to red, but then recovered. That gives us 2 reversal candles in a row. Let’s zoom in.
.
GDX looks to have bottomed on day 36 (normal).
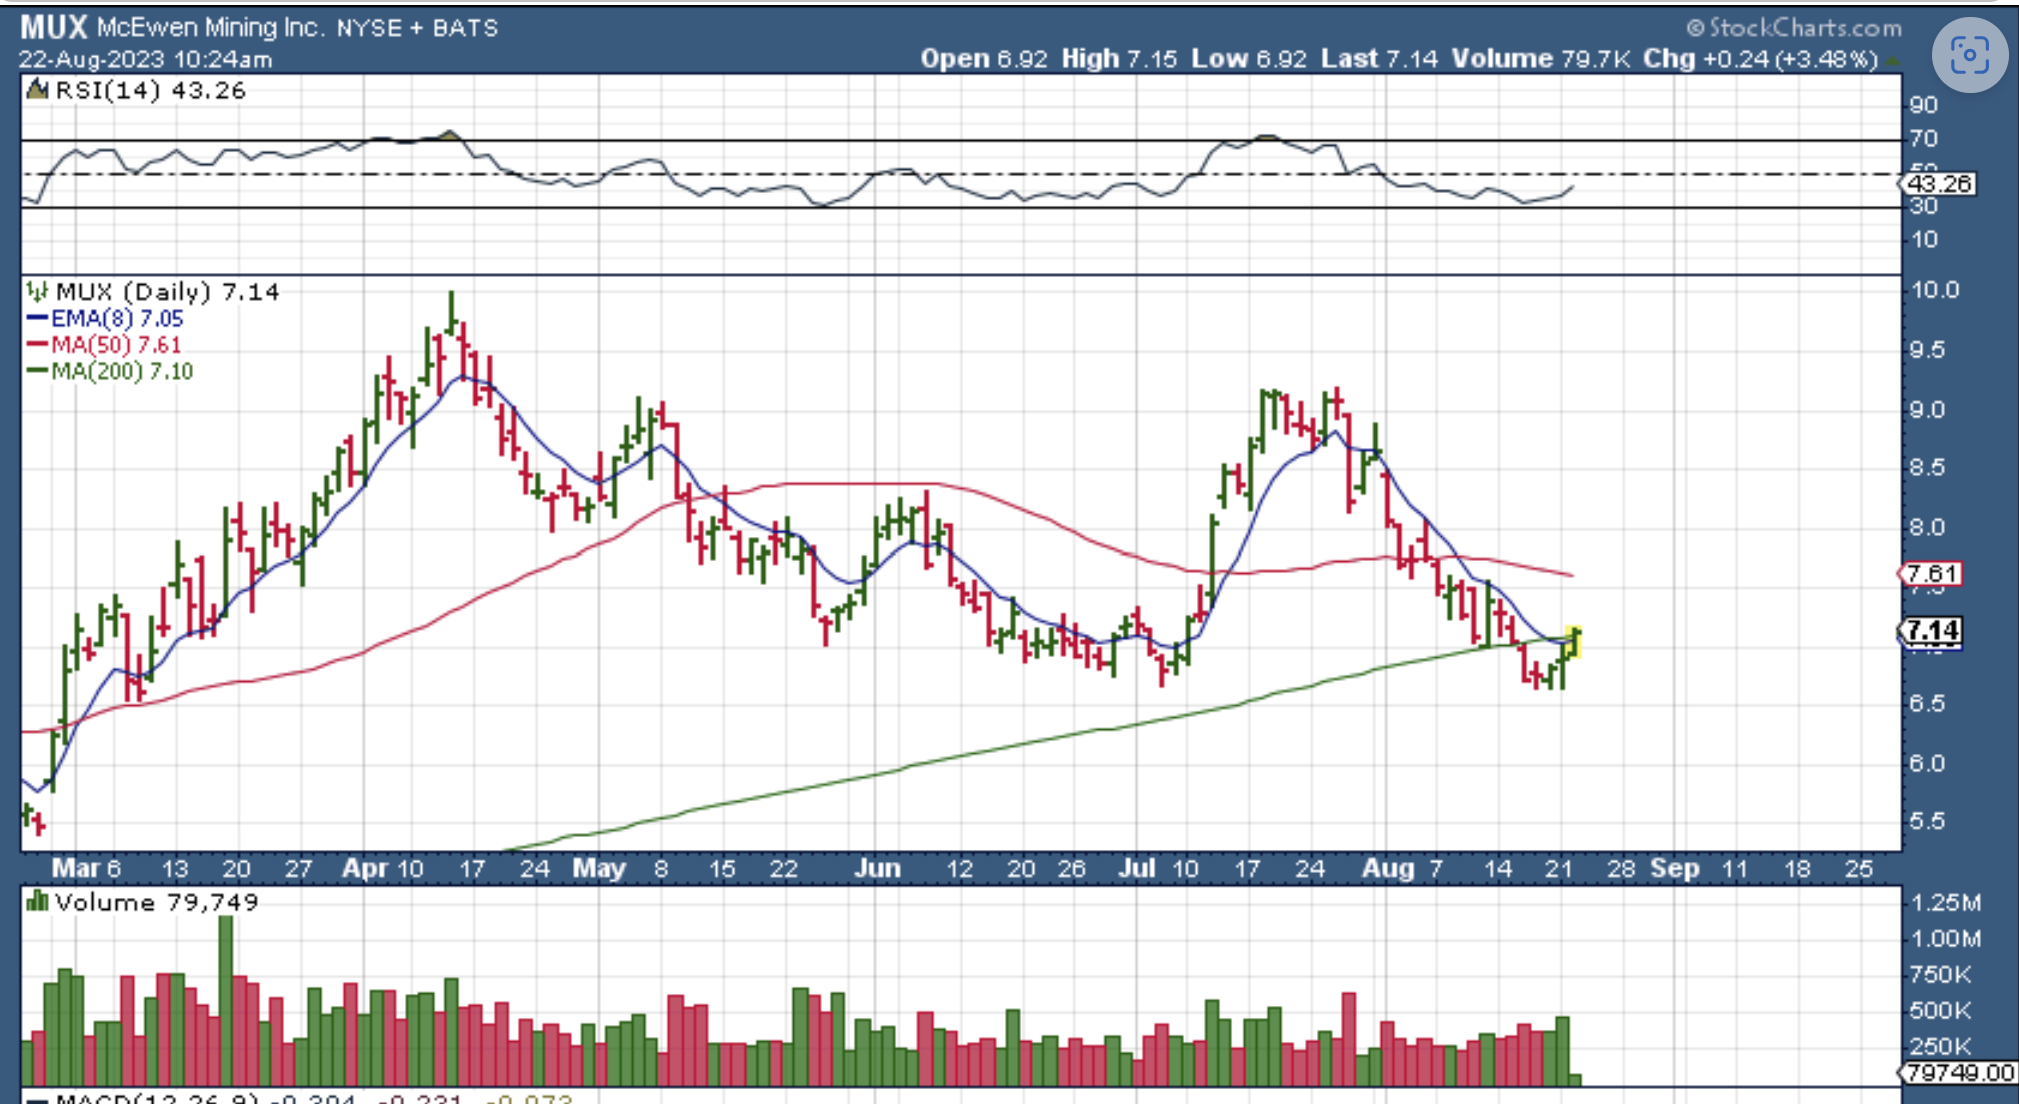
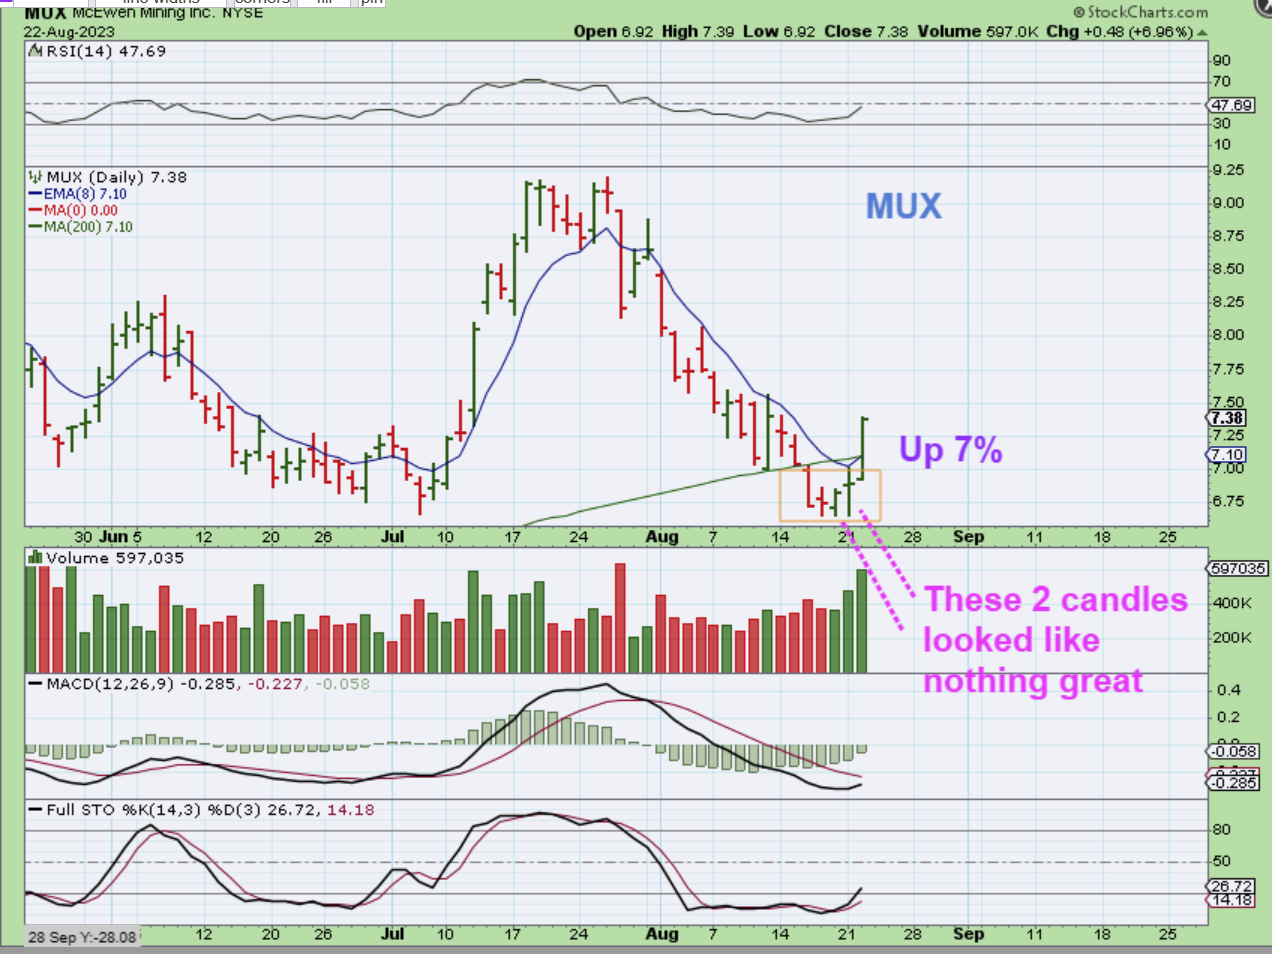
MUX was one of the only Miners that I could see pushing higher by more than 1% in the first hour yesterday, so I grabbed this chart and posted it at 10:24 am. Did it hold the gains?…
.
MUX – Notice that the bottom 2 or 3 candles really looked lack-luster. I point that out because many miners do look like that now, but suddenly buyers pushed MUX up 7%. We could start seeing buyers step in now that God and Silver are starting to stand out a little more as likely bottoming.
,
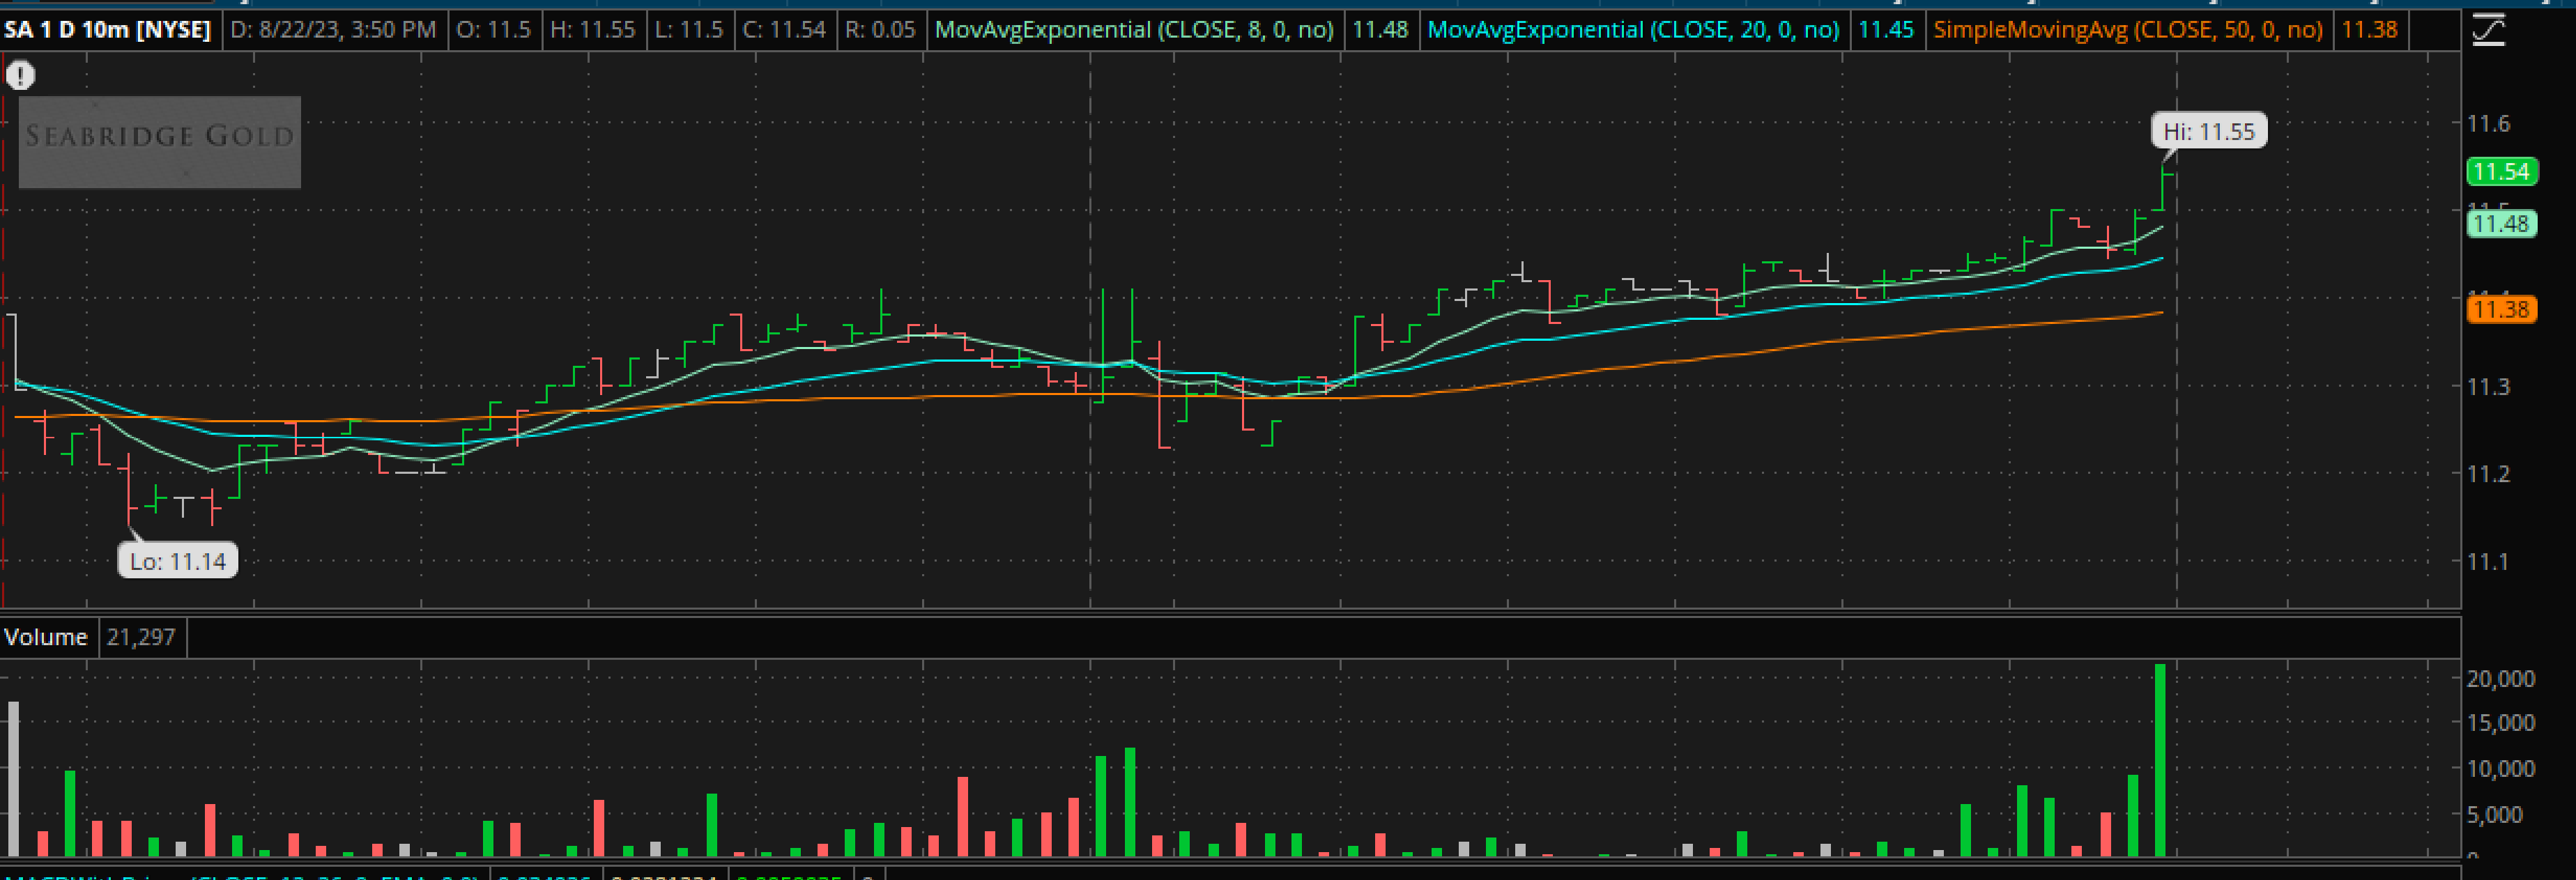
I noticed yesterday that most miners were up 1% or less and simply chopping sideways all day long. Suddenly, in the final hour, several Miners started to Pop, so I grabbed this chart of SA to show that move on a 10 minute chart. What did this move do, if anything?
.
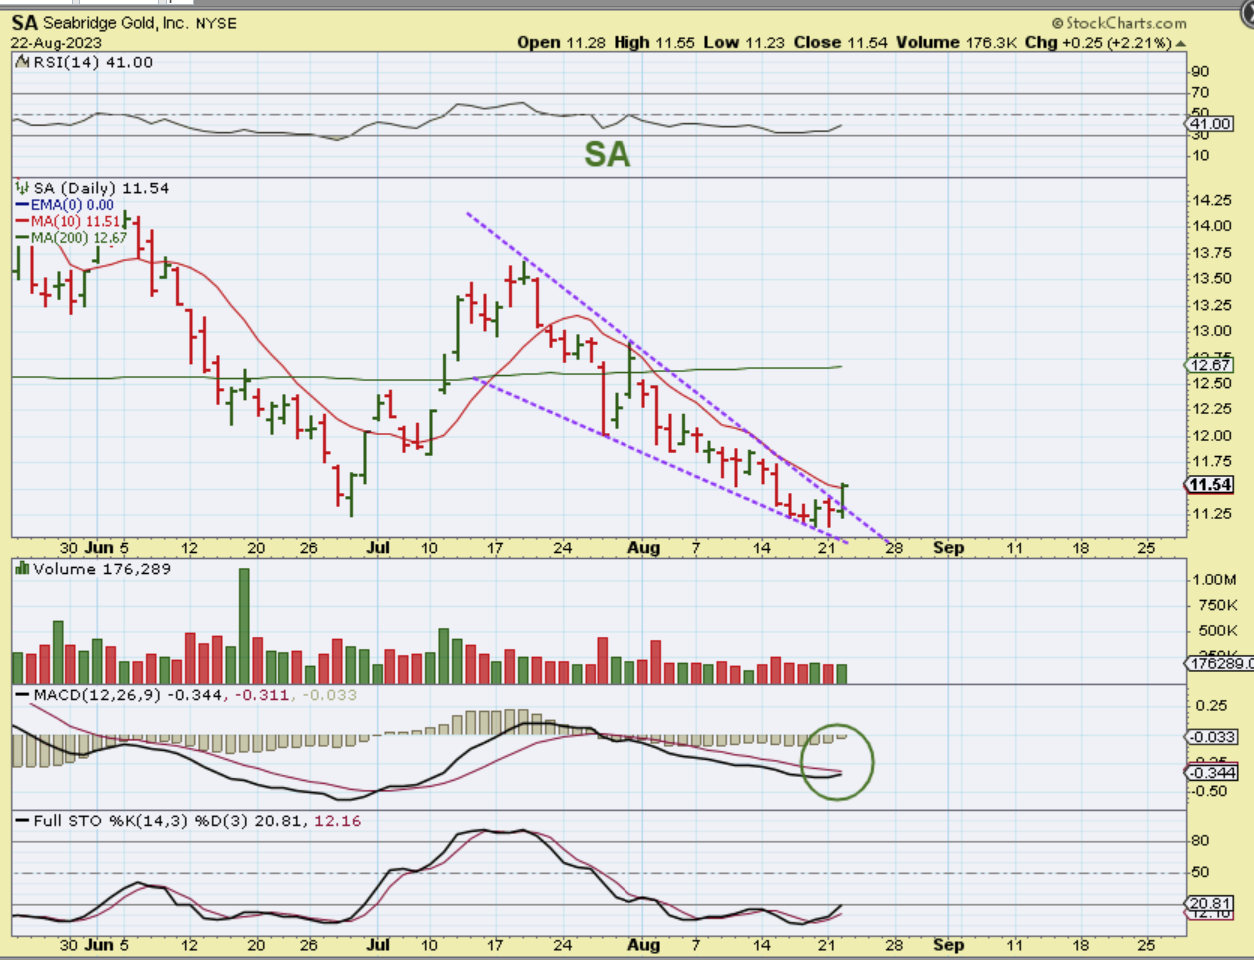
SA only closed up a total of 2.21%, and that isn’t really anything to shout for joy over, but it also broke a downtrend of a bullish wedge and closed above the 10sma. The good news is that many Miners remain right at their lows.
.
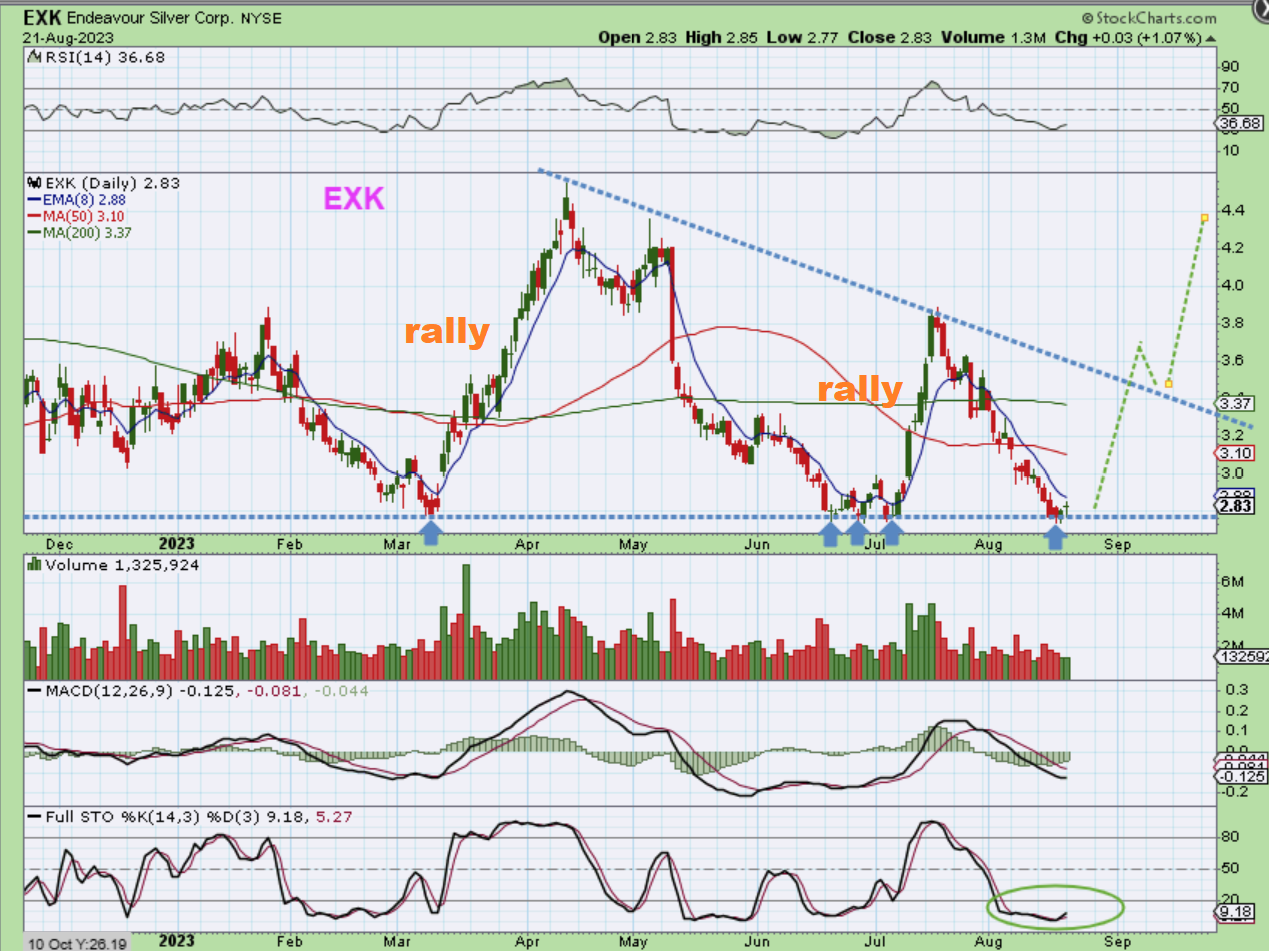
EXK – I just wanted to point out the move that EXK did at the June lows. Didn’t it look weak and pathetic as it bounced around for 2 weeks at the lows? Yes it did, but suddenly it surged 30% and that was with several straight days of gains in a row, so we all know how these miners can move once they bottom. This is just a friendly reminder.
.
The focus begins to intensify on the Precious Metals Sector and especially with the miners, since this could be the sale of the year taking place in front of us as they linger at the lows. I would like to see more moves like we saw with MUX yesterday, where MUX looks ready to play catch up and jumped 7%. Will others begin to follow? I do think so, but it may be choppy until the USD rolls over. As mentioned, several Miners started to push higher right at the close (SA chart was included), so buying and holding a small basket of miners now or after GDX closes above the 10sma, could give you some good gains over time. I obviously will continue to monitor this sector and will post charts of miners that look like buy opportunities. Right now, many look very similar as they are still at the lows and can be bought as laggers. Let’s take a look at DRD, so I can show you another detail.
.
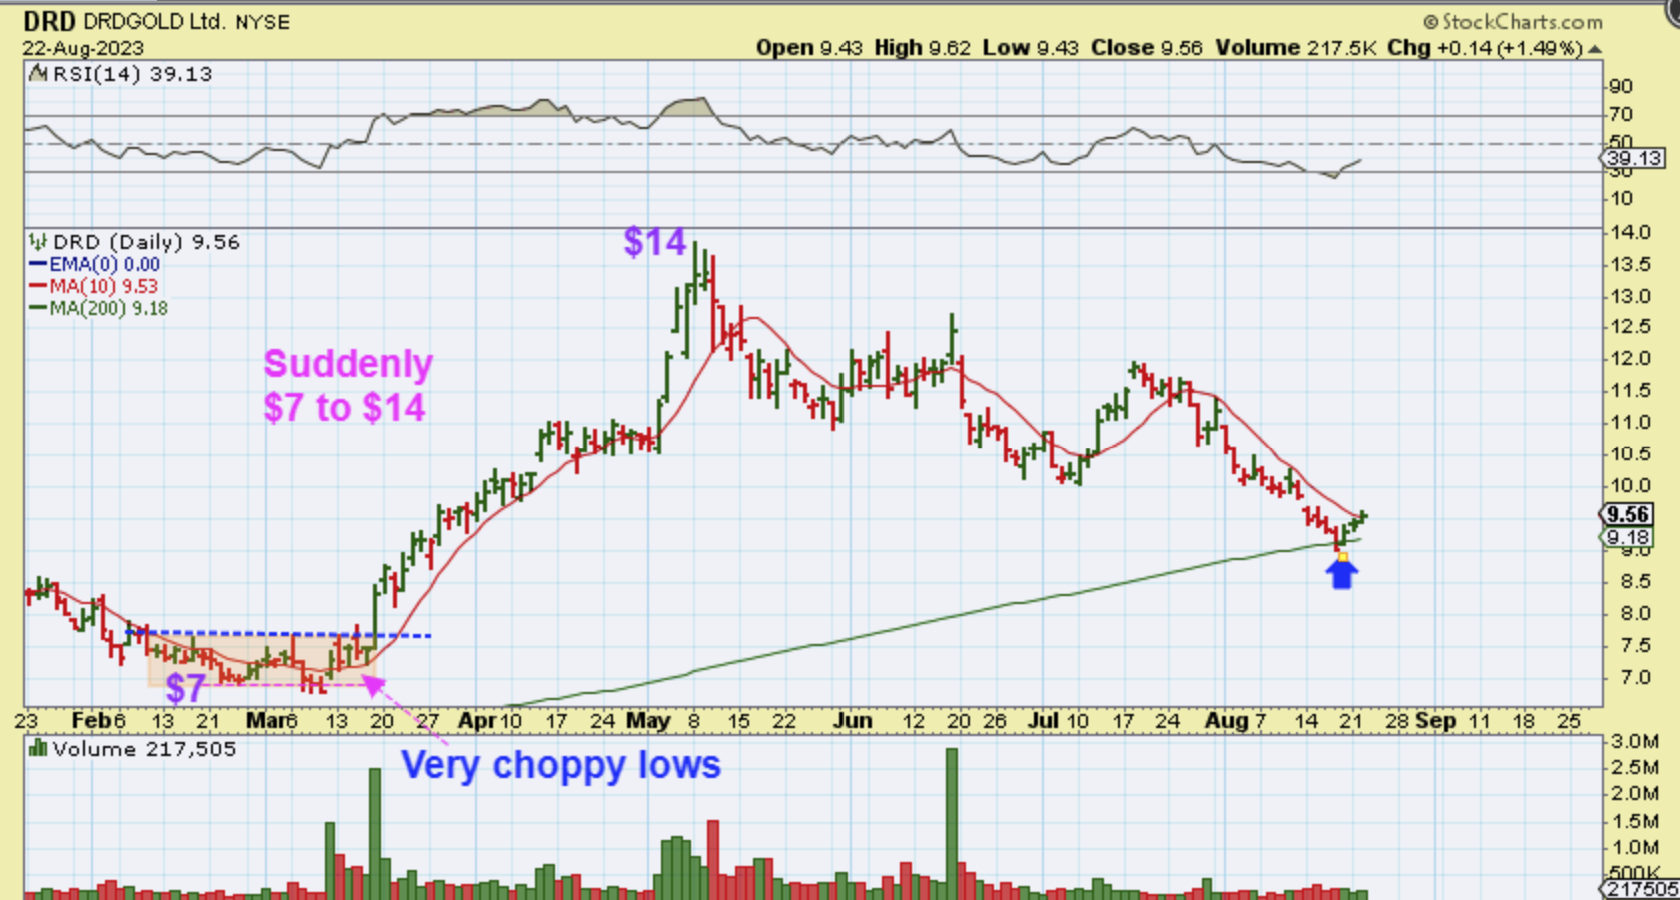
DRD just reversed at support (the 200sma).
1. On that March run, it ran up 100% from $7 to $14, if you bought it at the lows.
2. At those lows, DRD looked weak and choppy like some miners right now.
3. This is how some Miners may begin to look at these lows until they get going.
.
Enjoy your Wednesday trading and hopefully this sector just continues to add to the gains. 🙂
.
~ALEX
.
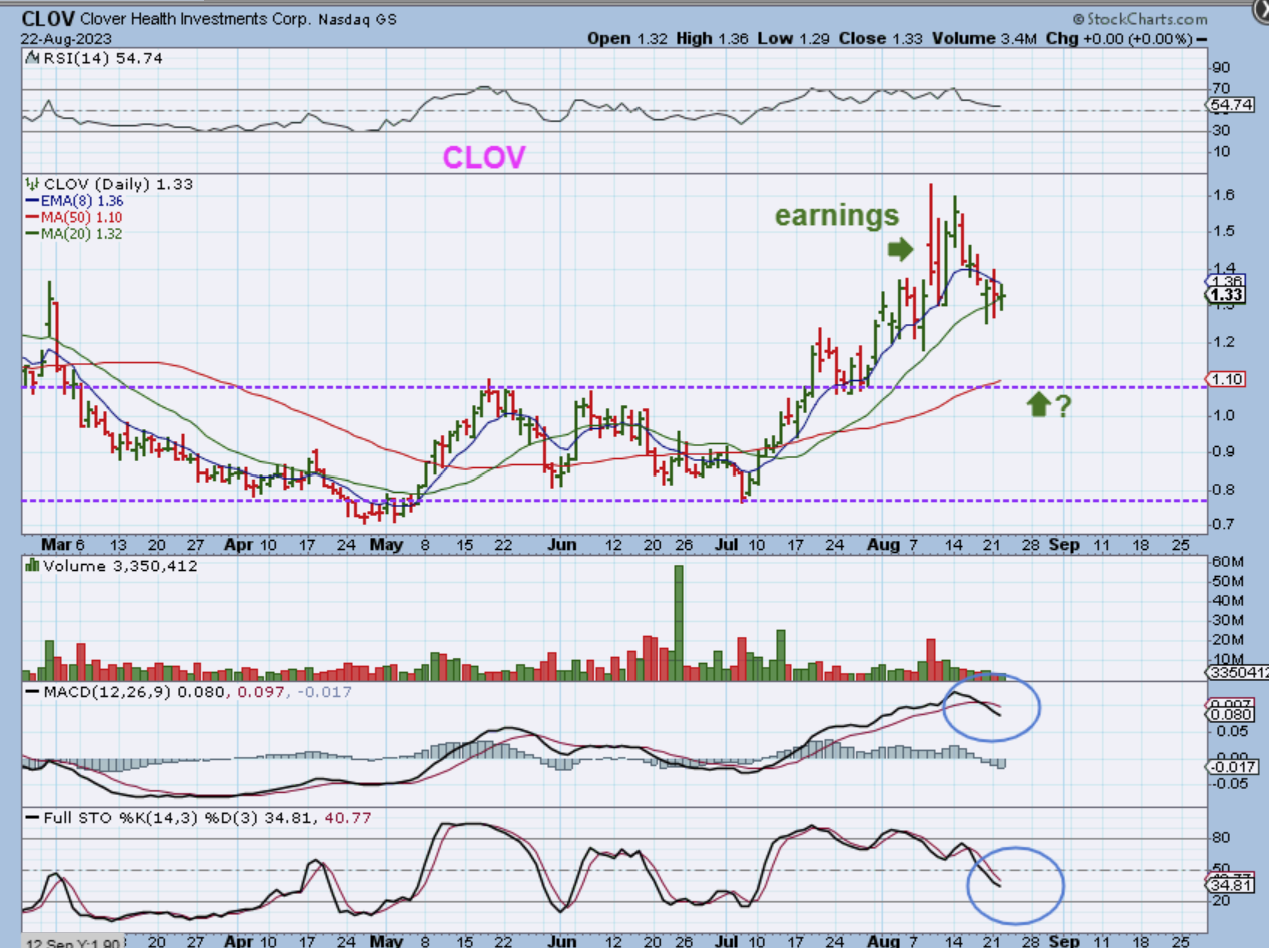
By request: Is CLOV Bullish?
Yes, CLOV is bullish. It has acted bullishly as it moved out of the July lows and 6 month base, but it could still dip a little lower to back test the base & 50sma. It is at the 20sma right now, but it isn’t oversold & the MACD did cross down, so when I look at this I do think that it has a good chance of falling further to the 50sma as support.