Tuesday August 29th – Riding That Bull Takes Practice
Bull Markets and especially some Bull Market Lows can be choppy and difficult at times, as the Buyers and Sellers go to battle. This may make some nervous too. When it comes to the current set up in the Precious Metals Sector, I like what I see as bullish, but I want to further discuss things to try to help some that may have become nervous last Friday. These discussions and especially by looking at charts can help to put that bullishness back into perspective. I’ll try to do that again in todays report, hopefully adding a little more confidence to the set ups. But first we’ll have our regular review…
.
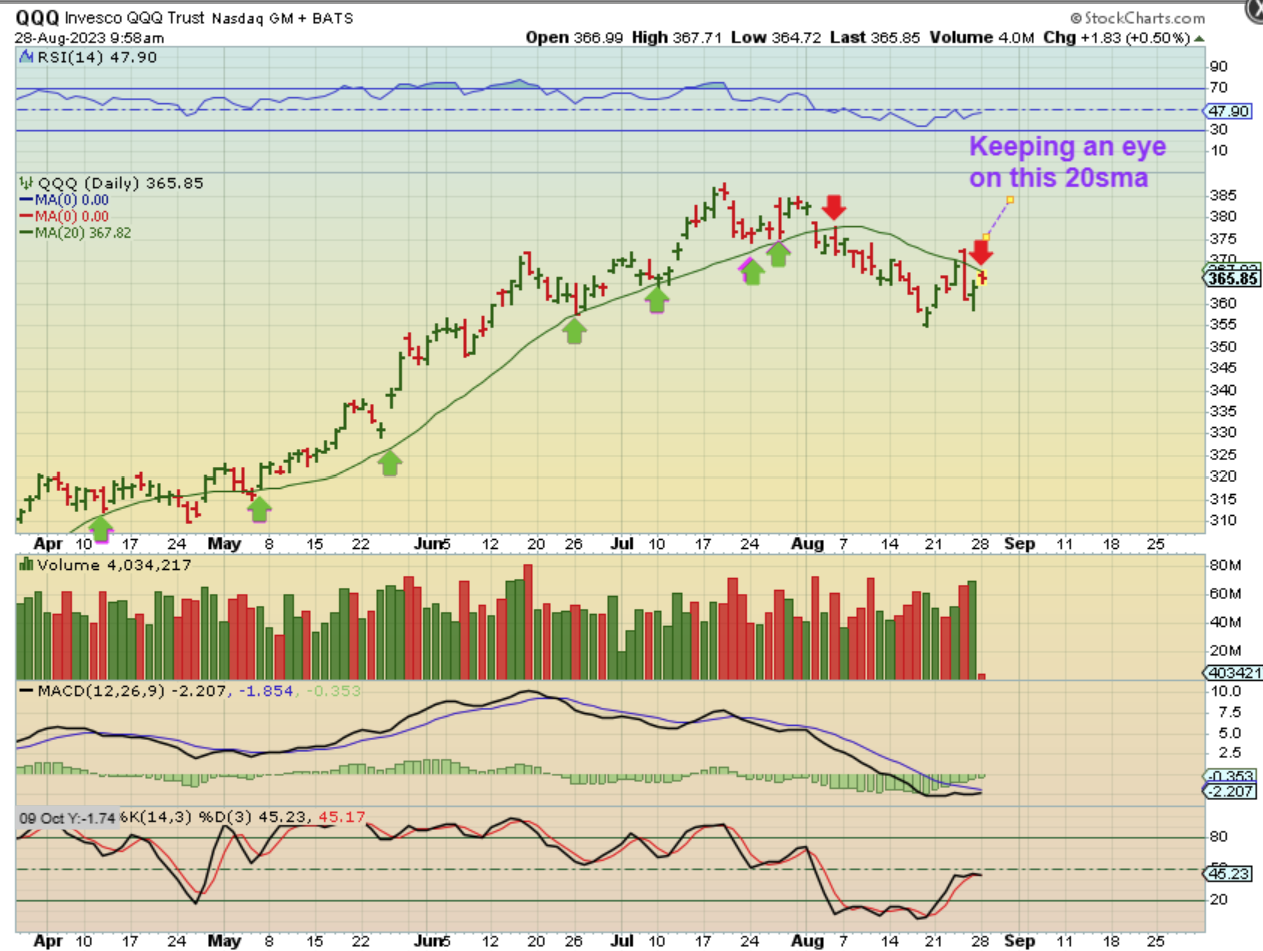
This chart is fairly neutral. It could break either way, higher or lower, sot I posted this chart of The QQQ 1/2 hr into trading simply as a reminder of that. Until we get above the resistance areas, there is still a chance of a downside drop (Use stops& Raise them later).
.
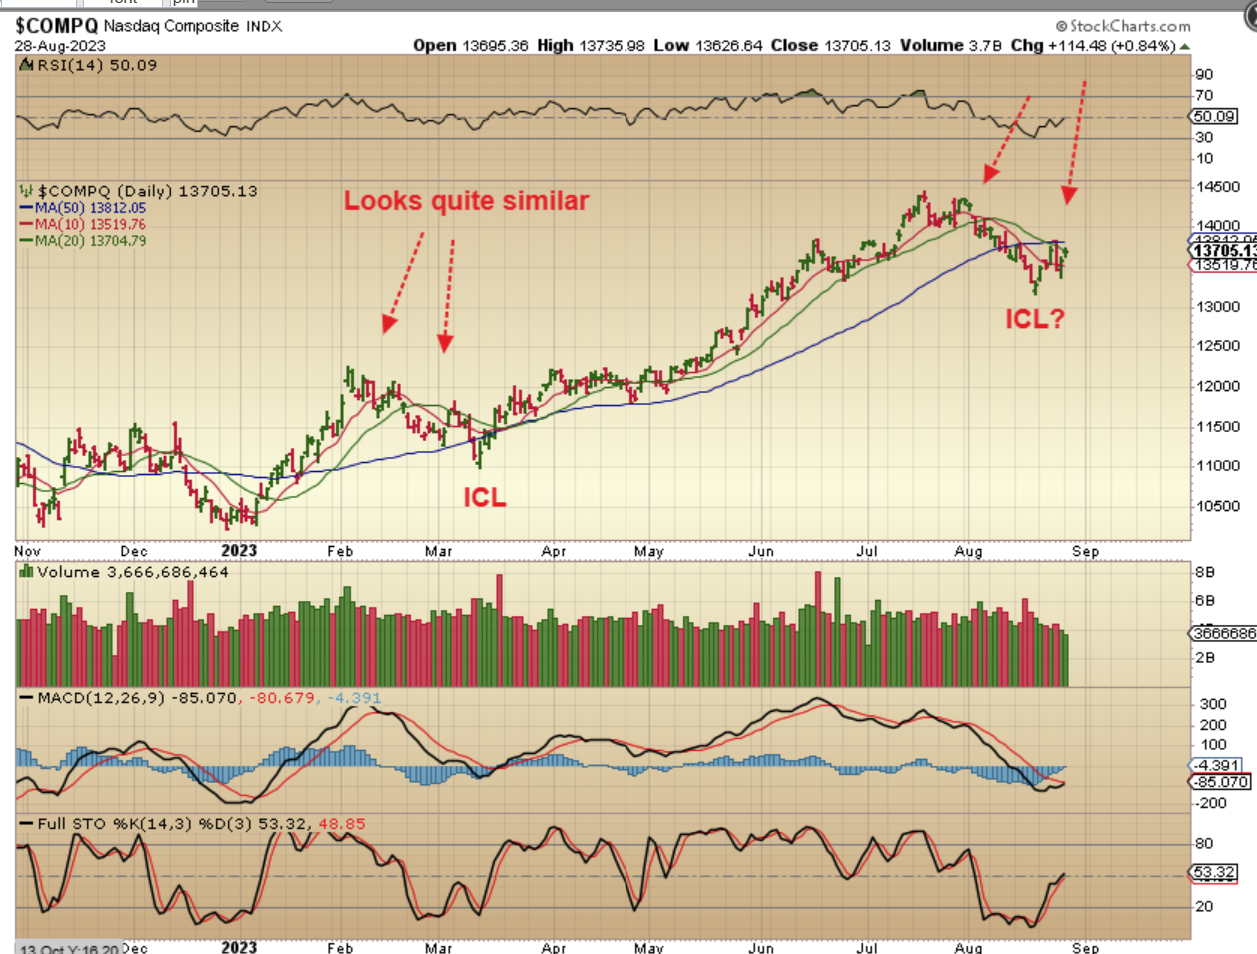
NASDAQ – I do like what I see with the MACD here and this is day 6. It may be building steam to break above the 50sma. In fact, doesn’t it even look a lot like the last ICL? It has a similar time period (length) and a shake out at the 50sma.
.
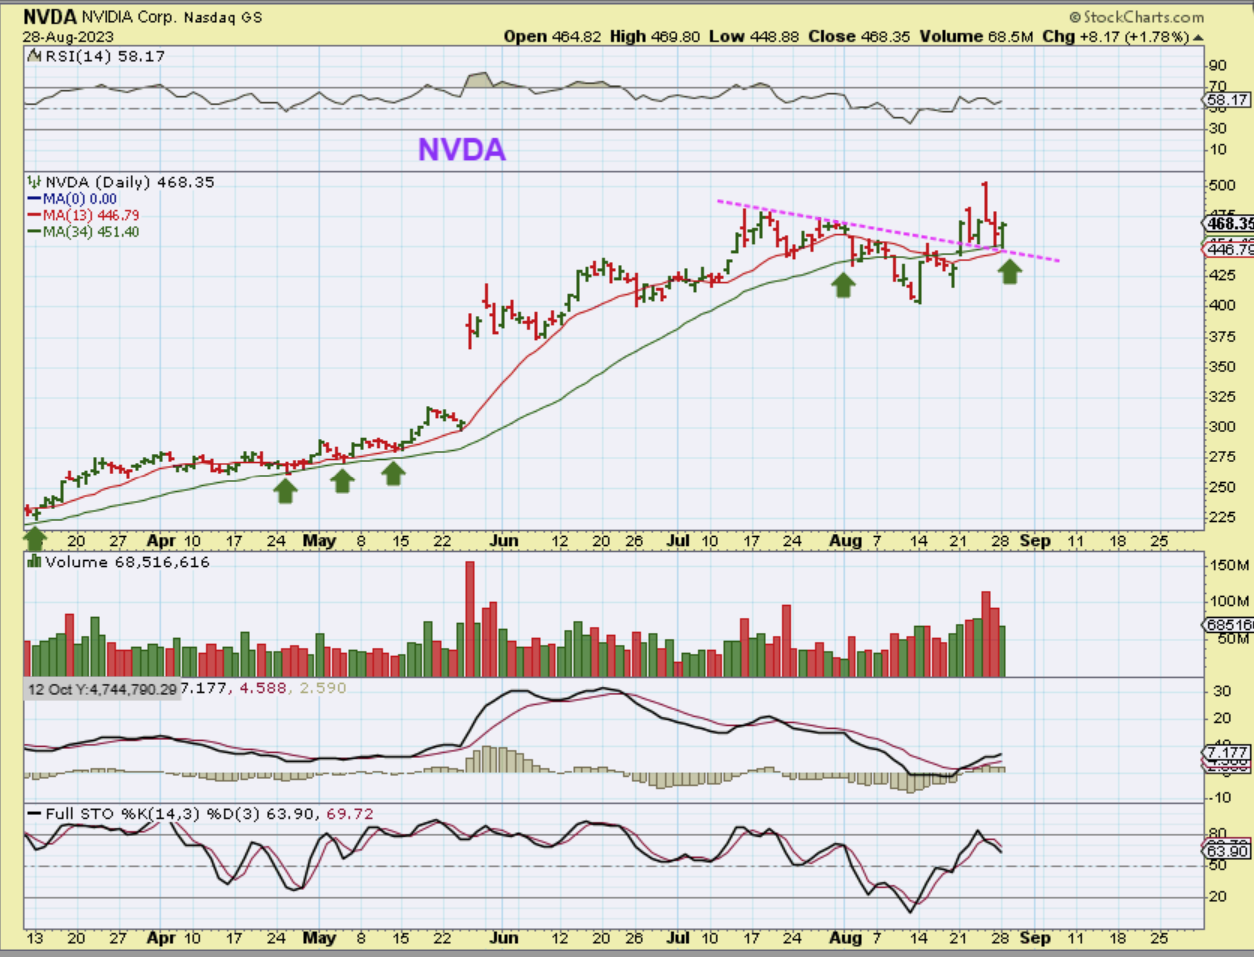
NVDA gapped open higher in a big way after great earnings on Thursday, but then it sold off that Thursday and Friday. It made the markets look weak, but on Monday NVDA reversed at the 10, 13, 20, and 34 sma. NVDA looks good again.
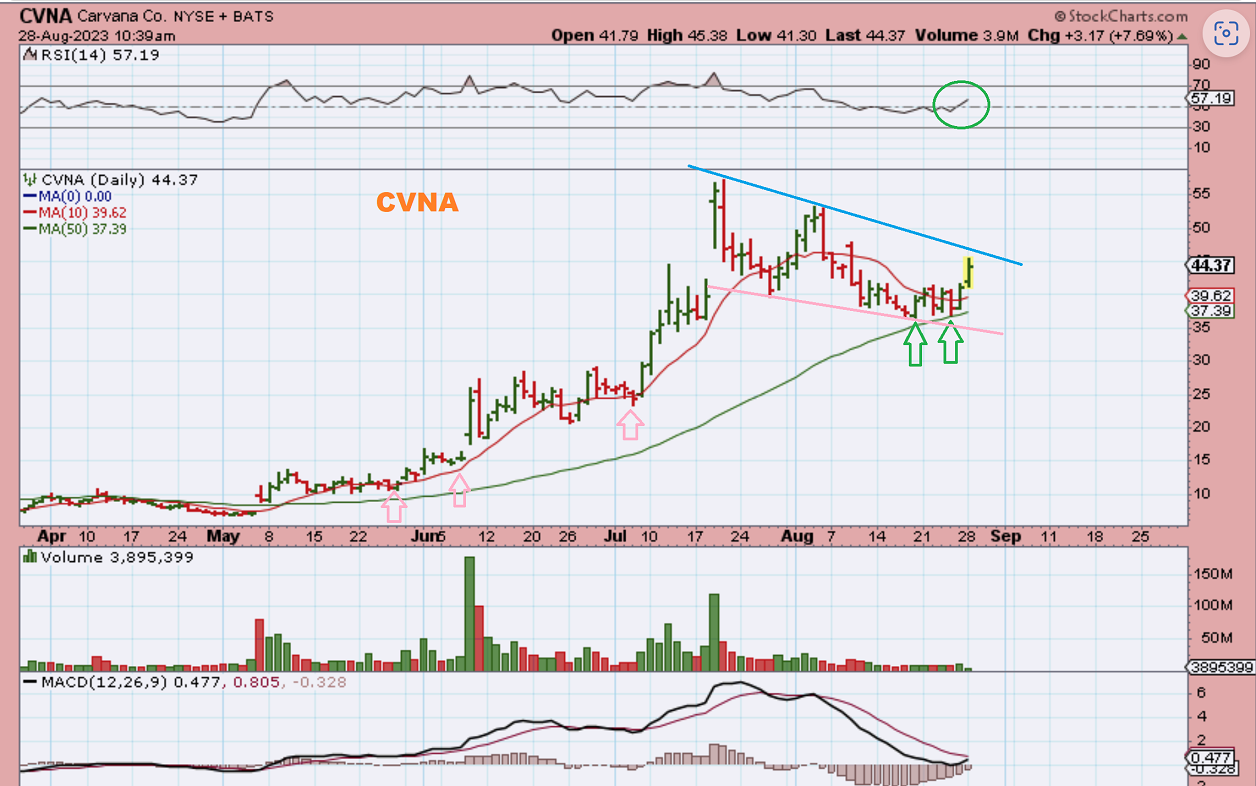
CVNA is a stock that I trade when it becomes bullish too, and I do like the way it has acted bullishly last week ahead of the NASDAQ, so maybe these and other stocks are a sign of bullishness returning in the general markets. CVNA went on to close up 10%.
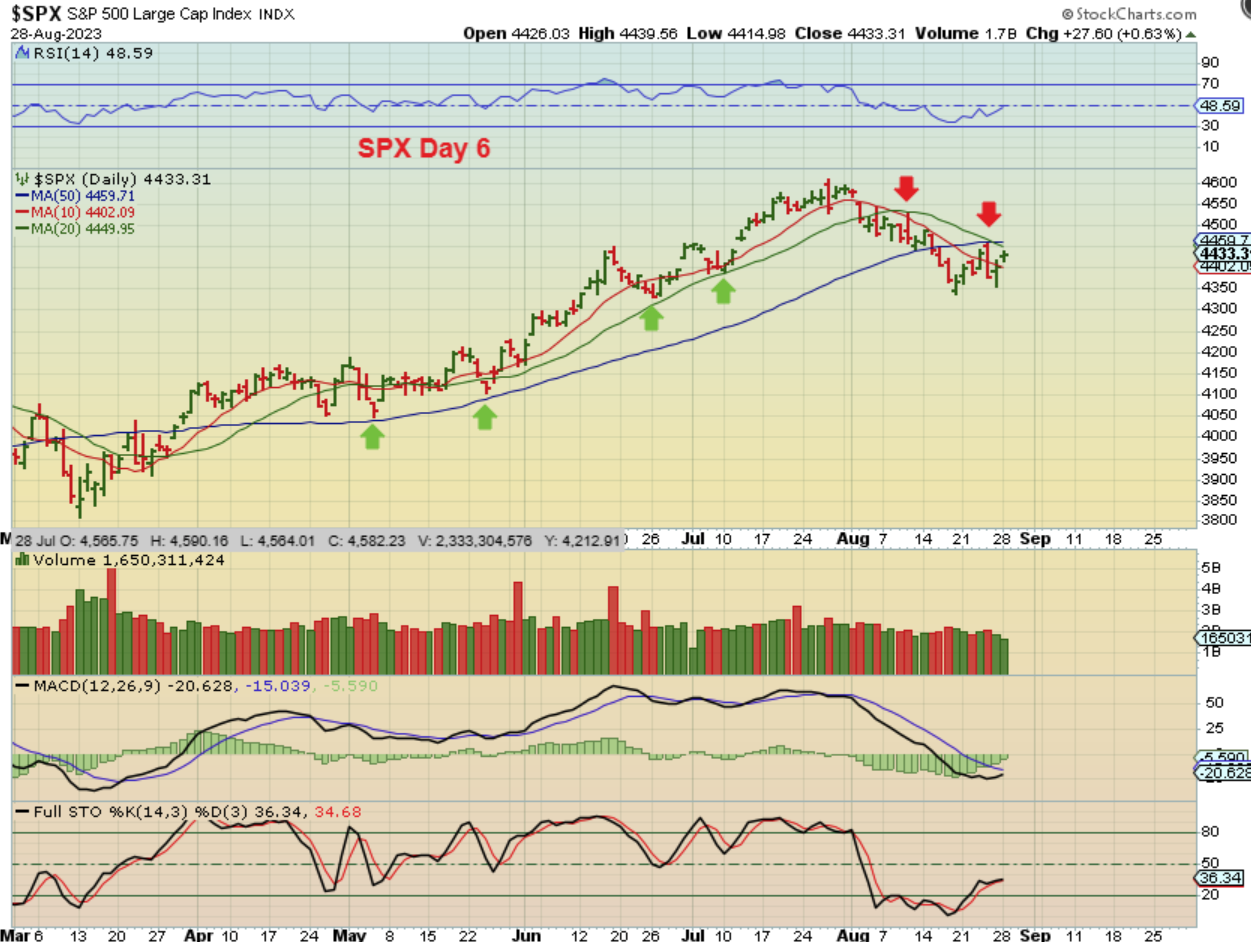
So it is the same with The SPX: Price is still chopping along under the 50sma and it could honestly go either way, but it may be building energy to break out higher, since we do see some stocks firming up. ALWAYS USE STOPS.
.
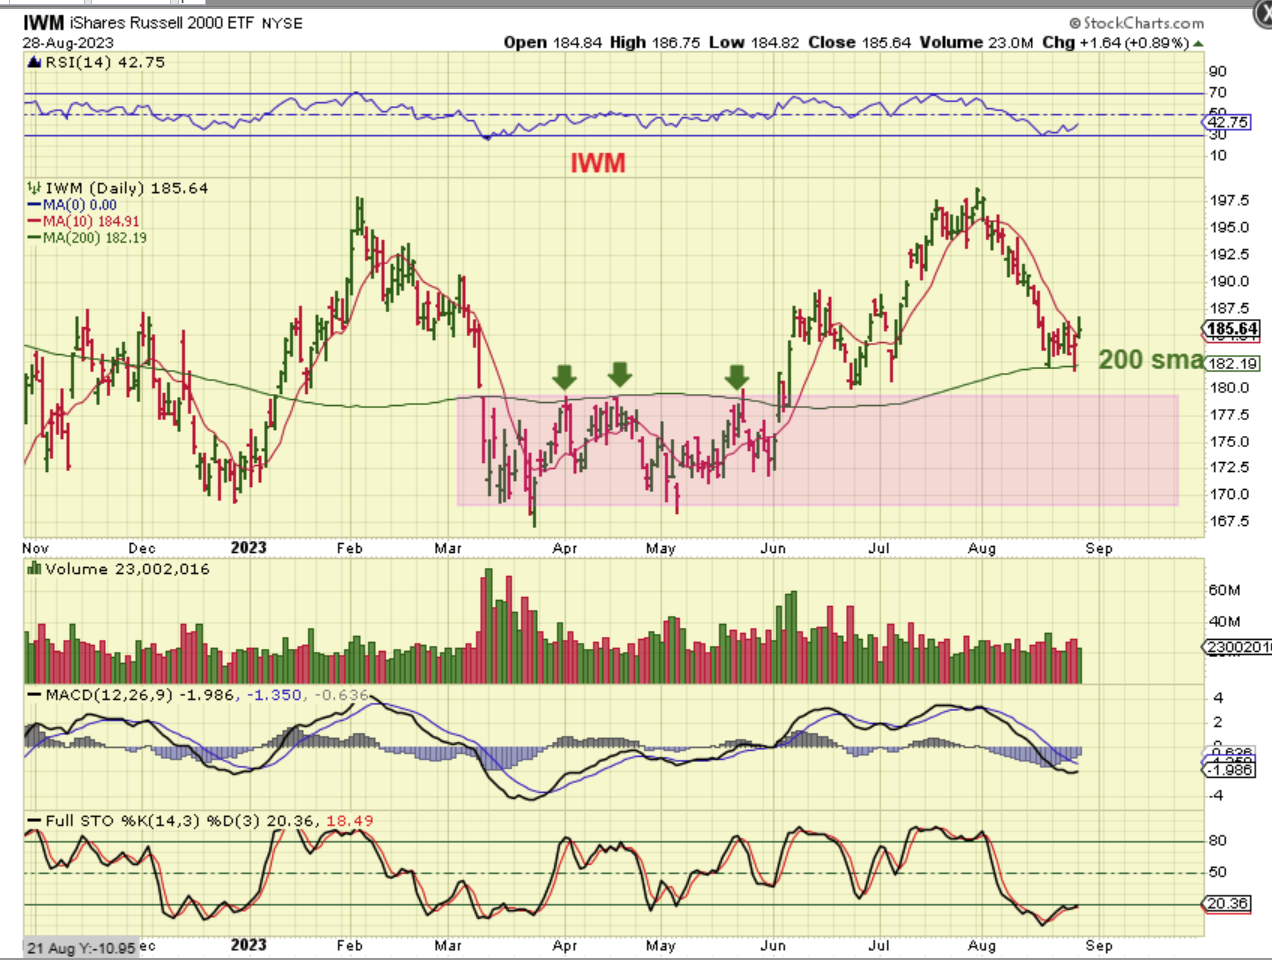
IWM was pretty interesting on that last drop, isn’t it? It broke out from that very choppy base in June and seemed to back test it, but with the recent sell off it has now dropped to the 200sma and held up there. If the General markets reverse higher, this would likely awaken the small caps again, with EV, Clean Energy, Solar, etc running again.
.
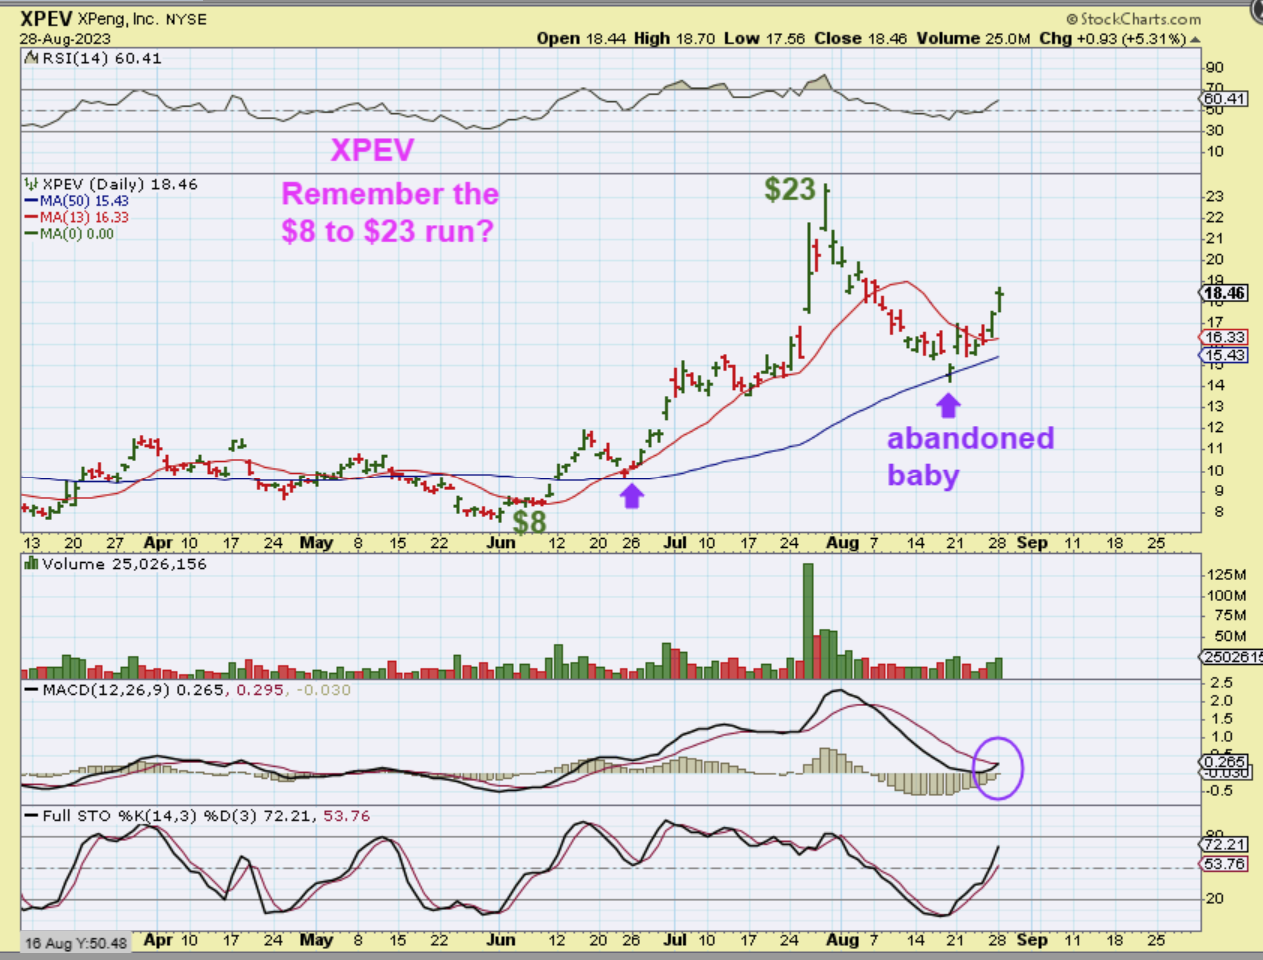
XPEV (SOLO, JOBY, etc) – So I’ll be watching some of the other former ‘runners’ to look for signs of life. I see signs of life here in XPEV and SOLO, so again, this may be indicating that the General Markets have bottomed for now too.
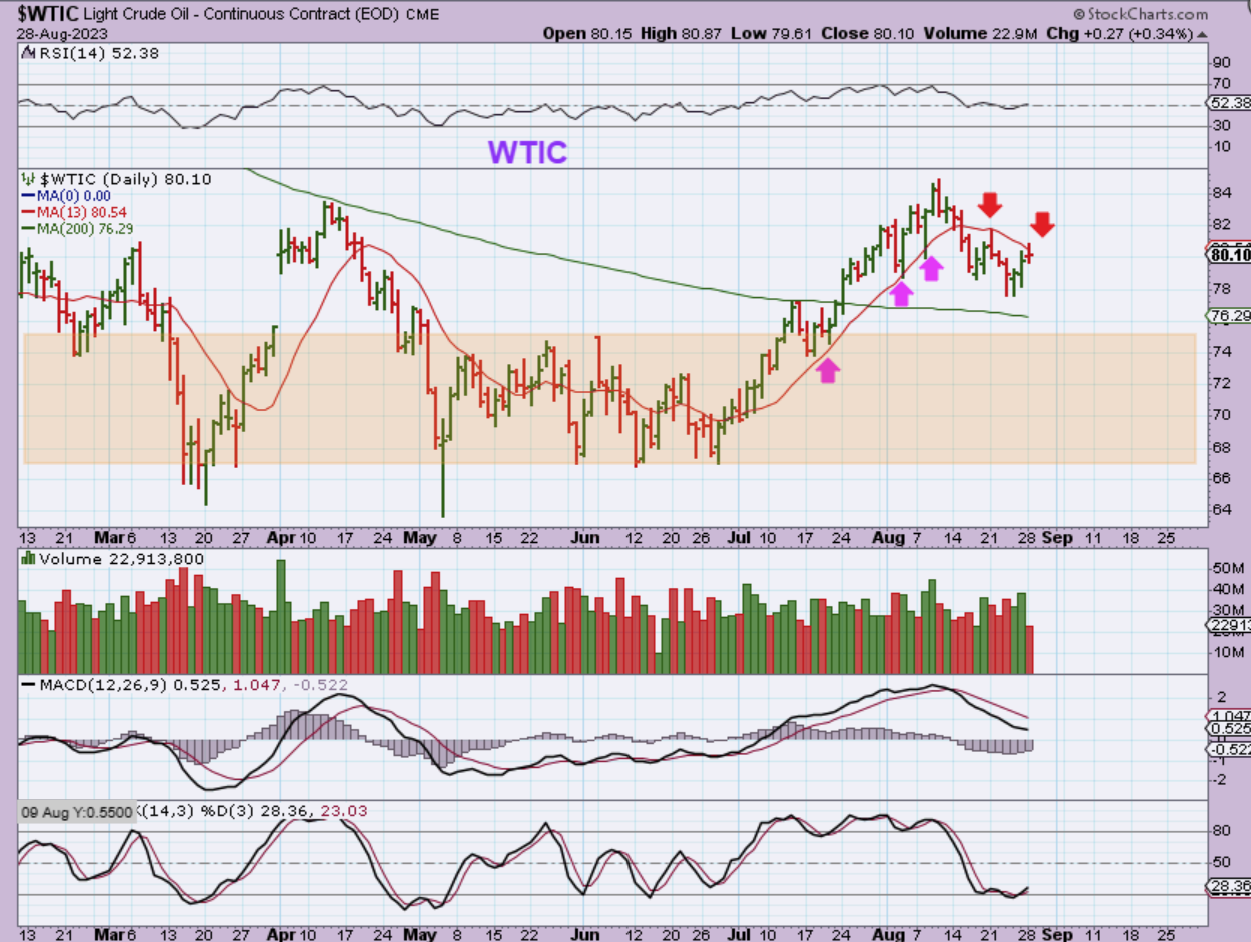
WTIC – I usually use the 10sma, but some sectors move a bit more than others (larger wiggles) so I adjust accordingly. I use the 13 ma for Oil, and Oil has been dipping into the dcl. We may have one in place, but so far price is being held under the 13 sma and the drop could continue to move lower until it tags the 200sma. Oil stocks are holding up bullishly…
.
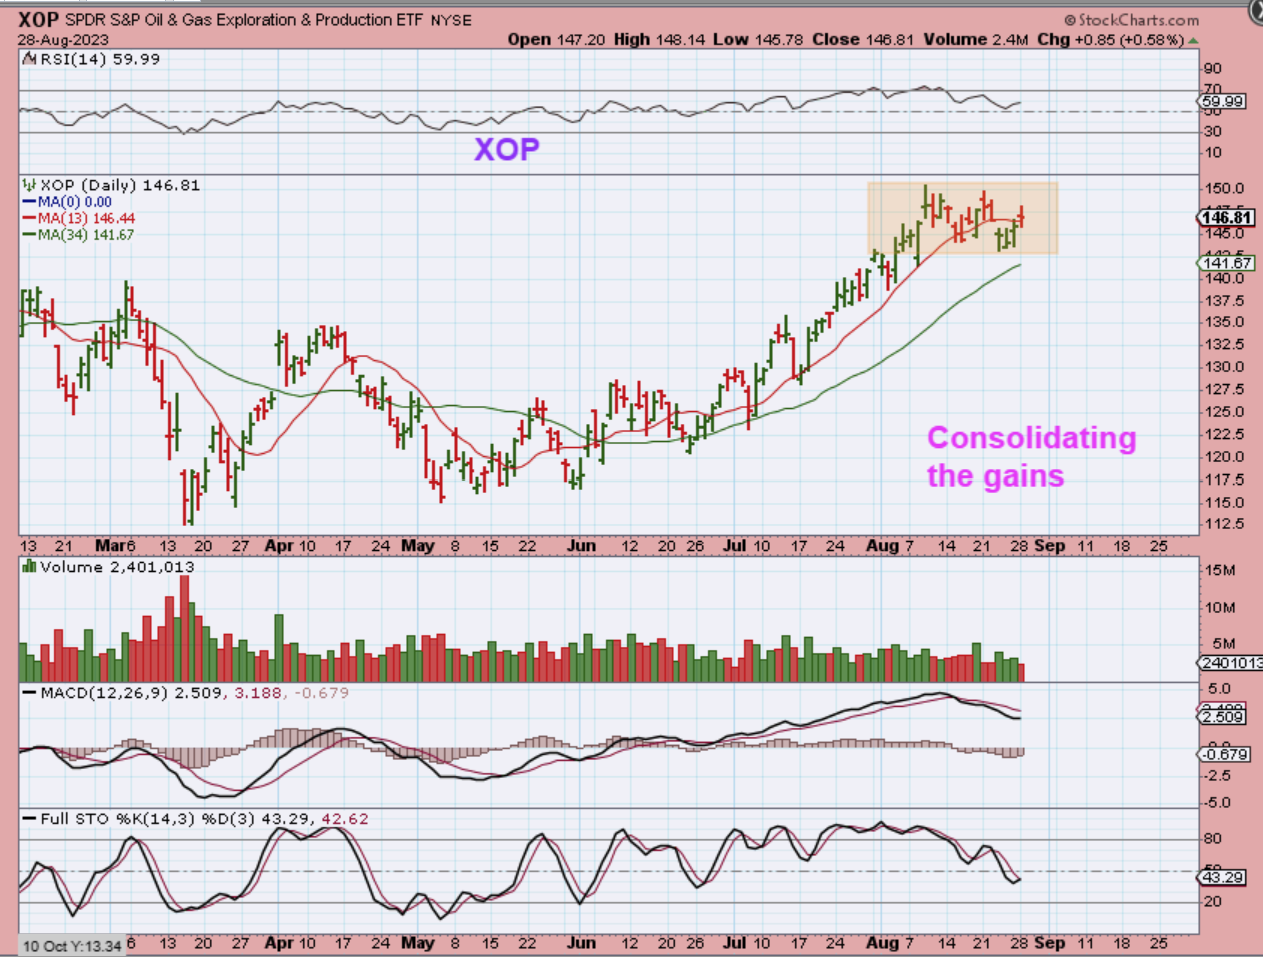
XOP – Oil stocks are holding up bullishly by pretty much just chopping sideways and hardly dipping lower with Oil.
.
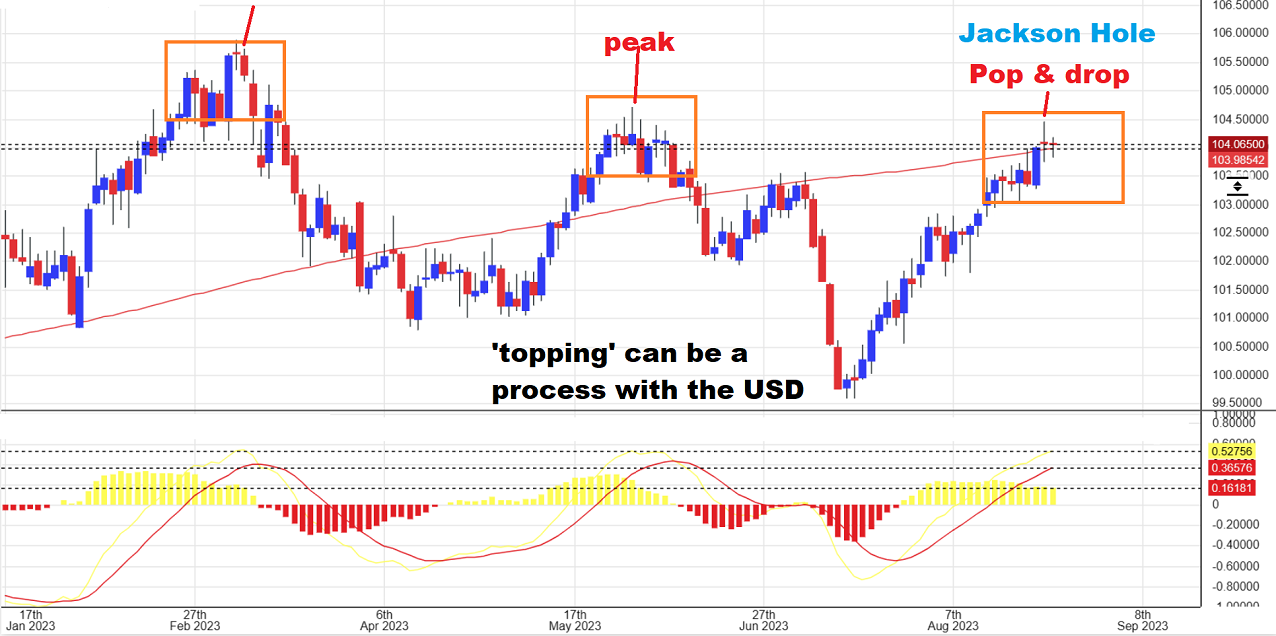
THE USD popped higher Friday with the Jackson Hole speech and then sold off. Take a look at past peaks and you’ll see similar price action. Topping can be a process. As mentioned in recent past reports, The USD is due to dip into a dcl and Gold is due to rise up out of one, so I’m just going to show this topping action verses…
.
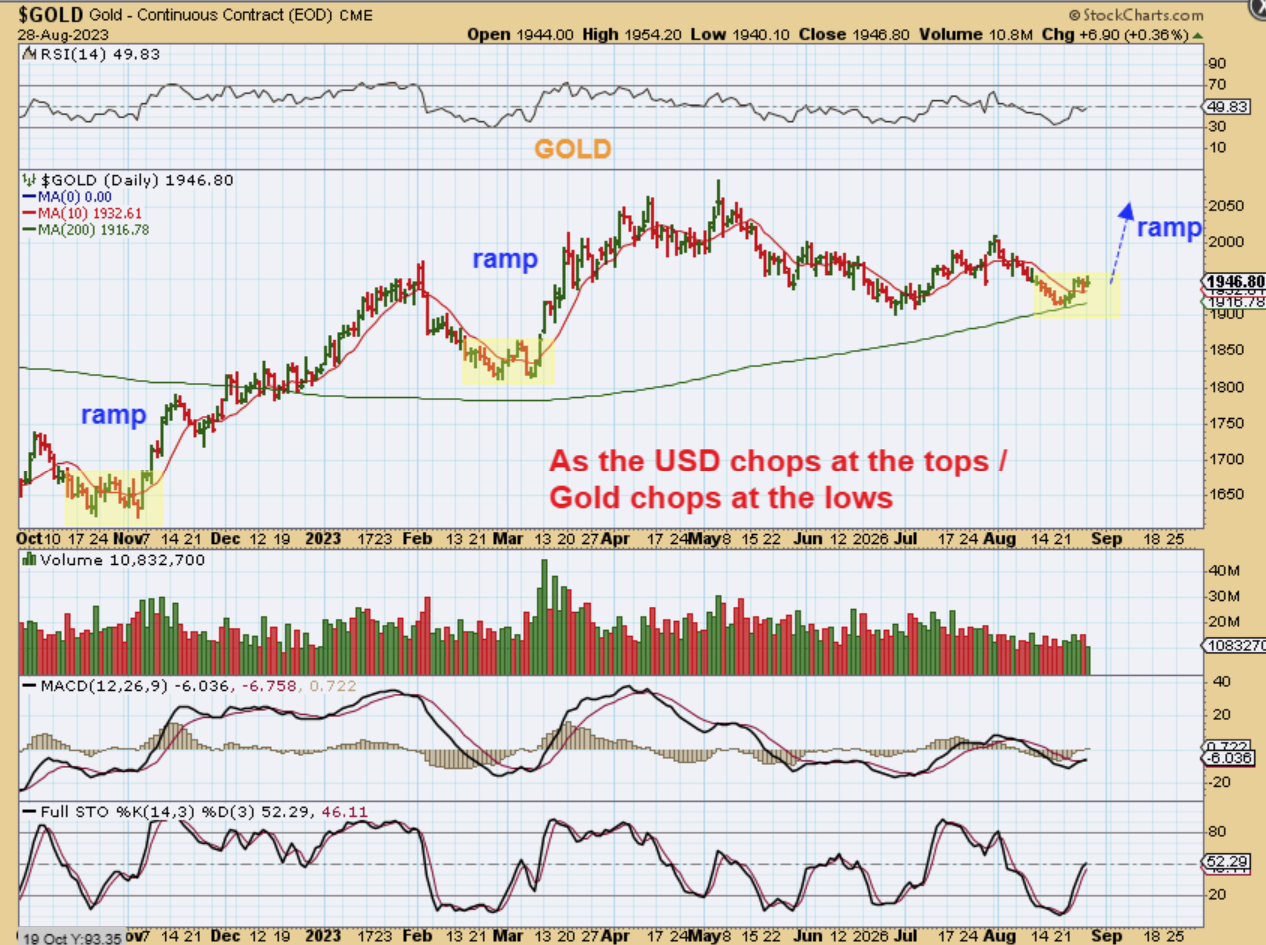
The USD topping action verses Golds bottoming action. Gold has chopped for a bit at the lows of the last 2 ICLs, and then suddenly ramped up. This has often left many behind, since they are jumpy after a sell off and remain afraid to buy the ICL. I’m not talking about Chartfreak subscribers, because they are usually well informed before that ramp up. For example: Right now Chartfreaks are recommended to buy and hold a small basket of miners, just in case that ramp up begins.
.
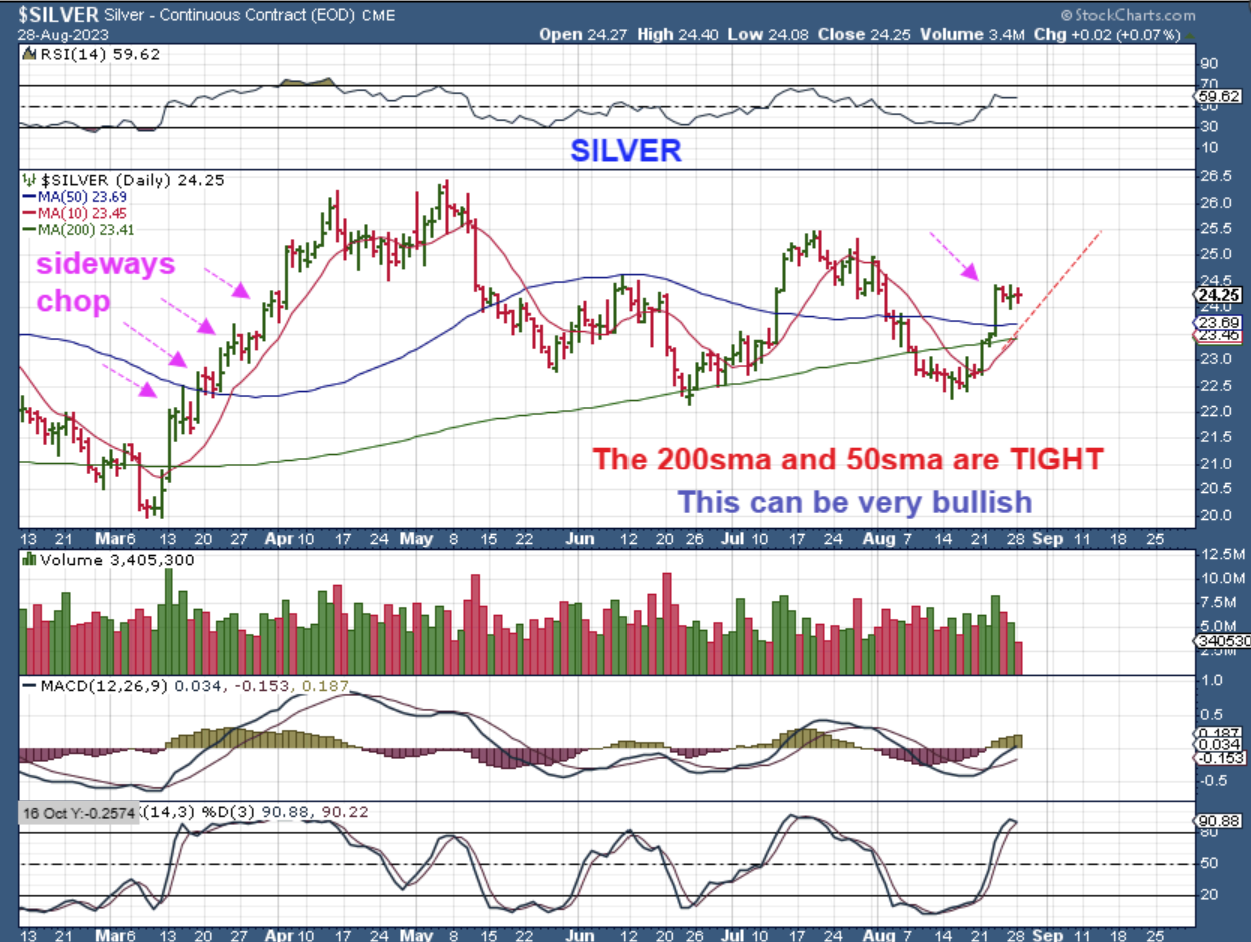
SILVER is bullishly churning sideways too.
.
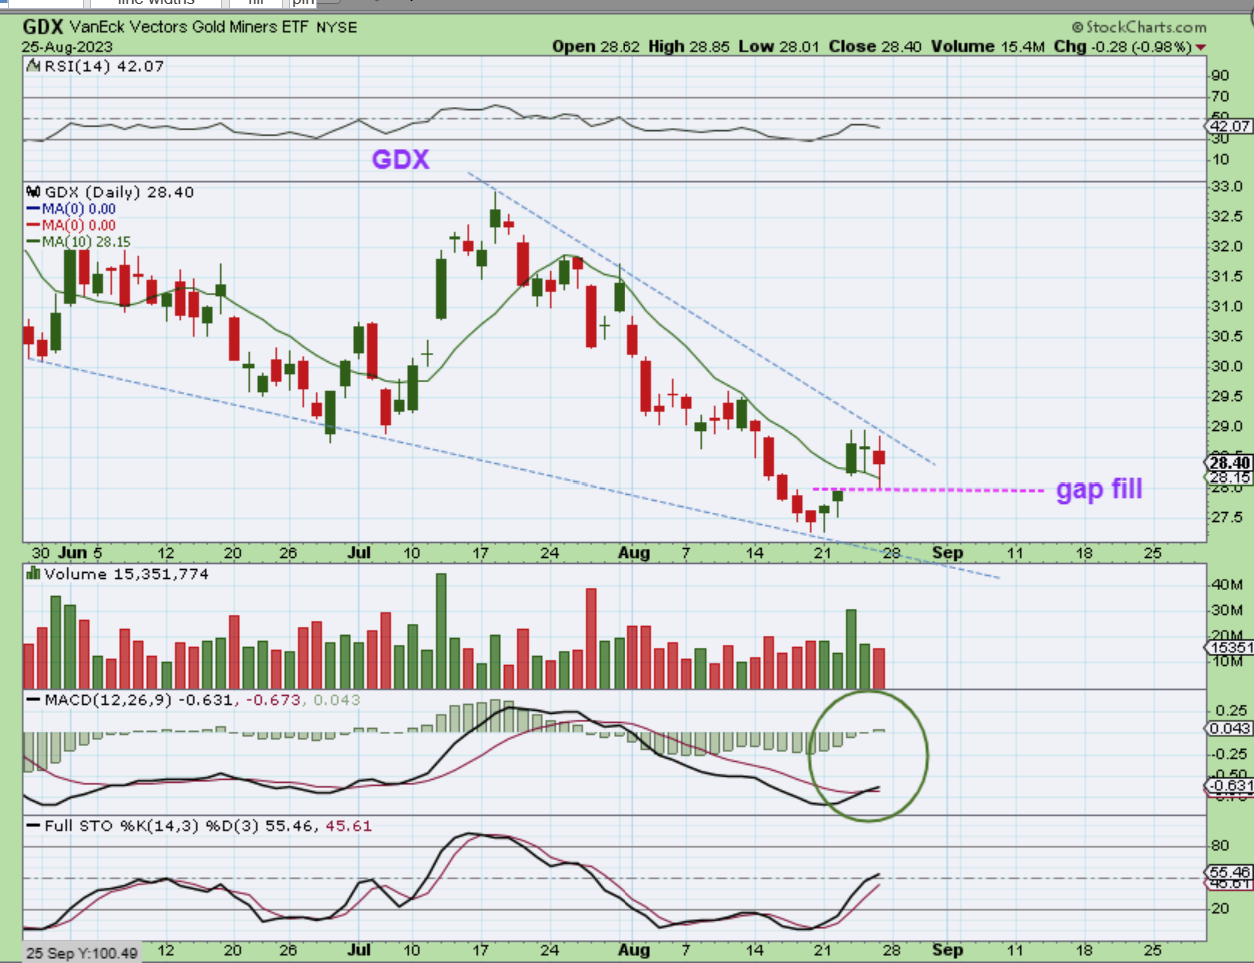
So I pointed out this with The GDX : Fridays Jackson Hole speech caused miners to drop and GDX did a gap fill and then recovered that 10sma. It moved up toward that downtrend line too.
.
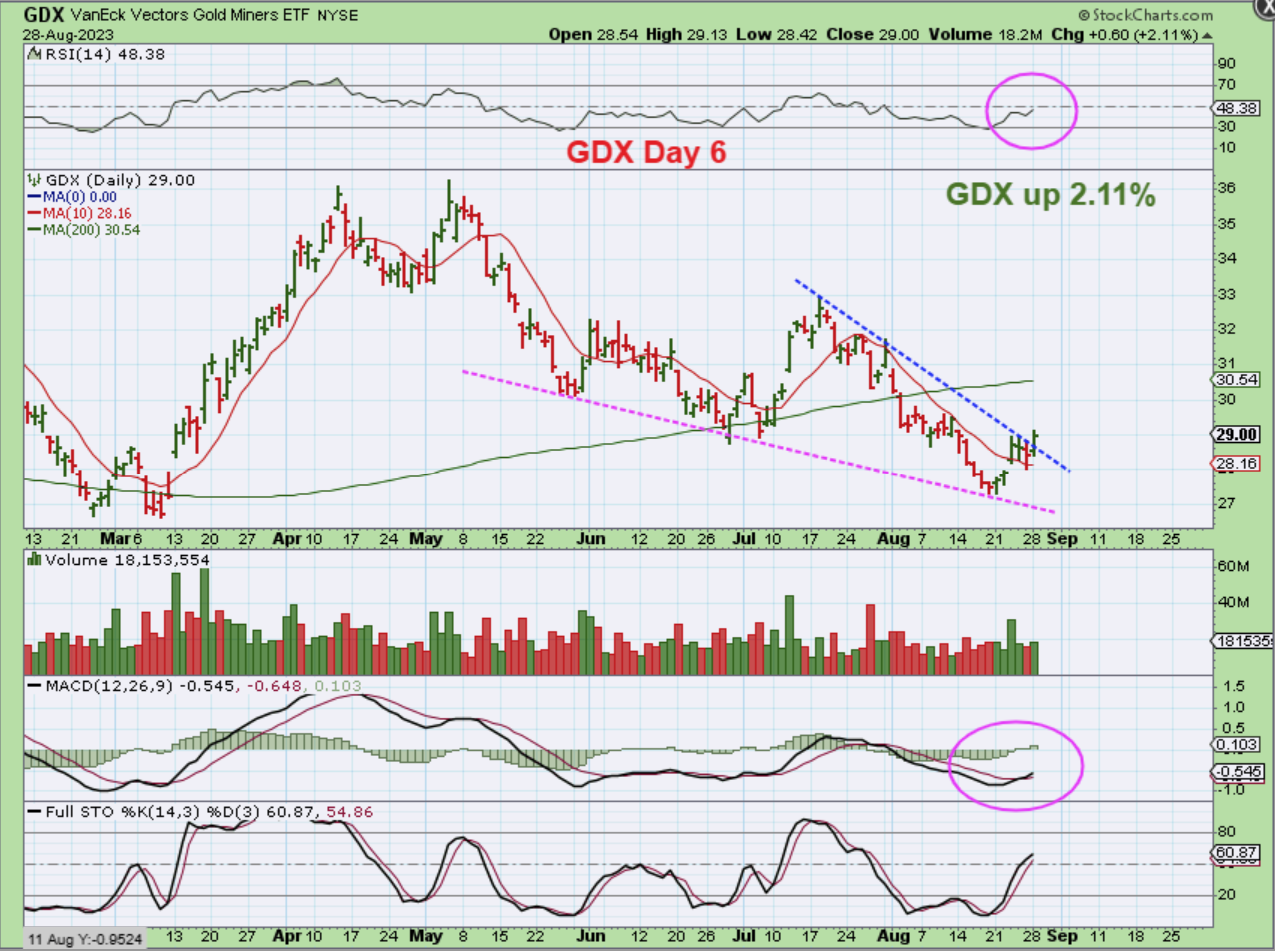
On Monday GDX pushed higher and broke that downtrend line. This is only day 6. That little Friday dip to gap fill is going to look like nothing at all in hindsight, but I know that some thought it was a horrible day in real time. I got 2 emails telling me that Gold stocks were horrible on Friday, but the charts look normal to me.
.
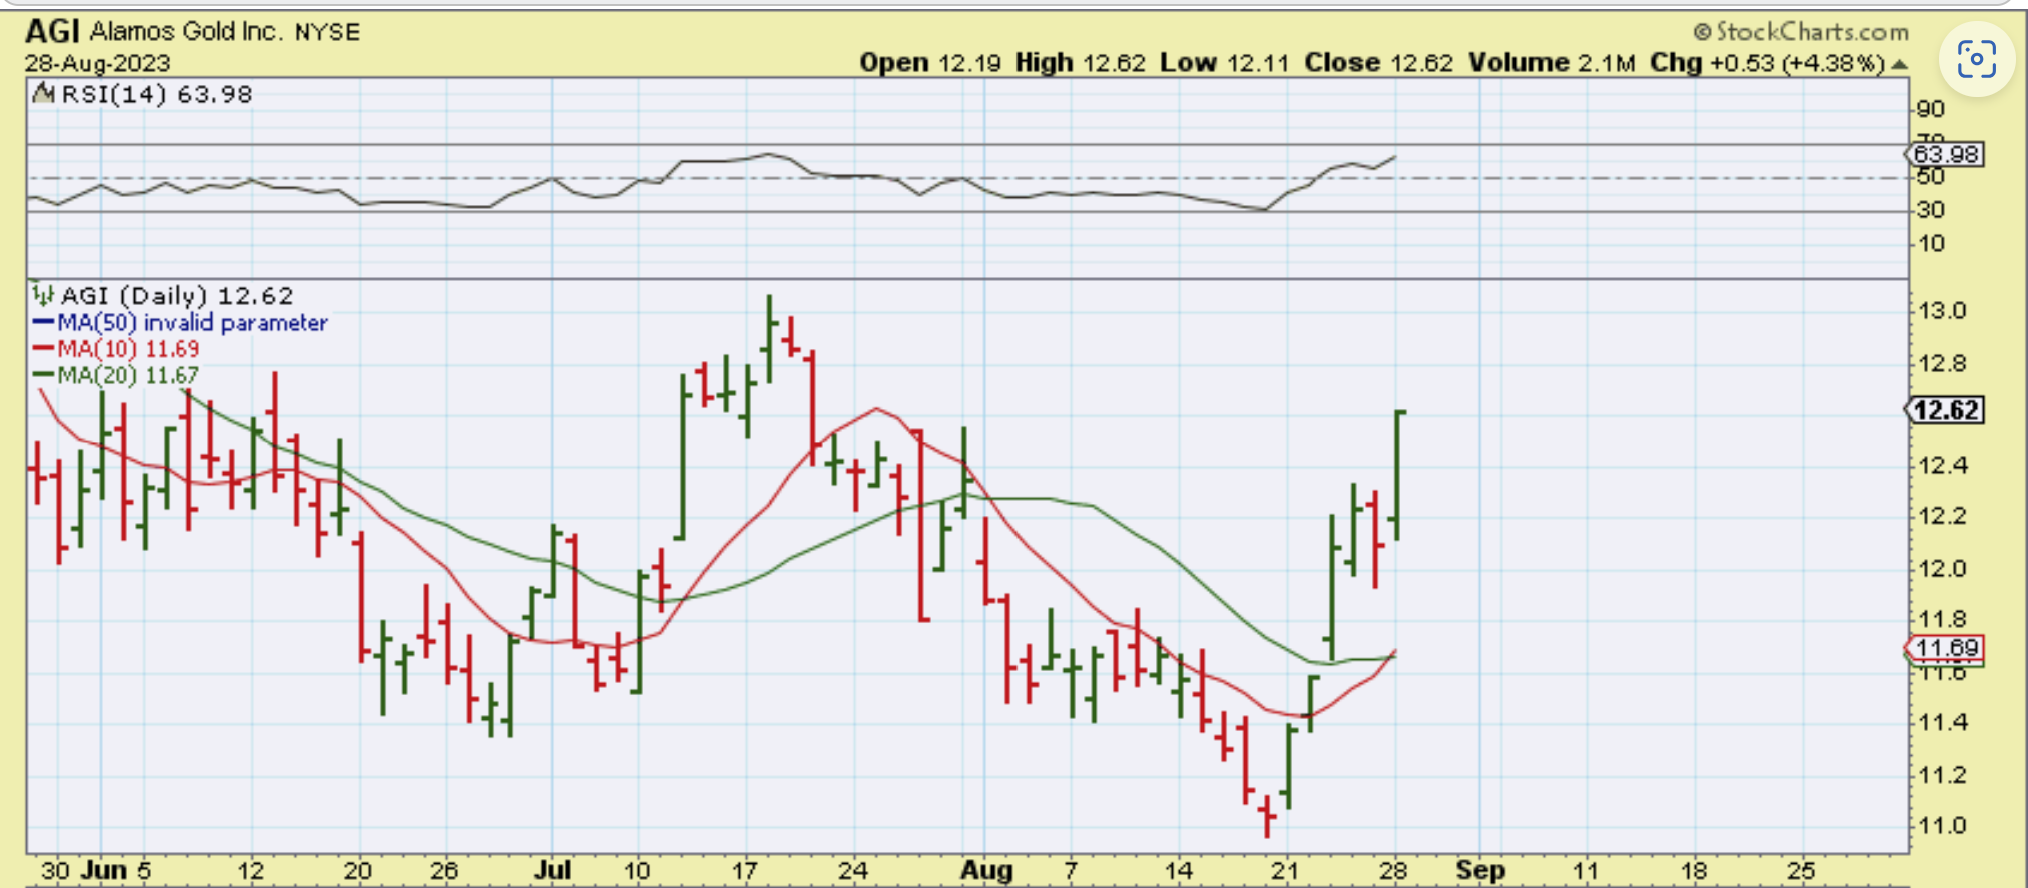
AGI didn’t look bad Friday and Mondays follow through higher was rewarding for those that bought or held on.
.
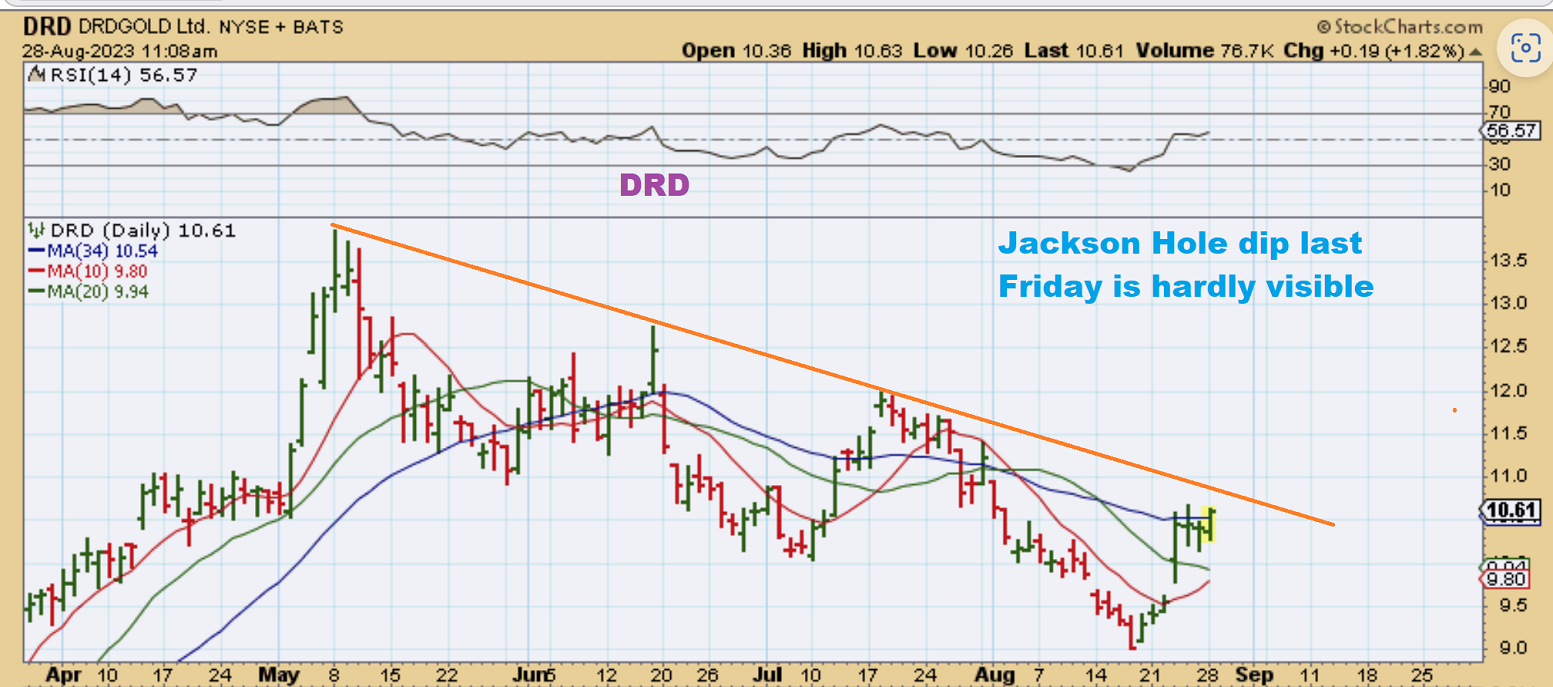
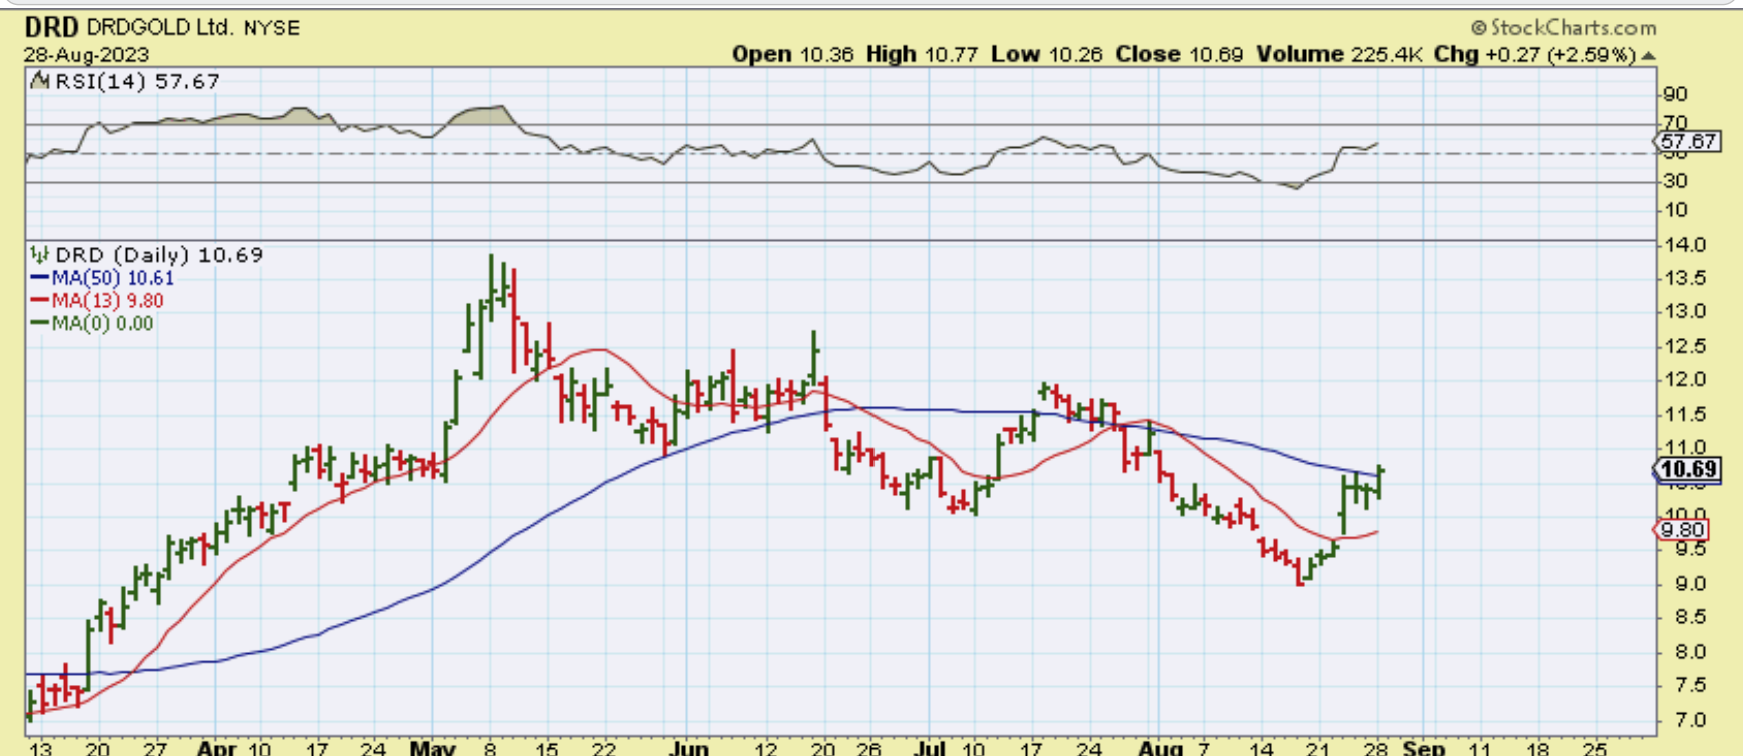
DRD had a small drop on Friday, but many of these then recovered and this was DRD as of 11 a.m. yesterday. In fact…
.
DRD had been crawling bullishly under the 50sma and broke above it yesterday, so this ‘buy and hold’ should be paying off over time too.
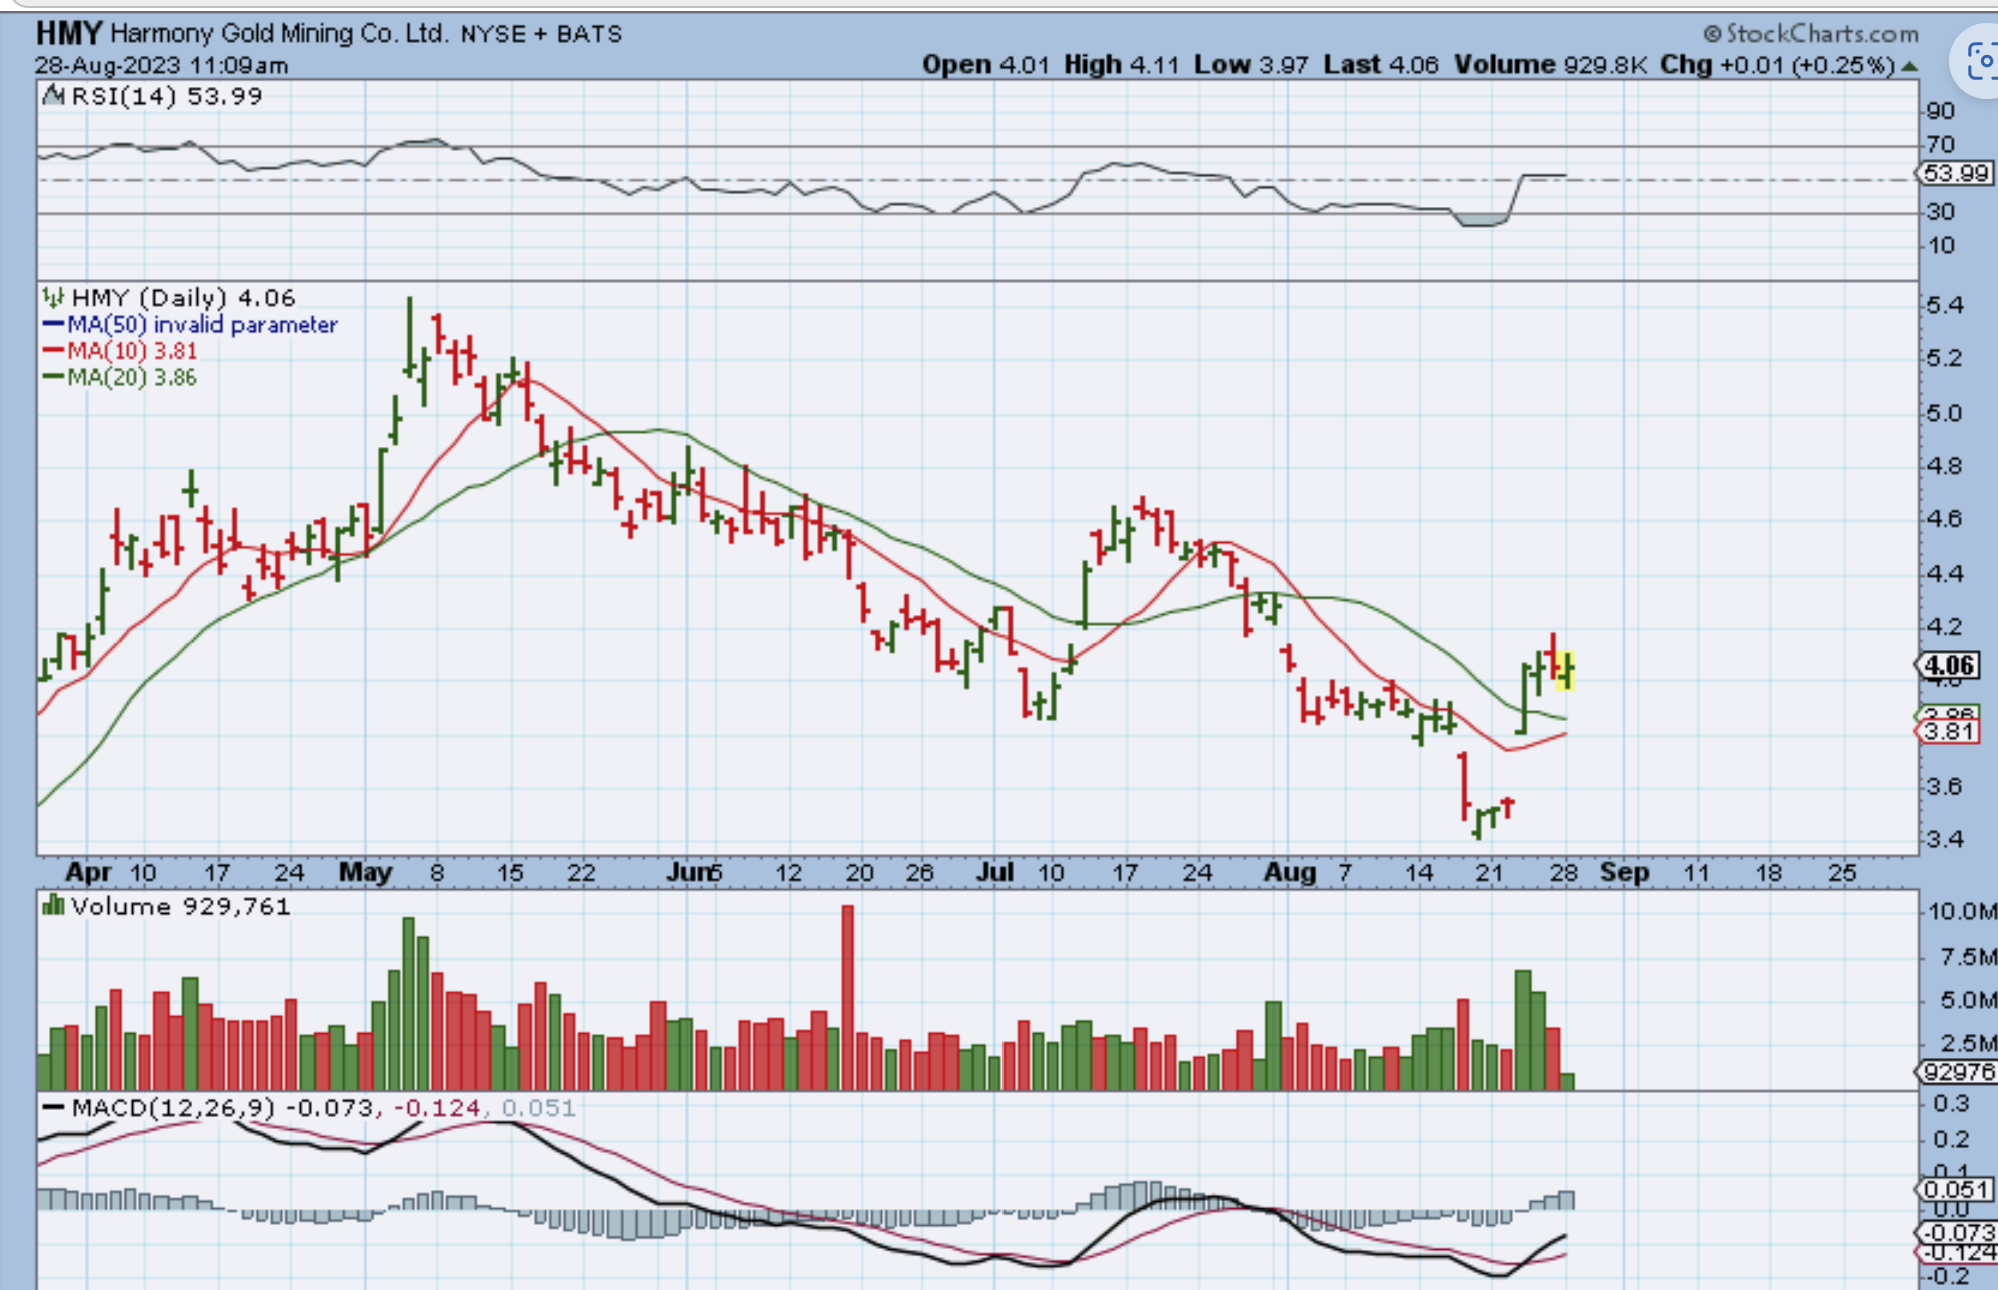
HMY remains bullish.
.
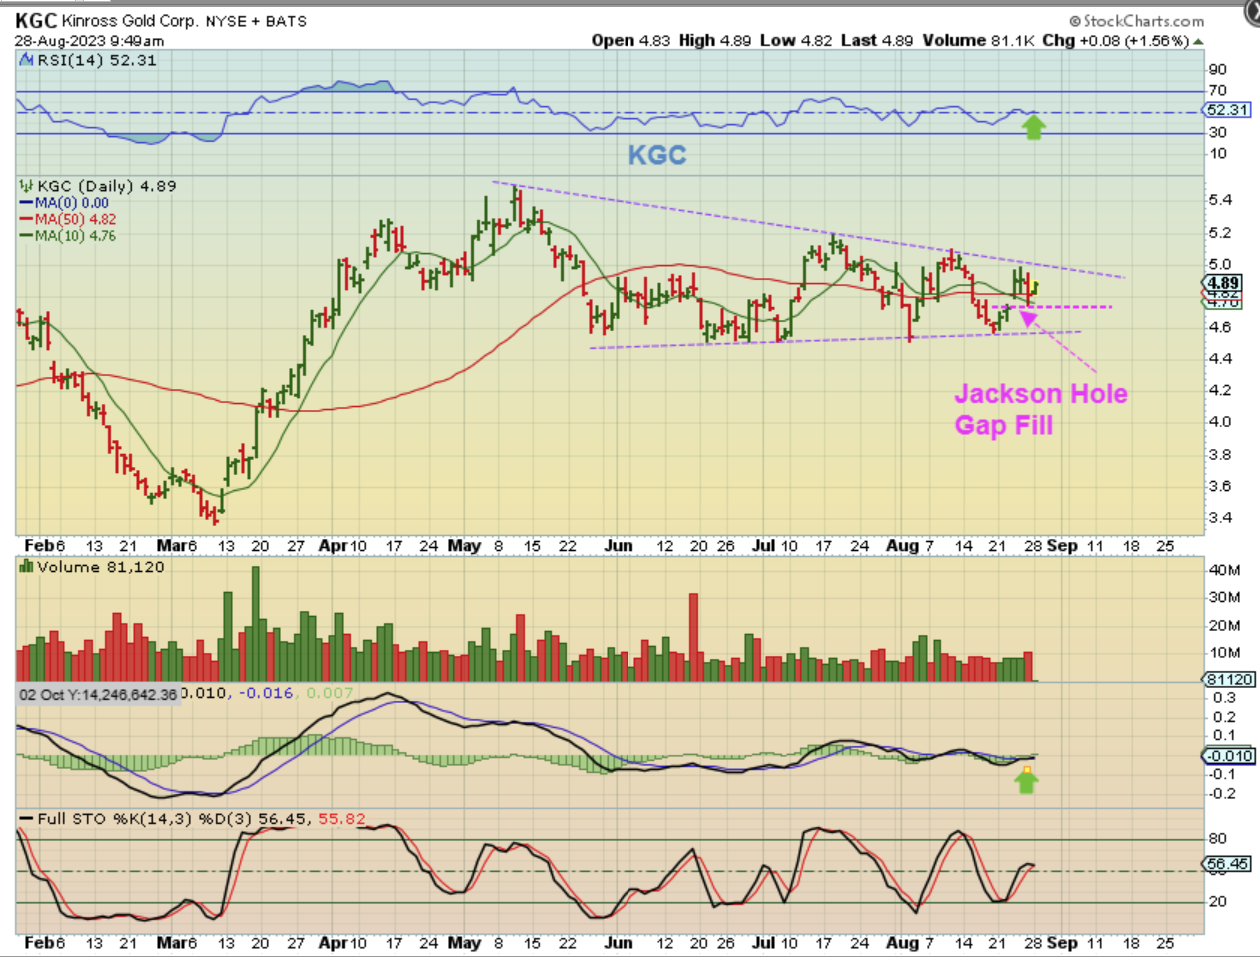
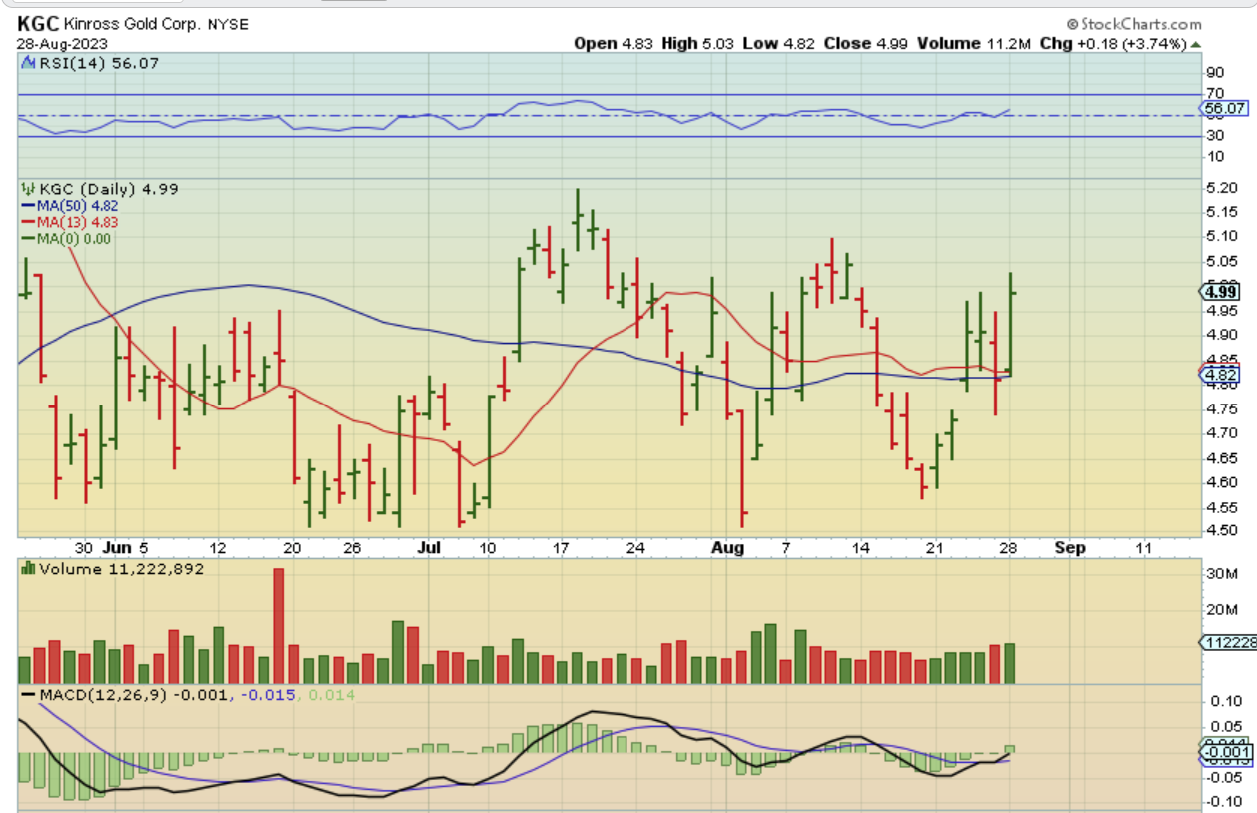
KGC has been pointed out as a bullish set up too, and it bounced off of that 10sma Friday, and regained the 50sma. I grabbed this chart 20 minutes into Mondays trading…
.
KGC moved higher to ‘a new day 6 high’ out of the recent lows on Monday too, so that ‘buy and hold’ a basket of Miners method is working despite the small dip on Friday.
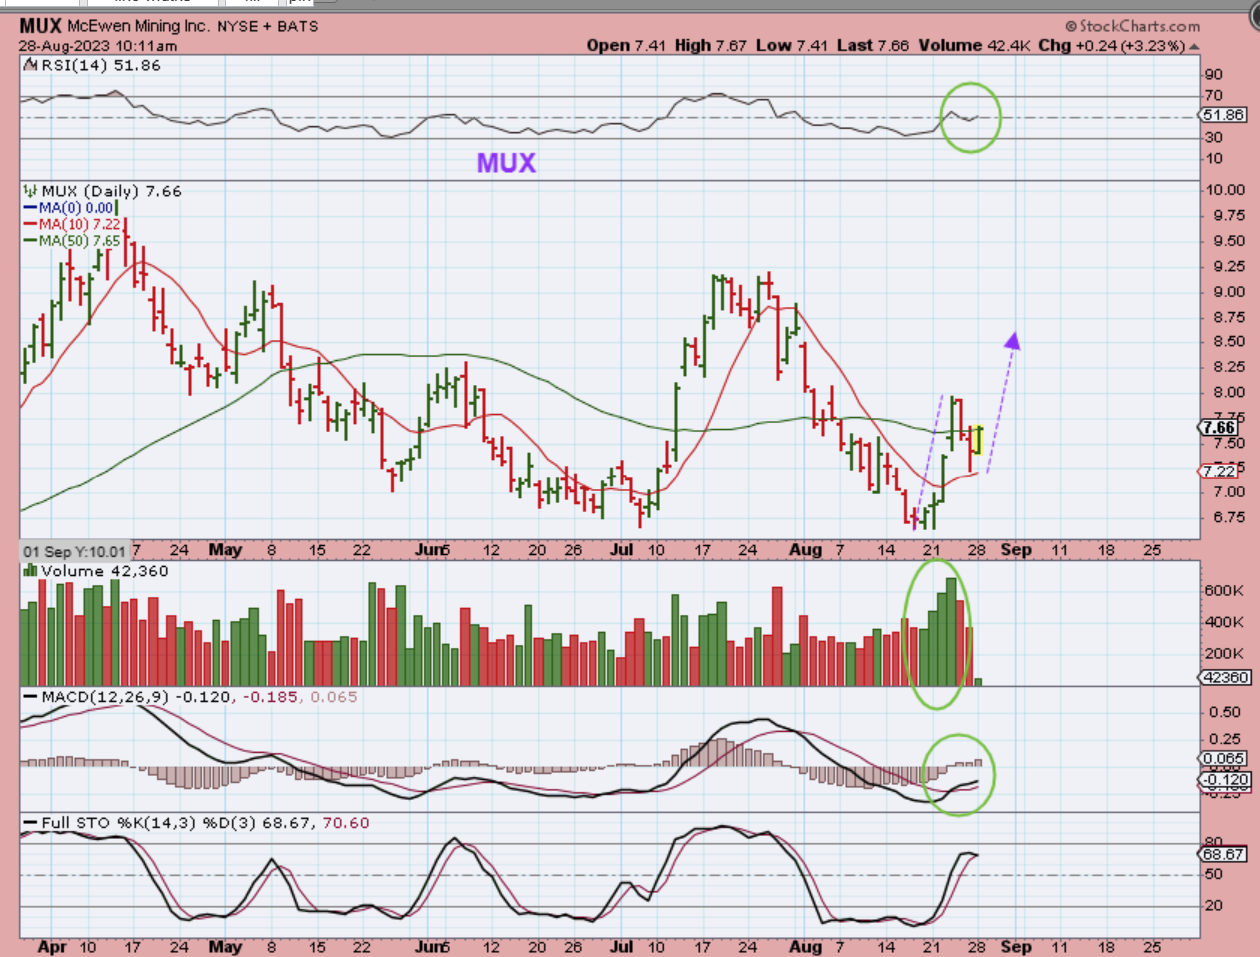
MUX started to move against the 50sma, so I posted this in the live commenting area 1/2 hr into trading. MUX closed up over 7% and well above the 50sma.
.
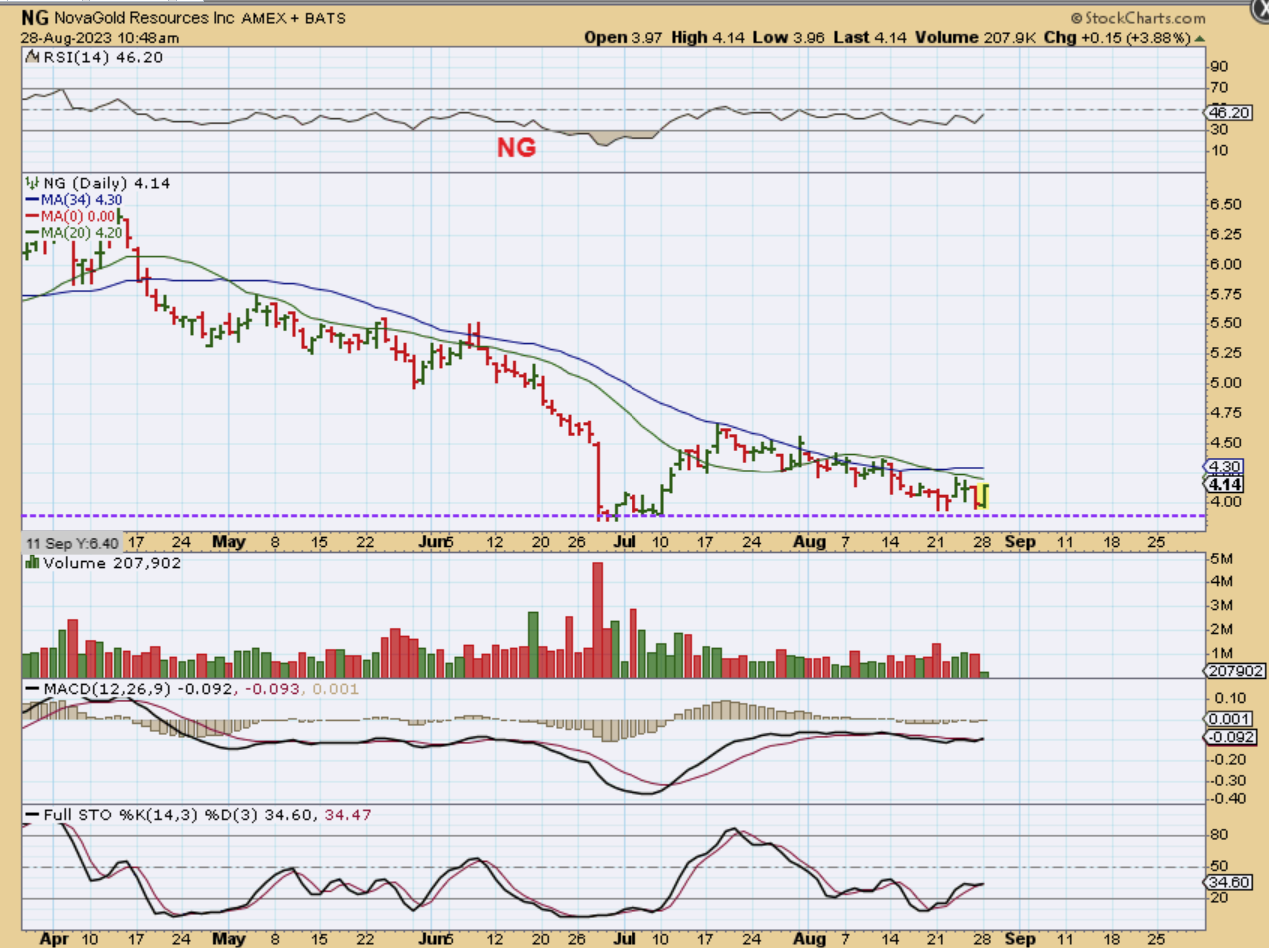
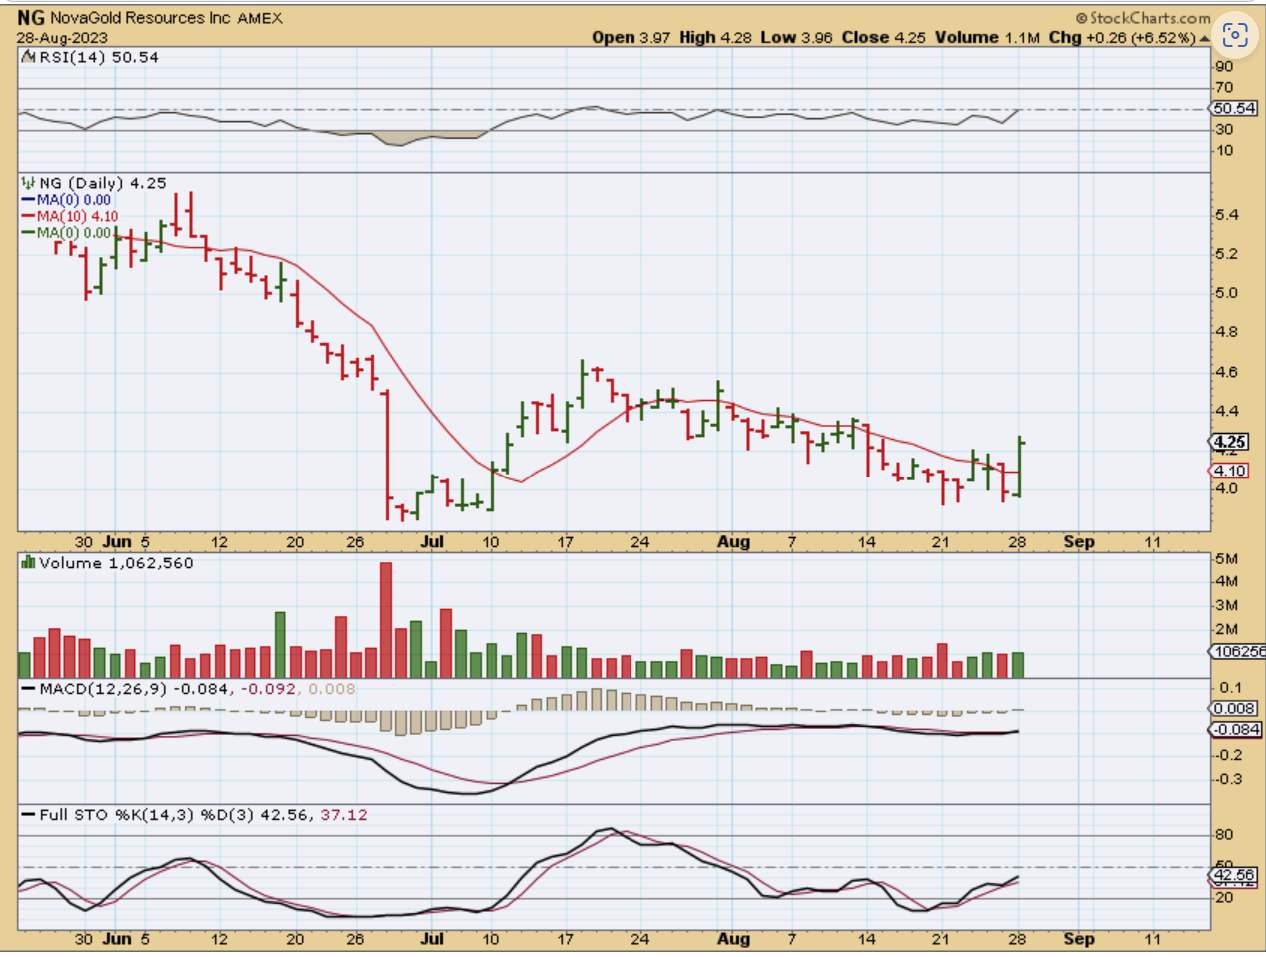
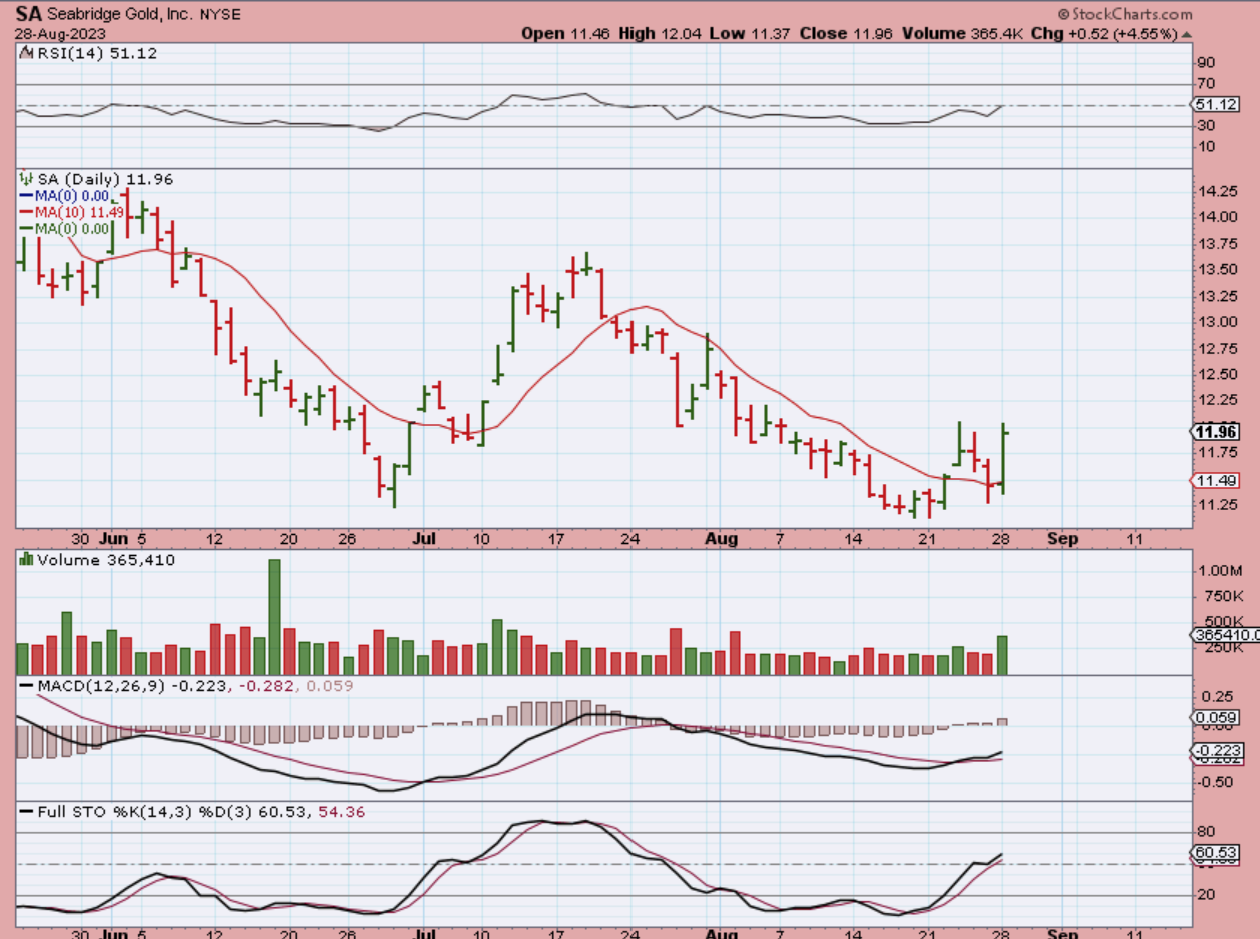
NG, SA, NGD, GORO, and a few others are still at the lows, but they could have plenty of upside if this is the time period when Gold runs to all time highs and breaks out, so I grabbed this chart 1 hr into trading.
.
NG closed up 6.52% and looks like a bargain near the lows. Also…
Also SA, GORO, NGD, SAND, etc are still near the lows and could be viewed as a bargain with Gold preparing to run to all-time highs. one warning note is MAKE SURE THEY HAVE RELEASED EARNINGS to avoid a surprise drop. most miners did already release earnings.
.
SA could easily run from $11 to $15 rather swiftly if Gold starts to ‘ramp up’ and then rise even more over time.
.
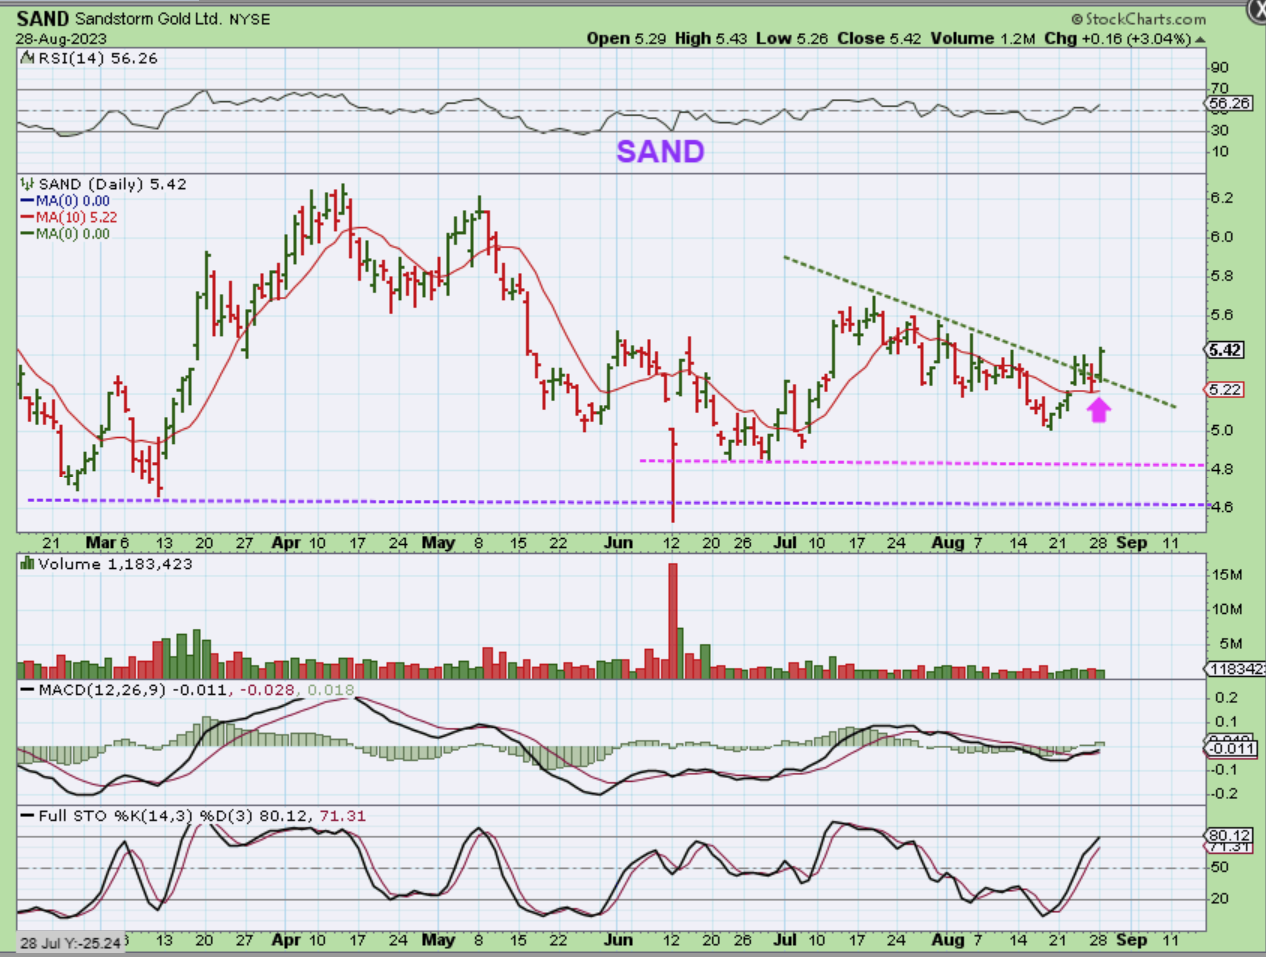
I do not own SAND, but there are bullish signs on this chart that I like. For example…
1. It bounced off of the 10sma on Fridays Jackson Hole dip & filled a gap.
2. It broke a downtrend yesterday
3. It did NOT break below the recent lows of March or June
4. The RSI is bullish
.
So I like what I see so far with the Precious Metals sector, and this is acting the way I would expect it to. I’d rather a straight up moon shot, but this is not bearish price action. We are likely seeing nervous sellers at these lows and eager buyers buying the dip too. That can cause choppiness, along with the USD gyrations, but I like the set up. So far I think that the Precious Metals Sector has bottomed and we will need to wait for that eventual ramp up that I spoke of.
.
Take a look at the opening picture of this report again. It’s not always easy to ride a bull, right? So Hang on and Enjoy your Tuesday trading! 🙂
.
~ALEX

