August 6th Weekend Report
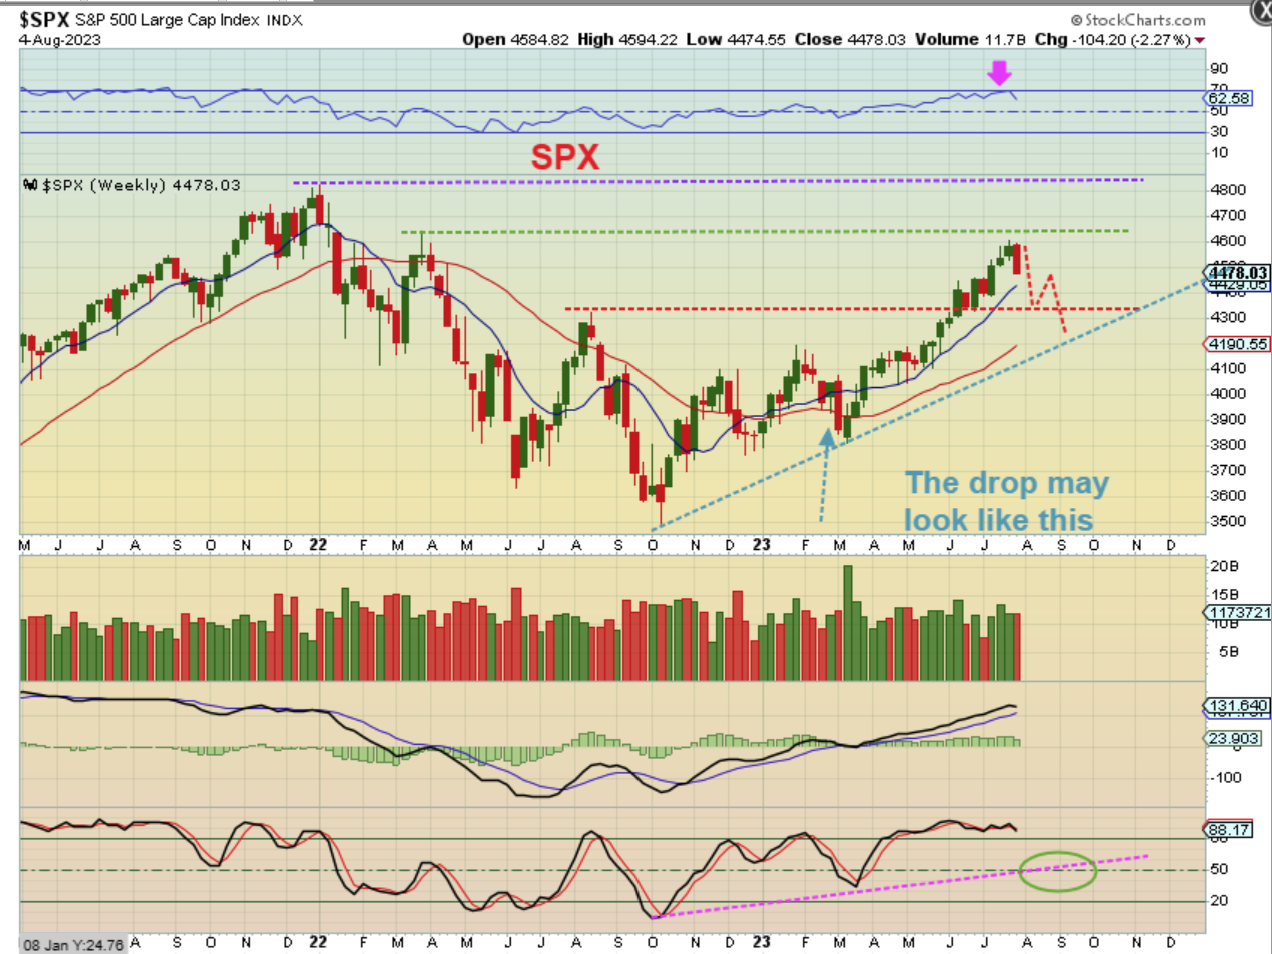
SPX WEEKLY – The General Markets were down this week, and I have been expecting a drop into a dcl and possibly even an ICL due to Overly bullish sentiment, Cycle timing, and a few other factors. What I have drawn here is the idea of a drop into a dcl, a new daily cycle (bounce) that rolls over as left translated into a new low ( ICL September?) at that trendline. Similar to the drop Jan to March.
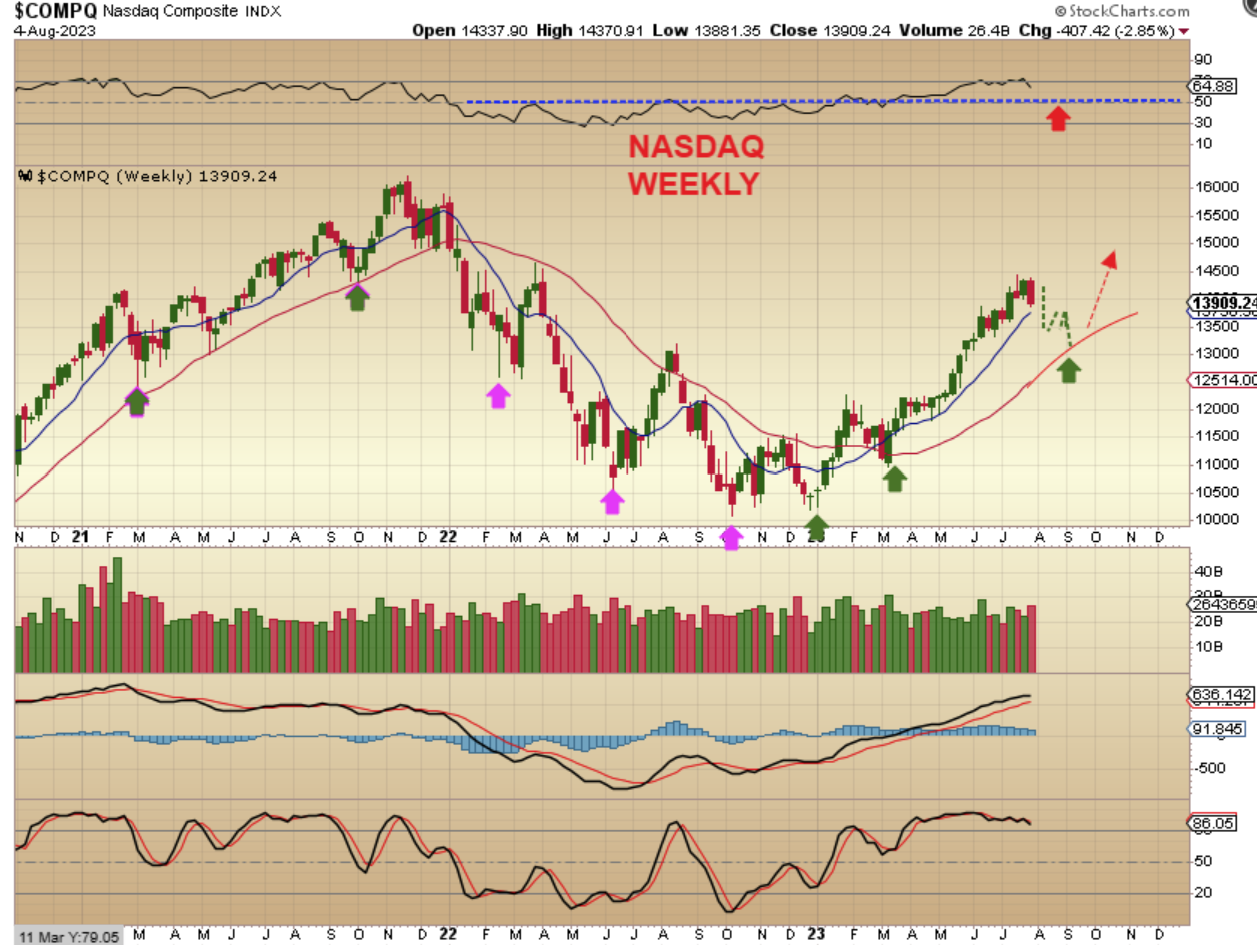
NASDAQ WEEKLY – Using a 30 week ma, the Nasdaq used to dip down an tag that, so I drew that here as an example of what we should expect, however…
.
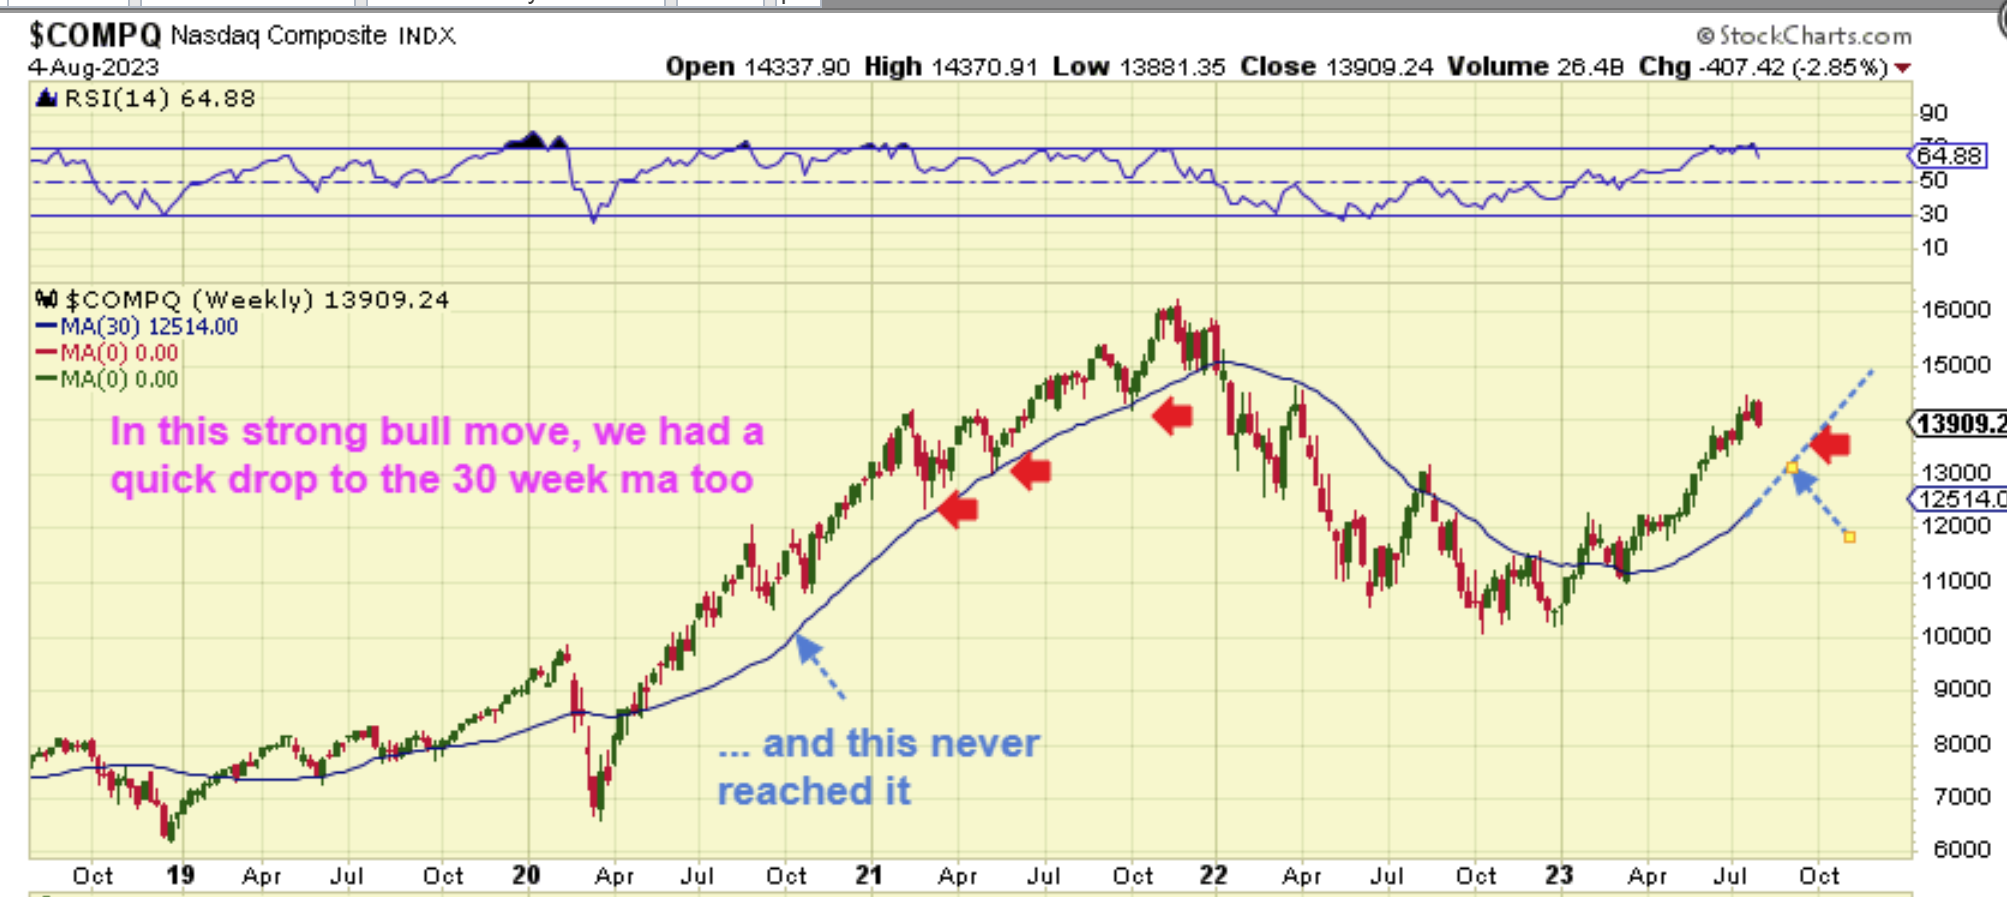
NASDAQ WEEKLY – There were occasions when the markets dipped down and never touched that 30 week ma. It happened as the markets first came out of the sell off lows in 2020 too, so it is possible that Bulls can flood in on the dip and cut it short.
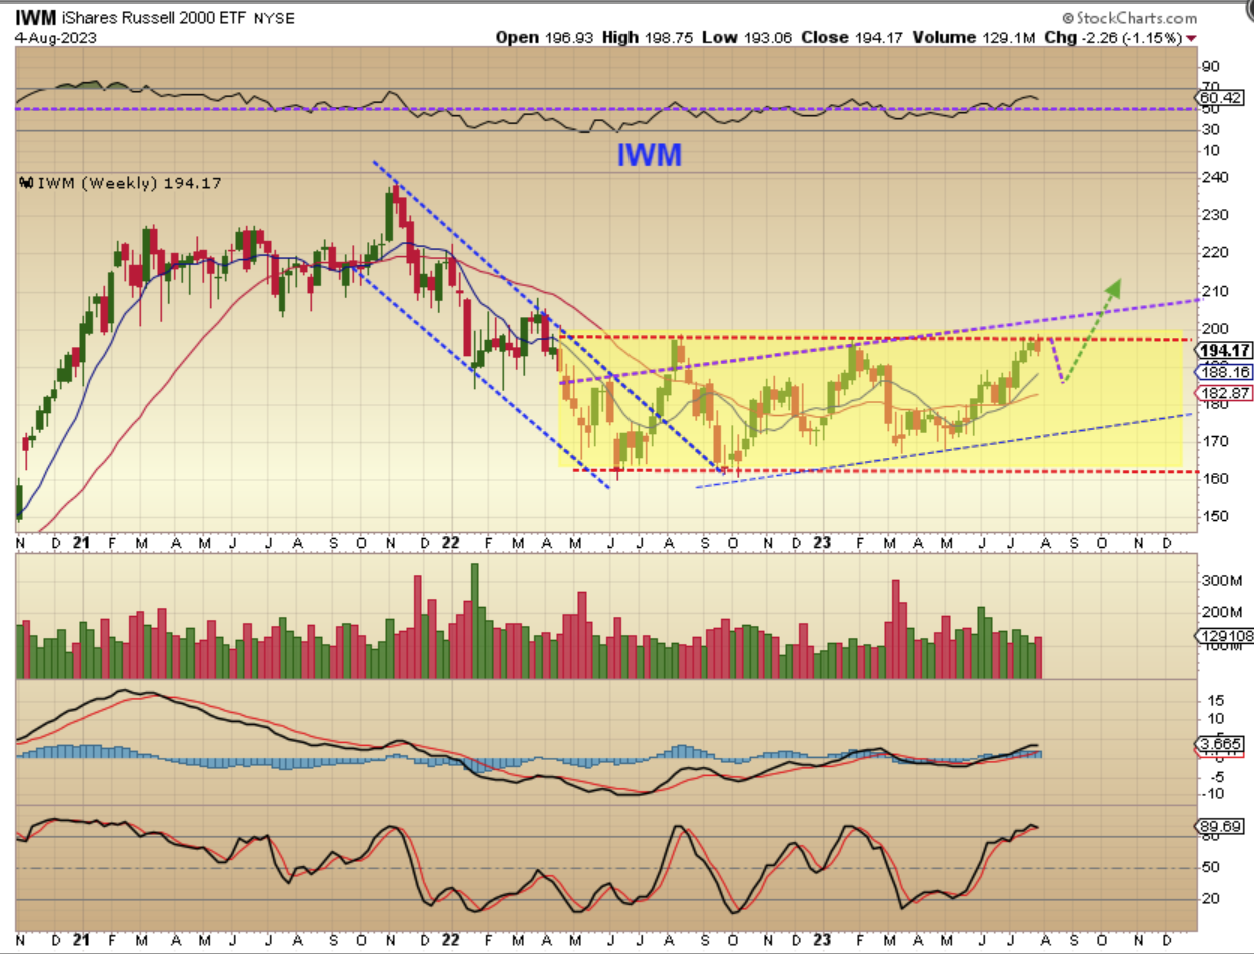
IWM WEEKLY – The IWM reached the top of a base pattern and stalled at resistance. This also could pull back, but we really have seen some nice moves by EV Companies out of their bases lately, so I am only drawing a dip to the 10 & 30 weekly ma. I’ll be watching things closely in this sector if price drops to that area.
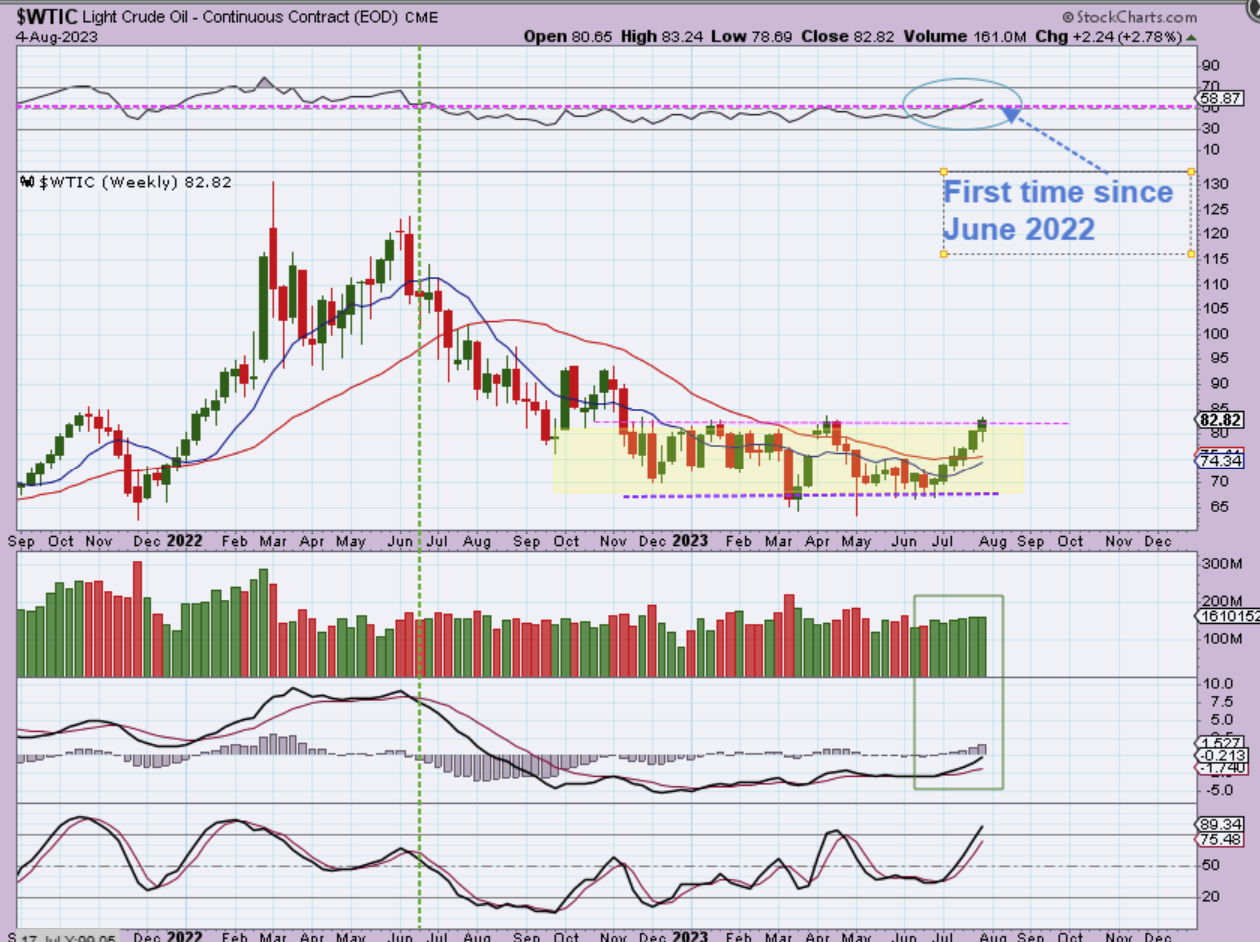
WTIC WEEKLY – Oil has been running higher for 6 straight weeks and is up at resistance, but that may not hold it back. The weekly RSI is now above the 50% area for the first time in over a year. After a very long basing pattern, Oil has been bullish for weeks.
.
XOP WEEKLY – Oil stocks have been pointed out as bullish too, and when you step back you can see that the XOP has formed a massive sideways consolidation in the form of a triangle. It has broken out too, and regained the blue support line (50 week ma).
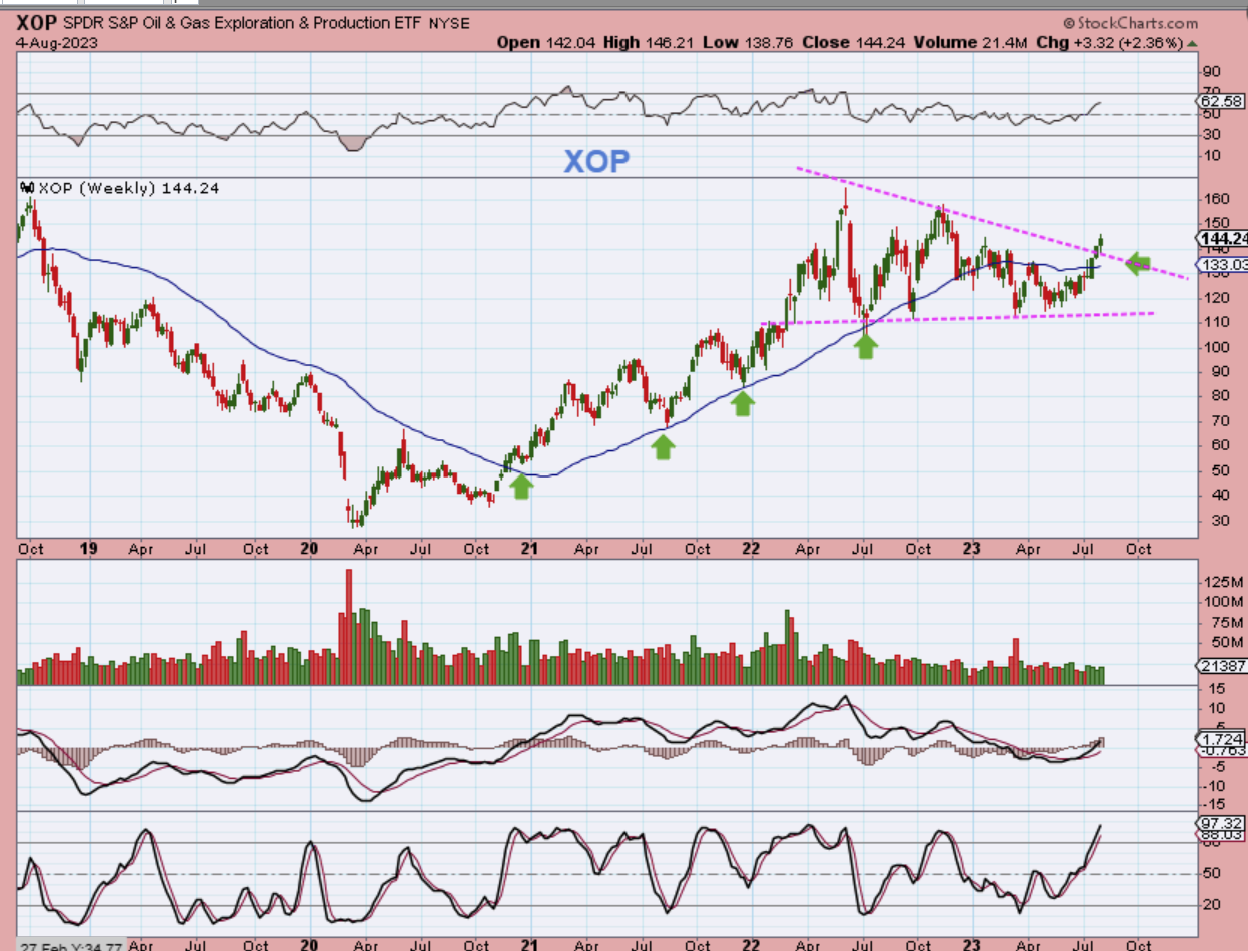
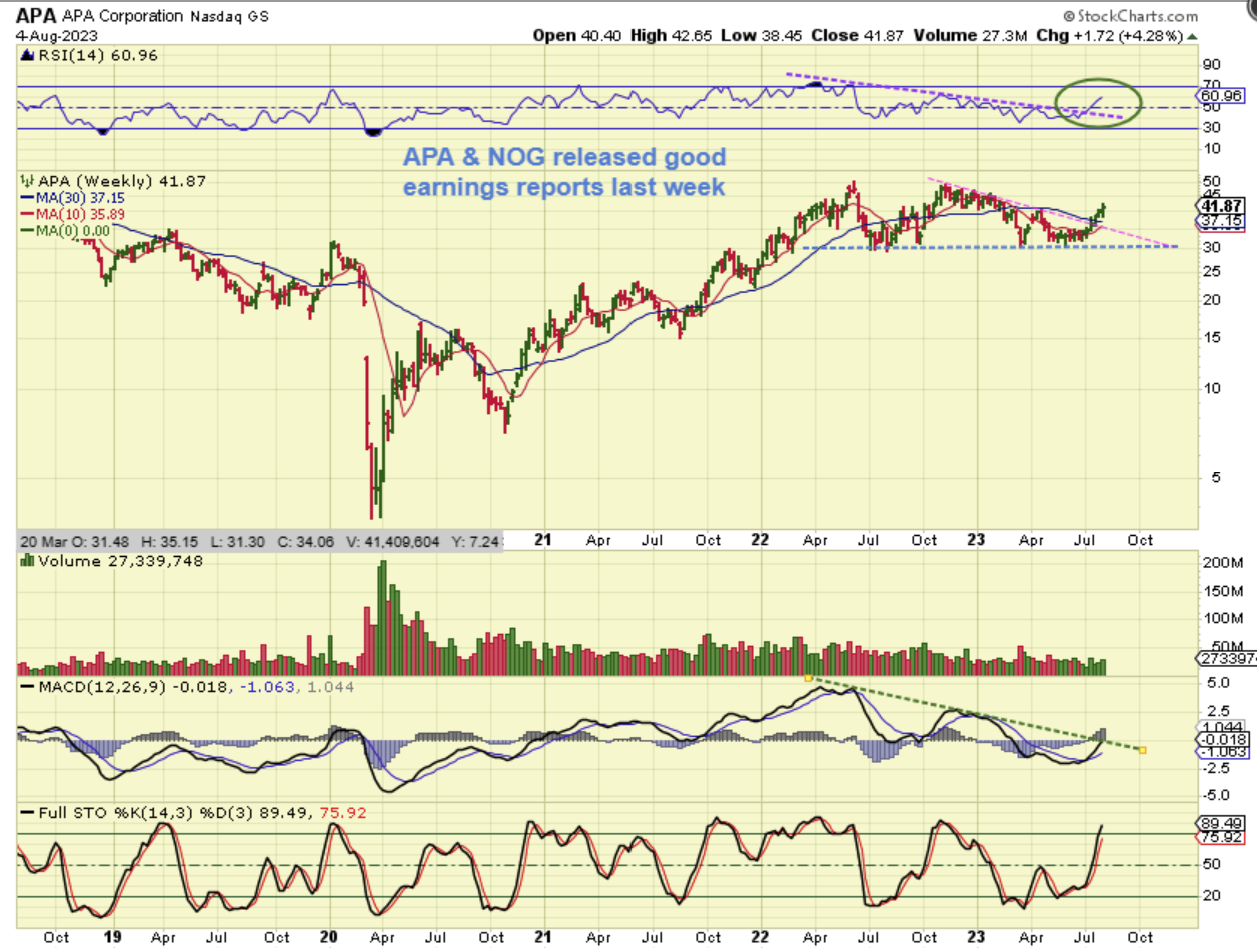
APA, NOG, CPE, MRO, VLO and a few others have been noted as buying opportunities in the reports over the past few weeks. Several also released earnings last week and then price moved even higher, so they are ‘buy & hold’ candidates. With Oil continuing higher, these should continue to run too.
.
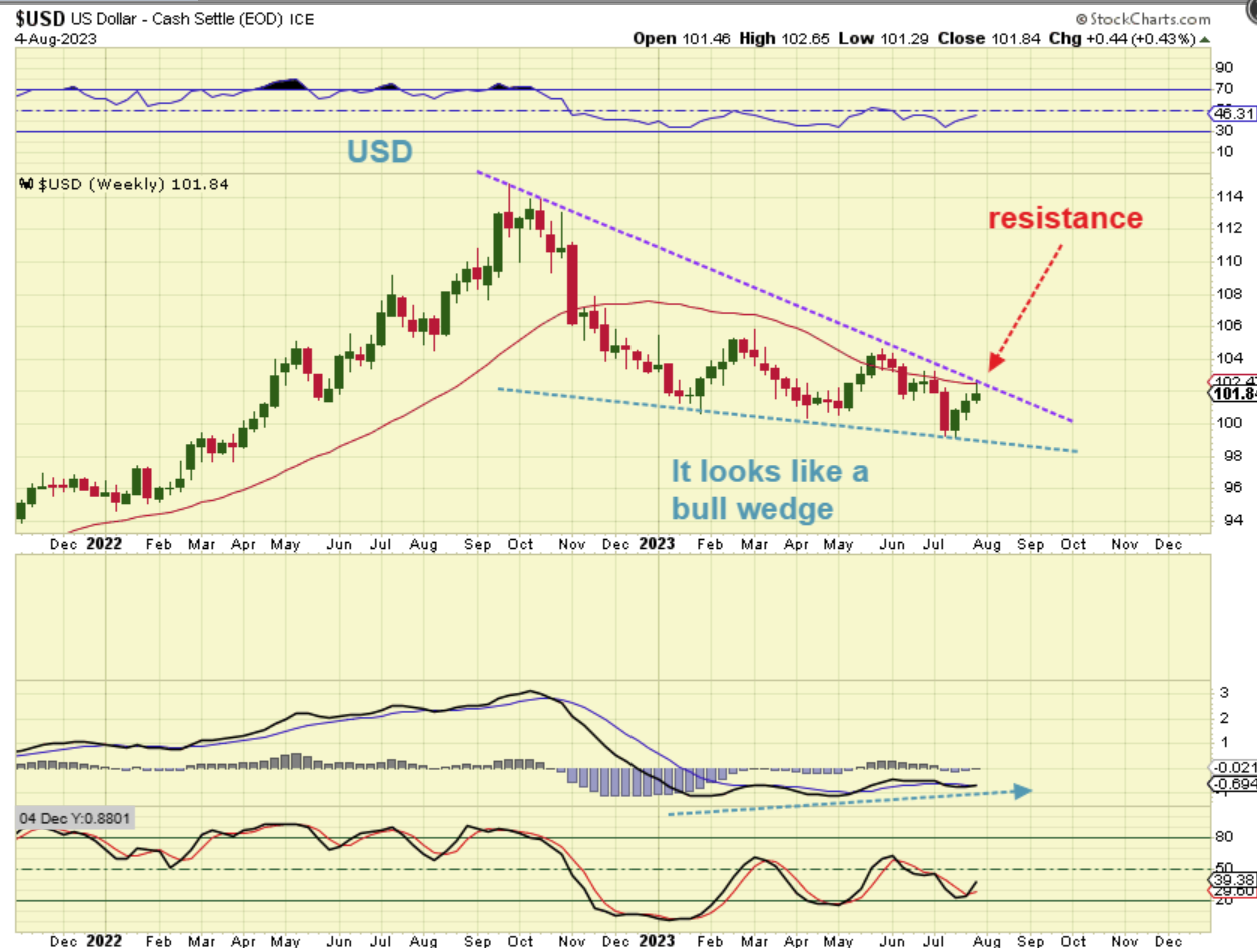
USD WEEKLY –
The USD was held back right at the resistance area that I have been pointing out this week. Now we can hope that this continues to top out in this area and Gold continues to bottom right where it is now. I do have to admit that this does look like a descending bull wedge, right?…
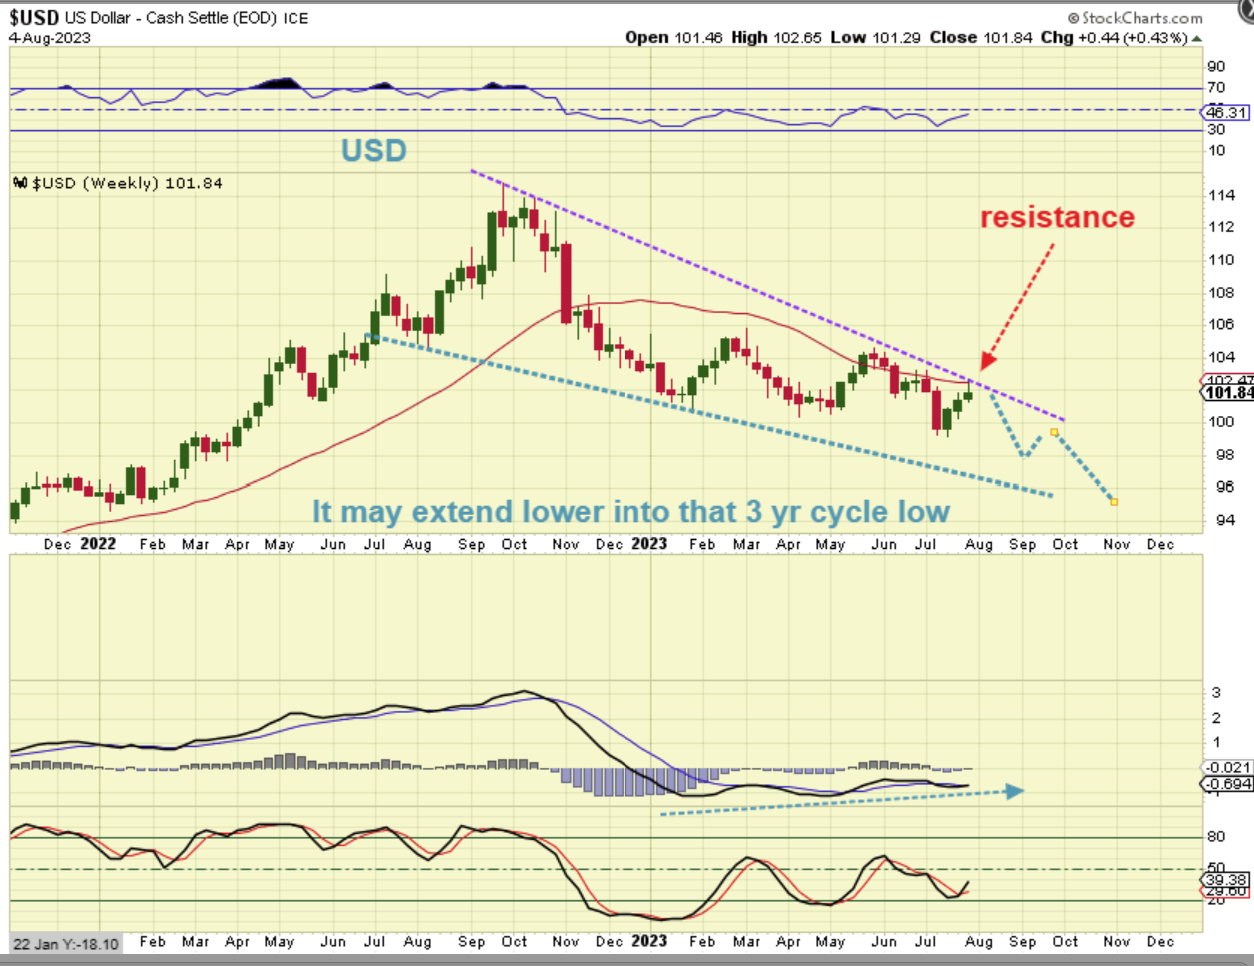
…but a continuation of the drop can just extend that wedge like this, and allow for the 3 yr cycle low to still come in at the beginning of 2024 and allow Gold to break out to new all-time highs. This chart would have the USD at the next resistance area and peak.
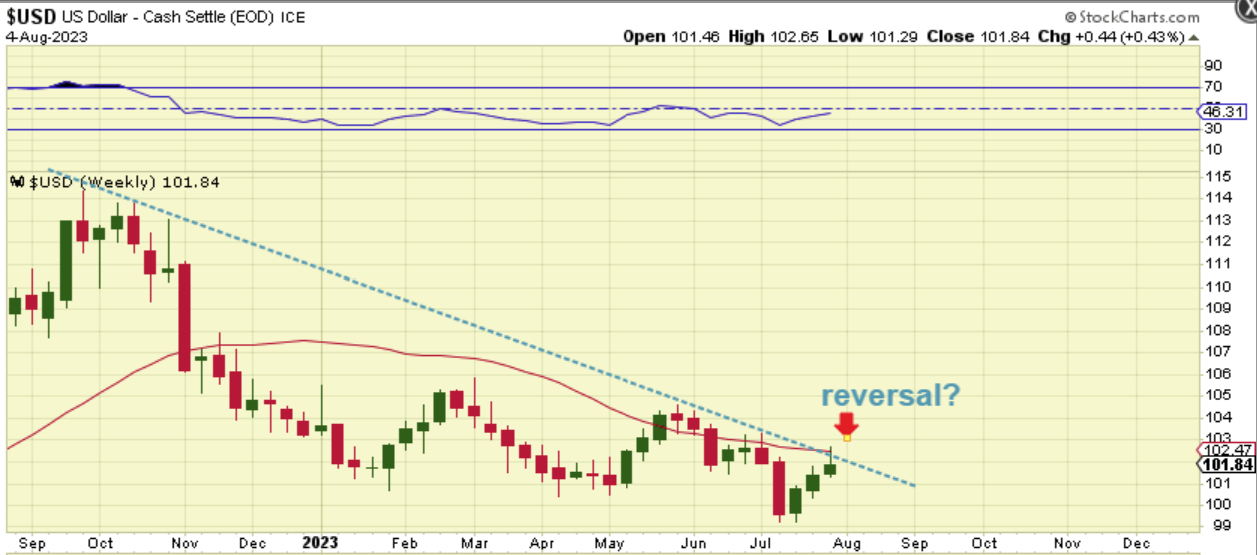
So by zooming in on the USD WEEKLY we get a nice close up of the possible peak for the USD. Even if it pops up 1 more time (next week) and is rejected again at the red line, that allows another couple of days for Golds daily cycle to reach the 30+ day mark. Can you picture that? Let me help you…
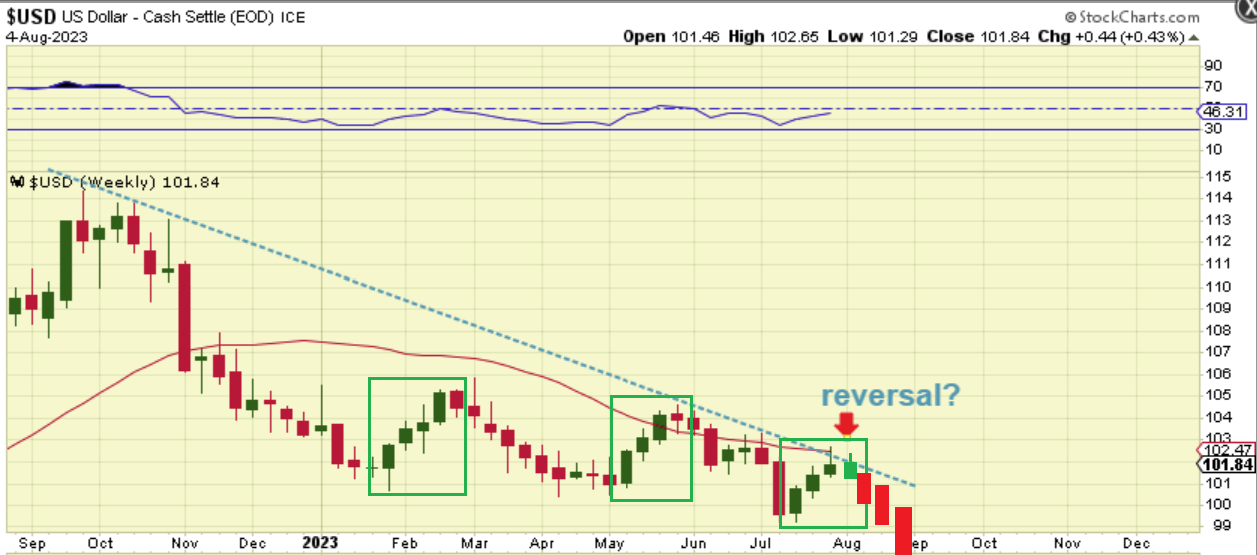
1 more week up here would give Gold time to reach the 30+ day dcl time period. Similar to past multi-week USD rallies, we could see something like this starting us lower following next week. Let’s hope so! 🙂
.
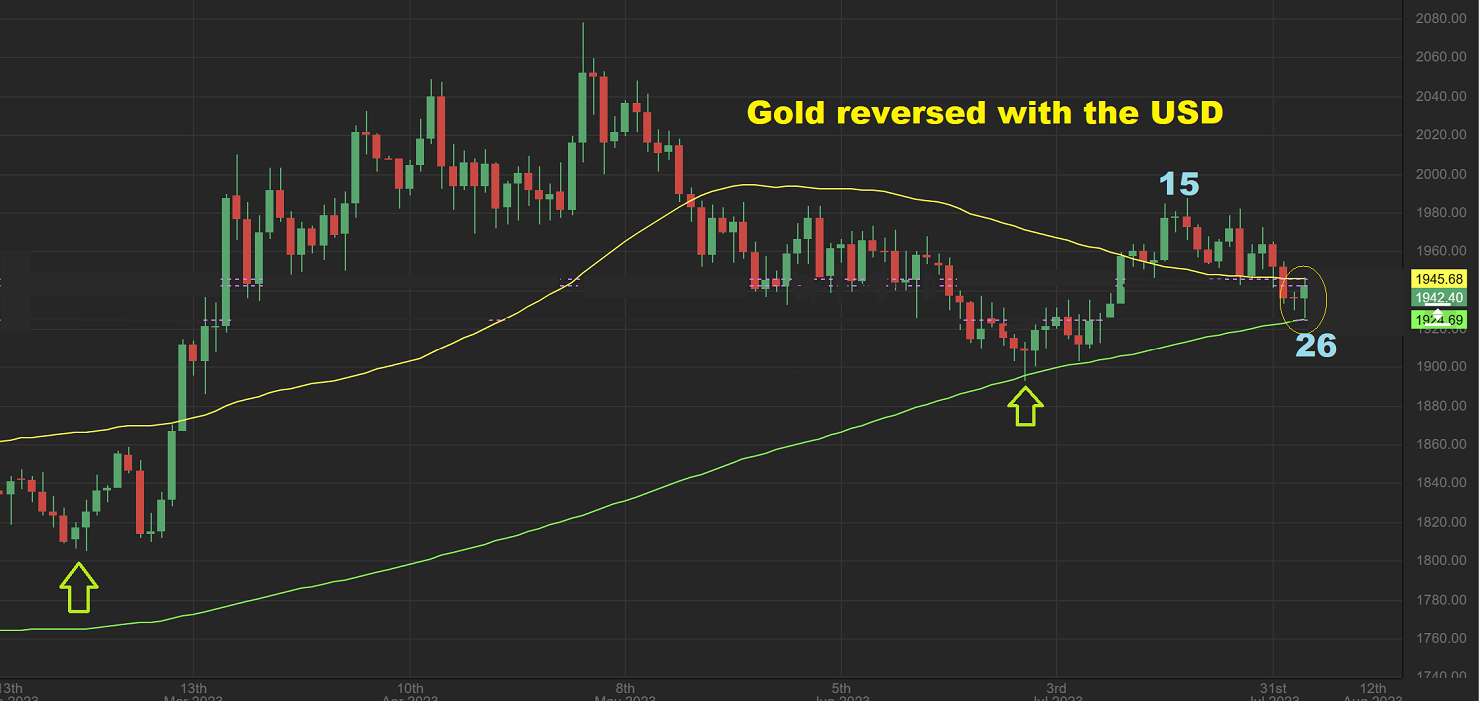
GOLD DAILY– Gold reversed on Friday as the USD reversed at the overhead resistance area. It was day 26 and that is not too early for a dcl, but lately they do come about a week later near day 32. Could this possibly be the dcl? Yes, it could be, especially if the USD continues lower. It also keeps this L.T.
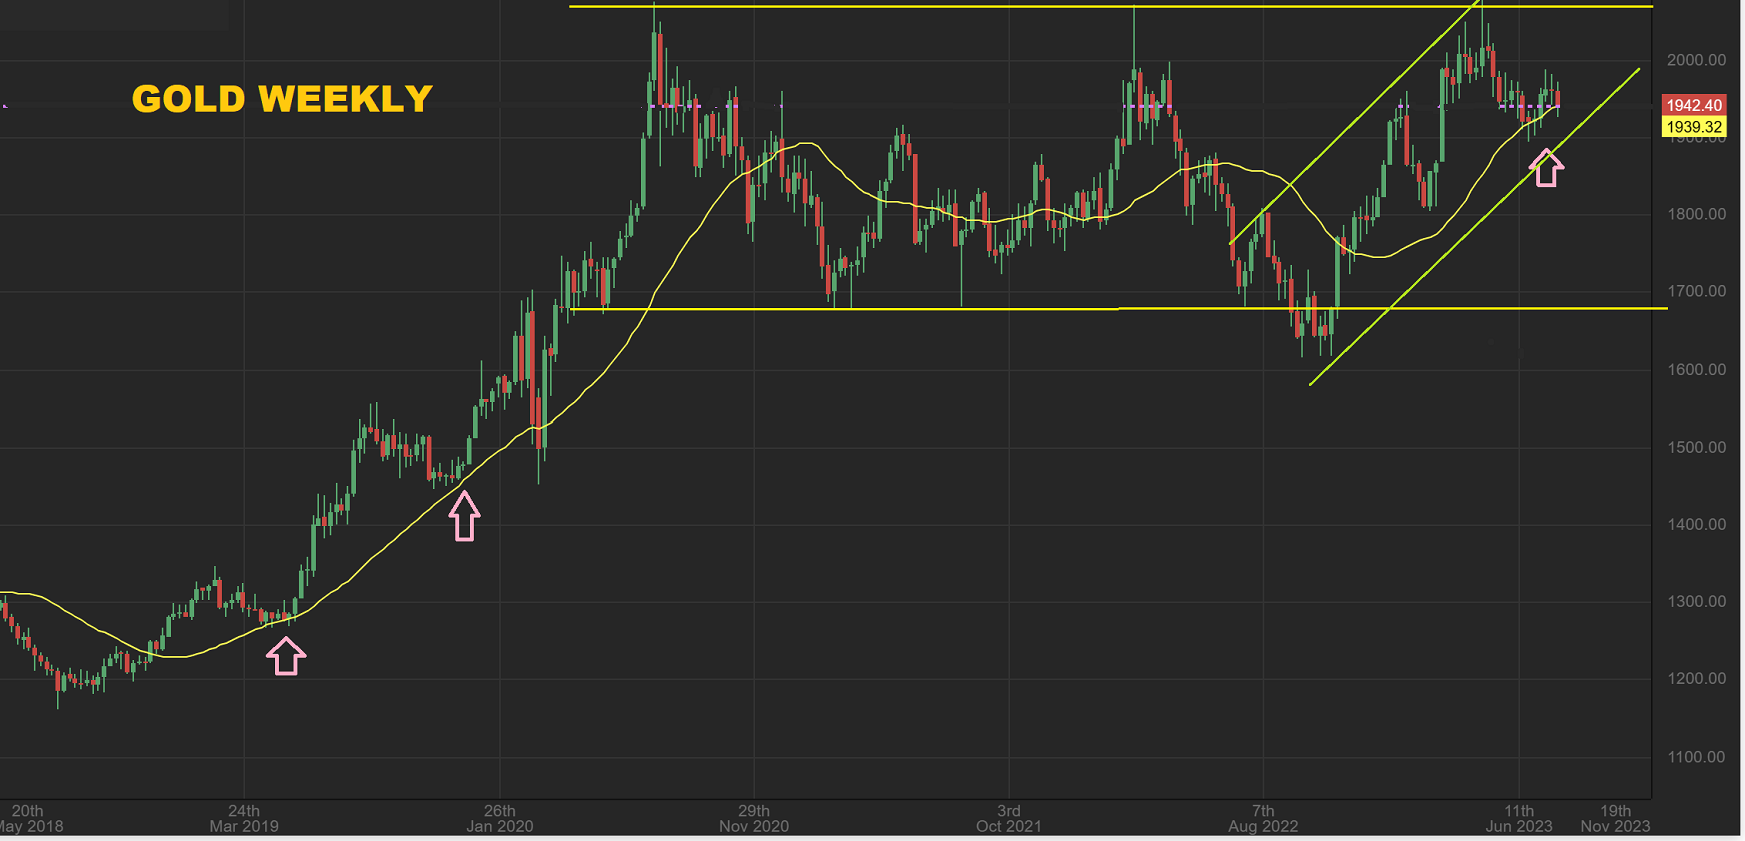
GOLD WEEKLY – The Big Picture is bullish as Gold pulls back and away from the all time highs. Price often does this to build energy for a break out.
.
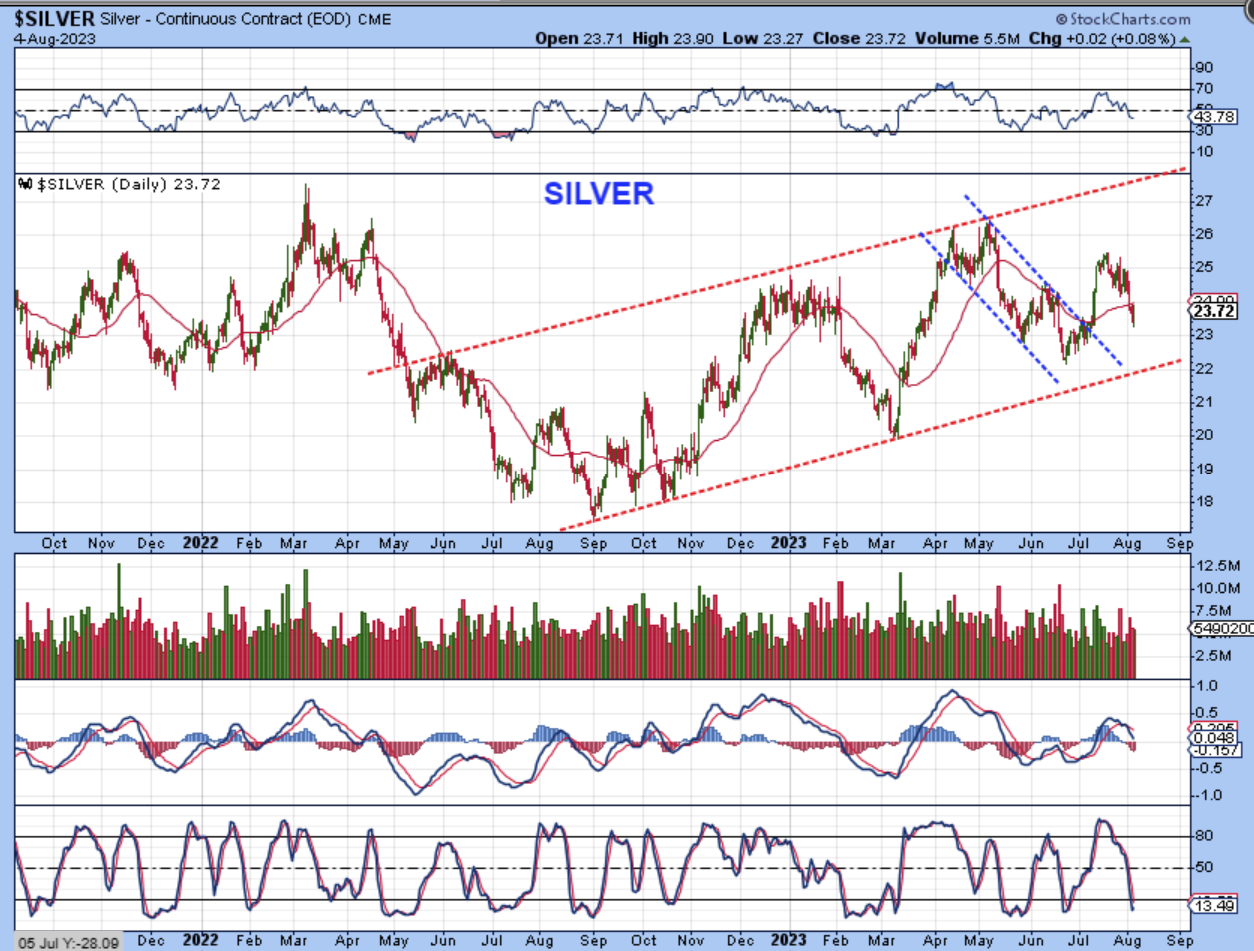
The SILVER Daily chart shows that Silver has finally reached oversold again on the stochastics. Price is in the middle to lower portion of the wide upward sloping channel. Let’s zoom in for a better look…
.
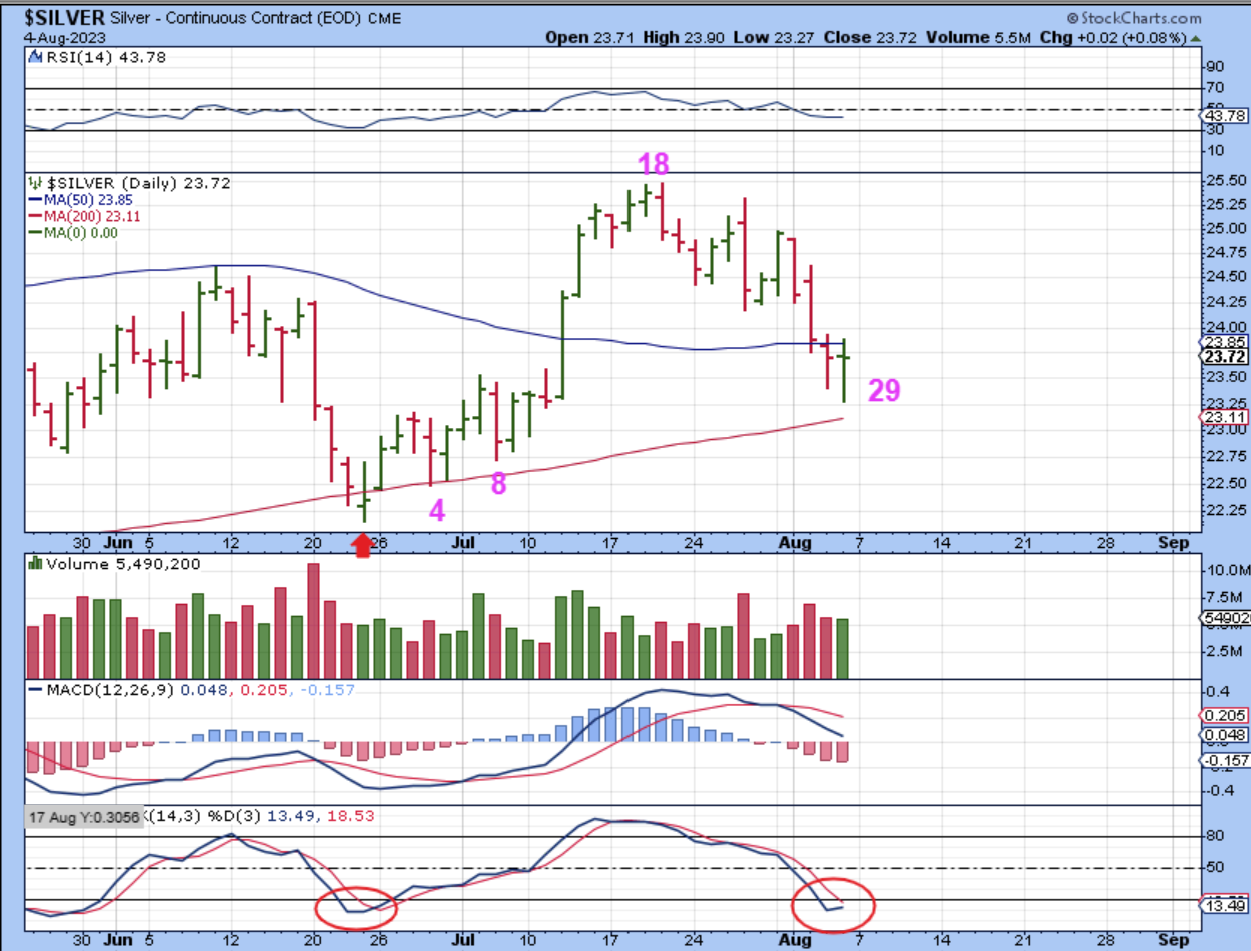
The SILVER Daily chart shows us that Silver also reversed when the USD was rejected on Friday. So at day 29 Silver reversed just above the 200sma. Silvers next move may depend on what the USD does next week. This could just bounce around here between the 50 & 200sma as it forms a dcl next week.
.
SILVER WEEKLY – Silver is still well above the ICL and a dcl could form at any time.
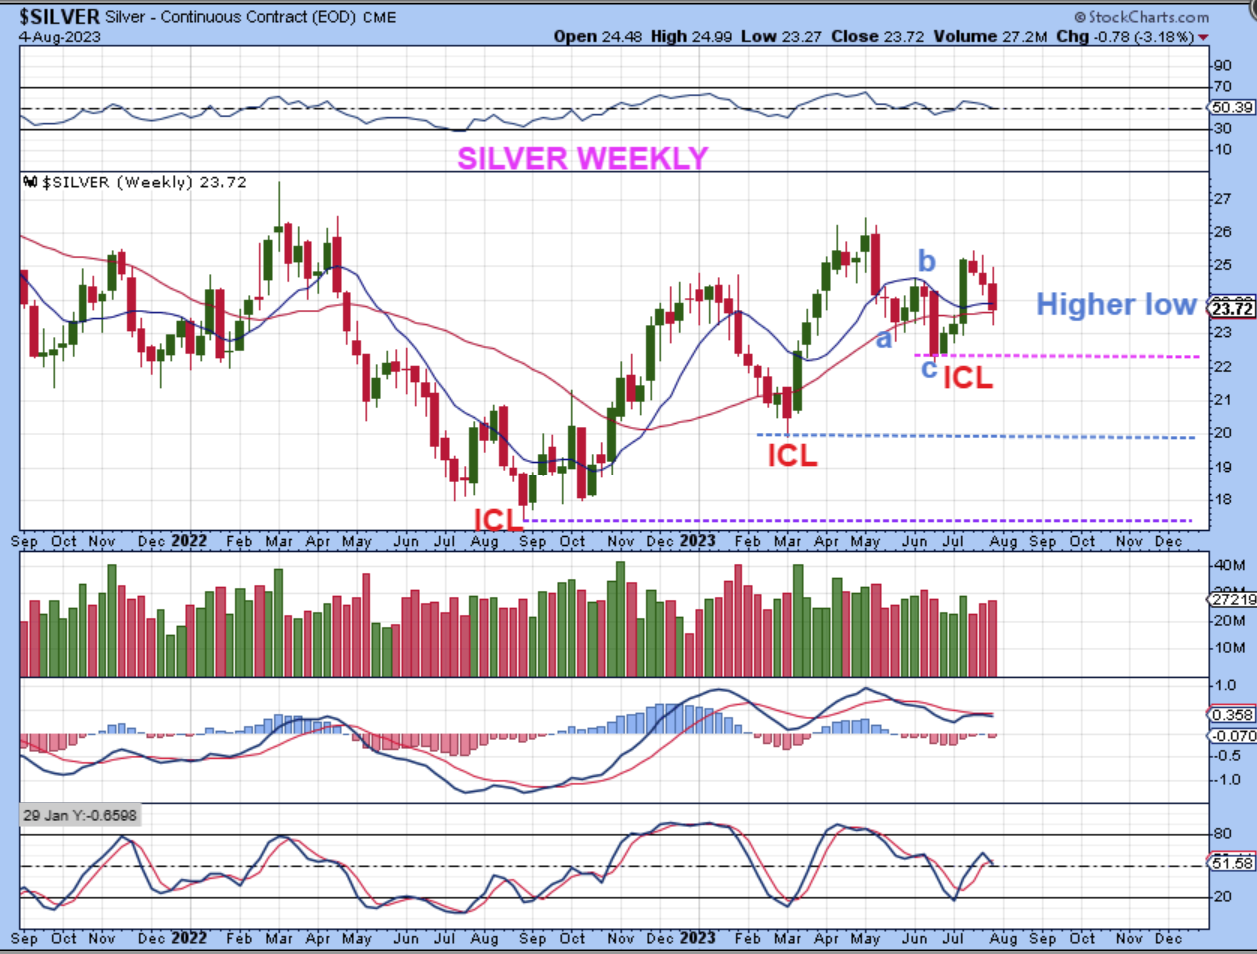
All I want to point out with this chart is a reminder:
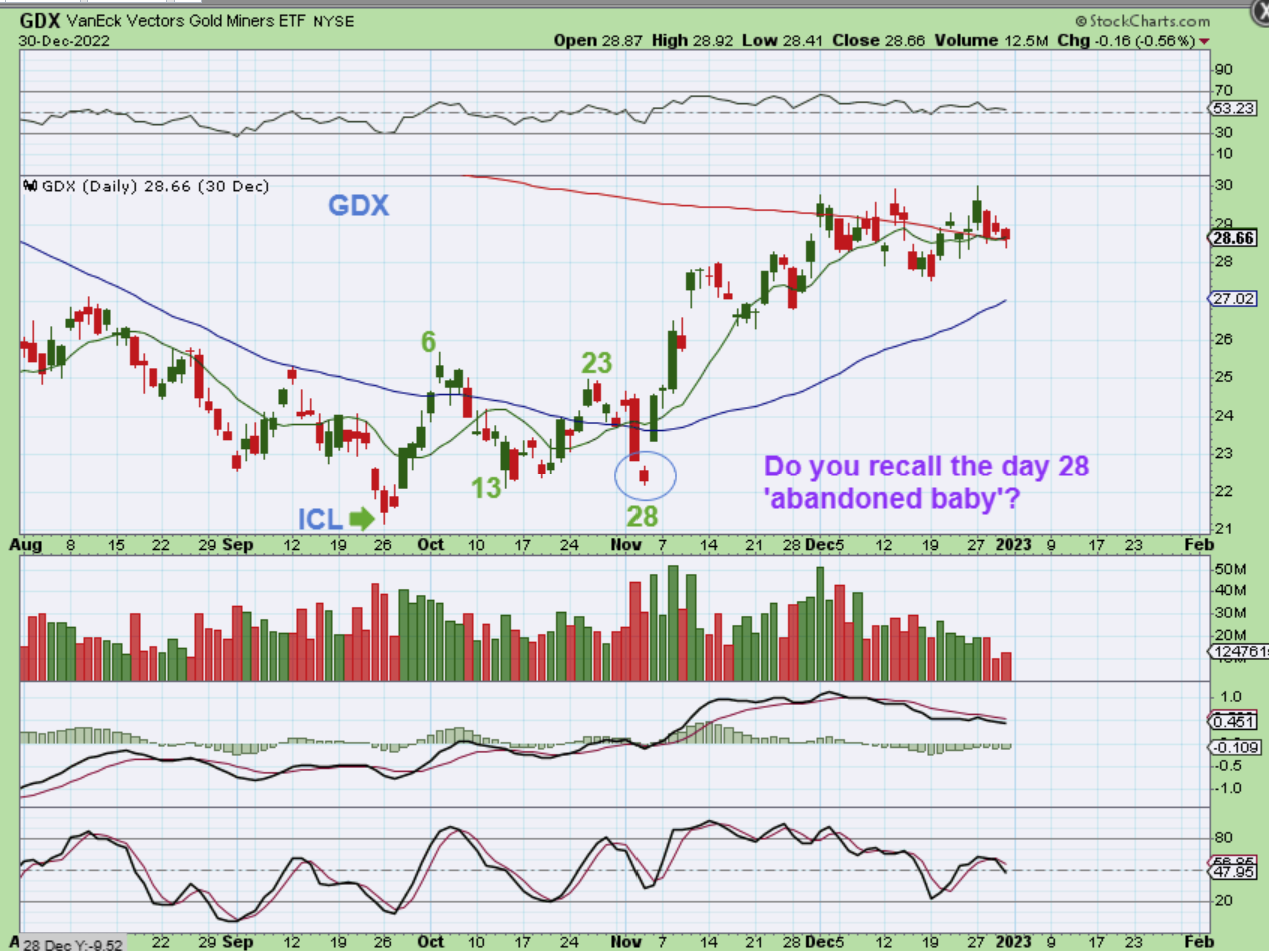
Do you remember when this was the September 2022 ICL and after that low was in place, The GDX chopped higher and lower and frustrated everyone, especially when it then gapped down on day 28? Well, if you recall this time period, you also will remember that this was the end of the selling. I kept mentioning the ‘abandoned baby’ day after day, so I feel that you likely remember that now. Well, my point here & now is simply that we had a day 28 dcl. It CAN happen in Bull Markets.
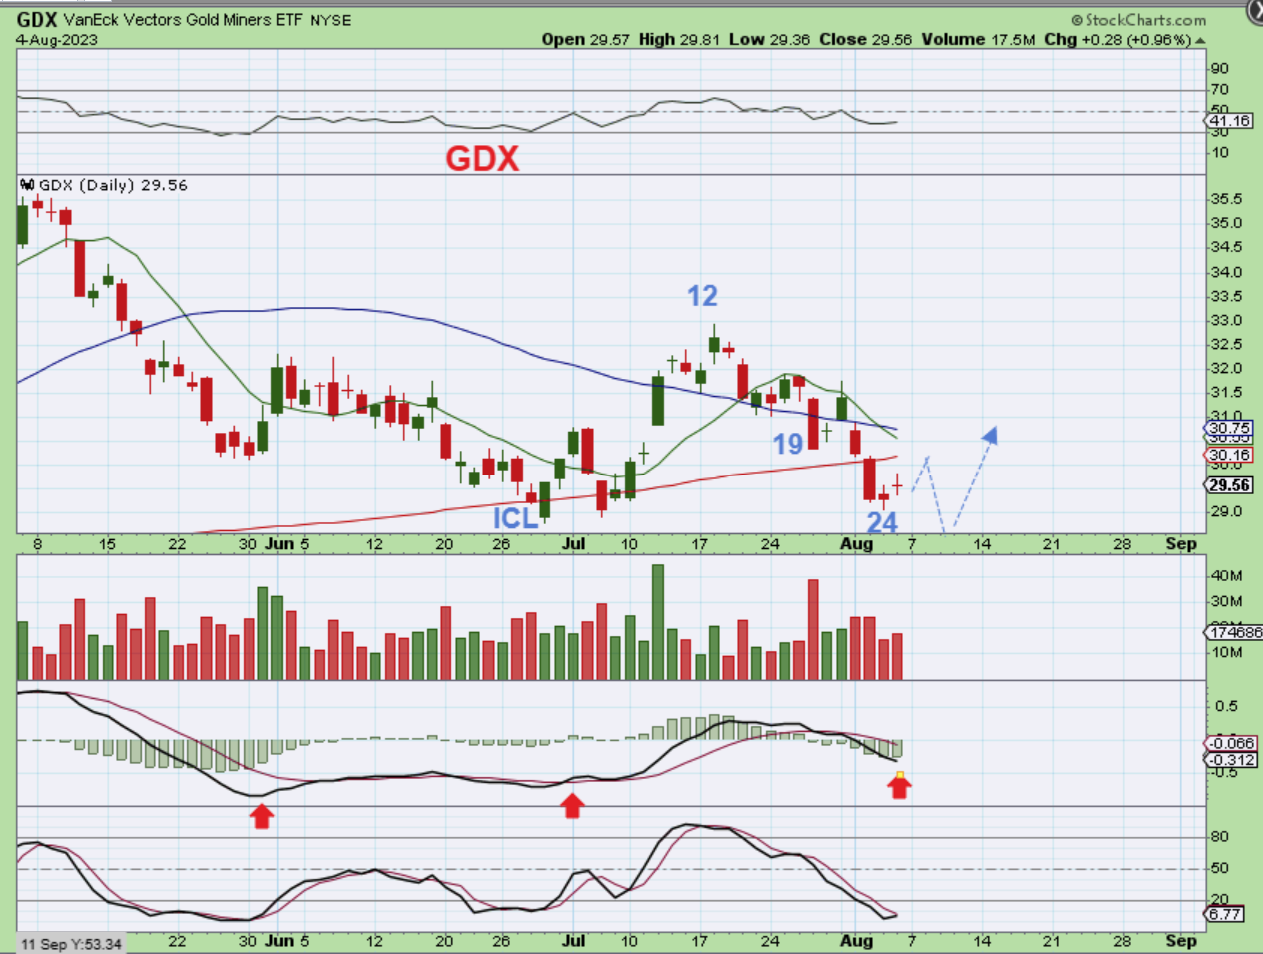
GDX is only on day 24, but Gold and Silver are on day 26 (Gold) and day 29 (Silver). I am thinking that we may see the USD bounce next week, back up to resistance and that may give us a new low and a dcl in GDX. Even if it comes in on day 28, we’ll let Gold & Silver dictate the cycle counts.
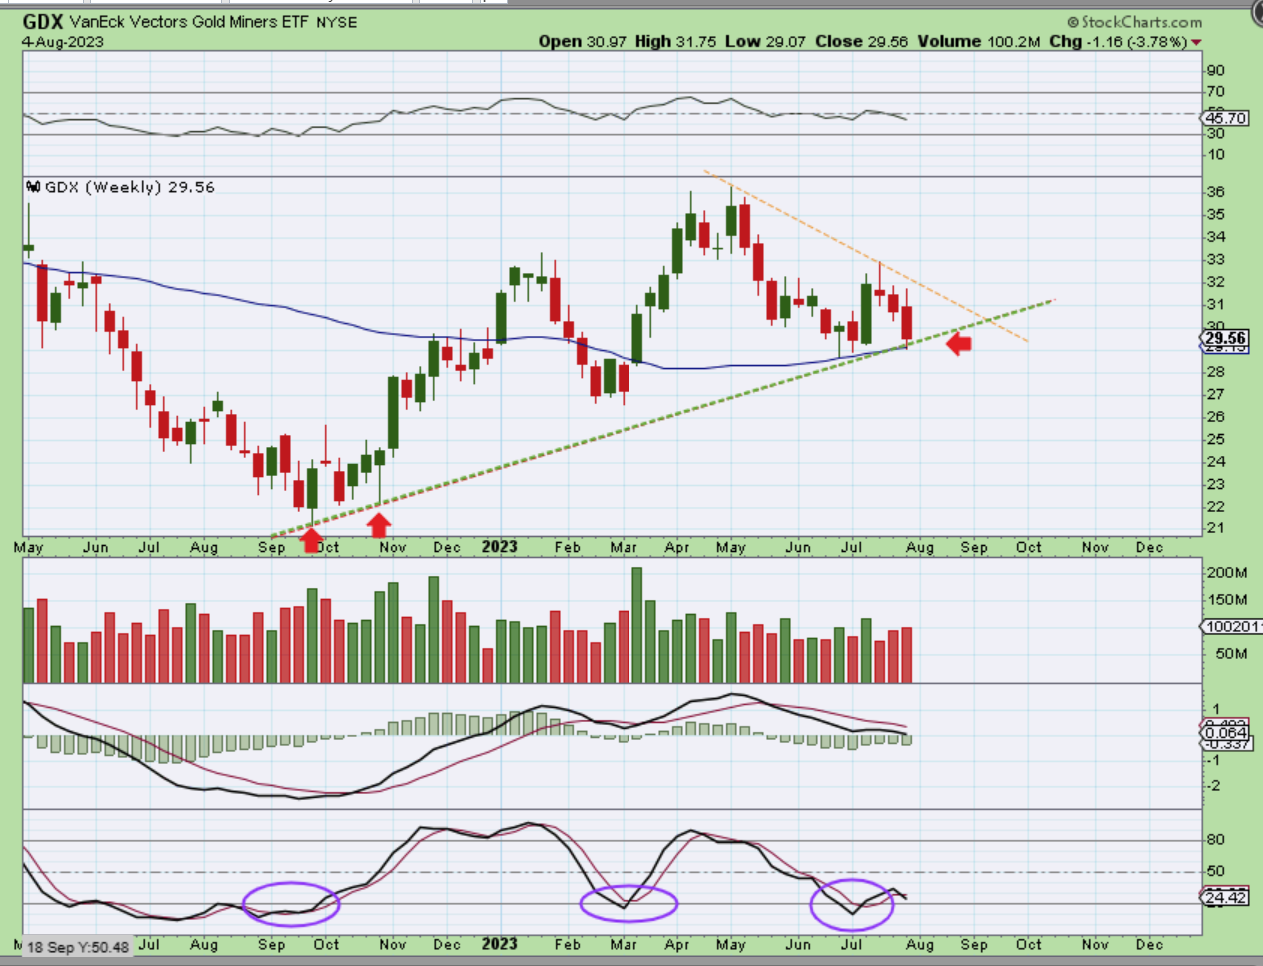
THE GDX WEEKLY CHART shows the Miners actually bounced right off of the Uptrend Line and the 50 week MA. That may be our support going forward, so even if we see a quick shake out, this may end up being a good buy area next week.
.
Lets do a little review.
It does look like we are finally going to get the pull back in the General Markets that I have been mentioning. Selling in a bull market can be tricky, because it often chops on the way down, and that can make riding positions in SQQQ, SOXS, etc difficult. Sometimes the best thing for the average investor to do is to lighten up (or go to cash) and watch the drop until it forms a dcl. You can then buy some ETFs or stocks that you liked on recent moves higher.
.
Oil has become bullish out of the lows and I have mentioned some Oil stocks that were bullishly set up a few weeks ago, along with UCO, USO, XOP, GUSH, etc. Now several Oil Companies have released earnings & remained bullish. Oil Companies like APA, NOG, VLO, MRO, etc. also do offer quarterly dividends, so parking some money there may be a good idea too.
.
The USD rallied for a couple of weeks, but it was rejected at a resistance area. We’d really like to see that area continue to act as resistance, and eventually have the USD continue its drop lower into a 3 yr cycle low.
.
Gold, Silver, and the Miners have been dipping down toward a dcl, and we are in the mid 20’s for daily cycle counts. In a bull market run, you can get shorter daily cycles as the Bulls start jumping in early, so I reminded everyone about our day 28 abandoned baby last year. That became a dcl. We are watching for a swing low to develop to give us a dcl. We expect that dcl to come in around 32 days, but it can form early or a little late too.
.
I hope that everyone is enjoying their weekend! As always, I Thank you for being a Chartfreak with me!
.
~ALEX
.
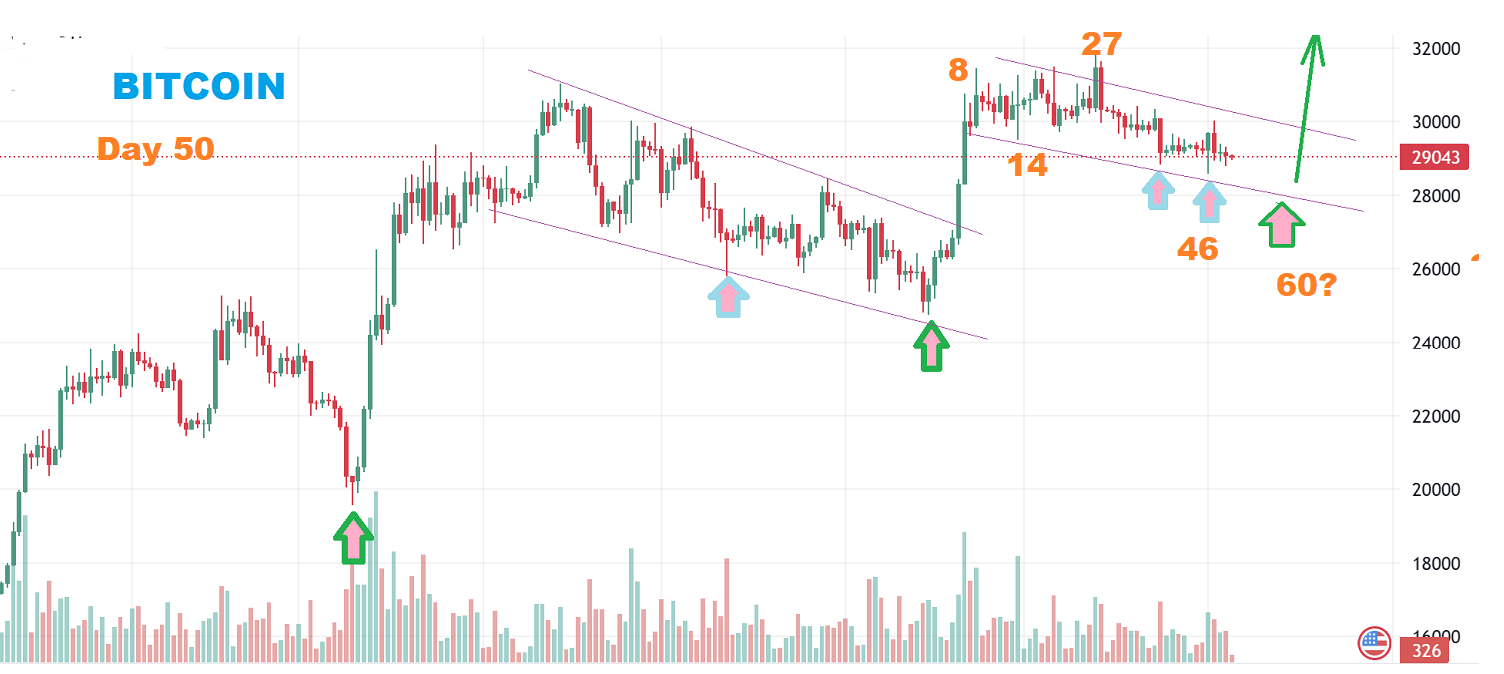
BITCOIN :
– I have discussed how I use 30 & 60 day periods of time to look for ‘lows’ to come into place for Bitcoin. I have seen a couple of times when this stretches or comes up short but most of the time it is a reliable guide.
– Last week we saw a reversal candle form and I mentioned that I wouldn’t be buying Crypto stocks because it seemed too early. It was only around day 46 ( of possibly 60), so I thought that we could see 2 more weeks of choppiness before another leg higher would be expected.
– We are now 50 days out from the last deep low, and I viewed that last low as an ICL, so I have to expect possibly another week of choppiness or pop & drop before another buying opportunity arrives. It COULD launch early, so I will keep my eyes on it, but so far patience really has been the best result here.