July 12th – CPI Wednesday
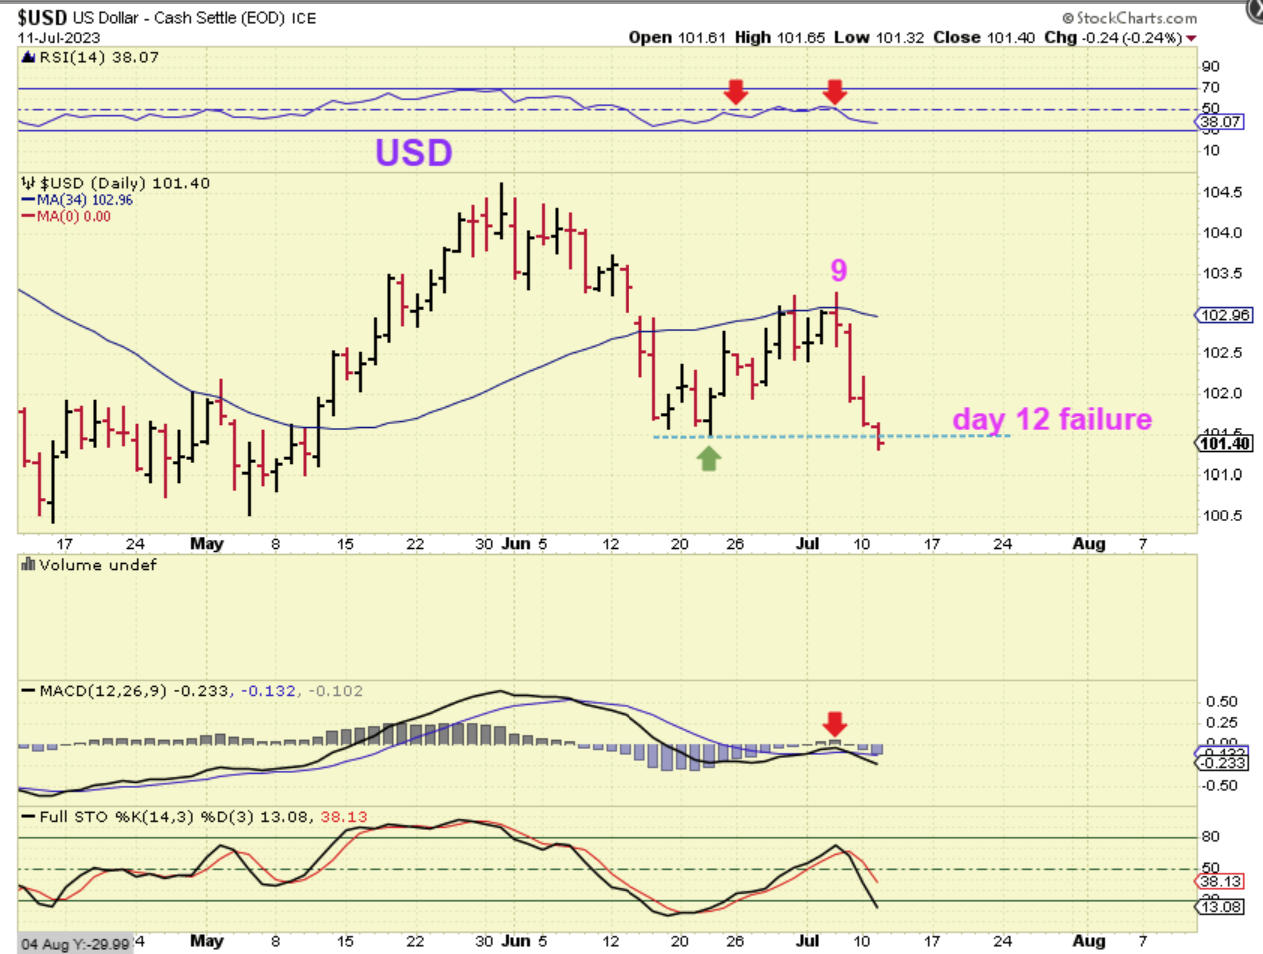
Yesterday the USD daily cycle failed, and that should mean that we now have a couple of weeks of ‘weak’ trading for that USD. It also could have been the catalyst for Gold and The Miners to POP, but sadly, they didn’t pop yesterday. That was fairly disappointing, but we do have the release of the CPI Numbers this morning at 8:30 a.m. ET (Inflation). Maybe that will push Gold higher and the USD lower?
.
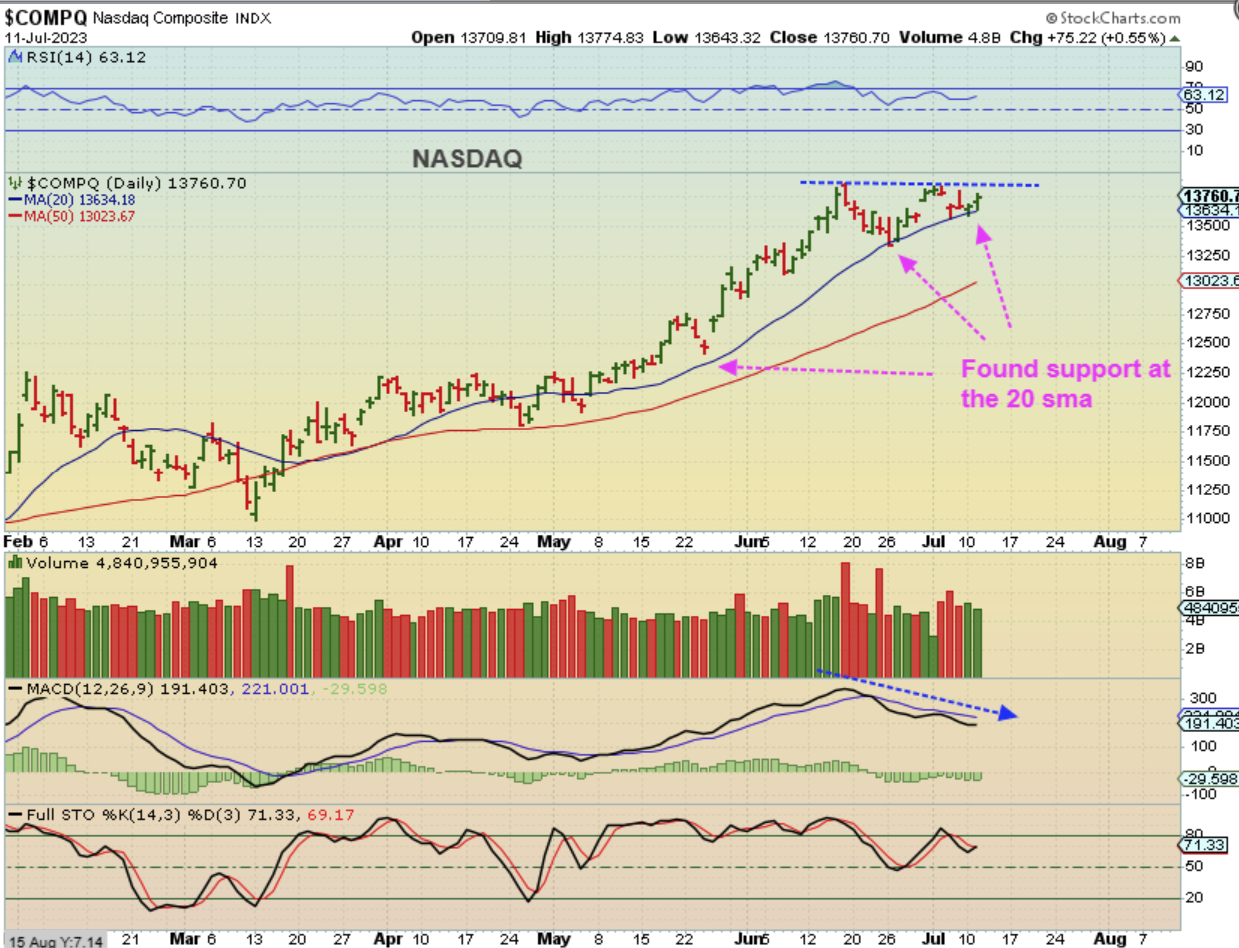
THE NASDAQ dropped and reversed at the 20 sma again. I’ve been looking for a pullback, since we had divergence at the highs, but so far the 20 sma is holding up price. That divergence can also just re-set with choppy sideways price action if this remains bullish and buyers continue to prop it up.
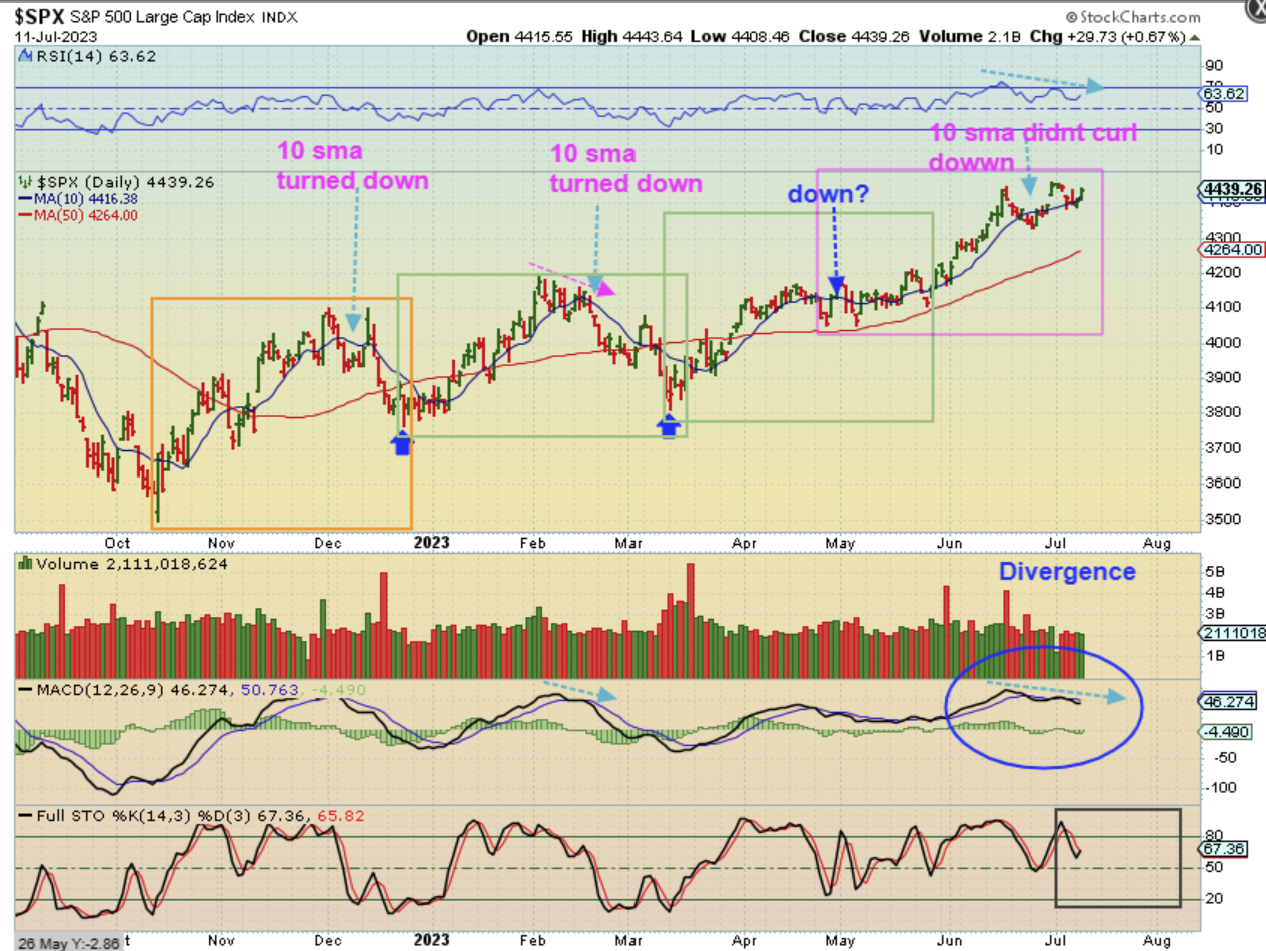
THE SPX – When we look for a dcl, we look to see if the 10sma turned lower and here I am showing you how that did happen before the 1st dcl, 2nd dcl, and 3rd dcl, but the 10sma didn’t curl down on that last dip. So was that a dcl, or is one still ahead with this divergence at the double top? That is a tough call. These markets are resilient, and I have said that what you would do is buy that last dip ( or add to current position) and raise stops along the way to be able to stay in the trade. So far the markets are still chopping higher.vI am mentioning this because…
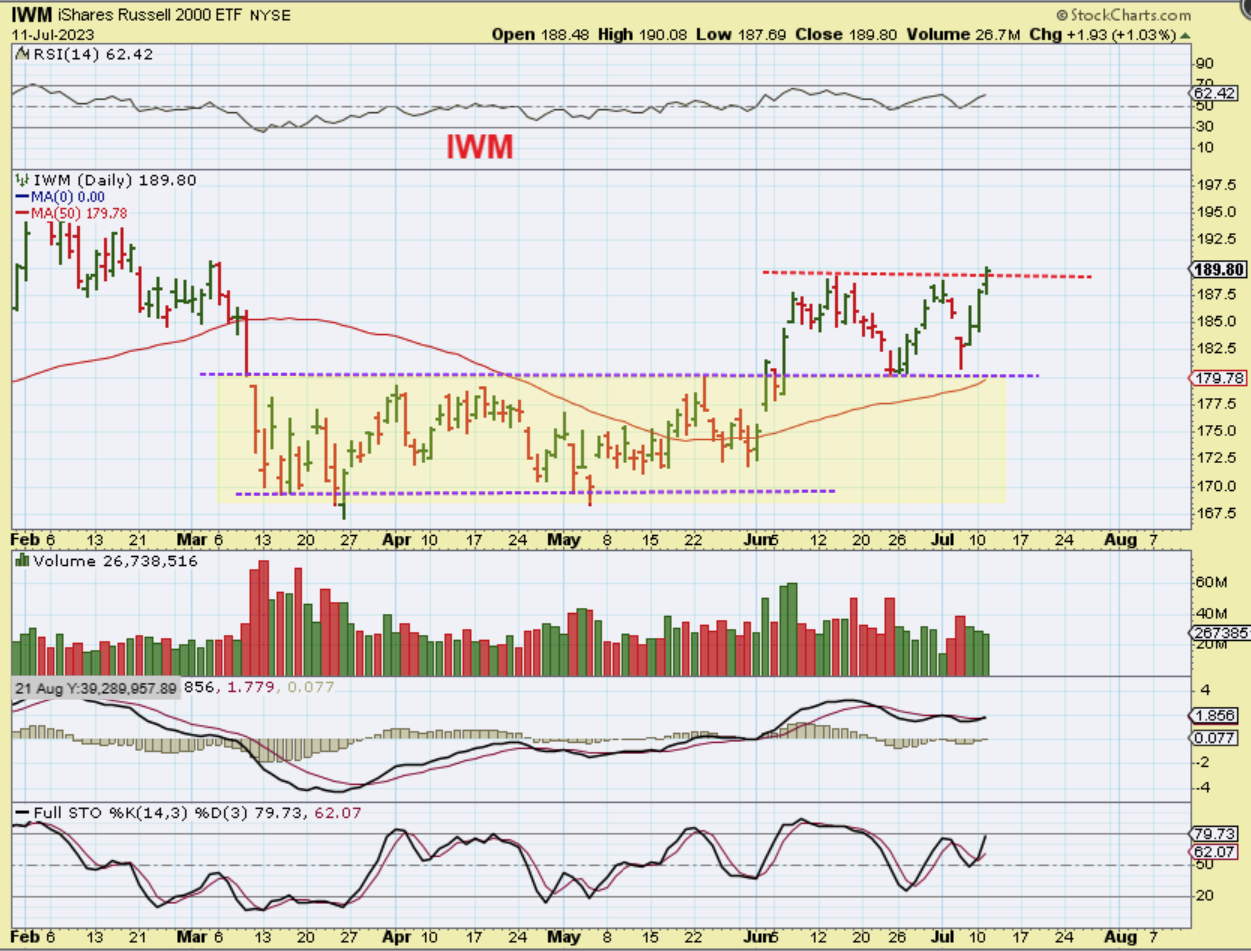
As pointed out recently, The Russell 2000 (IWM) did not rally with the Tech Sector recently, but it is now starting to run higher. You can see here that the Small caps broke to new 4 months highs yesterday, and this looks ready to continue higher (not pull back). Also I have been pointing out that I think the EV and Clean Energy Sector has been waking up lately too. IF the IWM runs higher, the NASDAQ & SPX could just chop sideways and higher too.
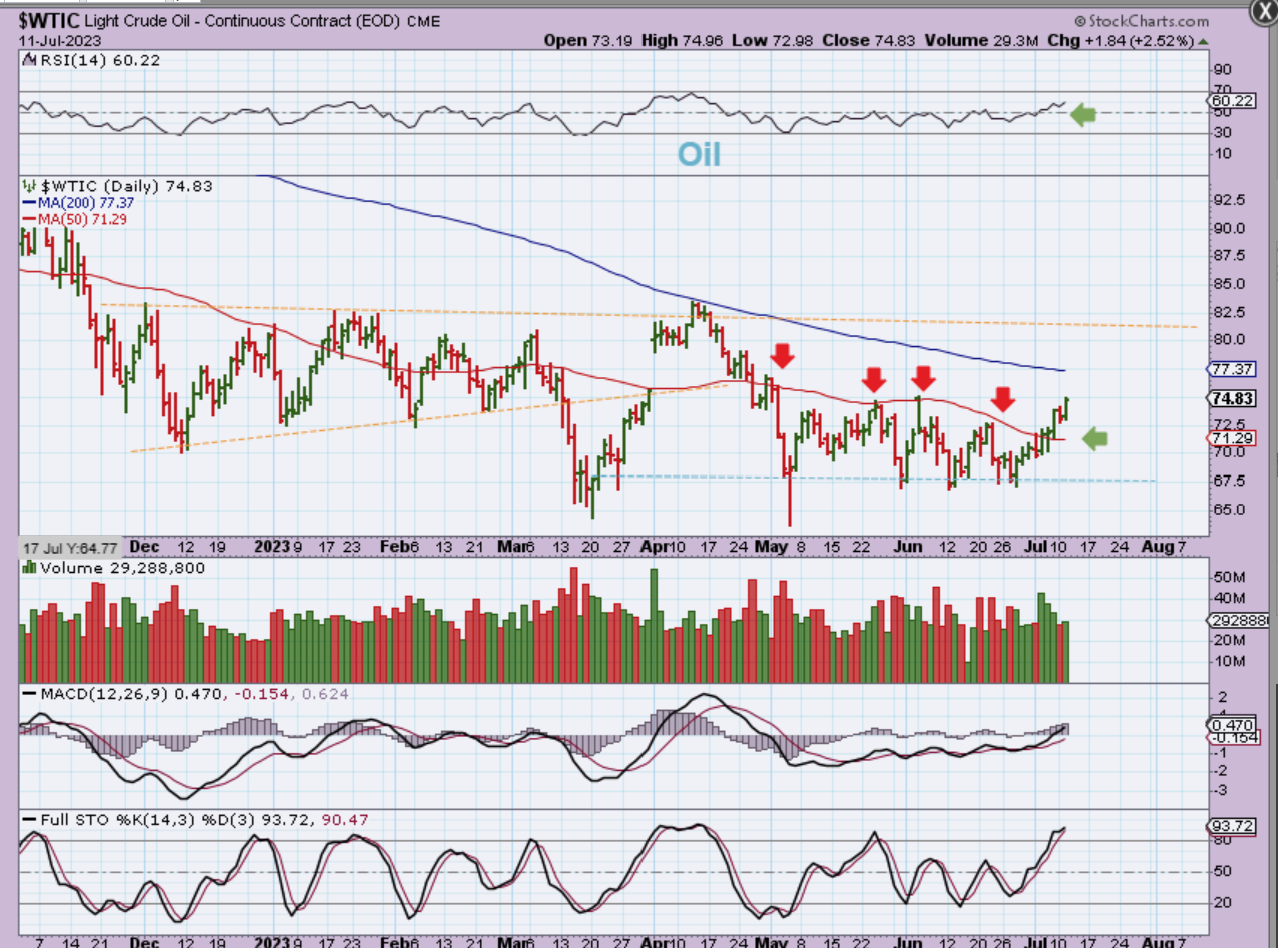
WTIC – I have been discussing the recent new bullishness in Oil. Oil has been extremely choppy and recently it was trapped under the 50sma, but it has now broken above that 50 sma and should be heading for the 200 sma next.
.
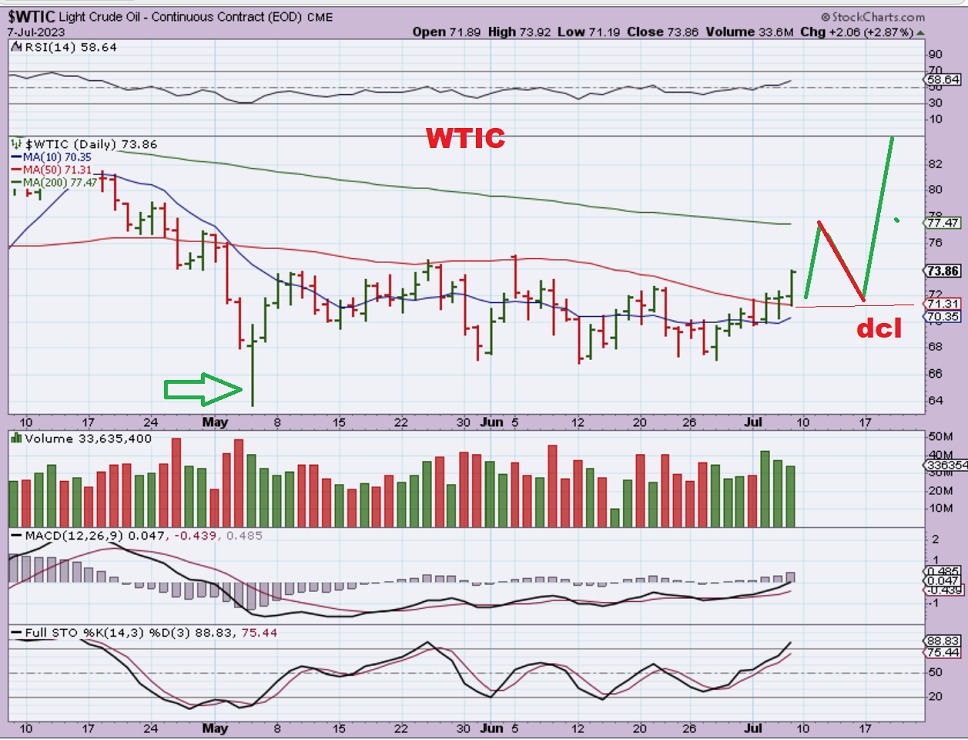
Last week I drew this chart showing a possible run to the 200sma and then a possible dip into a higher dcl. We could then see Oil break out higher and take Oil stocks higher with it, so I have been more bullish in the oil Stocks ( XOP & GUSH too). Oil could also break above the 200sma and then back test as a dcl.
.
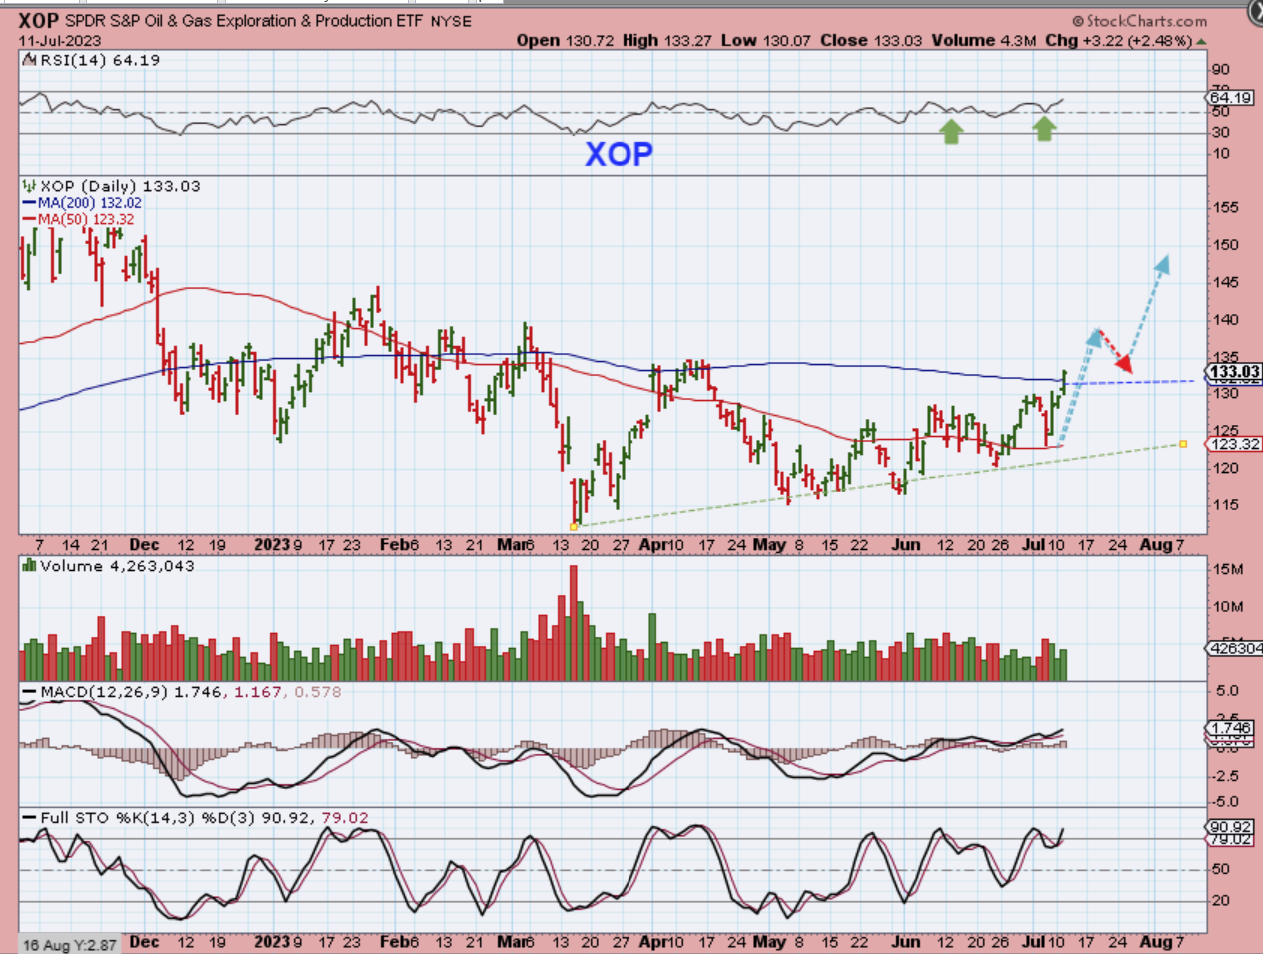
THE XOP (& GUSH) broke out yesterday and has been leading the way.
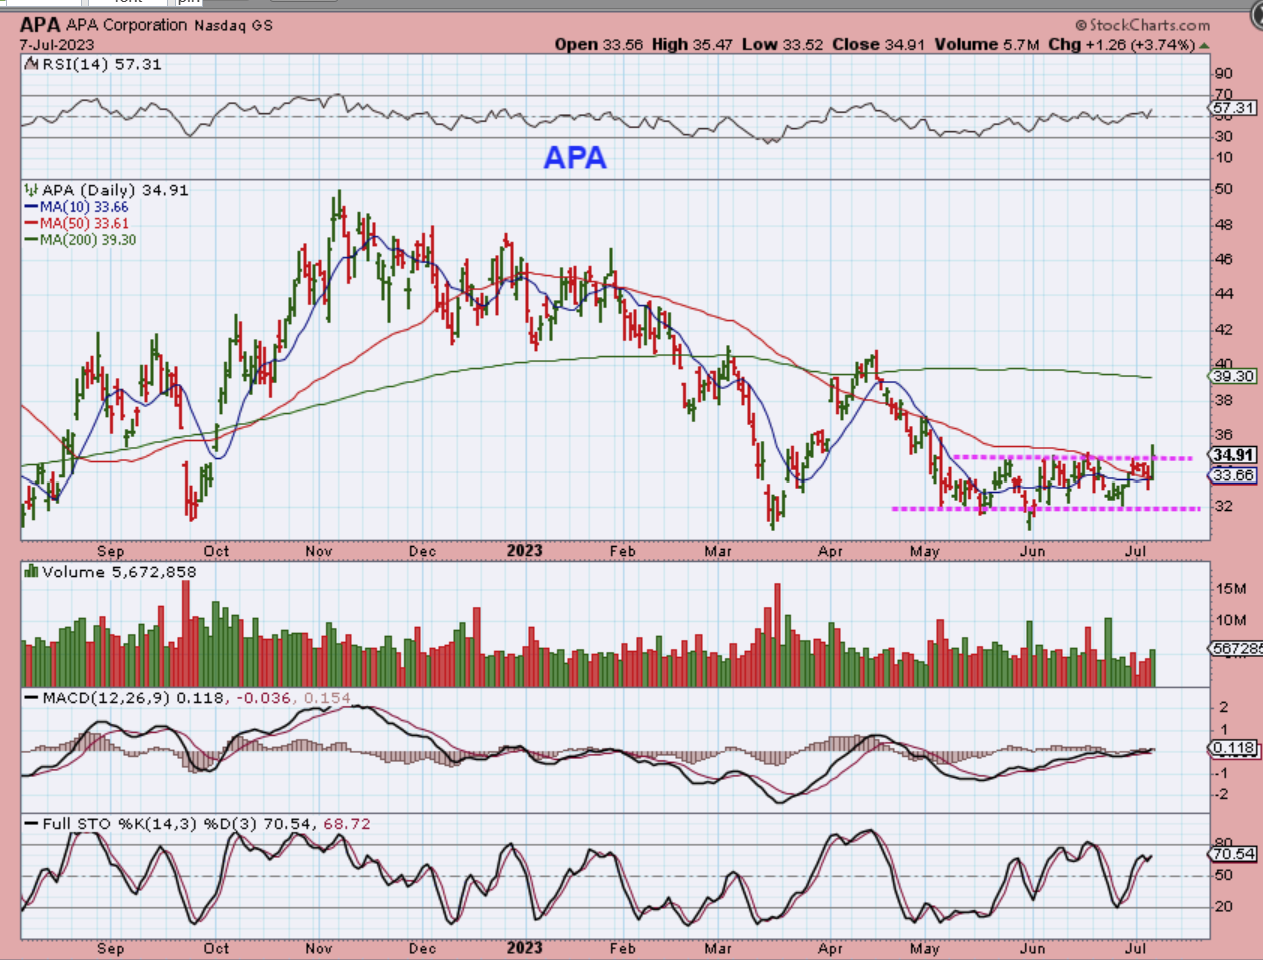
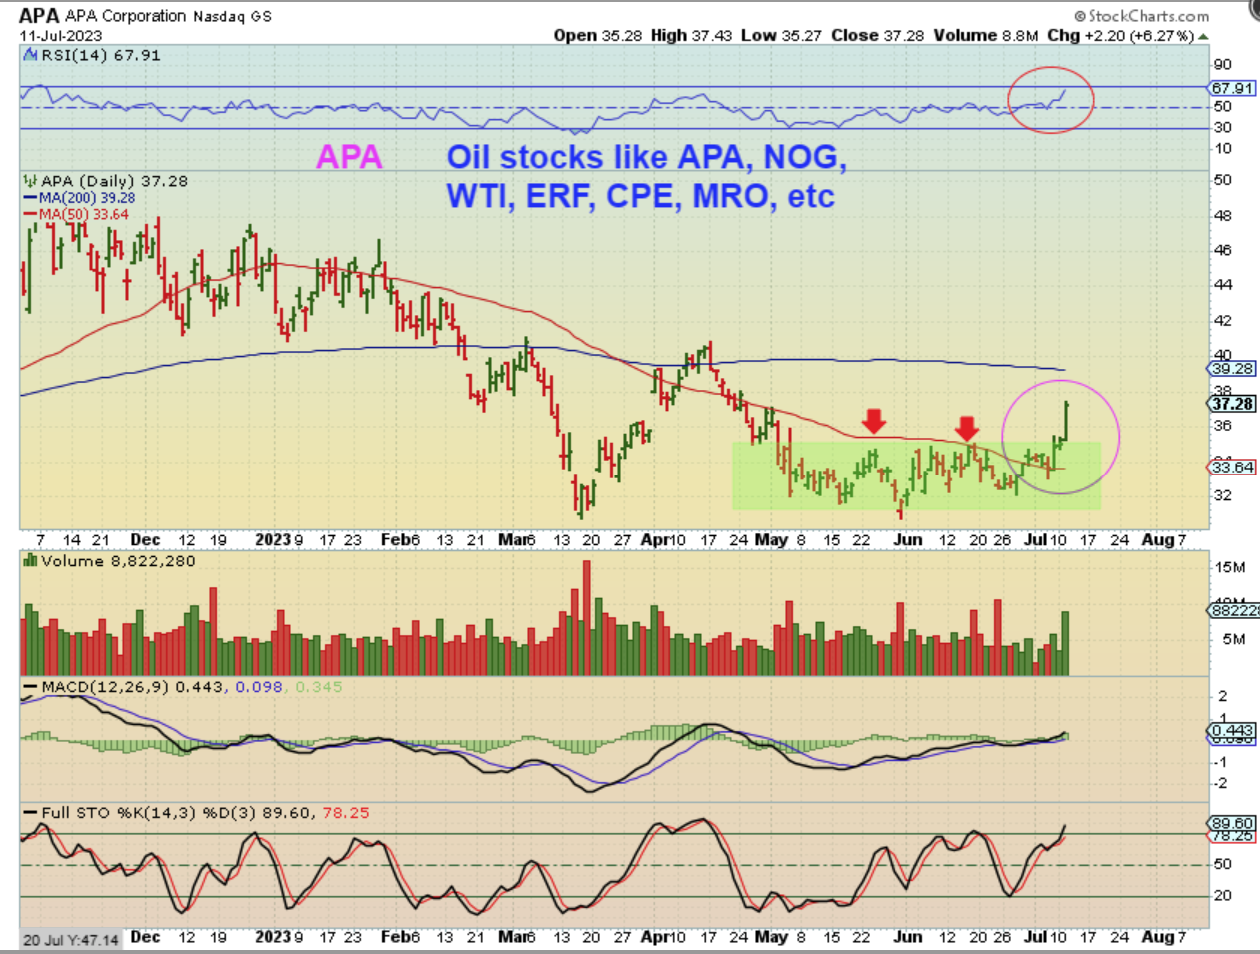
I pointed out one of my favorite Oil stocks (APA) Breaking out last week. And
.
APA Popped yesterday. The other Oil stocks mentioned on this chart are still near the lows, but acting bullishly too.
.
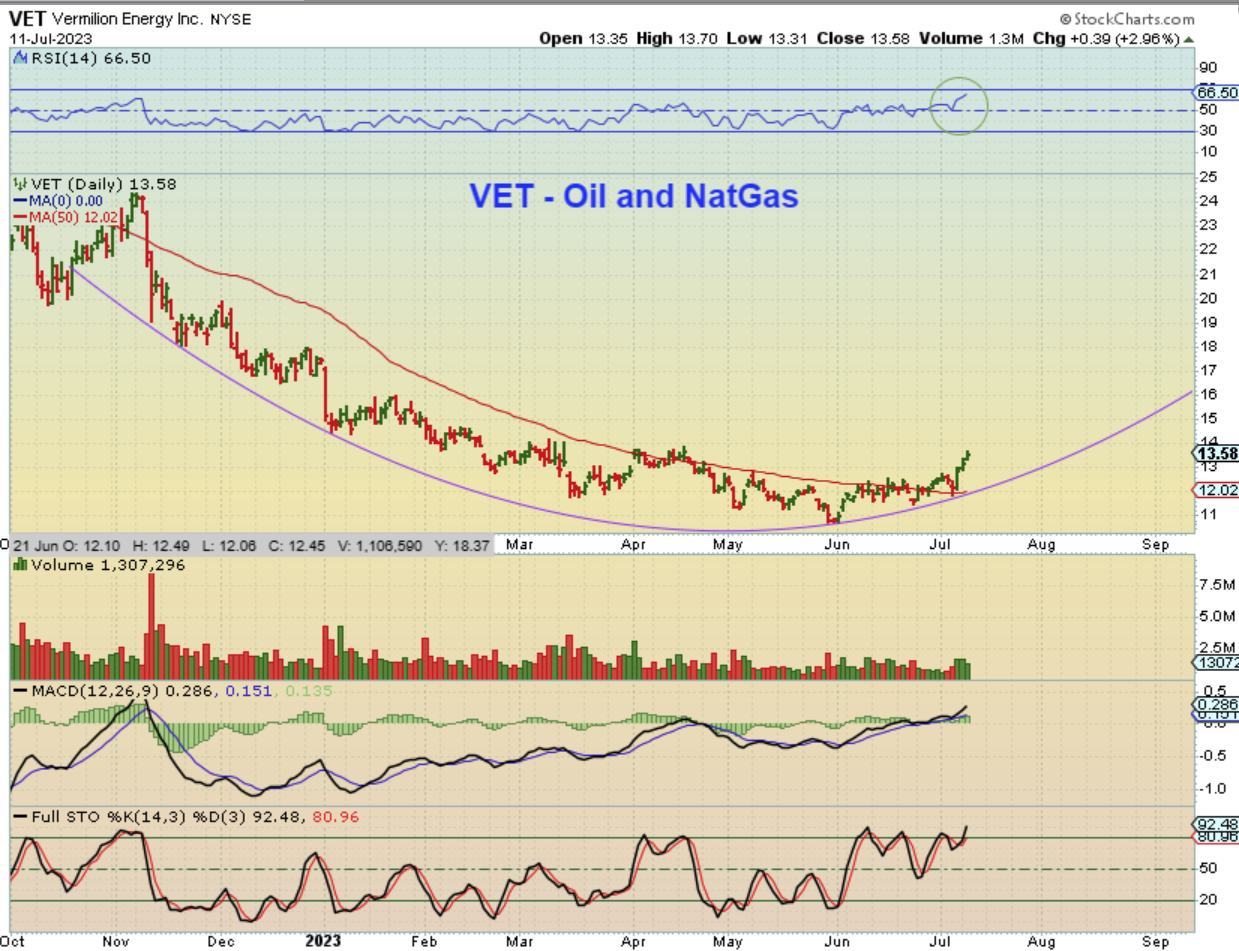
VET – So I started to go through my watch list of Oil Stocks and many are very beaten down after all of that choppiness, but take a look at the potential upside on some of these! With a stock like this, you can start a small position and add on the dips. I may begin to add Oil stocks to the report again, especially after Oil dips to a dcl.
.
This failure of the USD on day 12 was a big deal when I saw it taking place premarket yesterday, but it was a somewhat disappointing day for Gold & The Miners. This SHOULD have caused a nice Pop in Gold, so let’s take a look at Gold next…
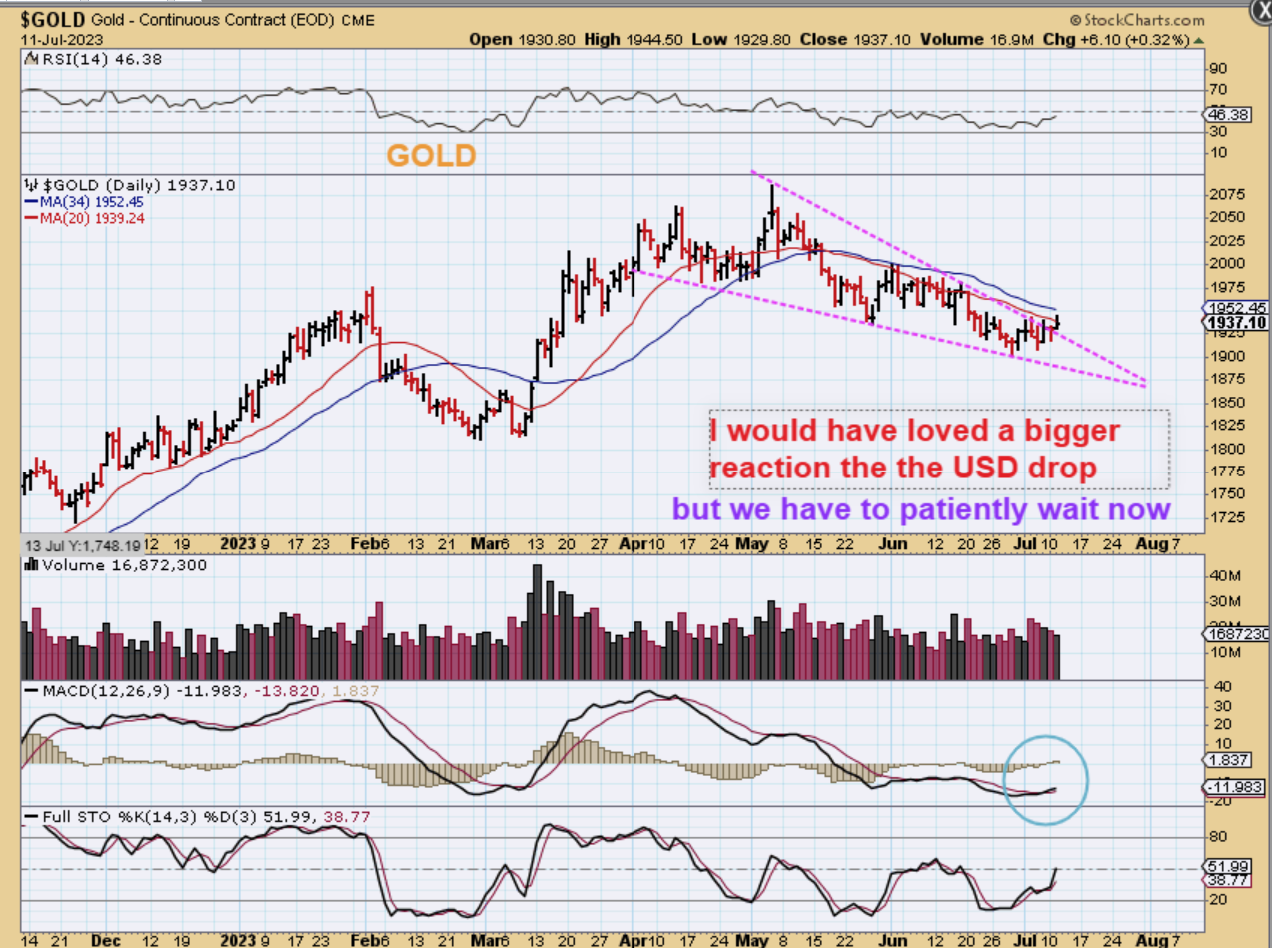
GOLD popped a little bit, but then sold off a little too. Gold is still under the 20, 34, and 50 sma.
1. Is Gold breaking from that bull wedge? Yes.
2. Is the MACD crossing upward? Yes, so there is still a bullish look to Gold, but we’ll just have to wait and see if anything can trigger this and push it higher. We have the release of the CPI numbers today.
.
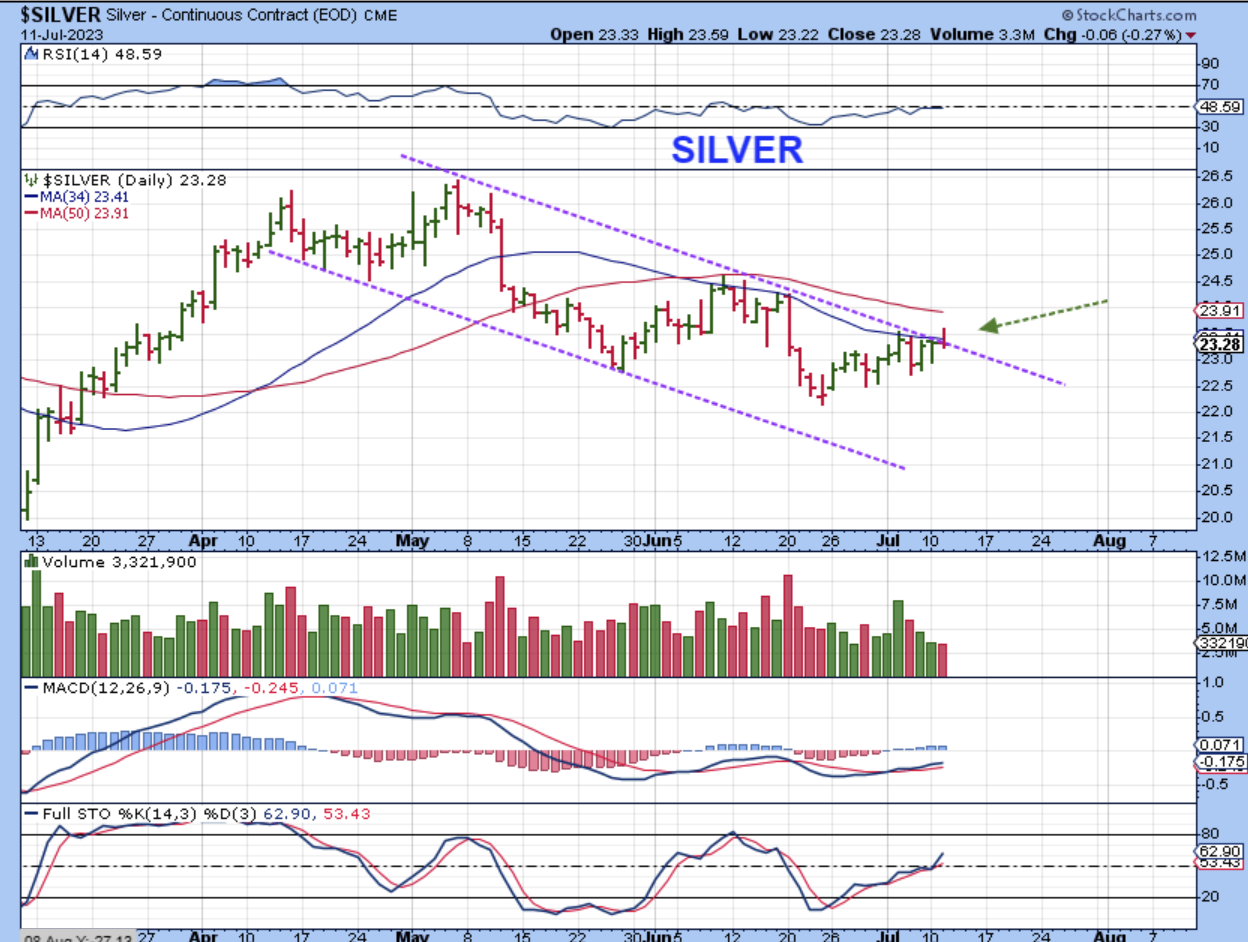
SILVER actually popped and closed RED (with the USD failing?), so this was a disappointment to me too.
.
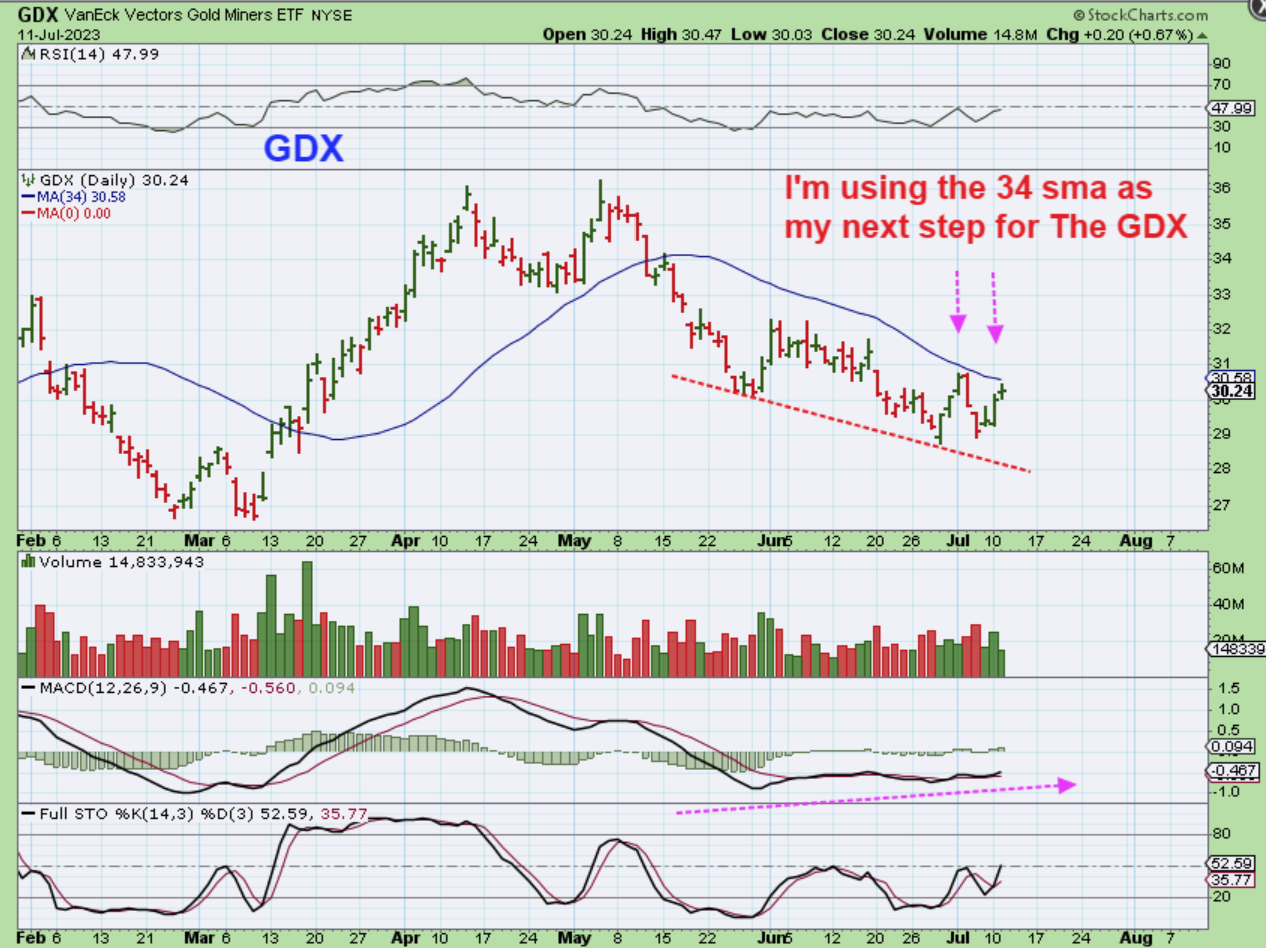
GDX was only up 20 cents and was rejected at the 34 sma. 🙁
.
So one noteworthy development that we are seeing is that the Oil stocks have perked up and the XOP broke above the 200sma. When you look at their charts, you see that most of them have been very beaten down with Oils choppiness at the end of 2022 and over the entire 2023 year. They have been choppy and too difficult to trade. The big picture that shows the beat down actually shows that they have a lot of upside potential if Oil continues to push higher and starts to run. We have also seen some nice moves in Tech and Biotech that started earlier in the year and some recovered to their highs. Nex EV and Clean Energy stocks have been popped & some started to run. See XPEV, NKLA, CBAT, for example and PLUG, BLNK, CLNE, FSR, SOLO, WKHS, etc look as though they will start leaving bases behind now too. Crypto has been absolutely on fire again. That will become a buy the dip sector when it consolidates again too. So we have active markets for trading, but the big question for this week is still , “What will Gold do now that the USD failed? Is it time for Gold to prepare for a breakout to all-time highs?” For that answer, we have to remain patient and see how things continue to play out. Starting a few positions in Miners and adding later could be the best plan, just in case they continue to slowly creep higher day after day, but please use stops in case they break down.
.
Lets see what Wednesdays CPI Numbers brings our way – Enjoy your Wednesday trading!
.
~ALEX
.
I just want to quickly share a couple of ‘bigger picture’ Oil company charts here, just to show the recent selling & the upside potential.
.
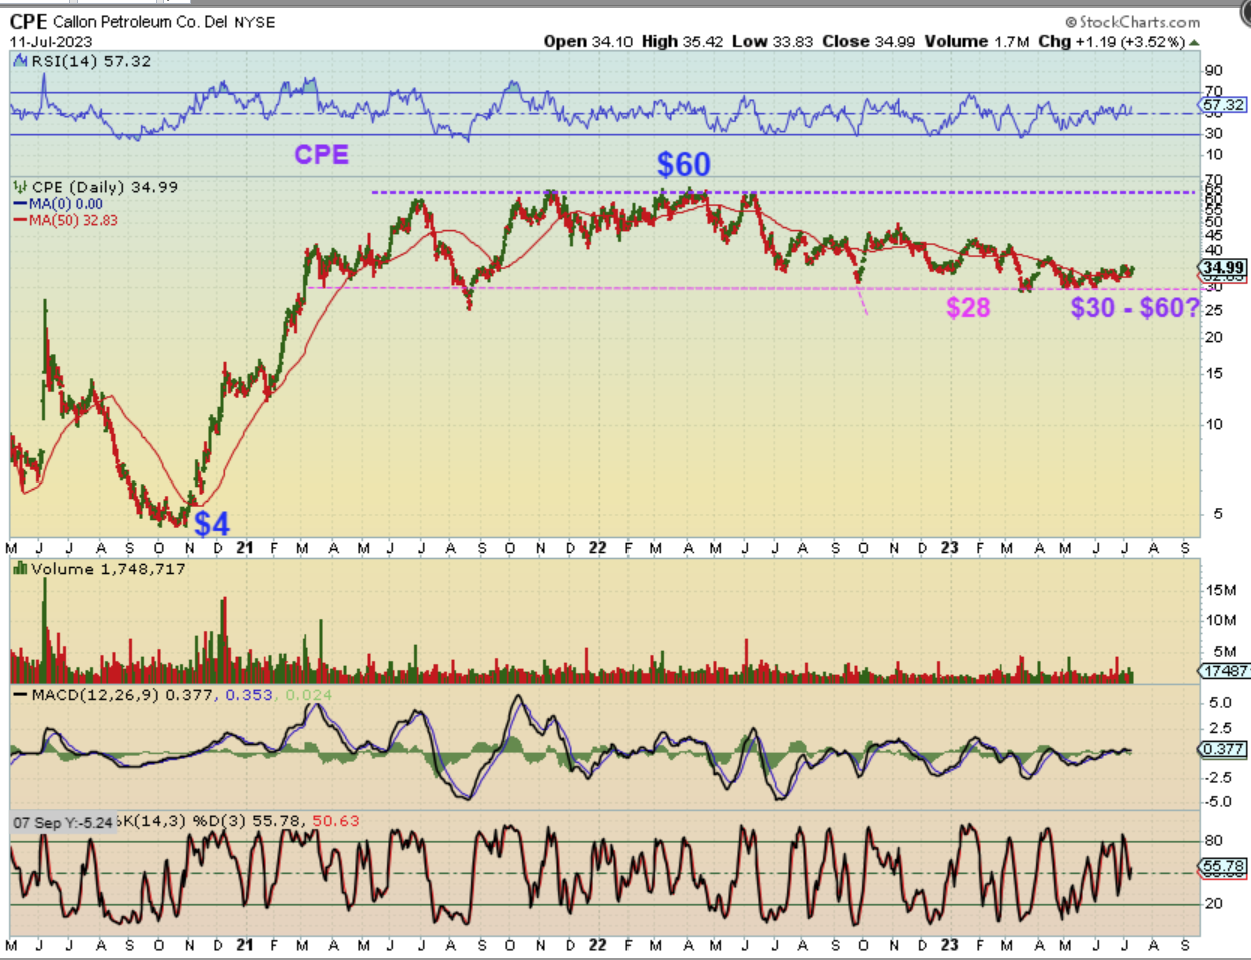
CPE (Log chart) – Take CPE for example. It ran from $4 to $60 back in 2020-2021. Then it sold off roughly 1/2 of that to the current $30 area. If Oil starts to move higher, couldn’t this now easily run to $60 or $90? I think so.
.
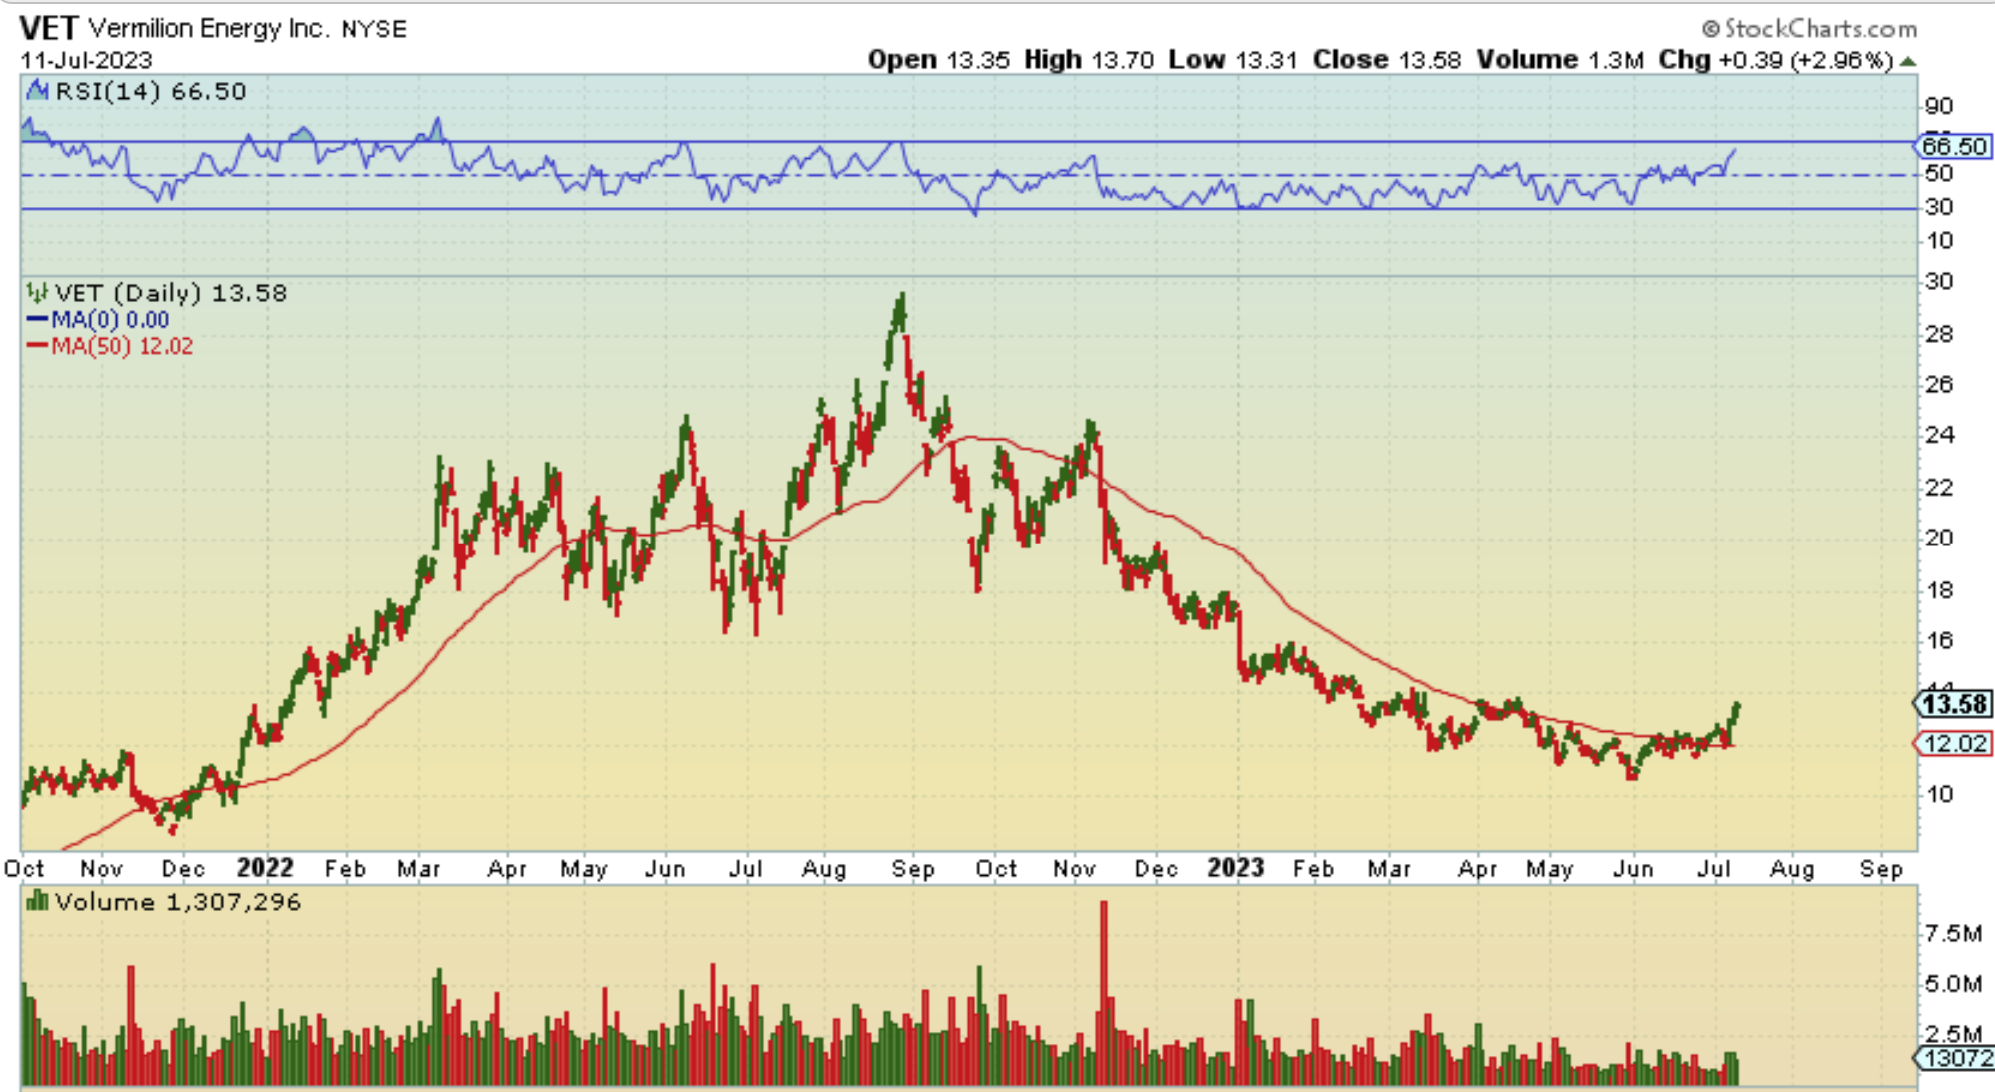
VET ran from $2 (not shown on this chart) to almost $30 and then fell back down in the $11 area with Oils sell off. This has strong upside potential if Oil continues higher and if the company stays healthy. $10 to $20 or $30? It would be possible longer term.
.
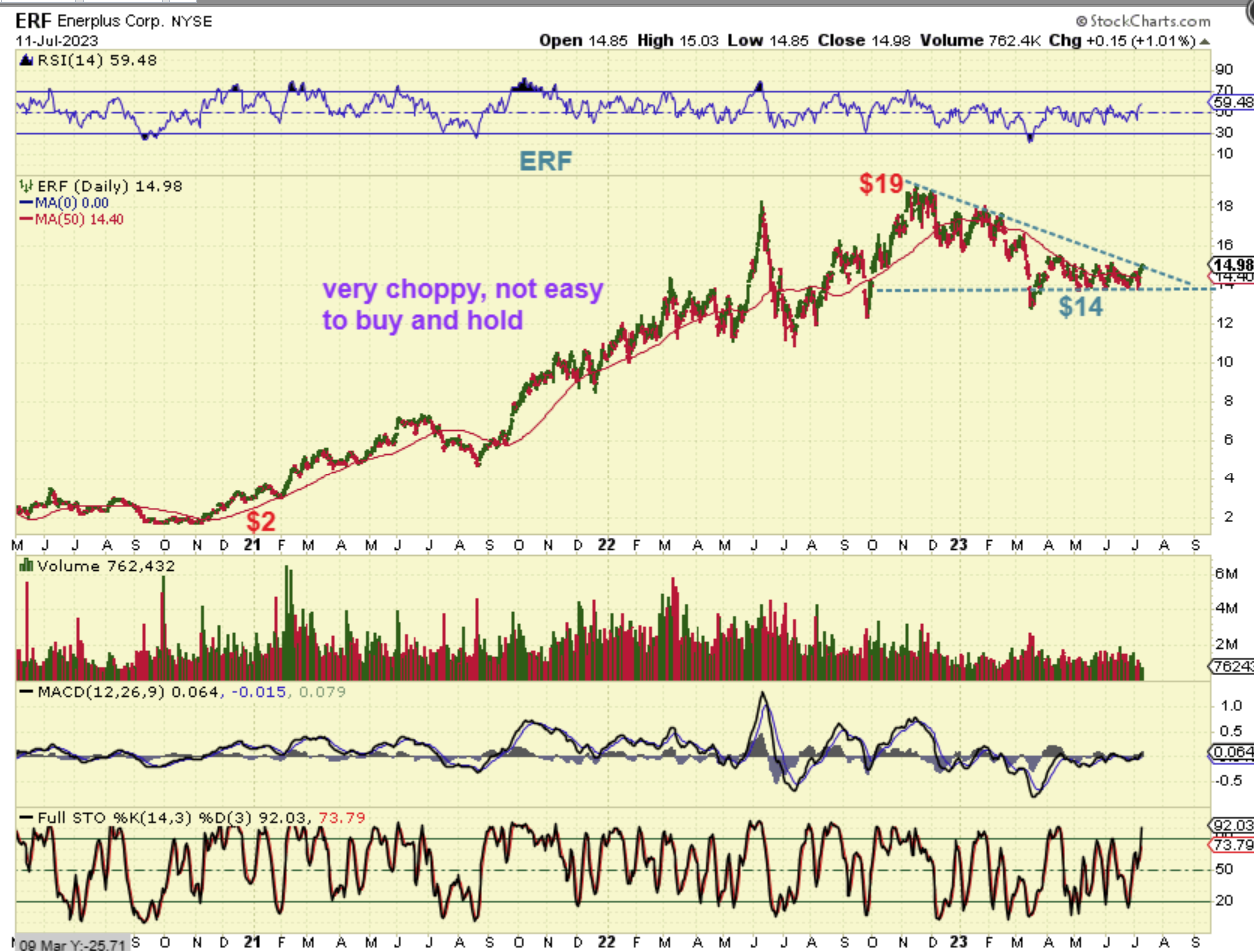
ERF, NOG, WTI and several others did not pull back 50%. ERF dropped from $19 to $14 and it looks ready to break out, actually.