Tuesday July 25th – The Fed Countdown
Wednesday is the FOMC Meeting, and whether or not the Fed will raise rates or leave them is open to debate this time around. One thing that we know for sure is that tomorrow is usually pretty volatile around 2-4 p.m. ET, and today could act as the calm before the storm. We’ll see. Let’s see what Monday gave us…
.
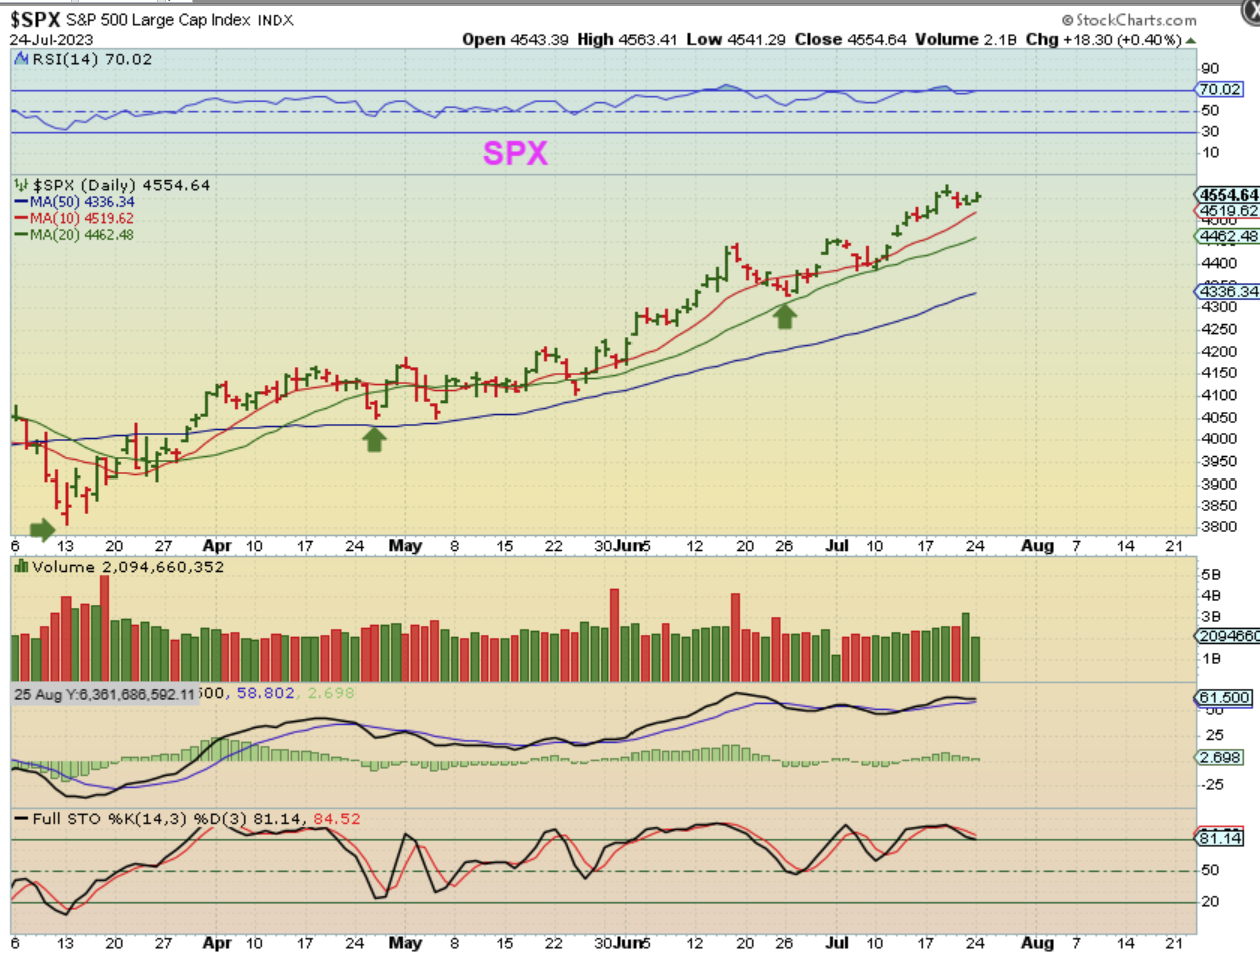
The SPX moved slightly higher heading into the Fed Mtg. Due to cycle timing, I am expecting a pullback. Why? We are coming due for a drop into an ICL on the weekly charts, so the daily should become L.T. and time is running out for that. I wonder if the markets will rise up into the Fed, and then roll over? Let me show you something with the Nasdaq …
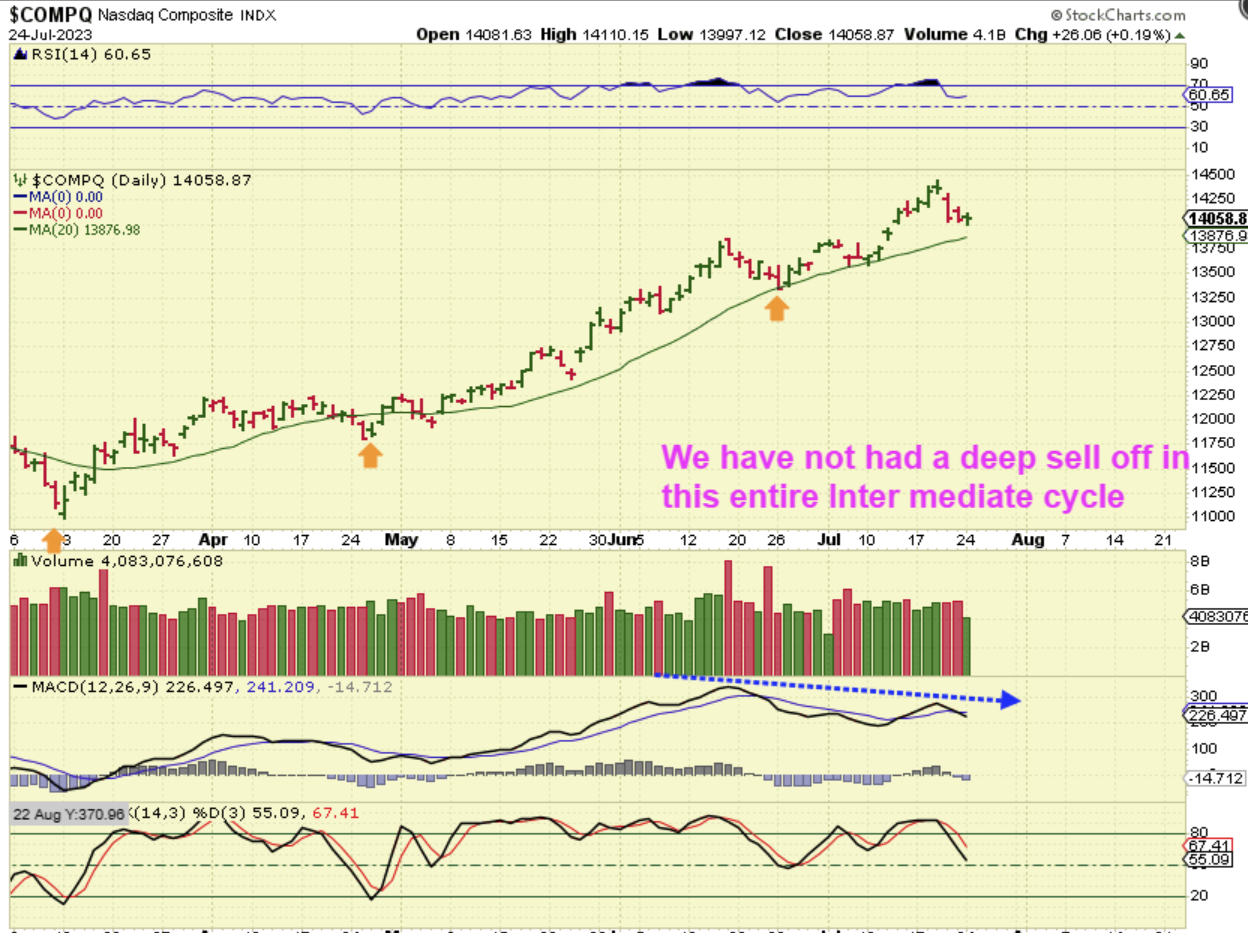
NASDAQ – This has been a very bullish run, but look at that MACD divergence when price hit a higher high.
When I look at the entire Intermediate Cycle from March to now, I really do not see a deep dip. This has been a strong steady run. Even the dips into the dcl’s are at or around the 20sma. The NASDAQ peaked on day 16 so far and if that peak remains after the Fed Decision, then this could drop for a couple of weeks into day 30-40 plus, since daily cycles have been running long. That would make this a L.T. Daily. If it drops for a couple of weeks, it should be a fairly decent drop, because we are due for an ICL in August or September.
.
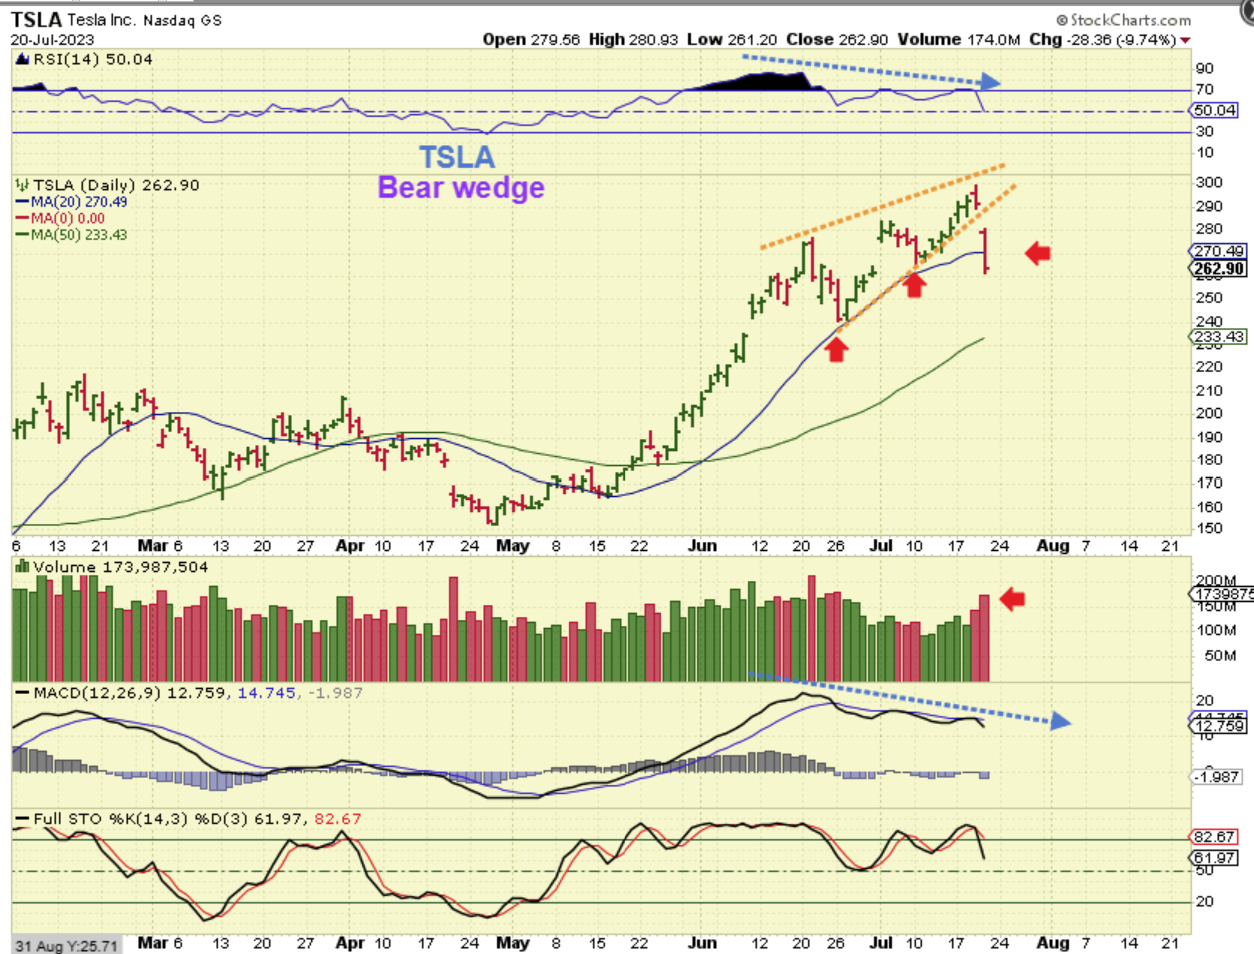
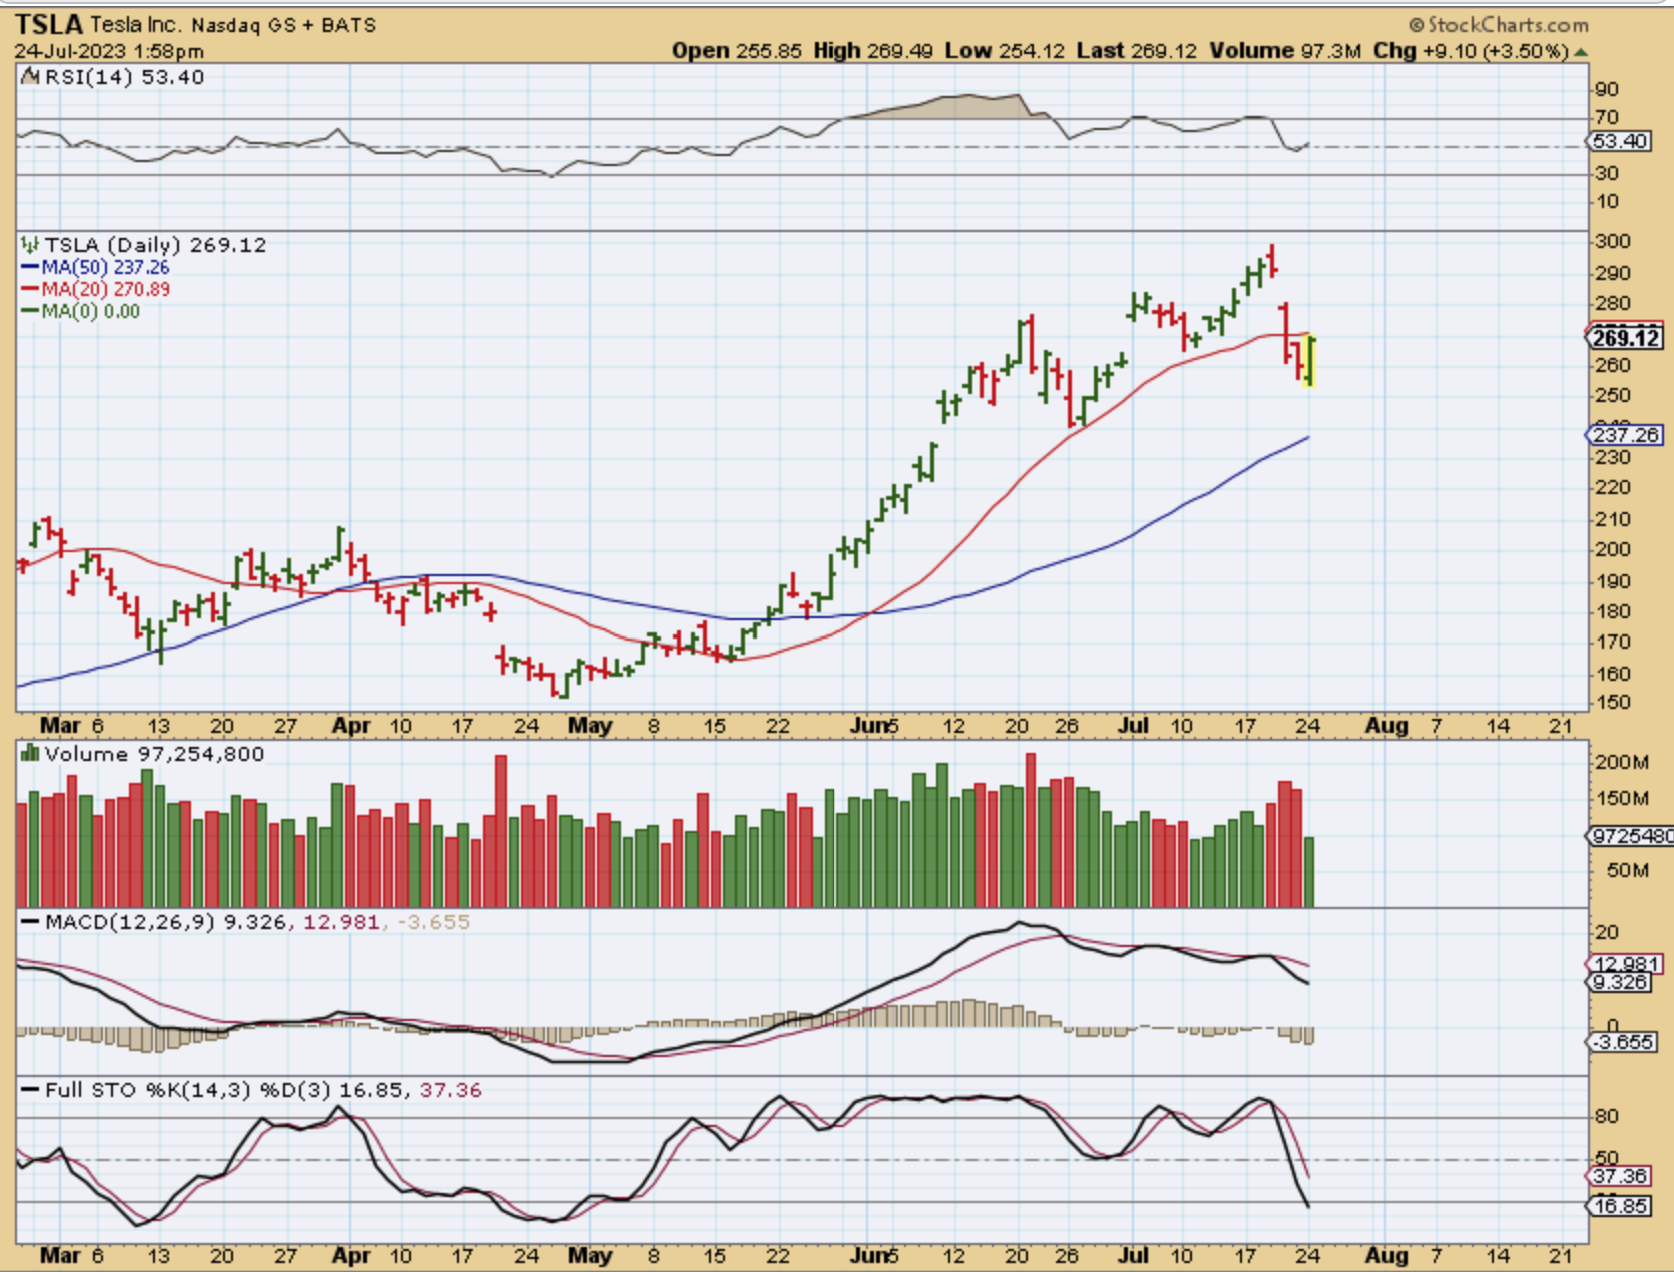
You may recall that recently I used this chart. I pointed to the price action on TSLA and NFLX as they plunged below their 20sma, and mentioned that it may be a possible warning sign for the NASDAQ. It too had strong divergence.
.
TSLA had a strong reversal on Monday, so I am keeping an eye on it, but this could easily stall and drop again. If the Fed Rate Decision causes the general markets to dip, this will roll again in my opinion. This could turn into an a-b-c drop quickly.
.
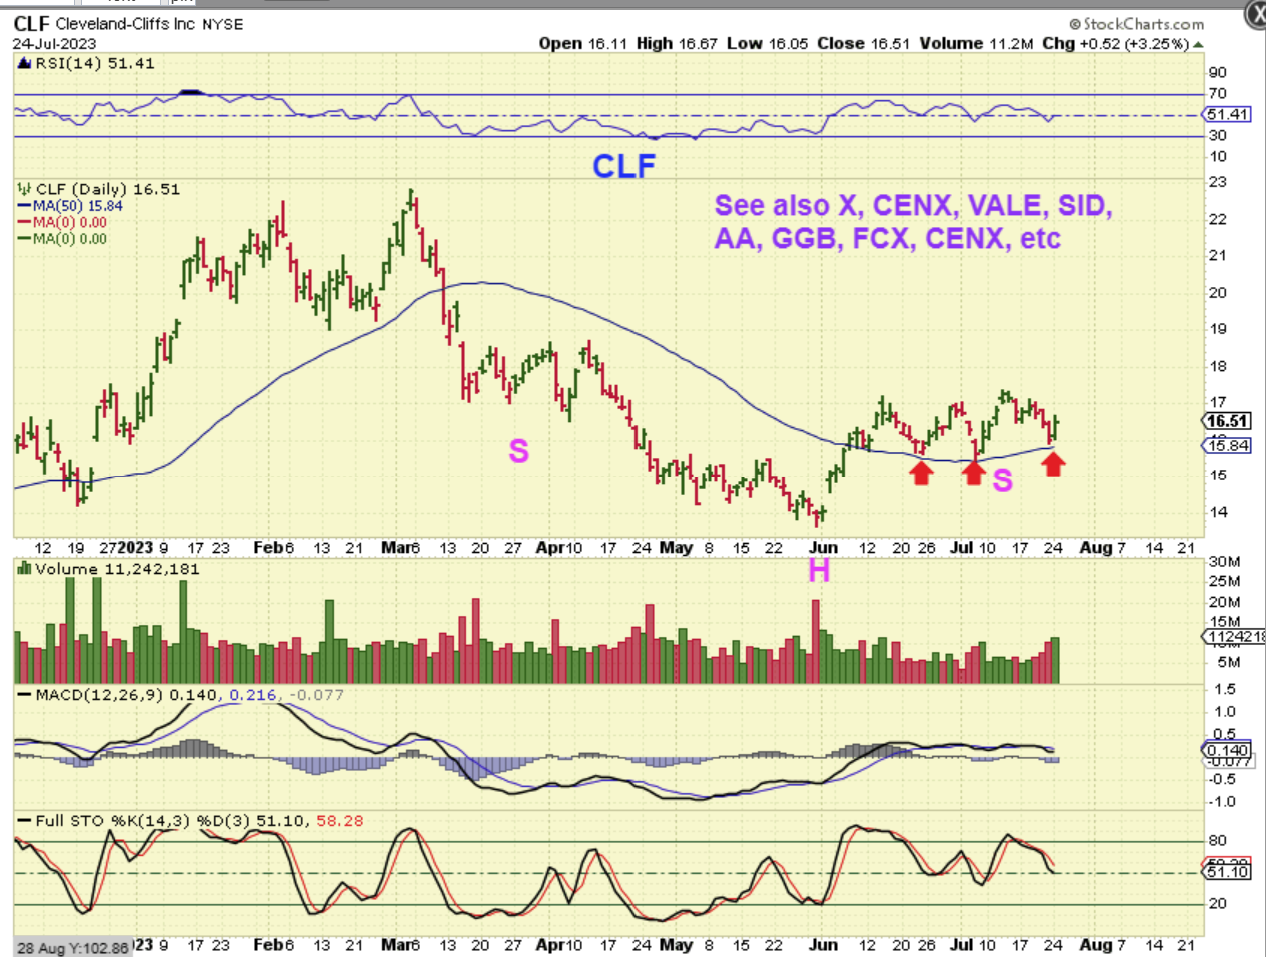
If we do get a General Market pullback that lasts for weeks, We may see Commodities like Oil, Metals, Precious Metals, and Uranium benefit. I will explain this with charts at the end of the report. Yesterday I did notice that CLF, VALE, FCX, and several other ‘Metals’ stocks look bullish too.
.
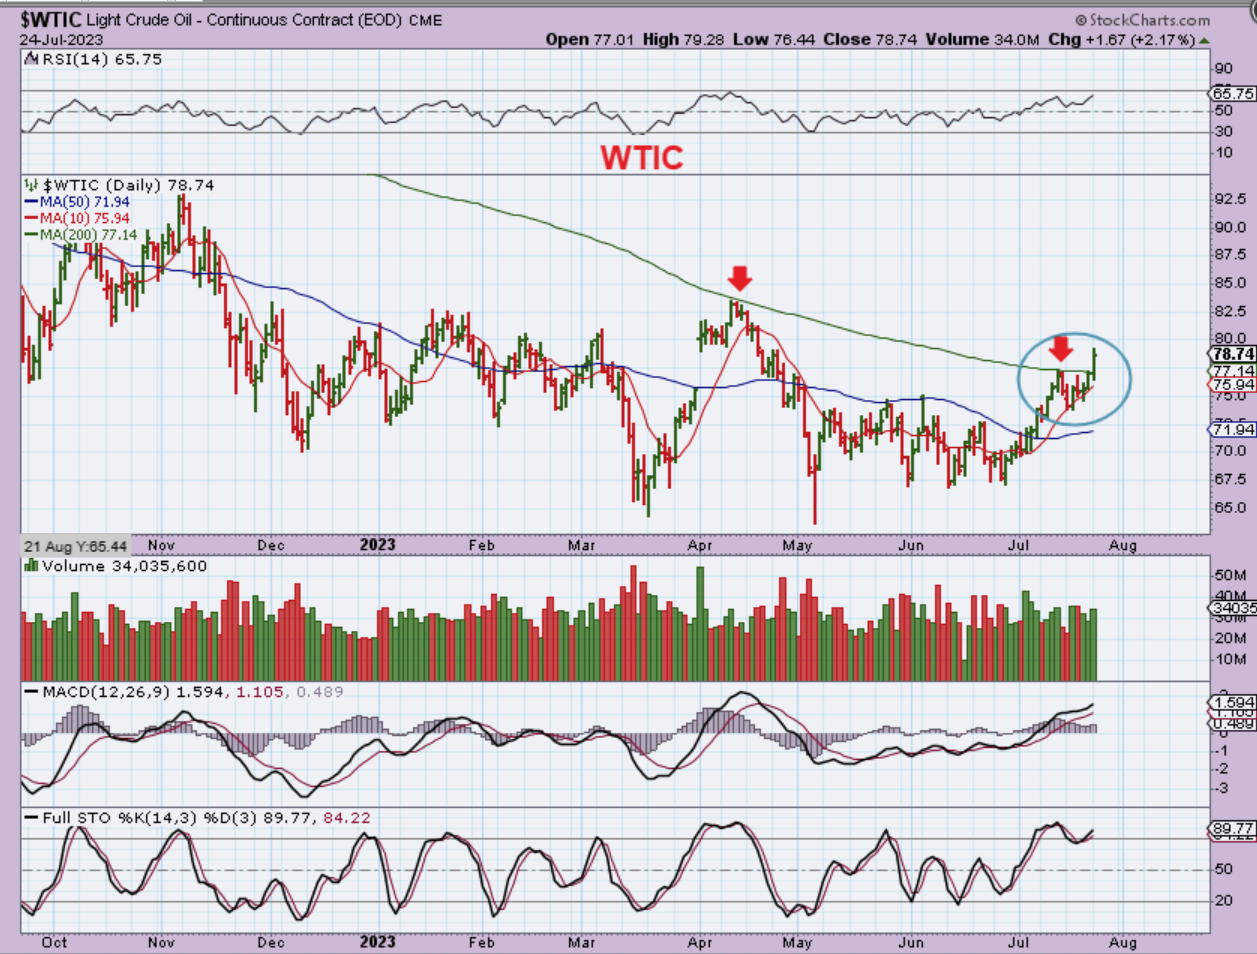
WTIC – Oil continued higher and has now made a breakout through the 200sma, so we are definitely seeing a change in character for Oil. It went from weak, choppy, and sideways to a run to the 200sma, a bullish crawl, and now a breakout. I think that the dcl might be in that triangular crawl, and this would be the 2nd daily cycle.
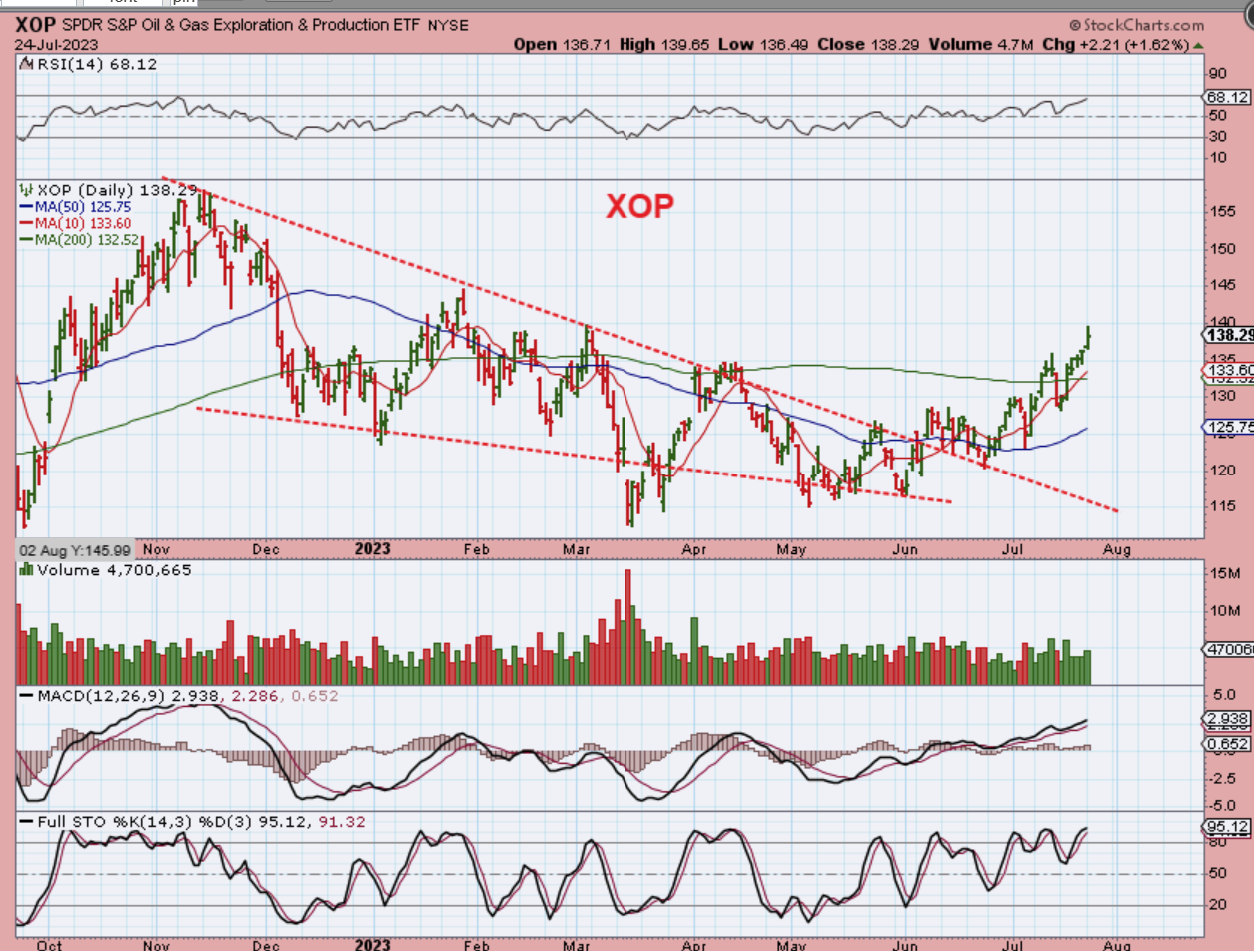
XOP – Oil Stocks have been on a buy for a while now, because they were leading the way and acted bullishly. The XOP broke from a bullish descending wedge, back tested that, then closed above the 50sma & back tested it too. It then rallied through the 200sma. The XOP & Oil stocks also continue to show bullishness with higher lows out of the lows.
.
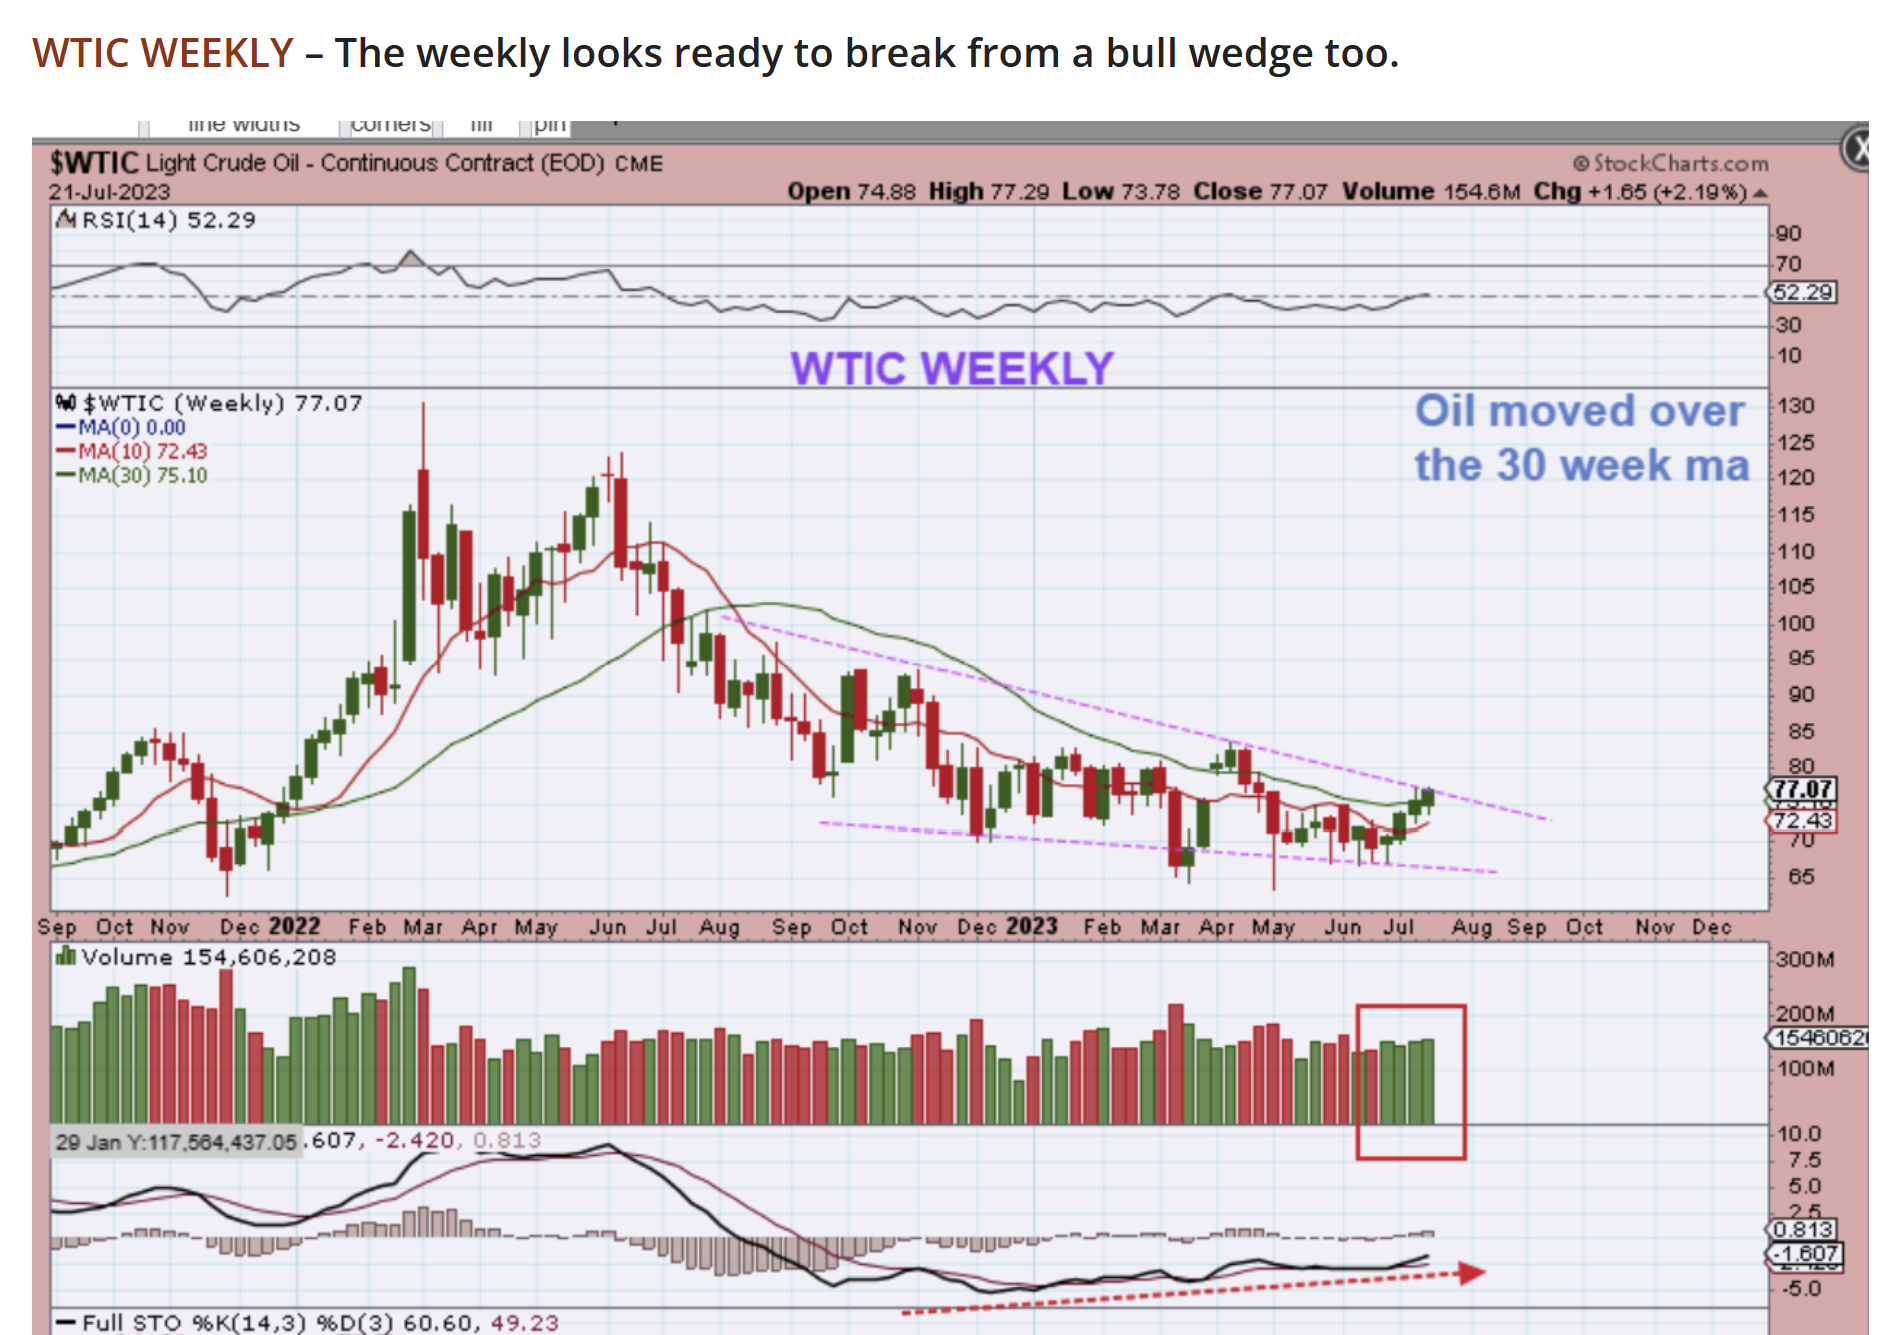
In the weekend report I showed this chart with Oil pushing on a weekly wedge downtrend too. Mondays push higher would have this forming a weekly breakout too.
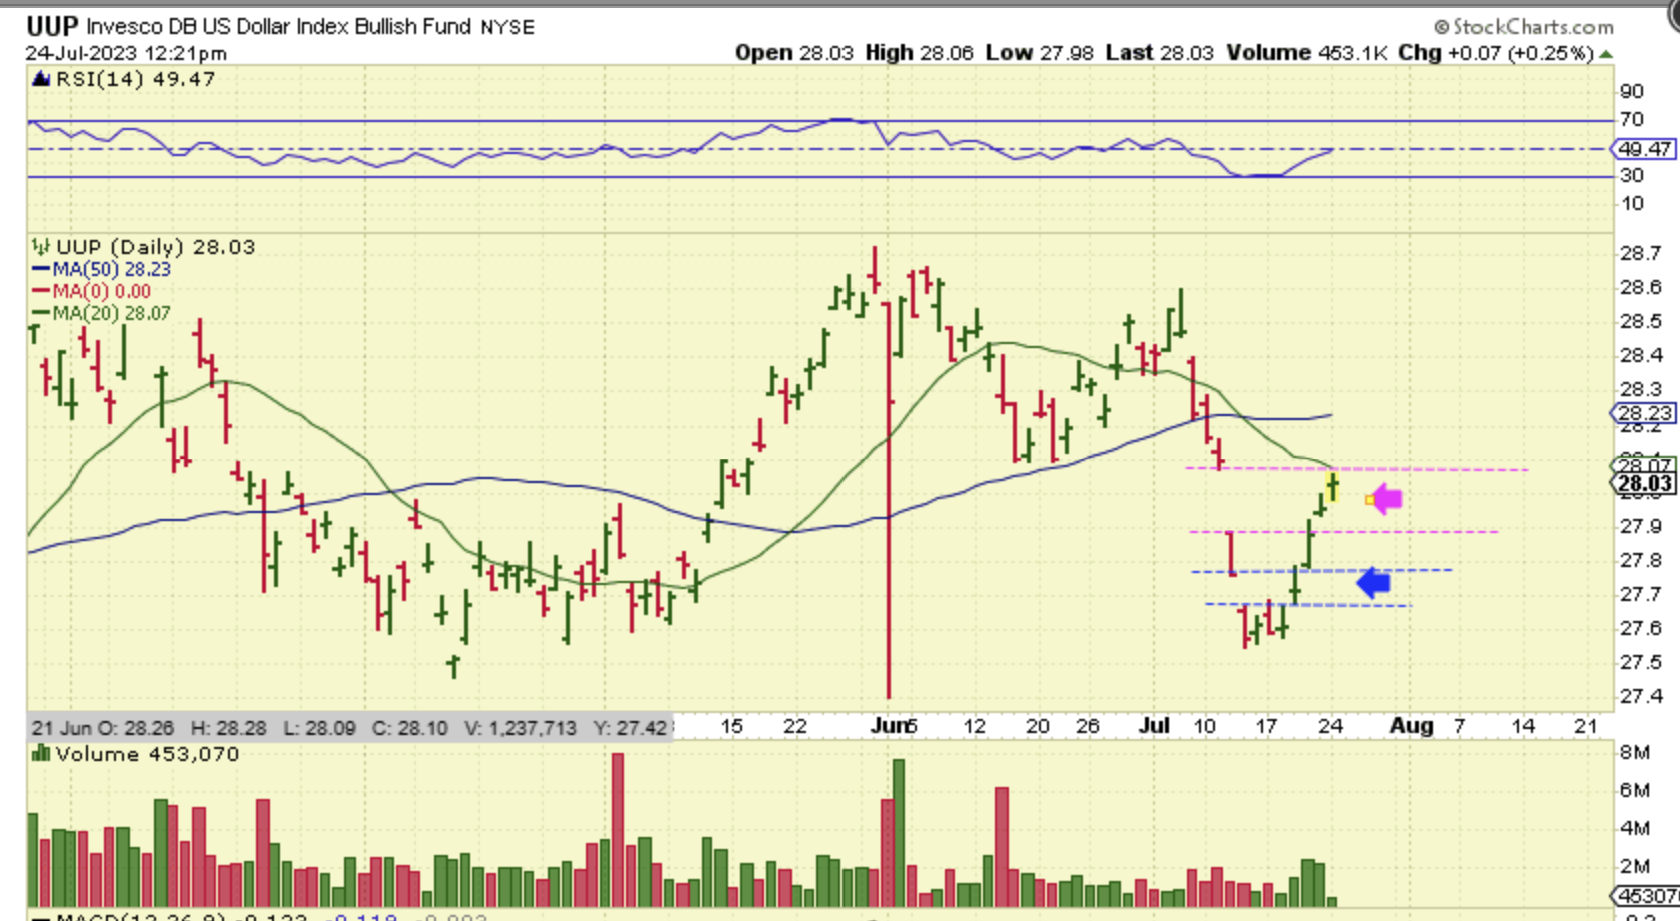
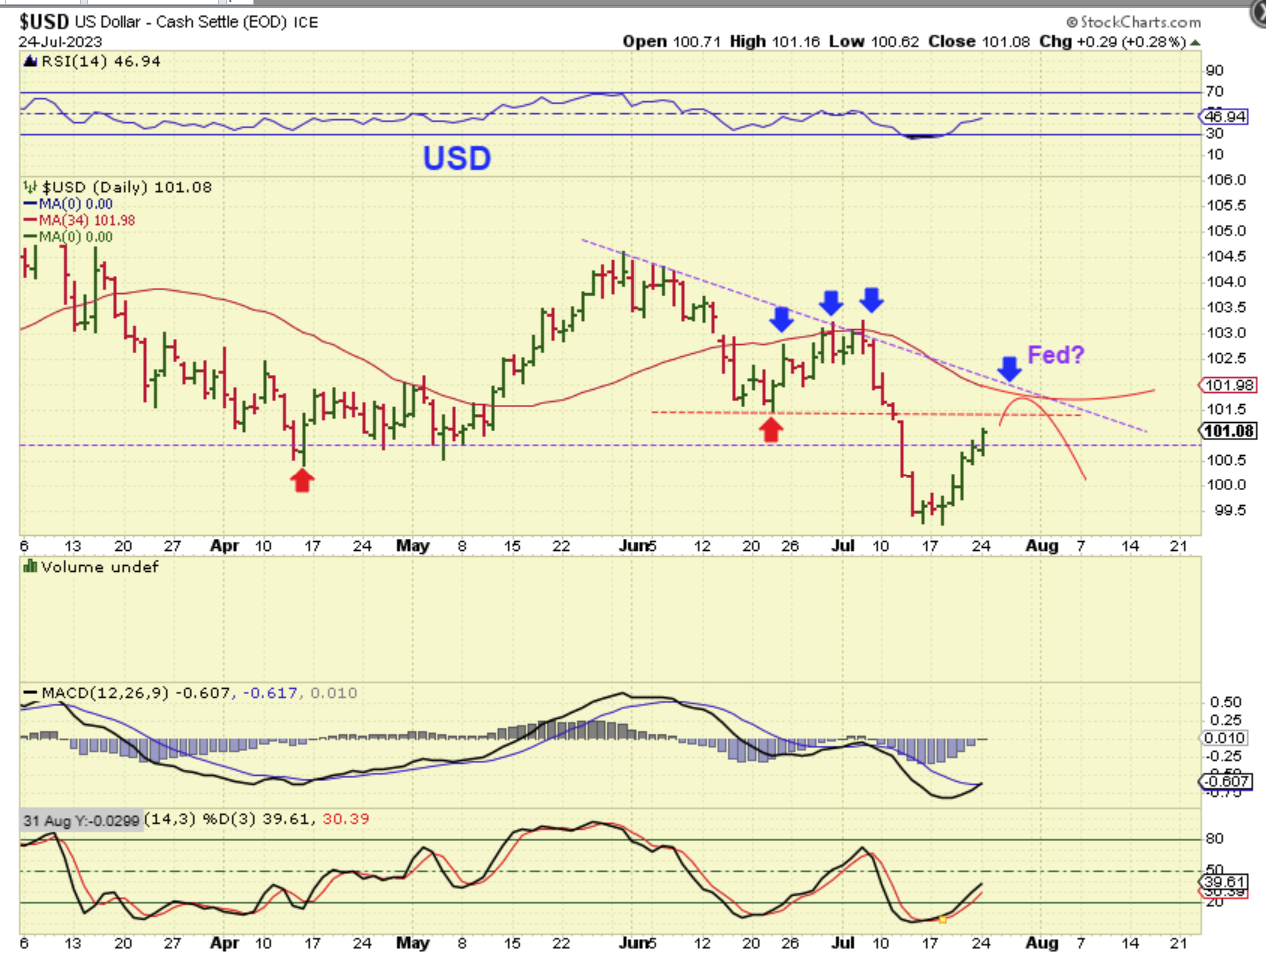
UUP – I was looking at the UUP midday and thinking that the 2nd gap filled as price tagged the 20sma – so maybe the $USD bounce ends in this area? When I looked at the chart of THE USD though, it makes the UUP look as though it could run higher to the 50sma. Let’s take a look…
With The USD, it does look like it can climb a little higher though. That would actually match the Fed Rate Decision perfectly though, if it plays out as drawn. Theoretically, the USD was too early to put in a dcl at the July 18 lows, so this should just be a bounce and then it should continue lower.
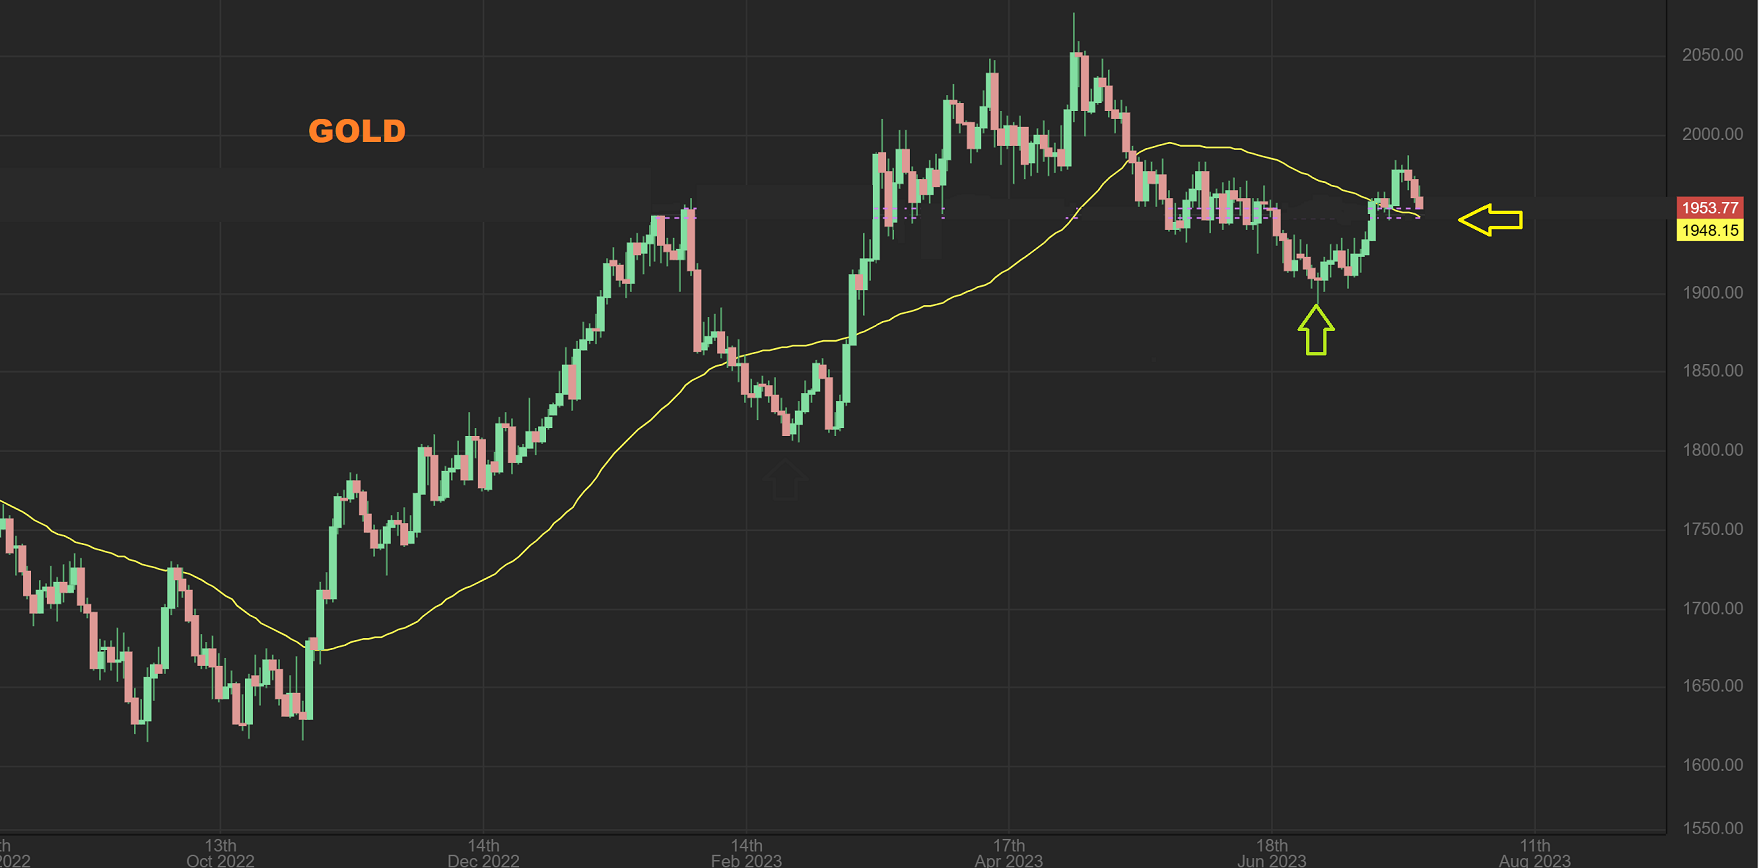
GOLD pulled back to the 50sma area on Spot Gold. Compare the rally from the green arrow to the dip. This is a nice controlled dip so far, a back test of the 50sma area.
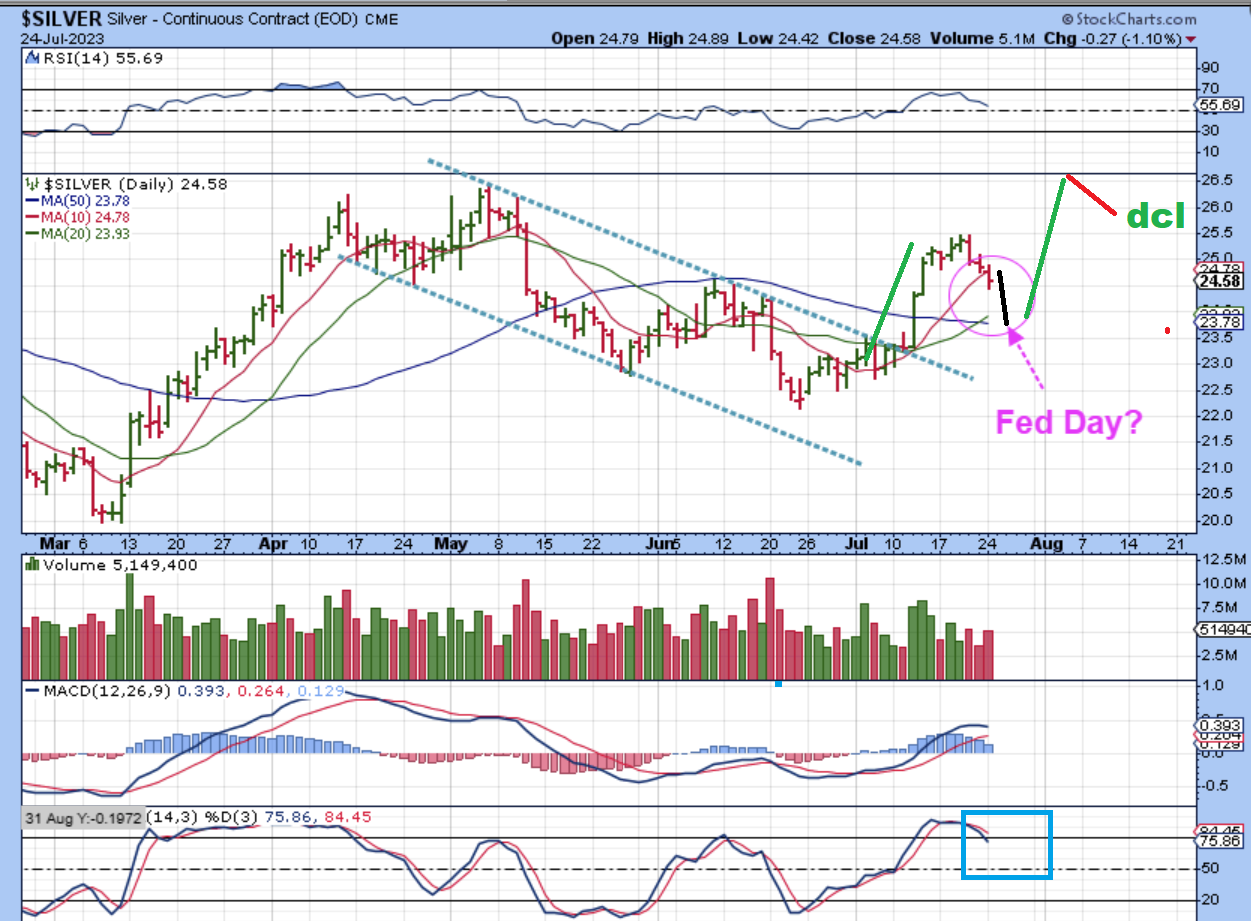
SILVER is different, because it looks like it could pull back further. Silver is on day 20 on this chart, so it still actually has time to rally and put in a higher low too.
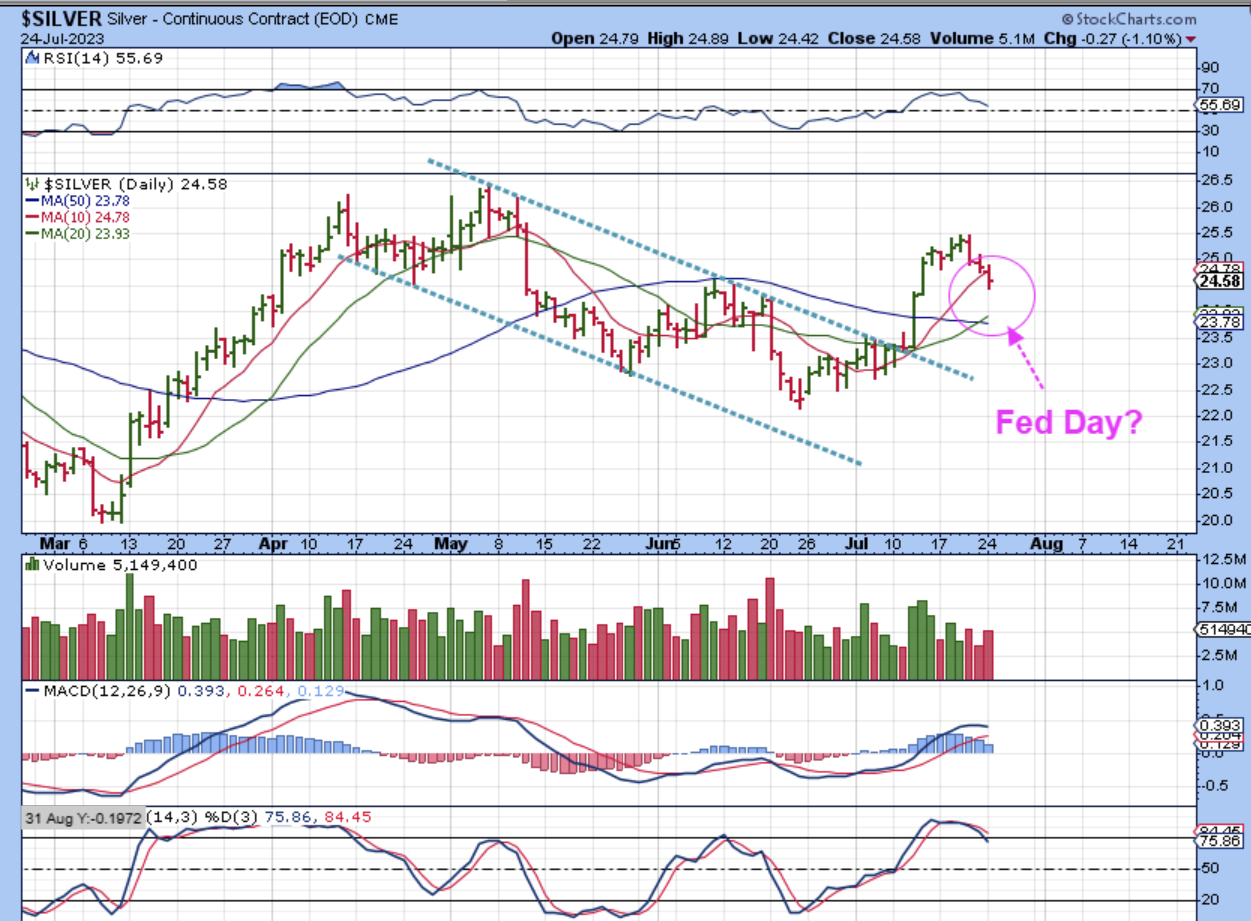
SILVER can rally fast in just 5 days, so with Wed as day 22, it could rally to the highs and dip into a dcl. This is just an idea of how the bullish pullback and cycle timing could play out. Let’s see what happens Wednesday first!
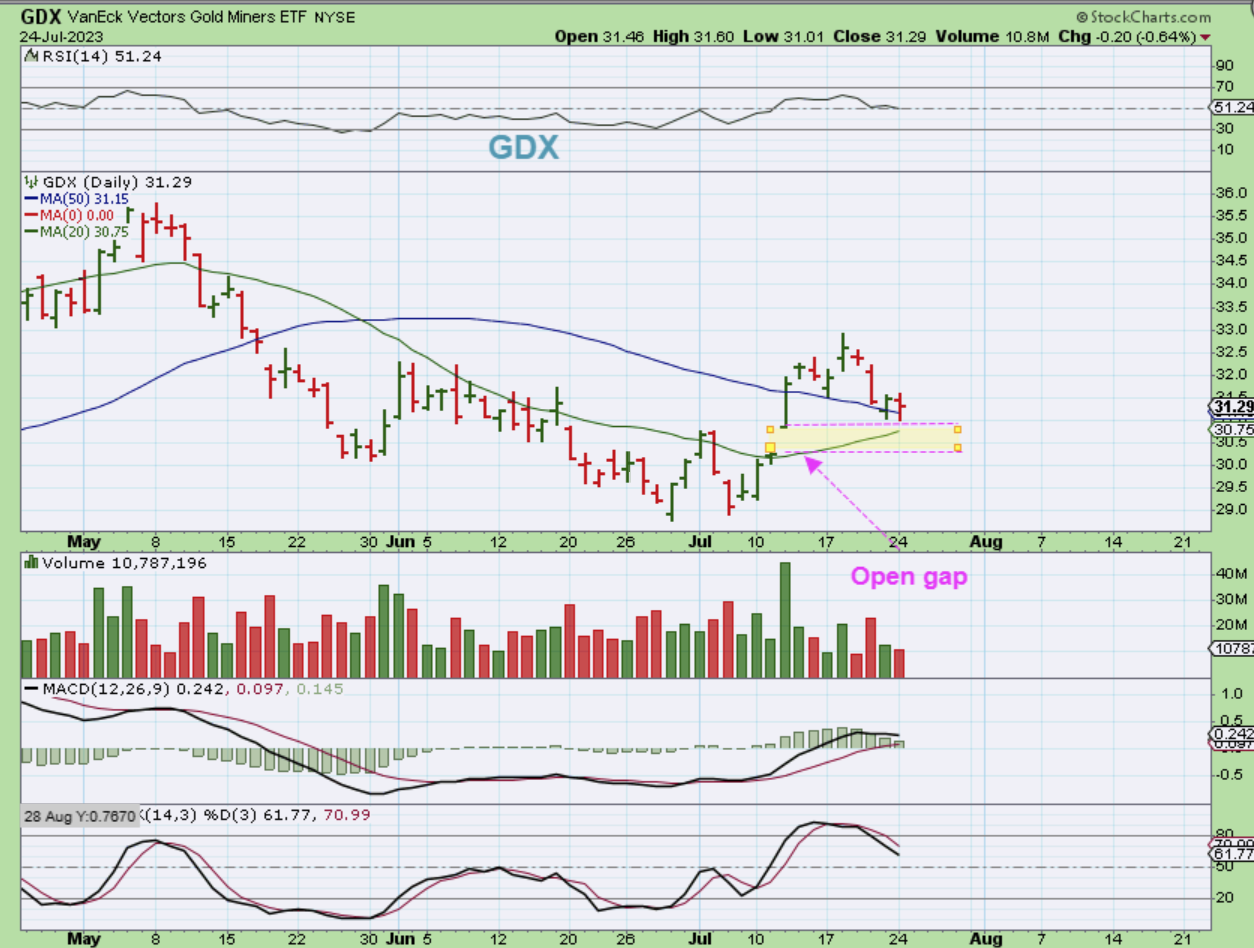
GDX is holding up well at the 50sma so far, and this dip is during a USD rally. The question is, do we fill the gap or not?
.
Take another look at the USD rally out of the lows. This moved 5-7 days higher out of the lows. Now how have the Miners been holding up with this USD rally? Are they able to hold up, or are they falling apart like Miners often do?…
I wanted to point out that several of the Miners during the USD rally have done exceptionally well (so far).
.
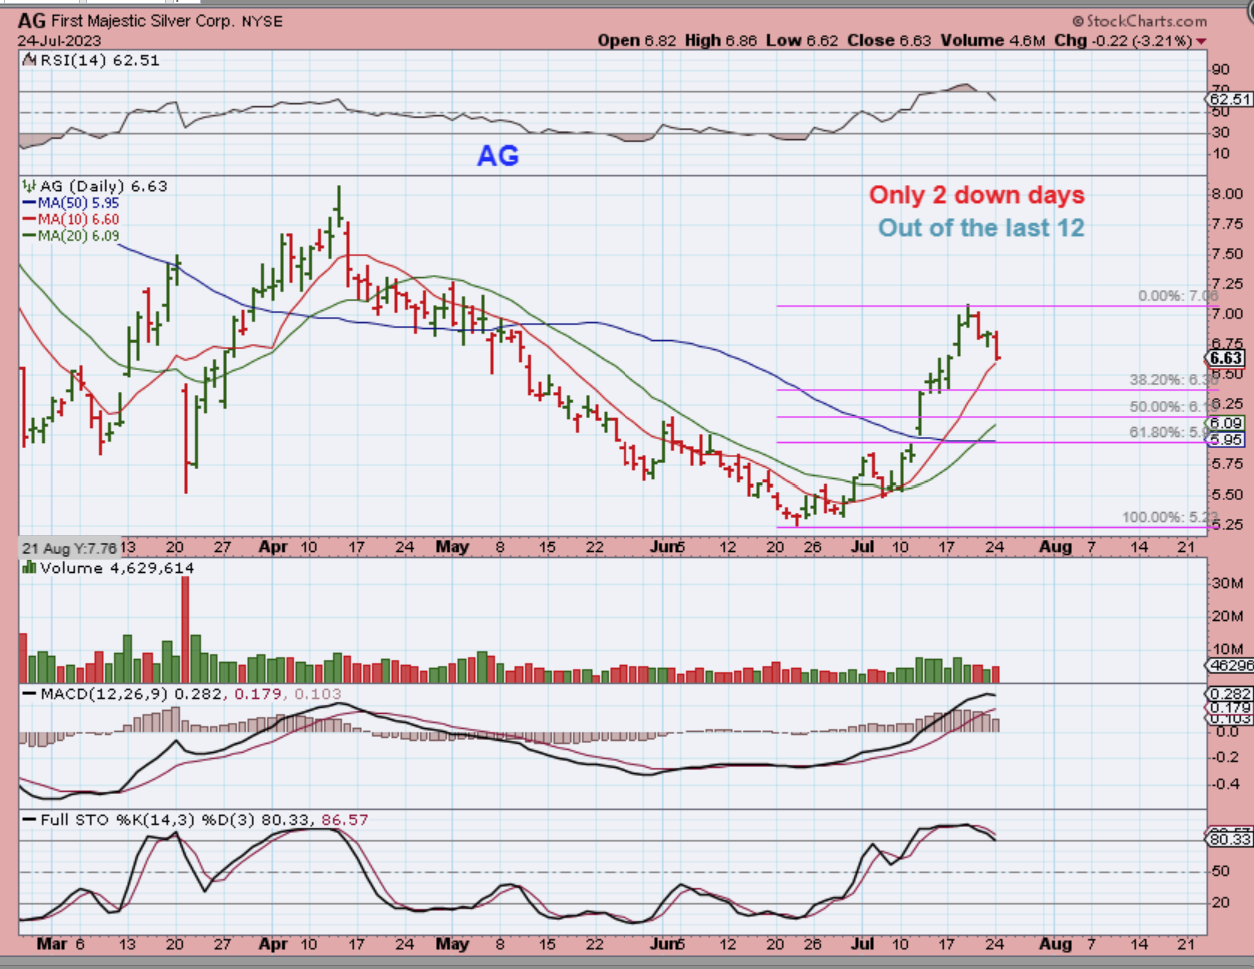
AG has only had 2 real down days. It is at the 10sma, and holding up exceptionally well.
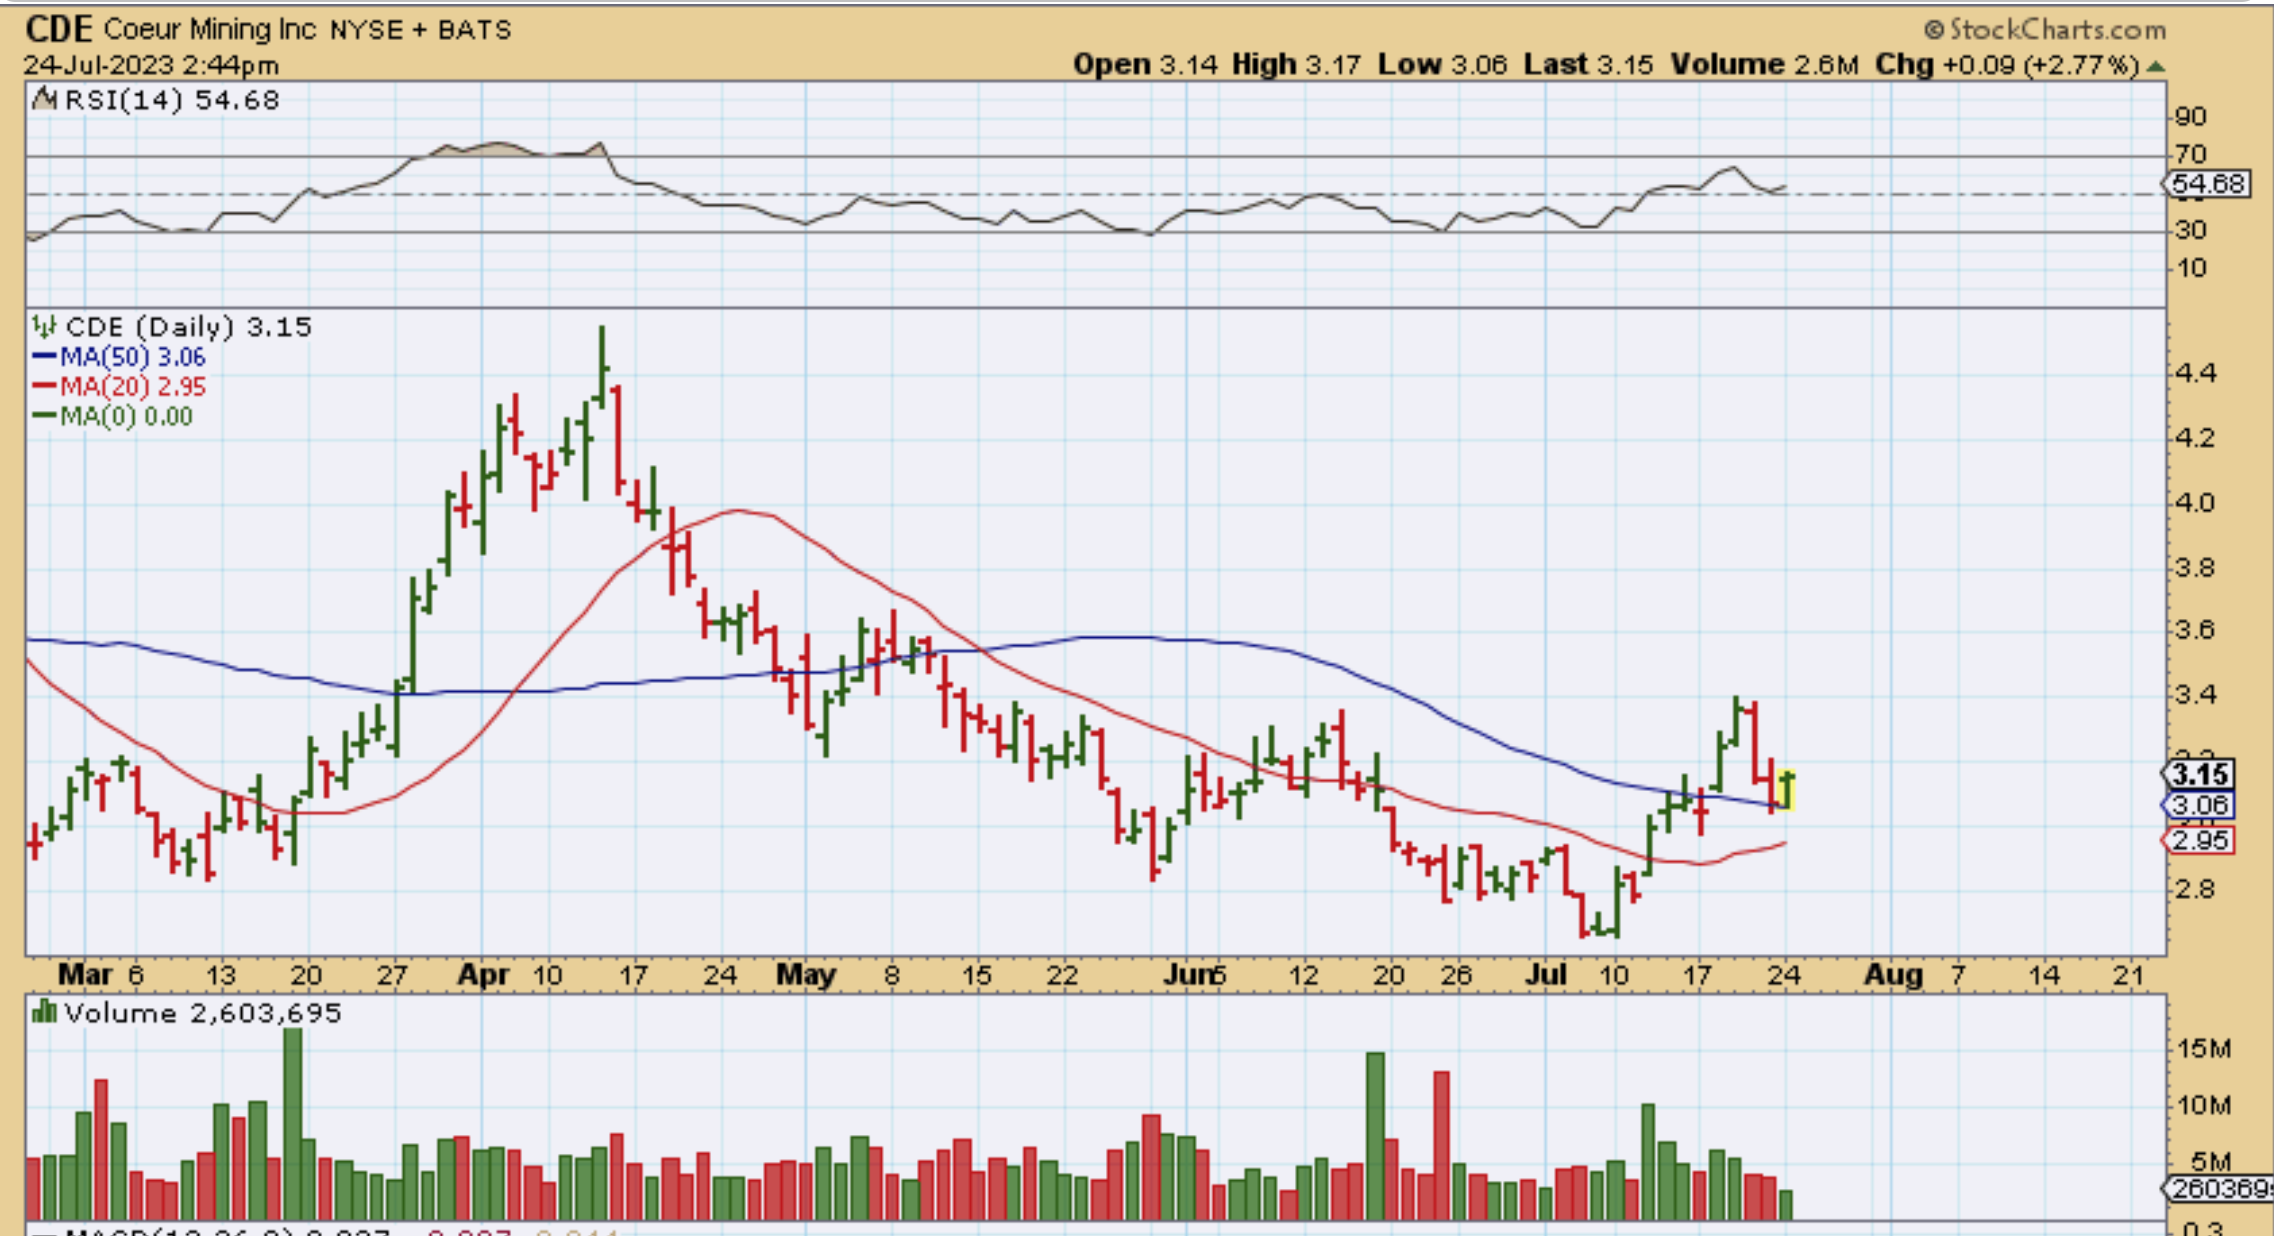
CDE dropped for 2 days and then bounced to green on Monday! That was as the USD ran 5-7 days higher out of the lows.
.
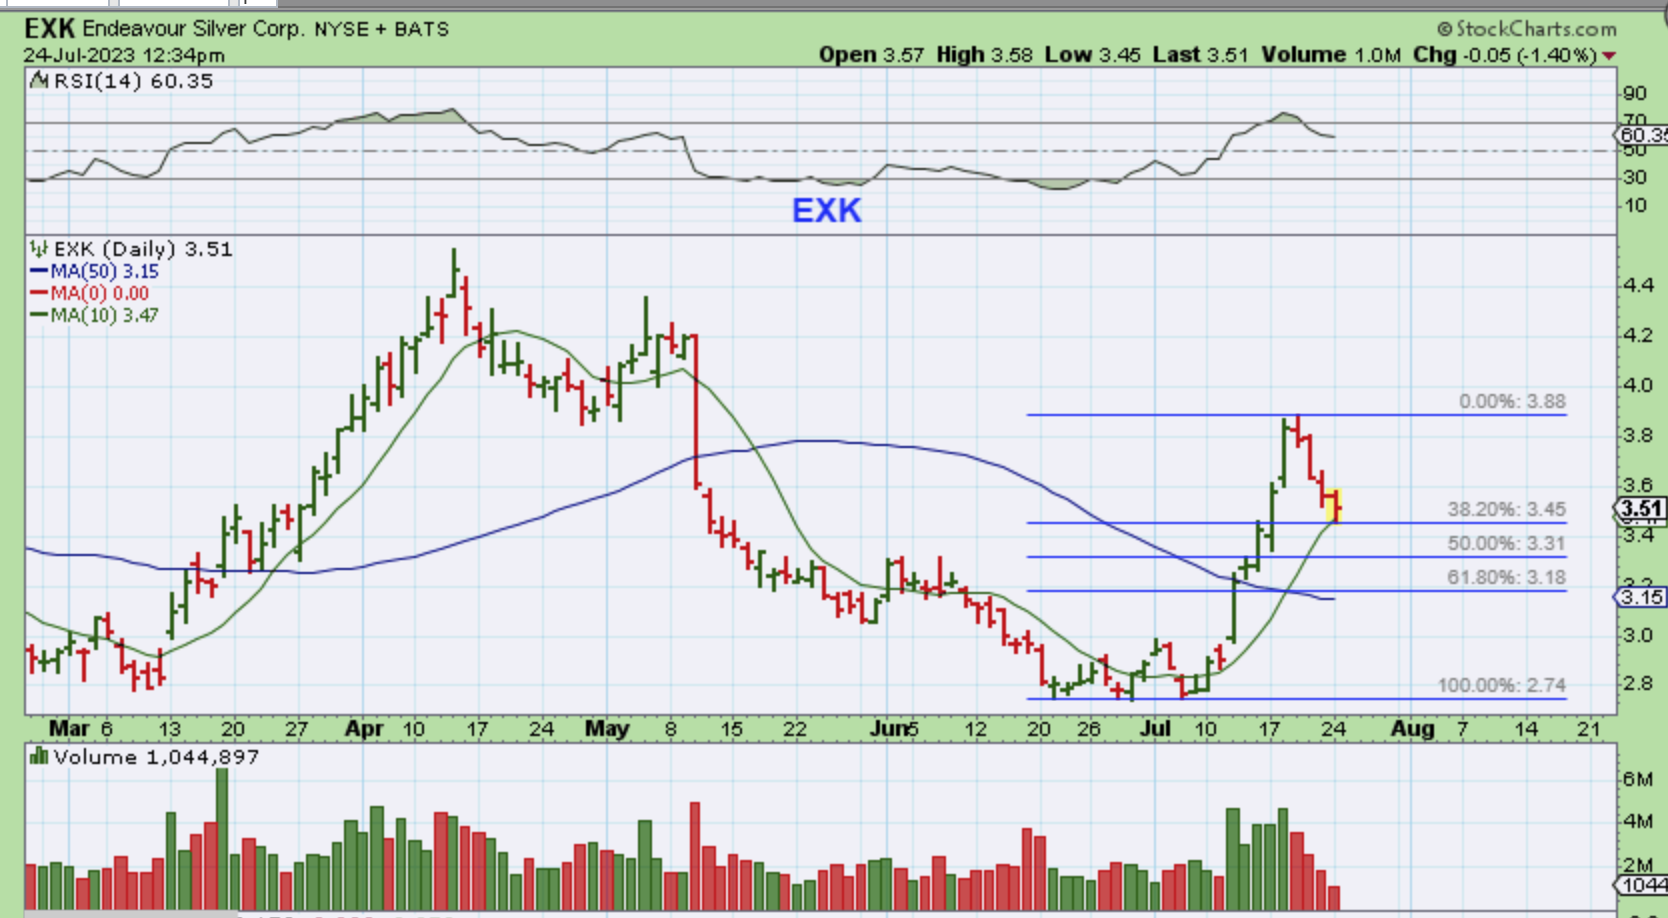
EXK has had more of a steady dip lower, but this is still very bullish. EXK ran straight up out of the lows and now it has landed on the 10sma and 38.2% Fib level. It CAN fall lower, but these are showing strength.
.
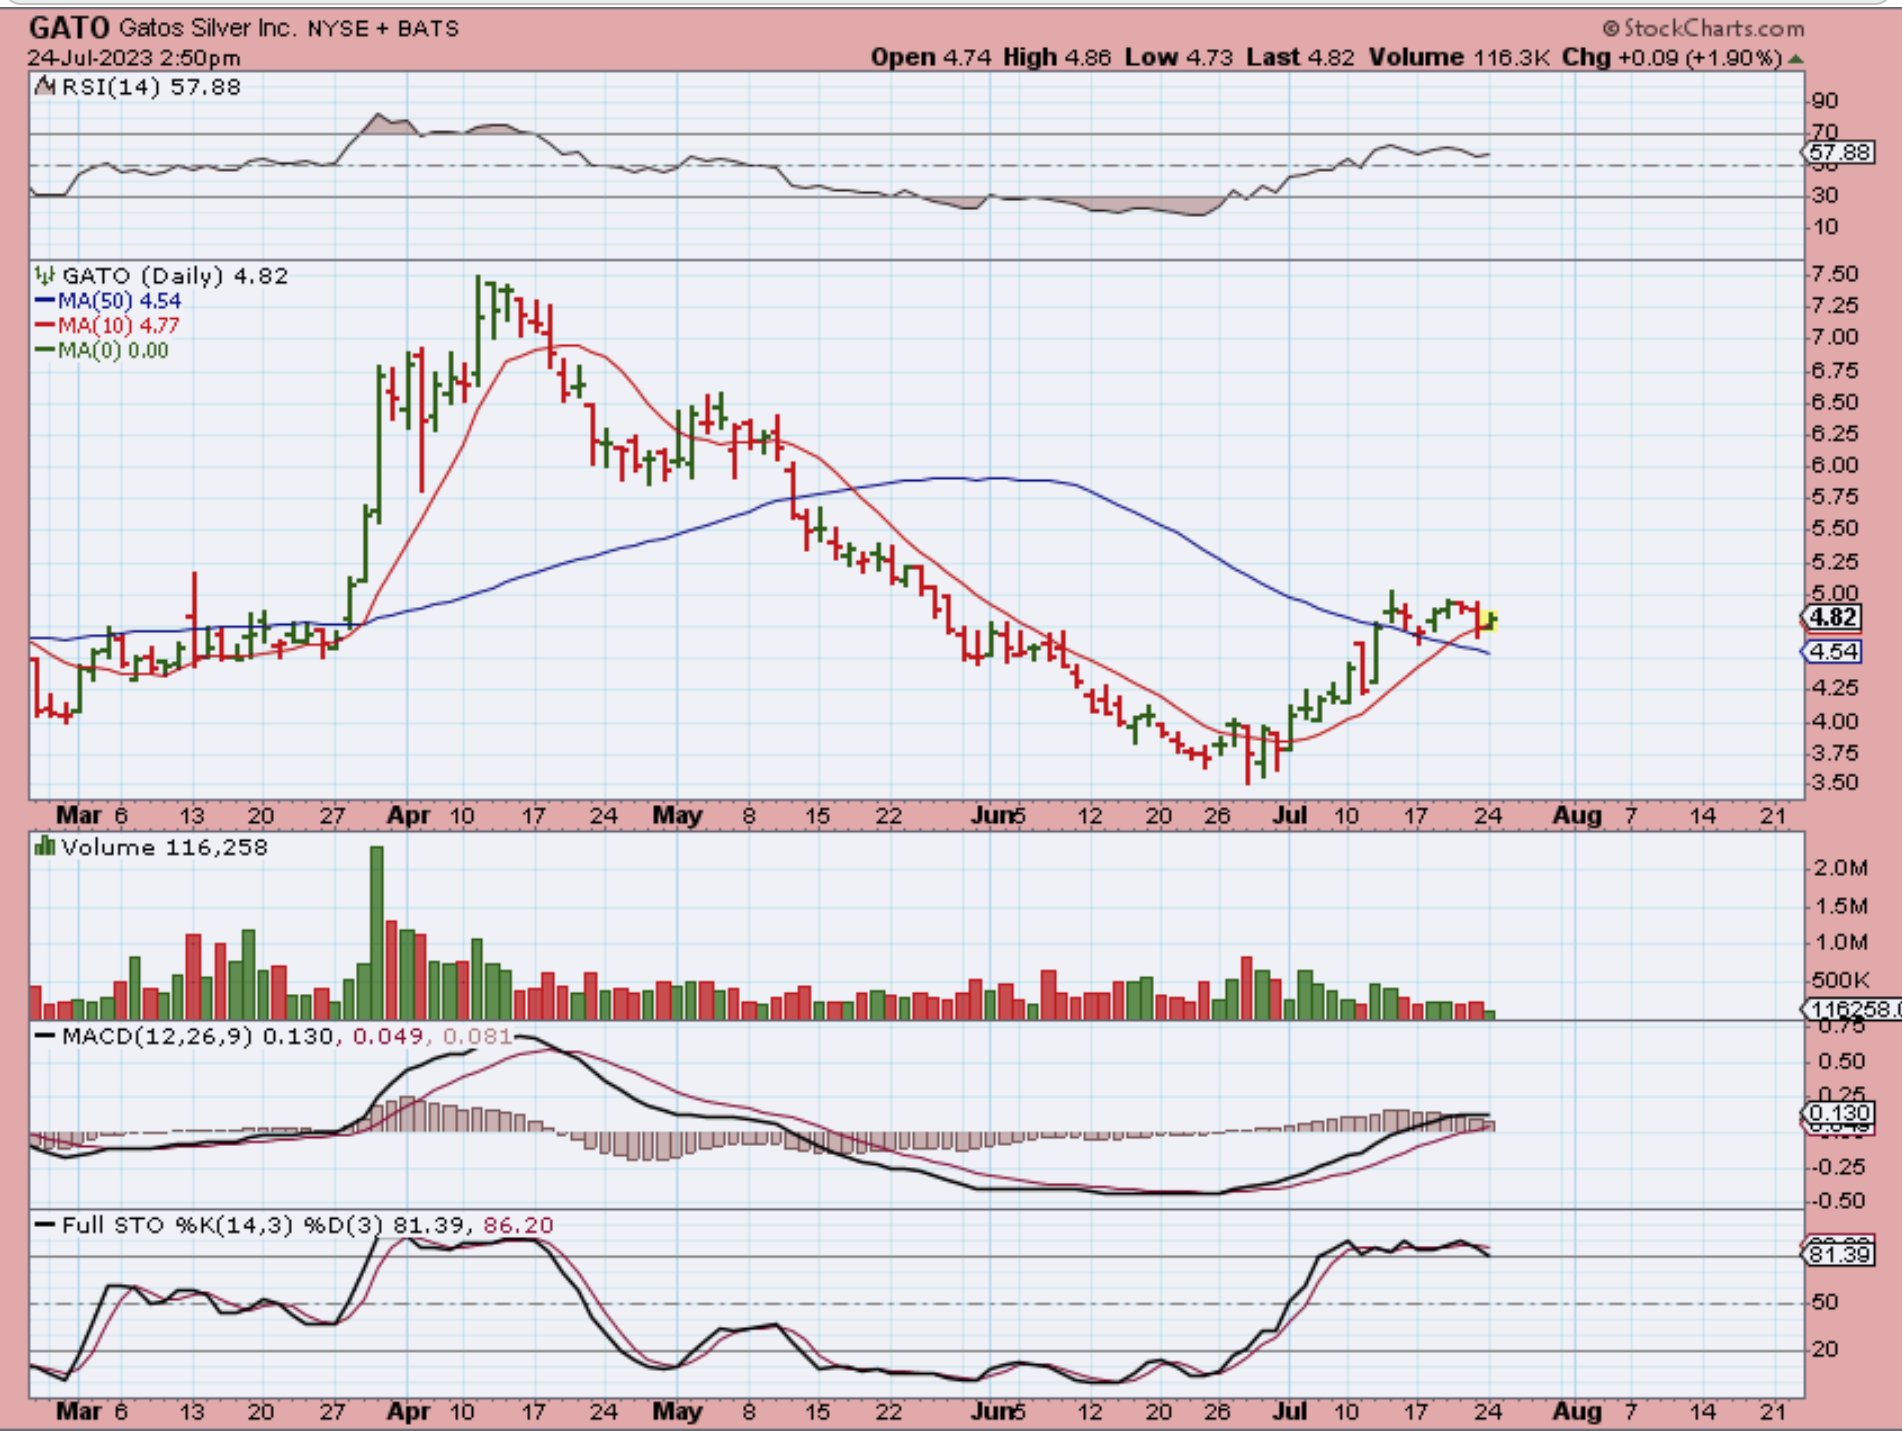
GATO is pretty much just chopping sideways. In fact, with that 5 day rally in the USD, GATO is still pennies from the recent July highs. Yes, there is a possibility that GATO drops to the 50sma on Fed Wednesday, but it is also possible that the above Miners ( AG, EXK, CDE, and others) could just start chopping sideways above the 50sma like this also. GATO is near the July highs with Gold and Silver dropping.
.
So today is the Tuesday before the Fed Meeting, enjoy your Tuesday trading! 🙂
.
~ALEX
.
BITCOIN : I wrote this in the comments…
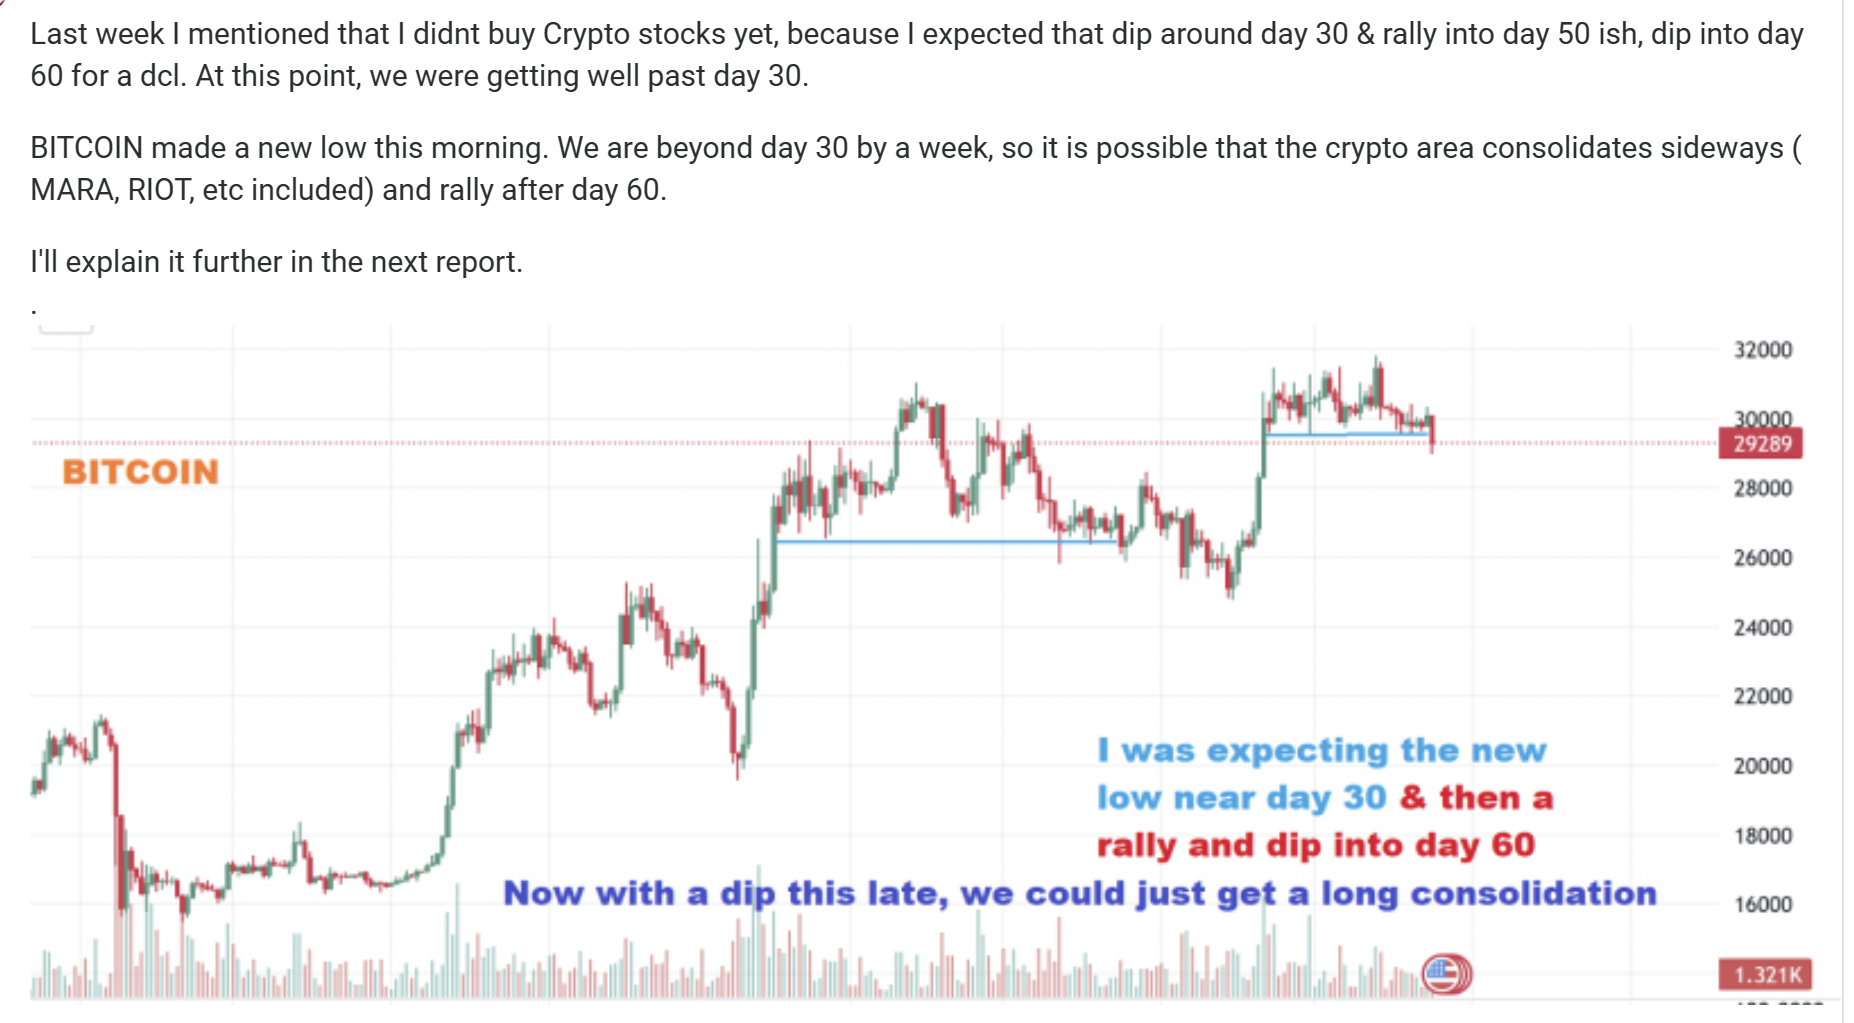
BITCOIN – Here I have just drawn a similar downward sloping correction or consolidation as the one we recently had. If we were to spend the entire 6o days drifting lower like this, it would allow the Crypto stocks time to lose their overheated / overbought conditions. This would actually need to bottom a bit before day 60 to become R.T. if it happens.
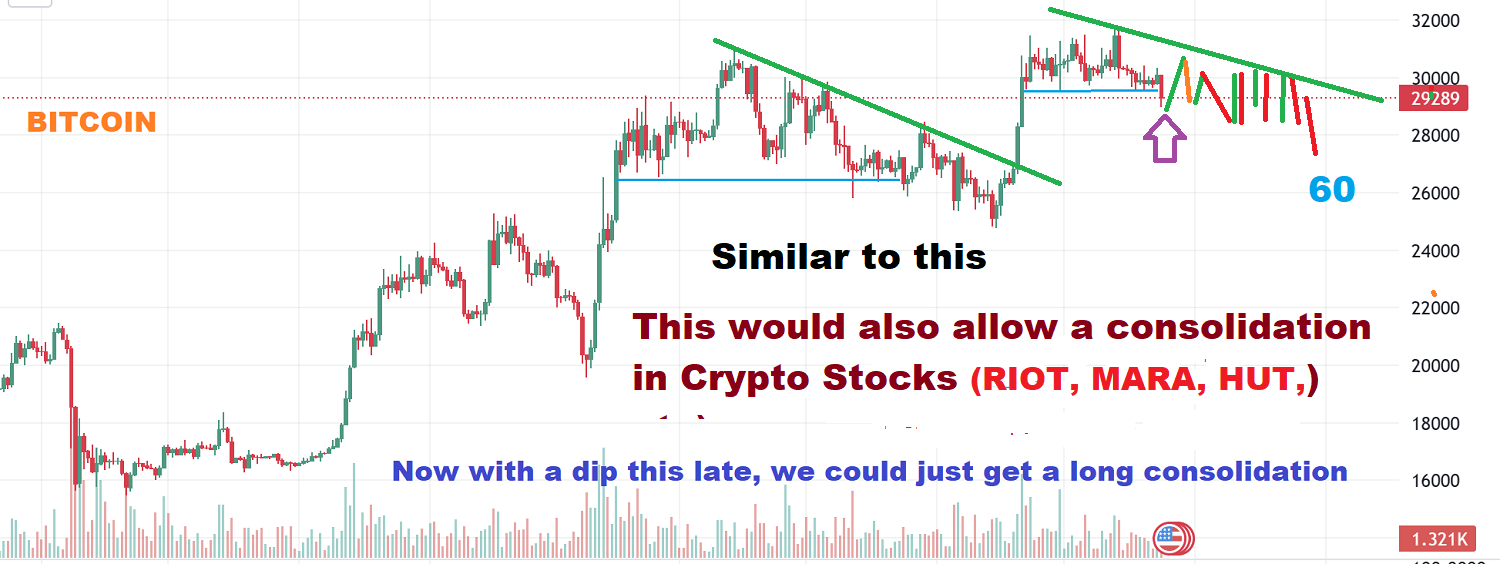
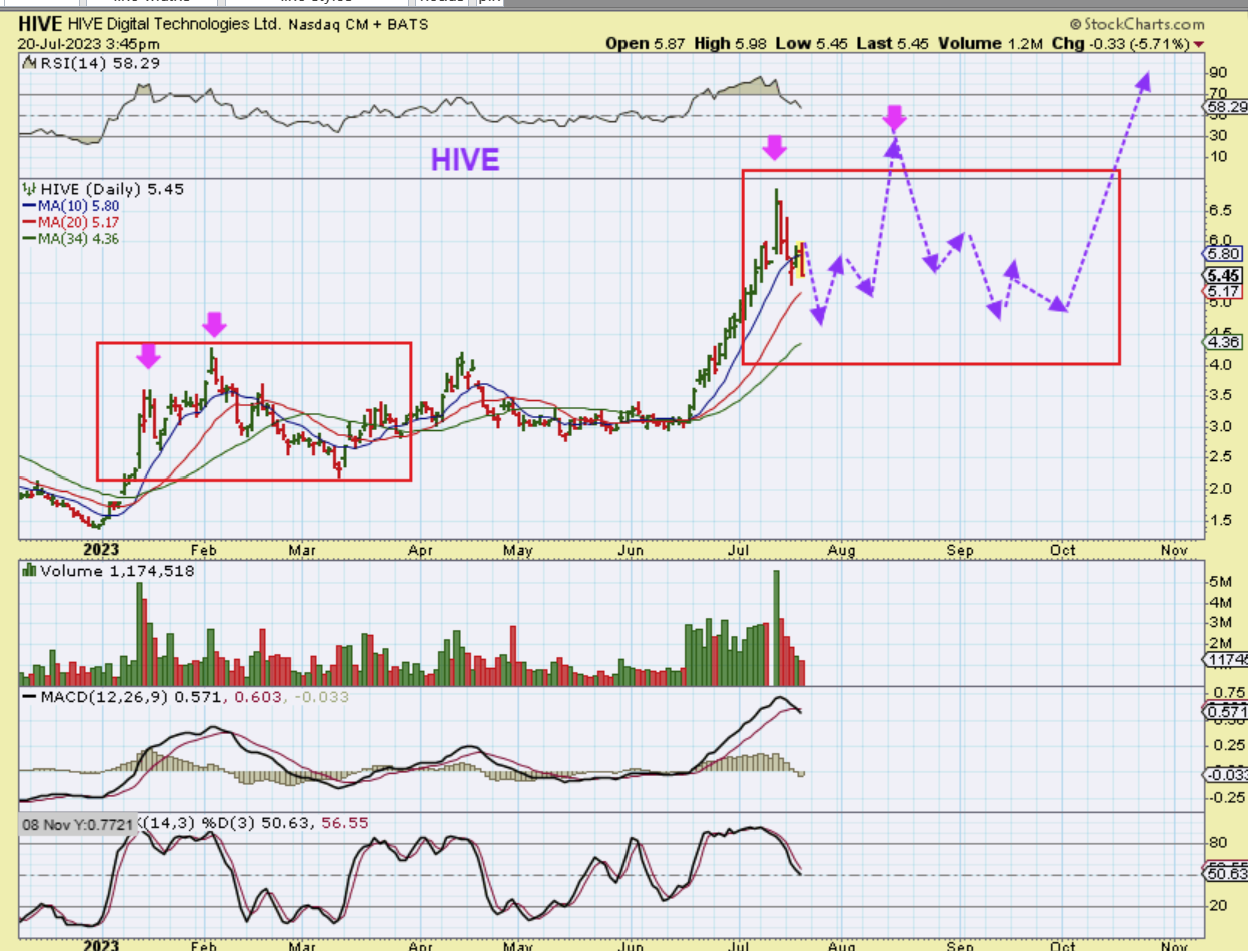
The above thinking matches what I was pointing out recently with this HIVE chart. If Bitcoin chops and chops again, we could see these consolidate and prepare for the next launch higher, like they did in early 2023. This is still very bullish price action and I definitely think that Bitcoin has years of bullishness ahead.
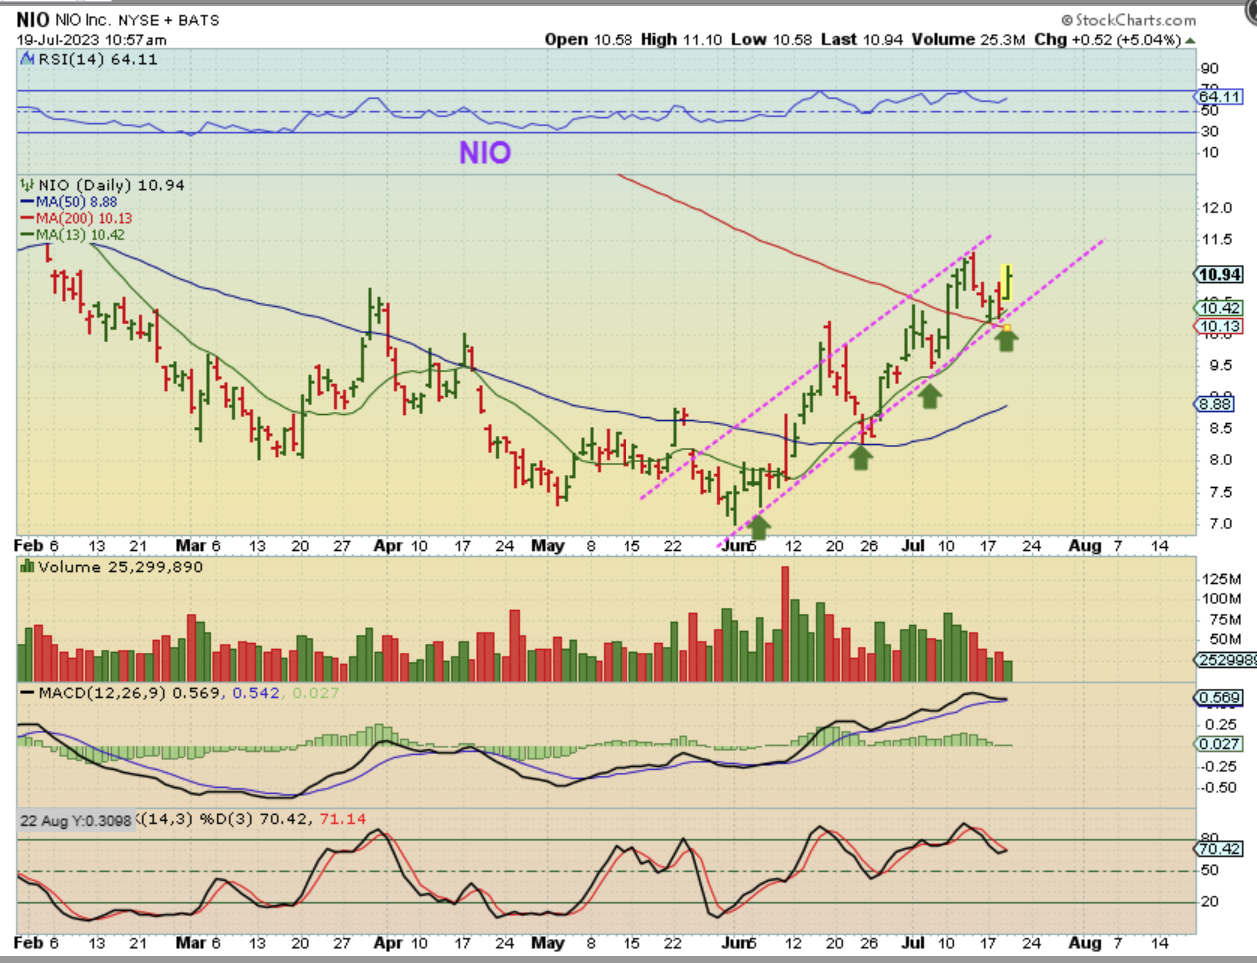
We’ve been viewing NIO as bullish and as a buy. It broke the downtrend in June and back tested the 50sma. We have seen JOBY, TSLA, XPEV, HYZN, AYRO, and NKLA take off & run higher too. NIO then began to form a channel higher and I posted this chart for July 19 as it back tested the 200sma.
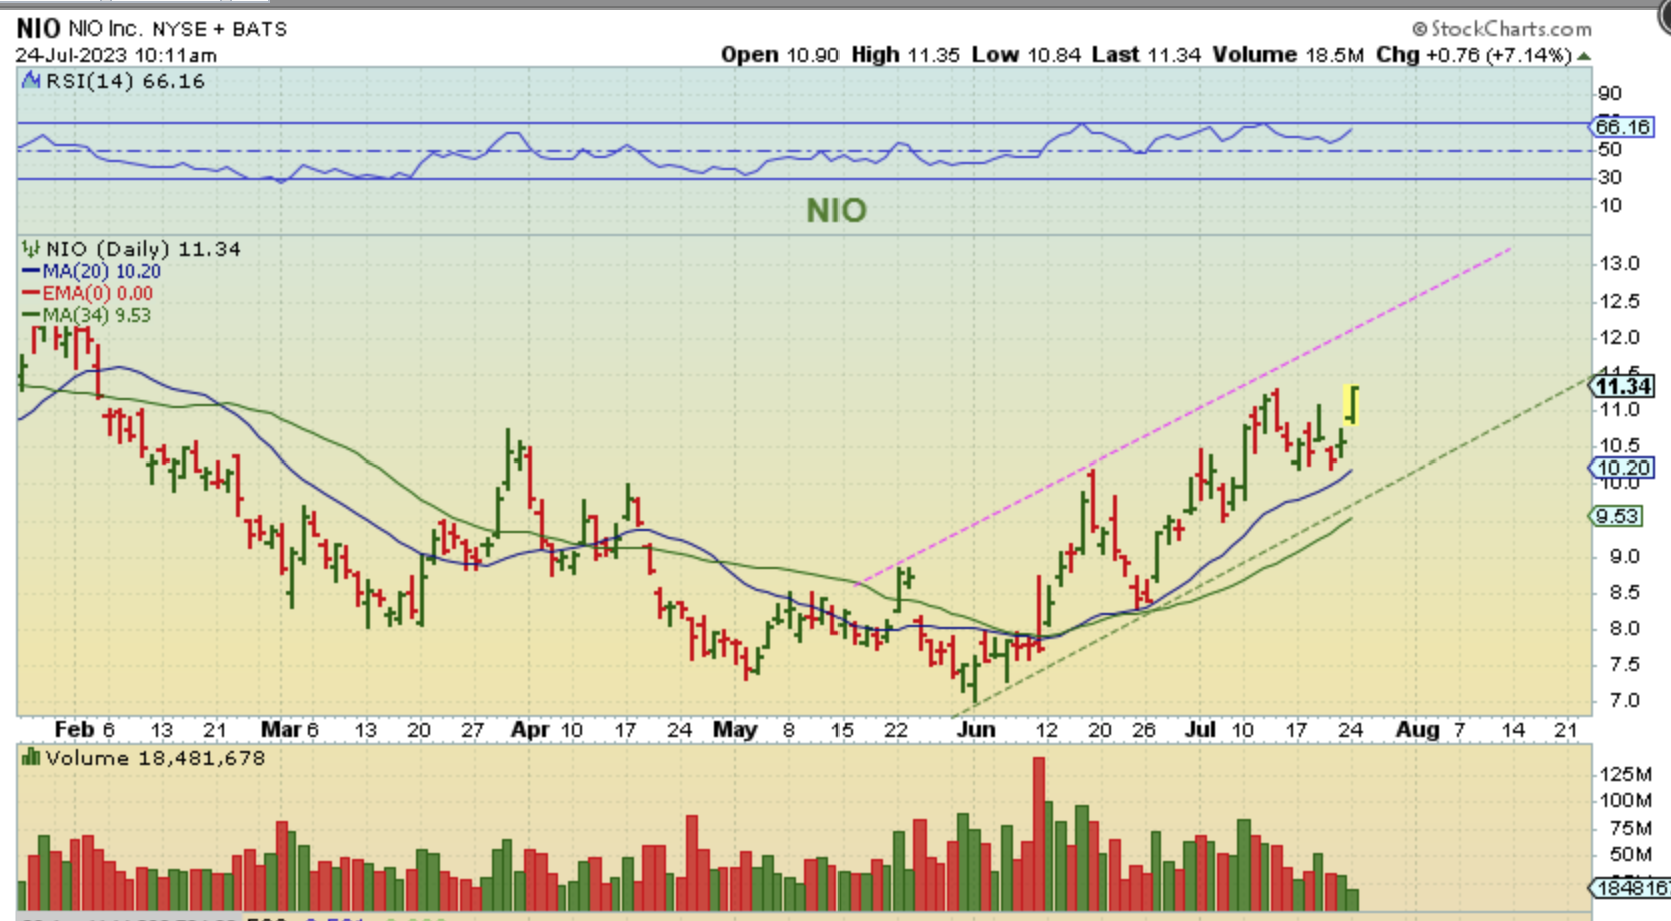
NIO popped yesterday at the open and I grabbed this chart after a 1/2 hr of trading. Nio looked to be ready to stretch out further and…
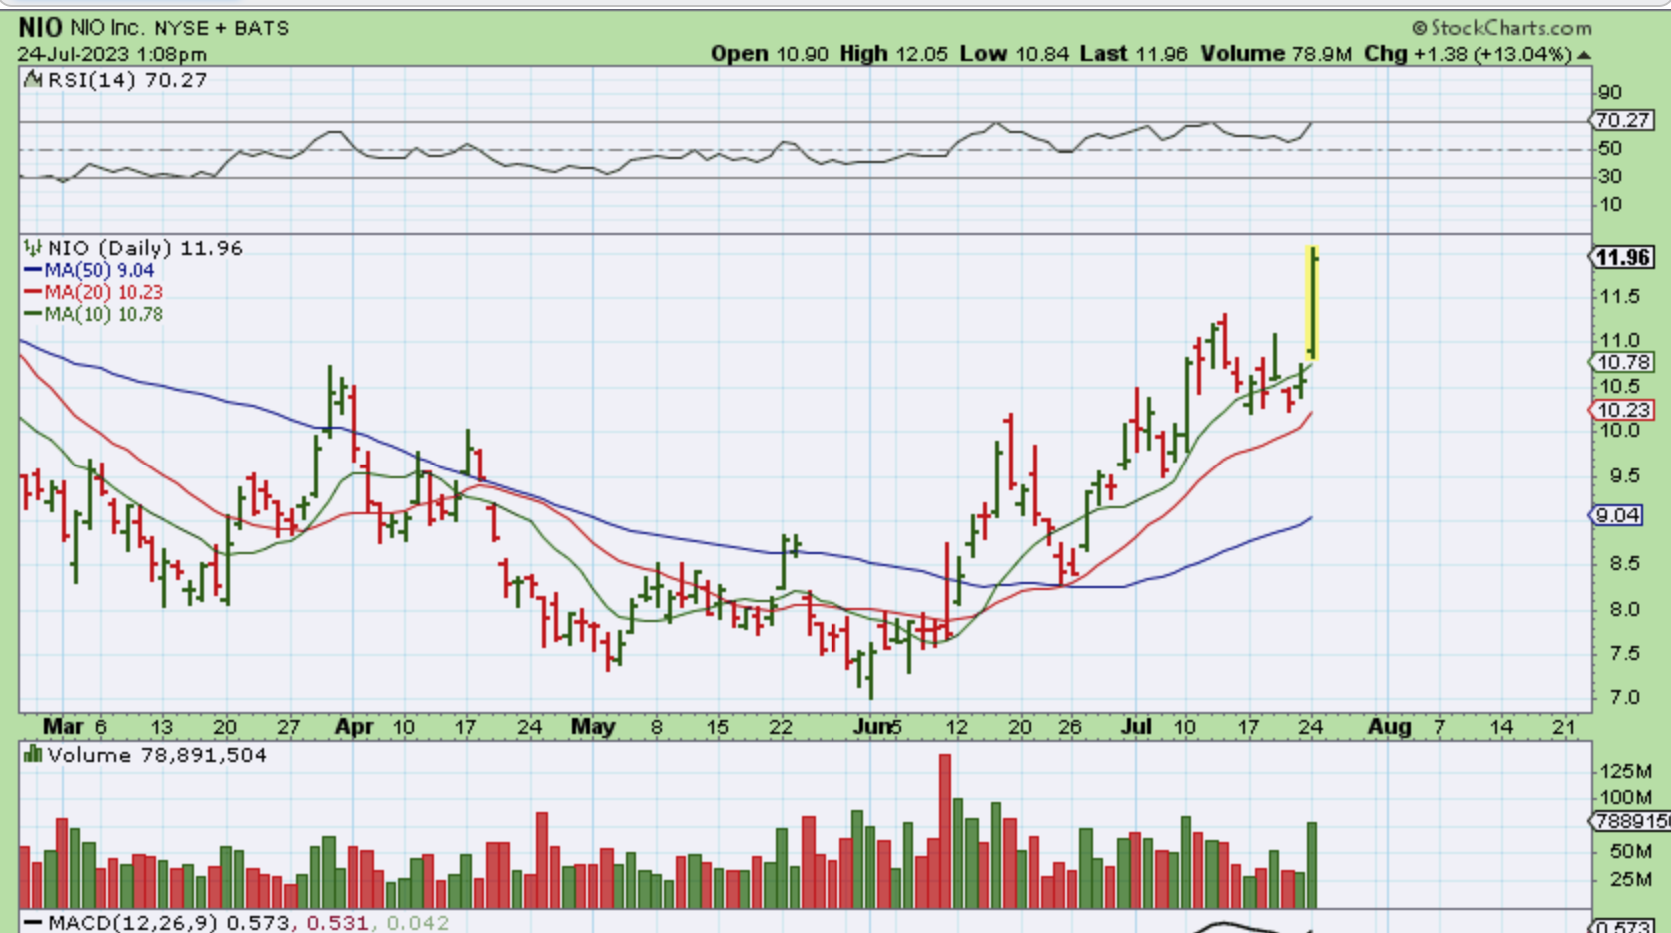
By midday NIO was now up 13% with strong volume for just 1/2 a day, so this sector continues to move higher. I will say that it has been a choppy move for many of these and that makes it a little tough to hold unless you buy at a low spot near support.
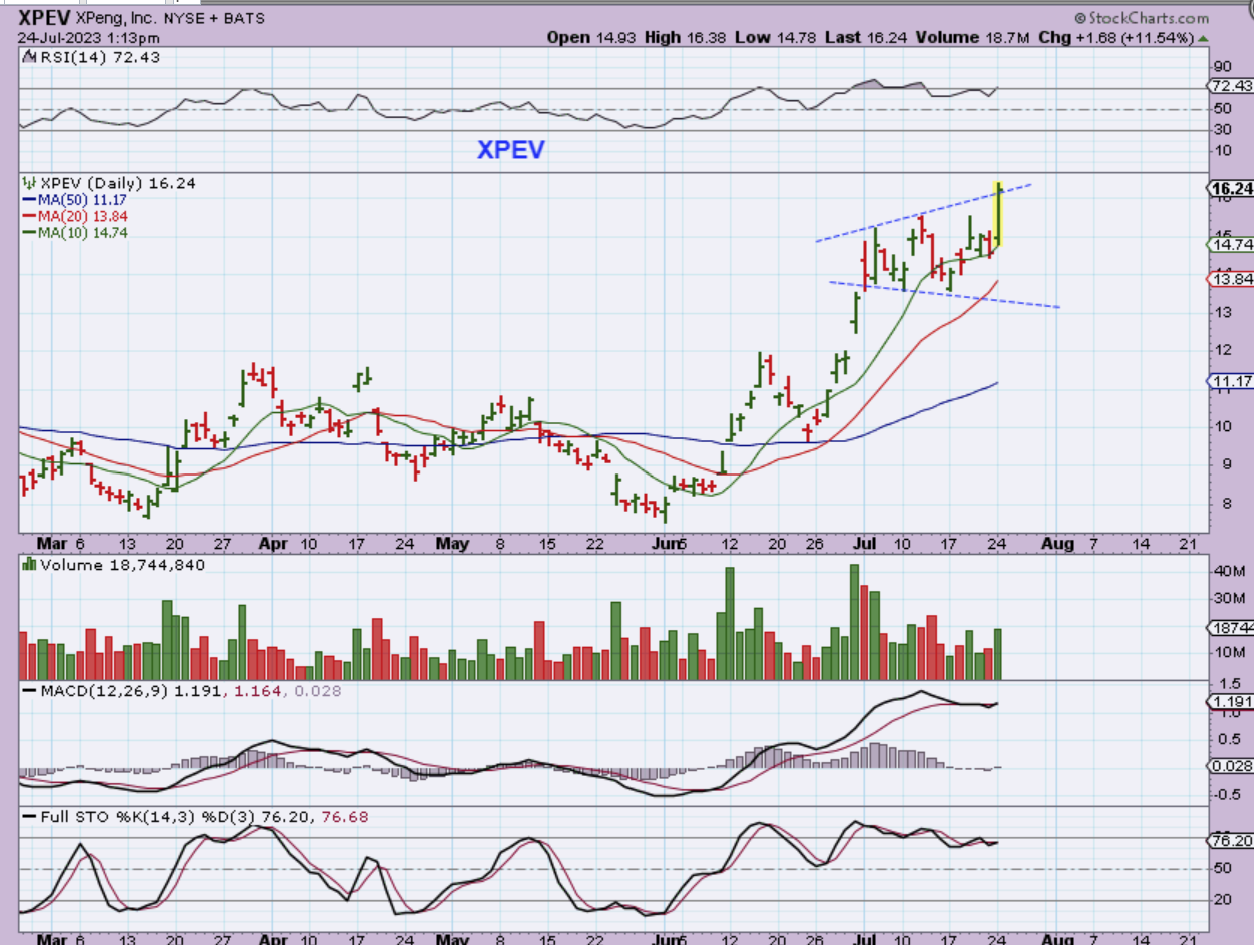
Speaking of choppy, XPEV started to chop sideways and this became a little hard to hold too, but as of this 12% Burst higher yesterday, it is also at new recent highs. This is now a rather quick 100% move off of the June lows. Under $8 to over $16.
TSLA $150 to $300, so this also ran 100%. Recently I discussed that sharp TSLA drop. This was yesterdays bounce and I am watching to see if it can recover or not. It Closed in this area too, at $269.03

I posted this in the comments yesterday, because as I ran through my charts, I noticed that many of the ‘Metals’ stocks are setting up bullishly now too. If we do get a General Market pullback that lasts for weeks, We may see Commodities like Oil, Metals, Precious Metals, and Uranium benefit.