July 15th Weekend Review
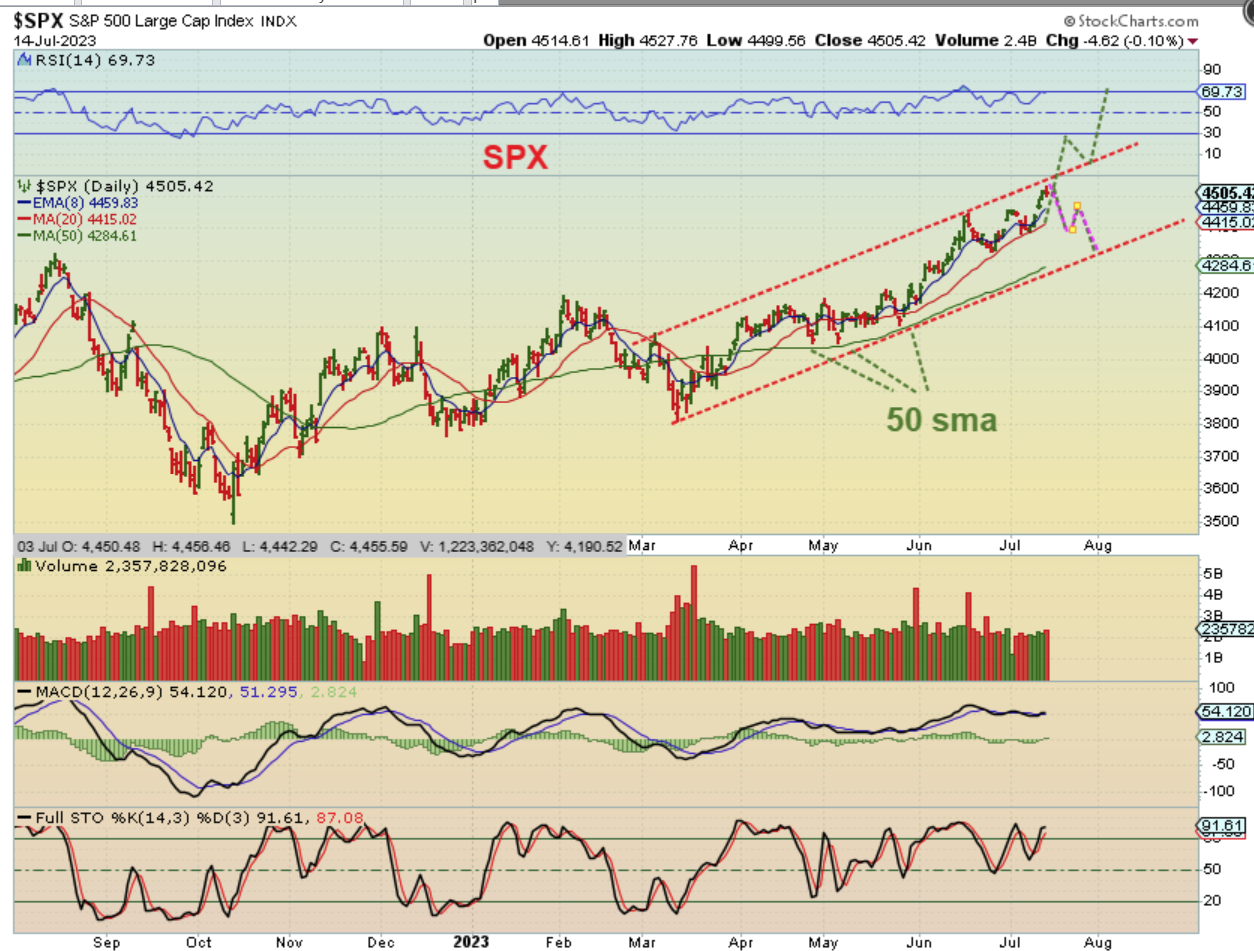
SPX– We had a reversal candle on Friday, but my blue arrows do show that these do not always play out. I have been saying that we should expect a pullback that could lead to an eventual drop into an ICL over time. Let me explain with the big picture view…
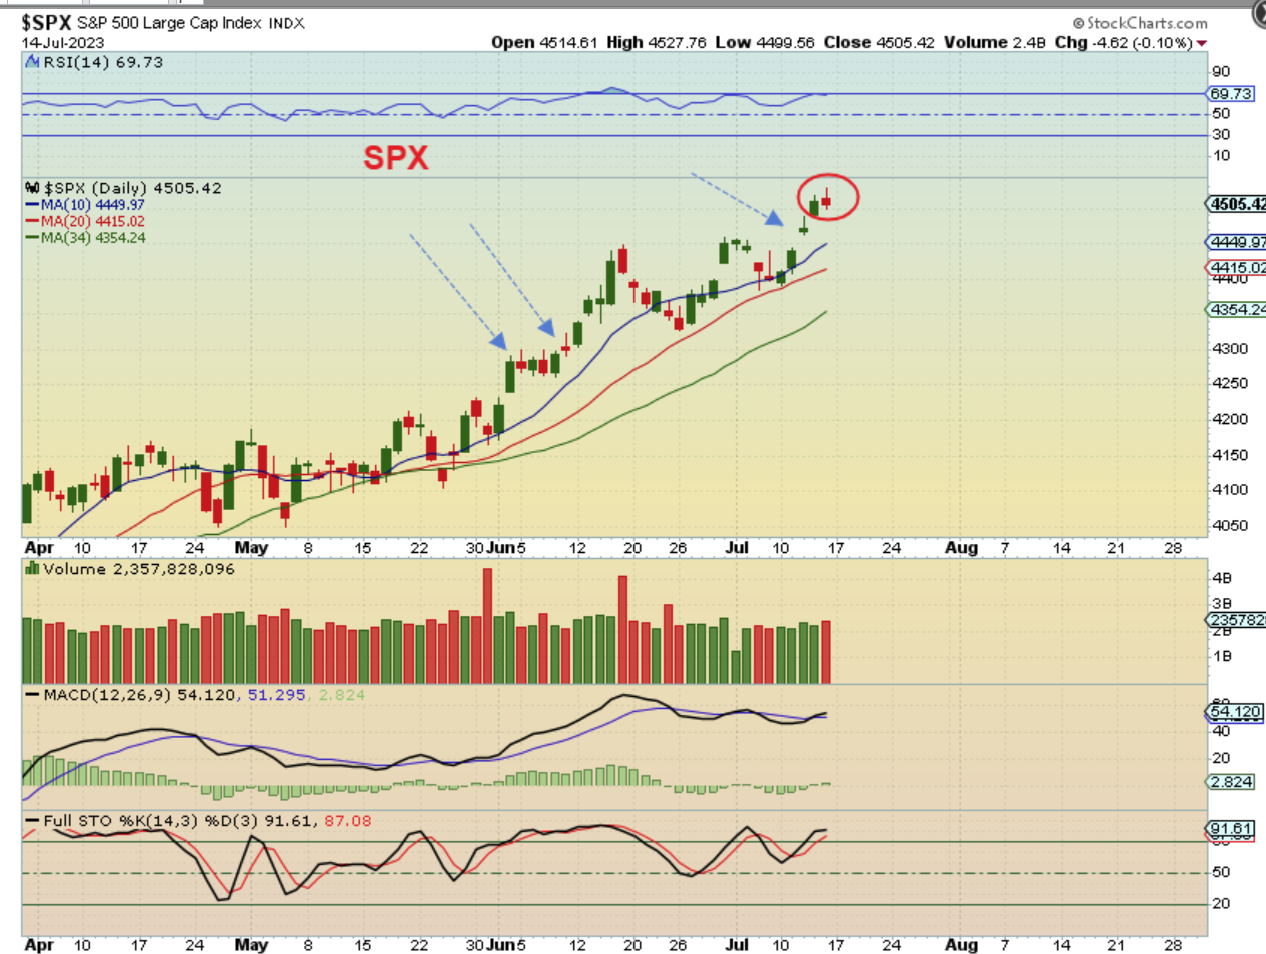
With The SPX, we often see an ICL to ICL in the timeframe of 6 months, and we are now 4 months out from the March ICL. We could see 4 months up to this resistance and then 2 months lower. So we see a channel that can be drawn with SPX currently at the upper trend line as resistance. These markets have been very strong and buyers do keep stepping in, so will this break out (?), or pull back? At this point it really could go either way, as shown.
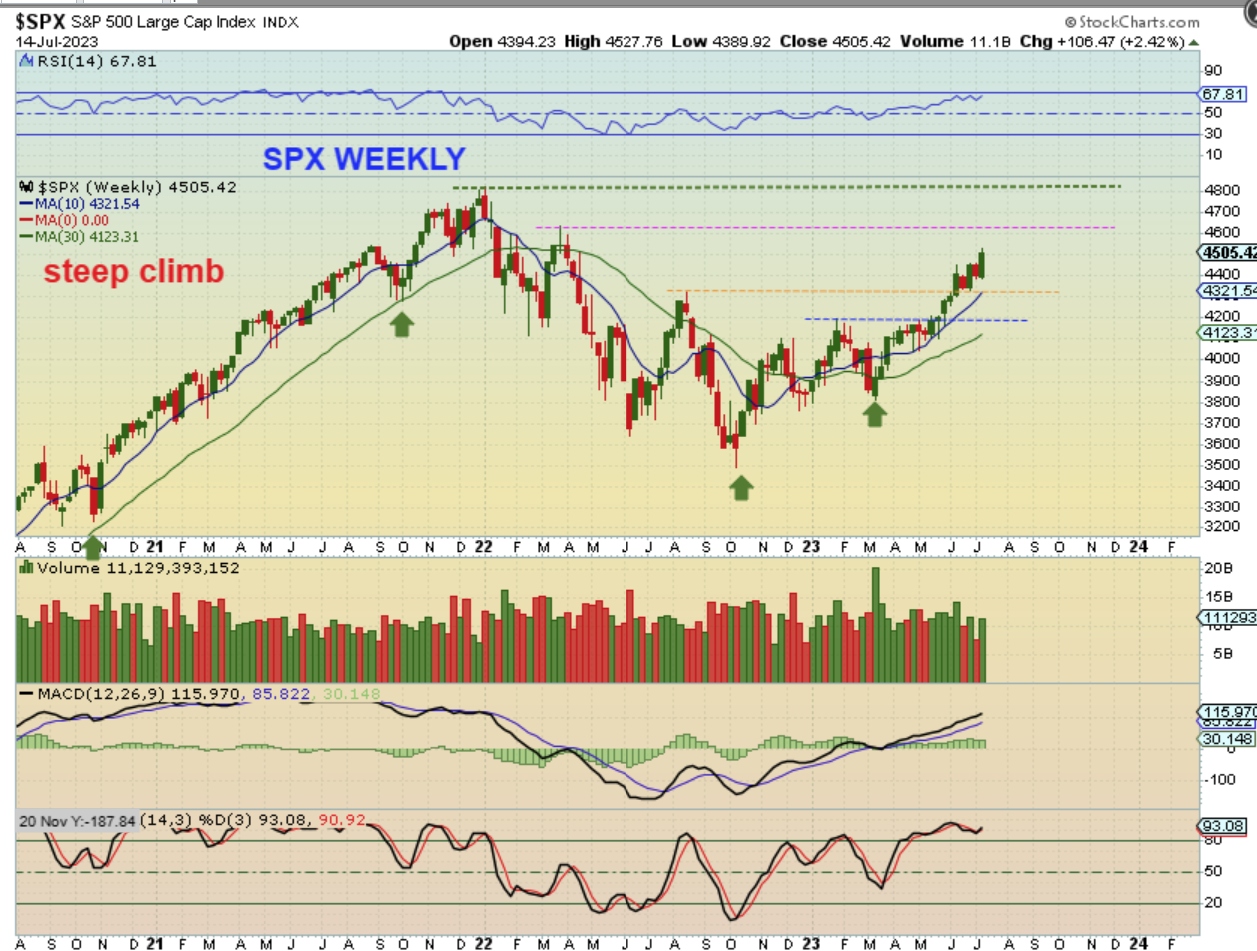
SPX WEEKLY- Take a look at just the last 5 weeks. We saw a Big week up, a fairly big drop. A Big week up, and another fairly big drop, and last week a Big week up. There is no follow through selling so far. The next upside target area would be about $4600+.
After putting in a very choppy base, You can see the strength in THE NASDAQ, as it broke free and has been pushing higher almost straight up. That being said, even with a straight up rally in 2020, we eventually saw pull backs to the green 30 week ma, so we can still get a pullback of some sort here, despite the strength.
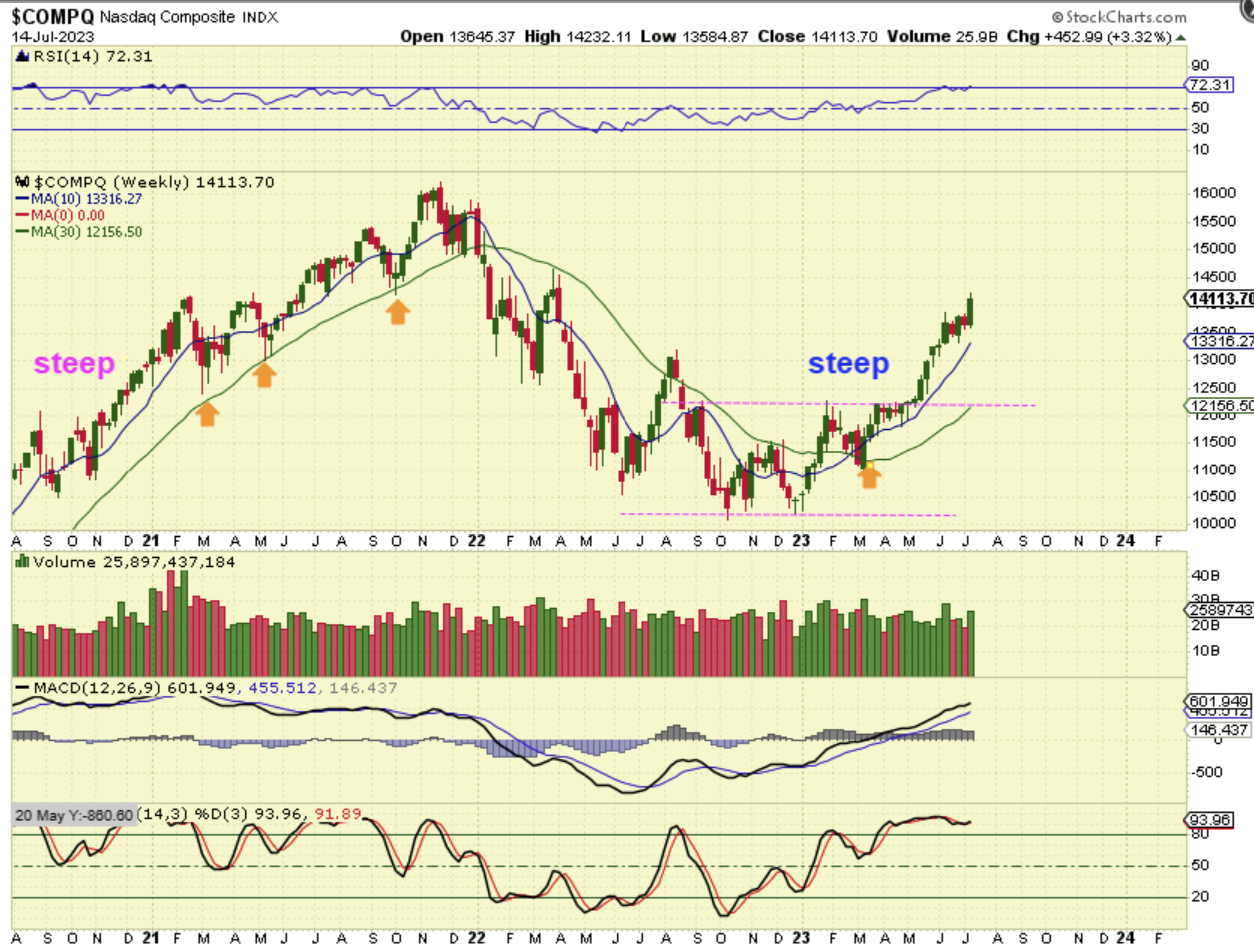
NASDAQ – The 2 blue arrows show that even with strong straight up rallies, we saw selling come in with a drop into an ICL around 6 months apart. It looks like March 2020, September 2020, March 2021 during that steep rally, so even though we have a steep run now, we can still get an ICL drop starting at any time.
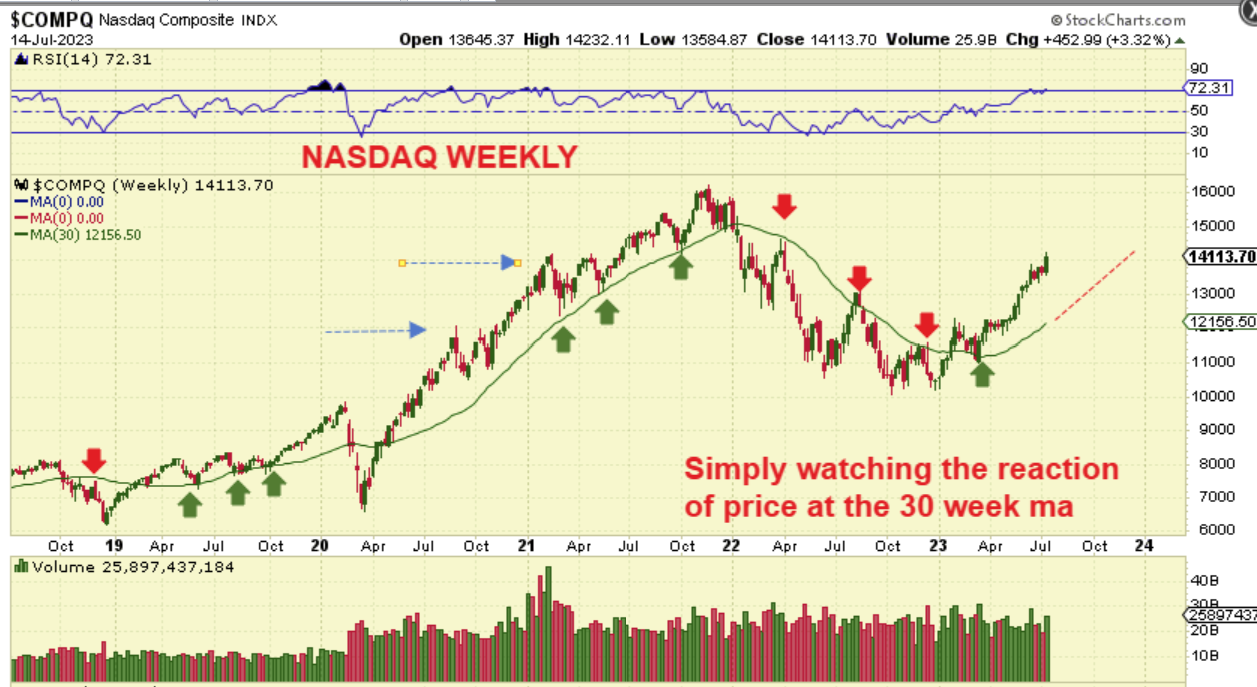
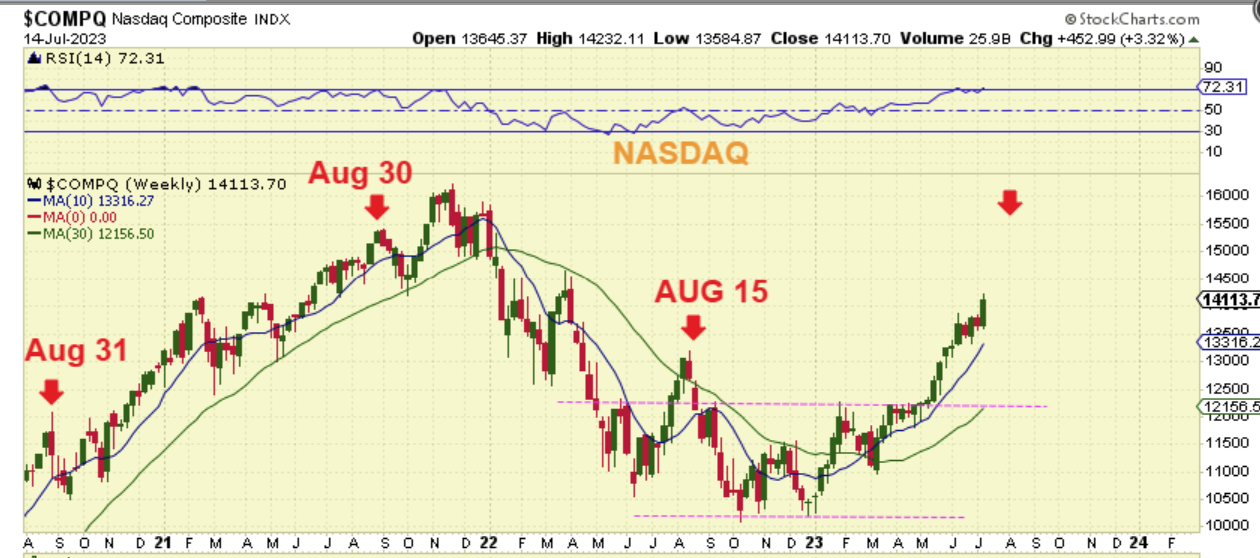
NASDAQ -It is also quite interesting when you look at ‘peaks’ before a drop into an ICL. Many times the peak came in August for the General Markets. If that happened now, that would give us 2 weeks to 6 more weeks.
.
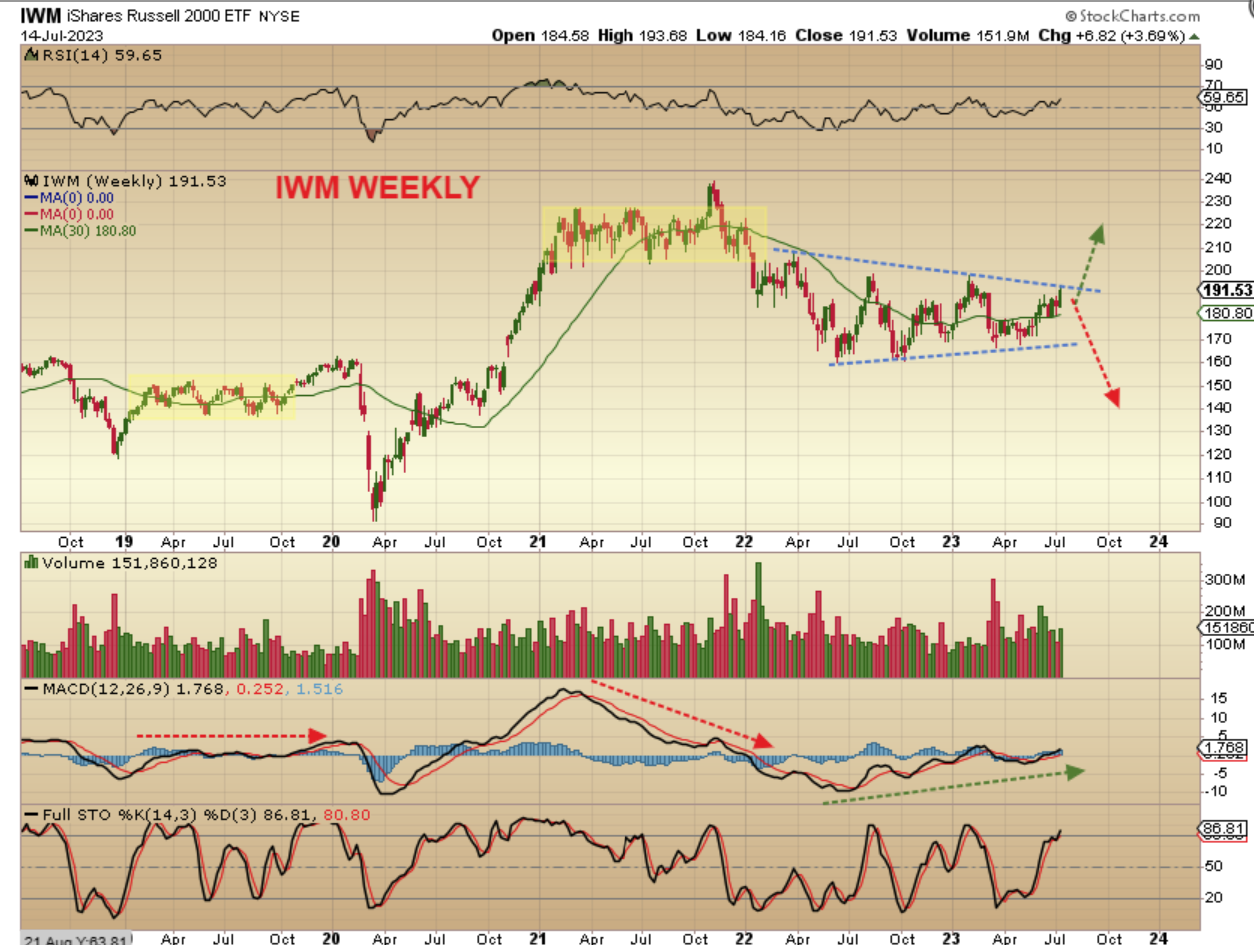
IWM WEEKLY– As mentioned, the IWM was not rallying with the NASDAQ & SPX, but it did start to push higher recently. It is inside of a triangular consolidation, so the question here is, will it top out soon(?) or will it break out and run? Many of the EV and Clean Energy stocks do look bullish.
WTIC JULY 7th – Over a week ago I said that I expected Oil to run to the 200sma, likely find resistance, and drop back to form a dcl. It may then run up and break out. Since then…
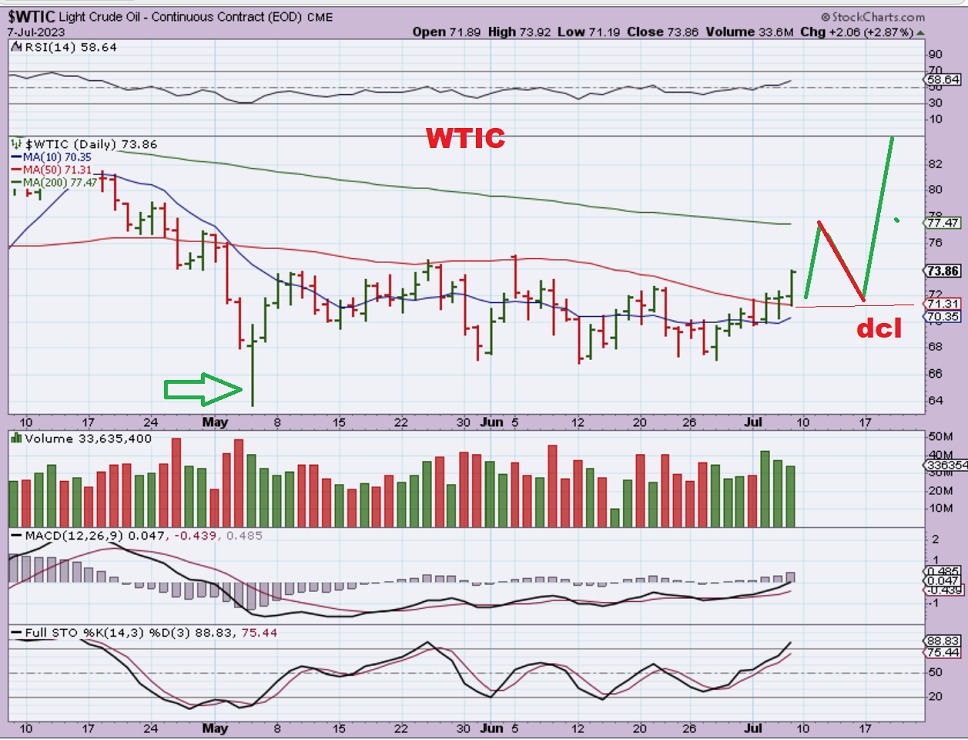
WTIC – Oil did run to the 200sma and was rejected on Thursday & Friday, as expected. Now we’ll see if this continues to play out as expected, because in the Big Picture…
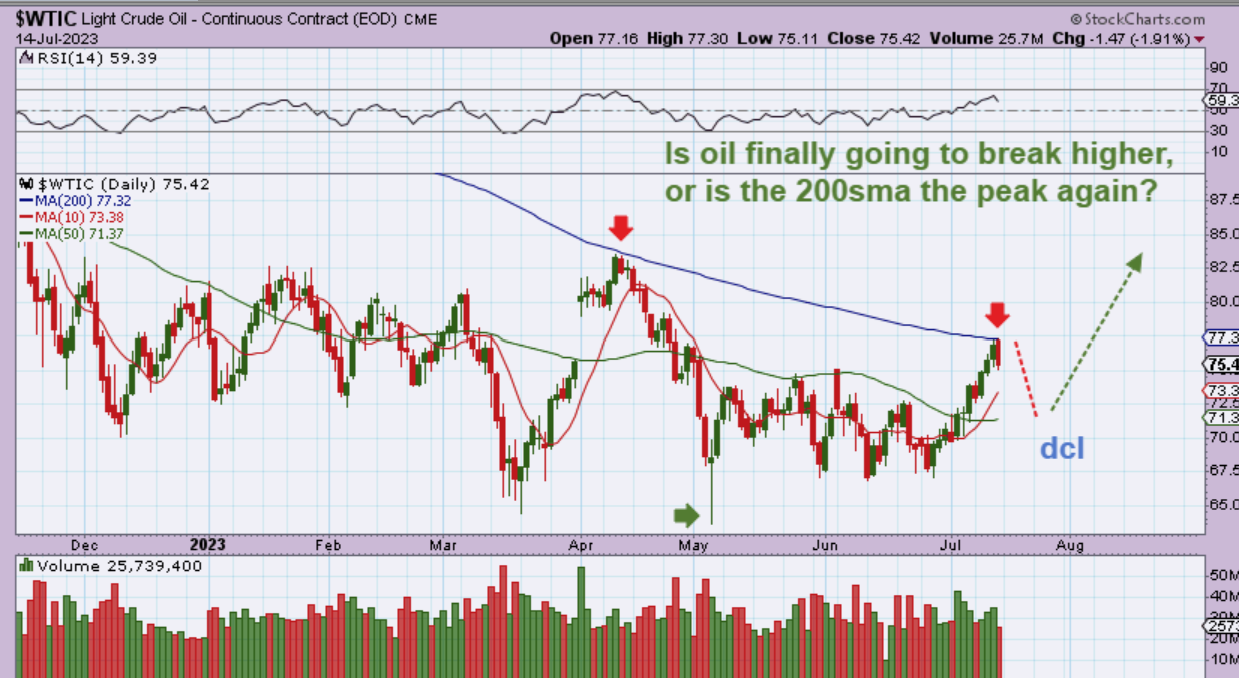
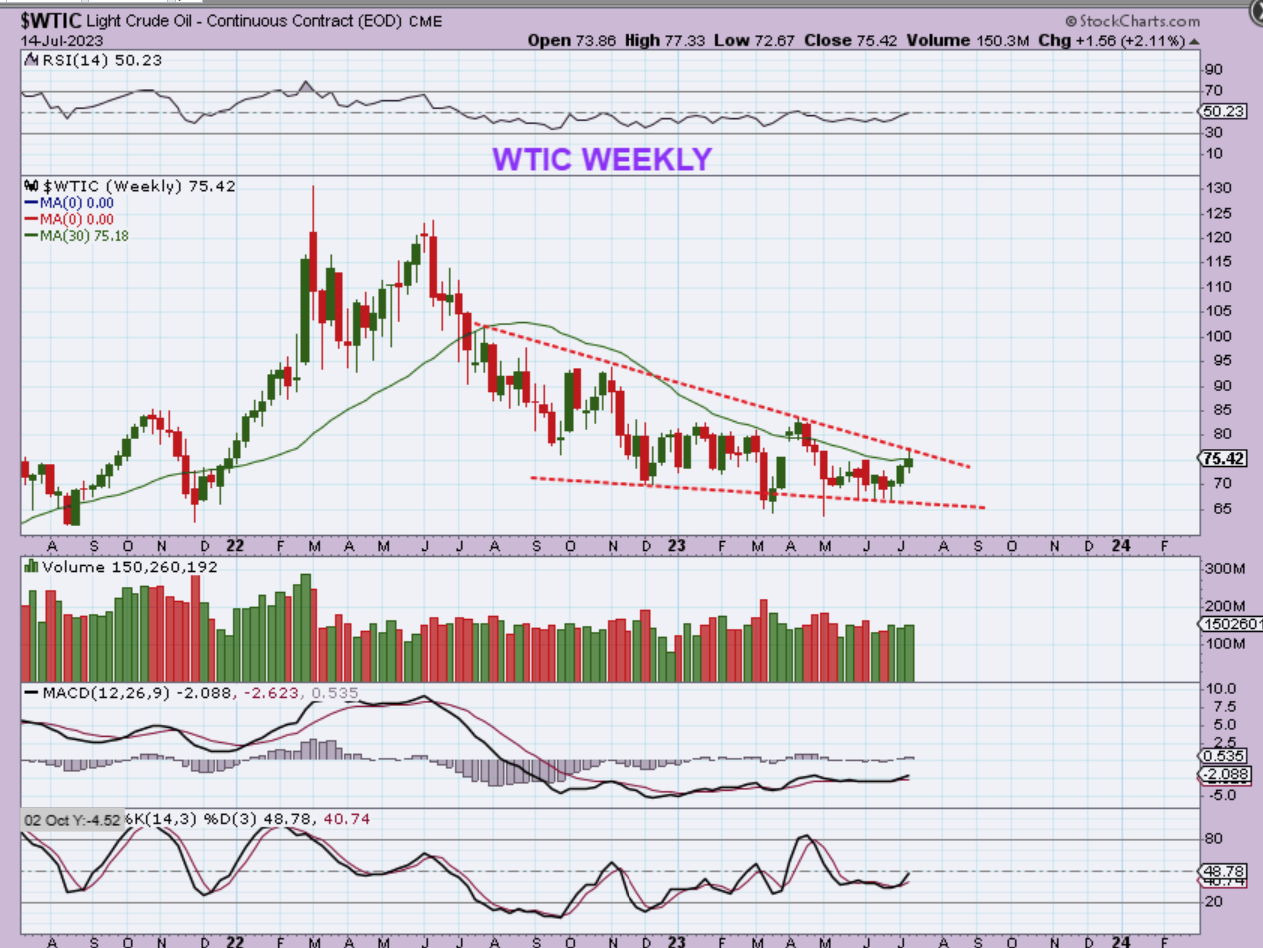
In the Big Picture, WTIC is at a longer-term resistance too. Oil could ‘peak’ here, or break out as mentioned above. It we get a breakout, Oil and Oil Stocks should really start to run higher over time.
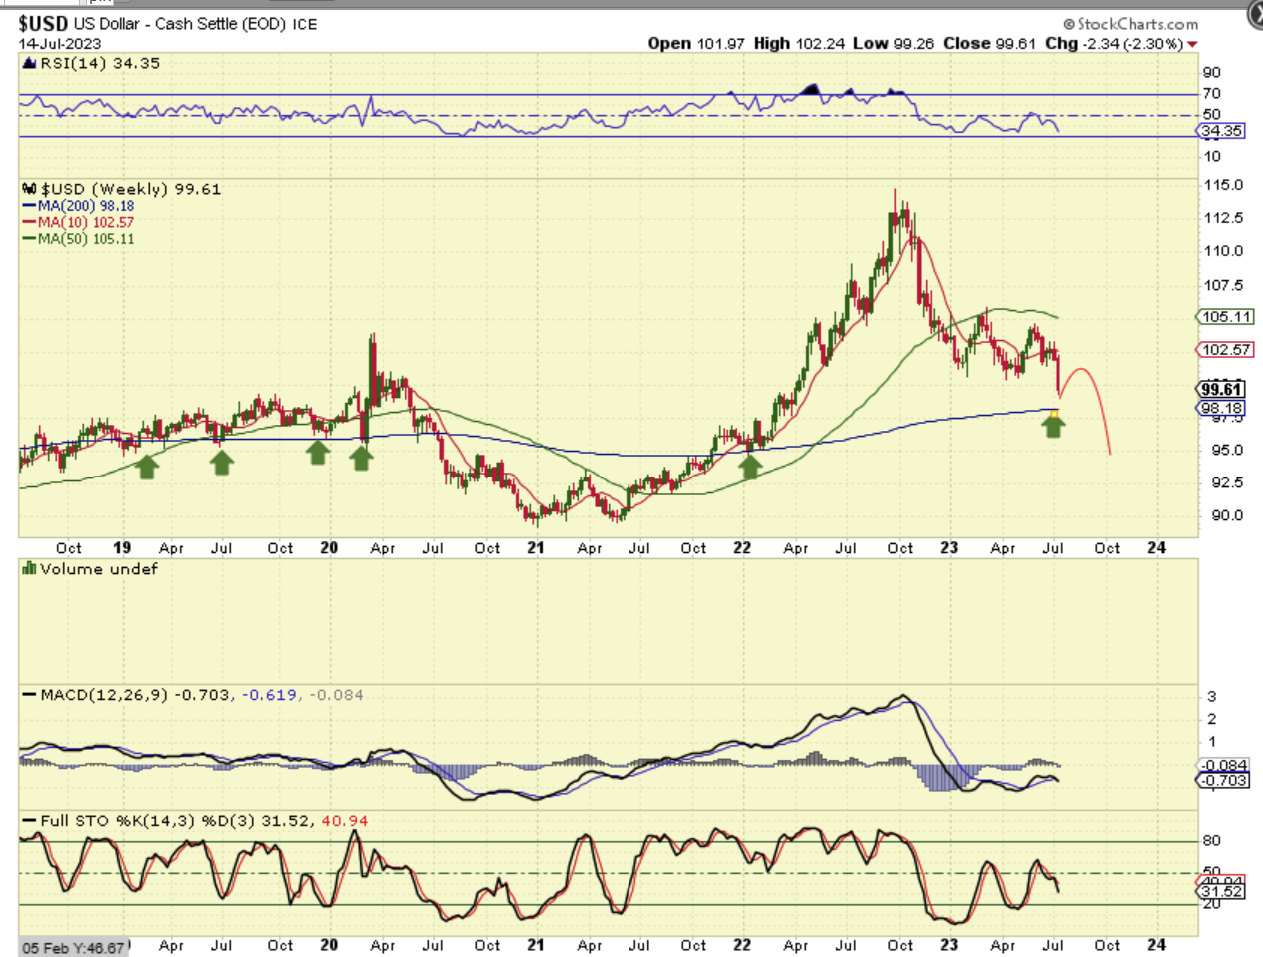
The USD failed last week and is heading lower. We did see a small reversal candle on Friday, so after the last 6 days of selling in a row, it would be normal to get a bounce. How high will it bounce? We cannot know for sure, but that should offer a buying opportunity or ‘add’ in Miners for those not fully invested, but wanting to be.
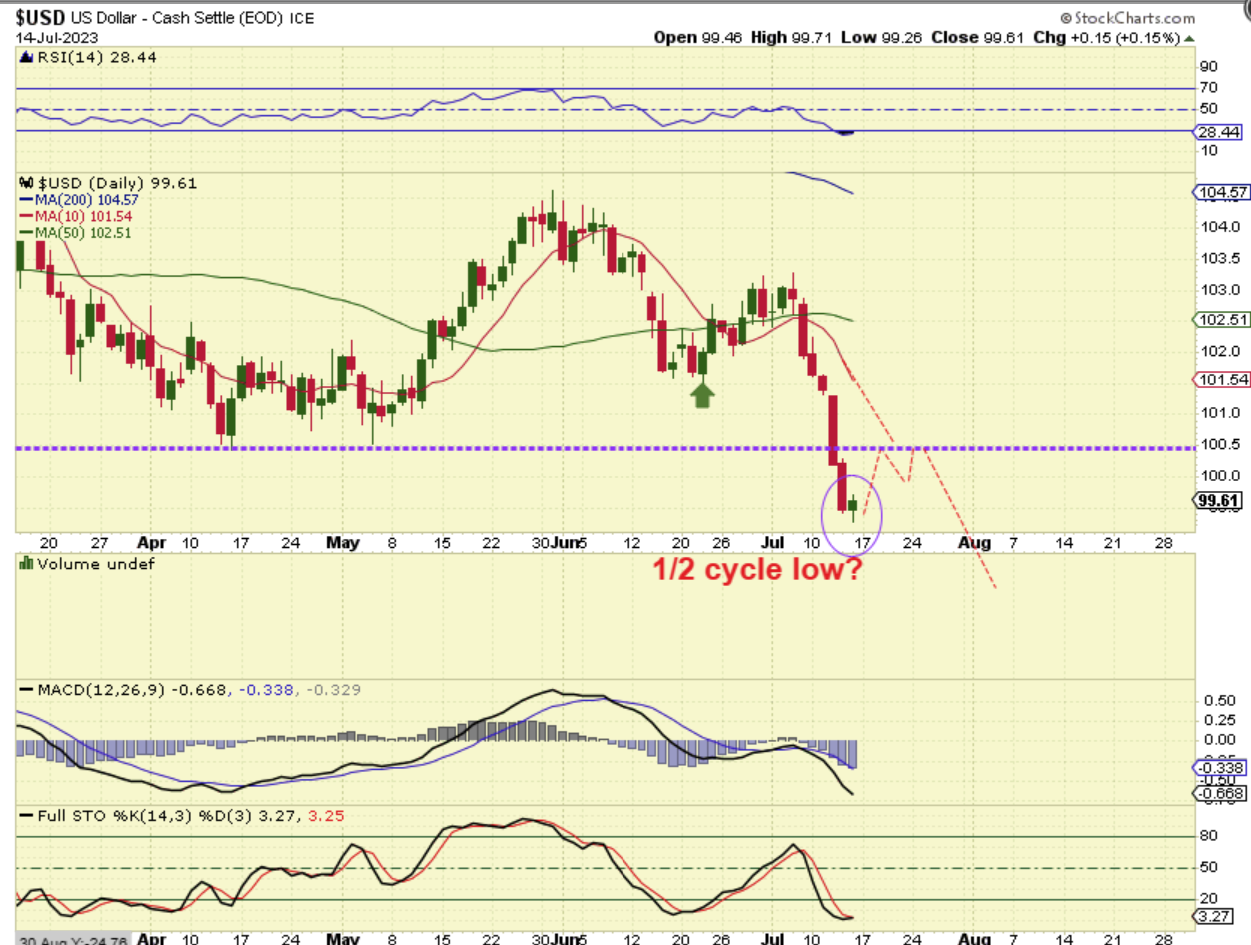
USD WEEKLY We would be bouncing from above the 200 week ma, but that has been sloppy support in the past anyway. The main point here is that we have a failed daily cycle and a failed intermediate cycle and I am expecting lower prices in the big picture as a result.
,
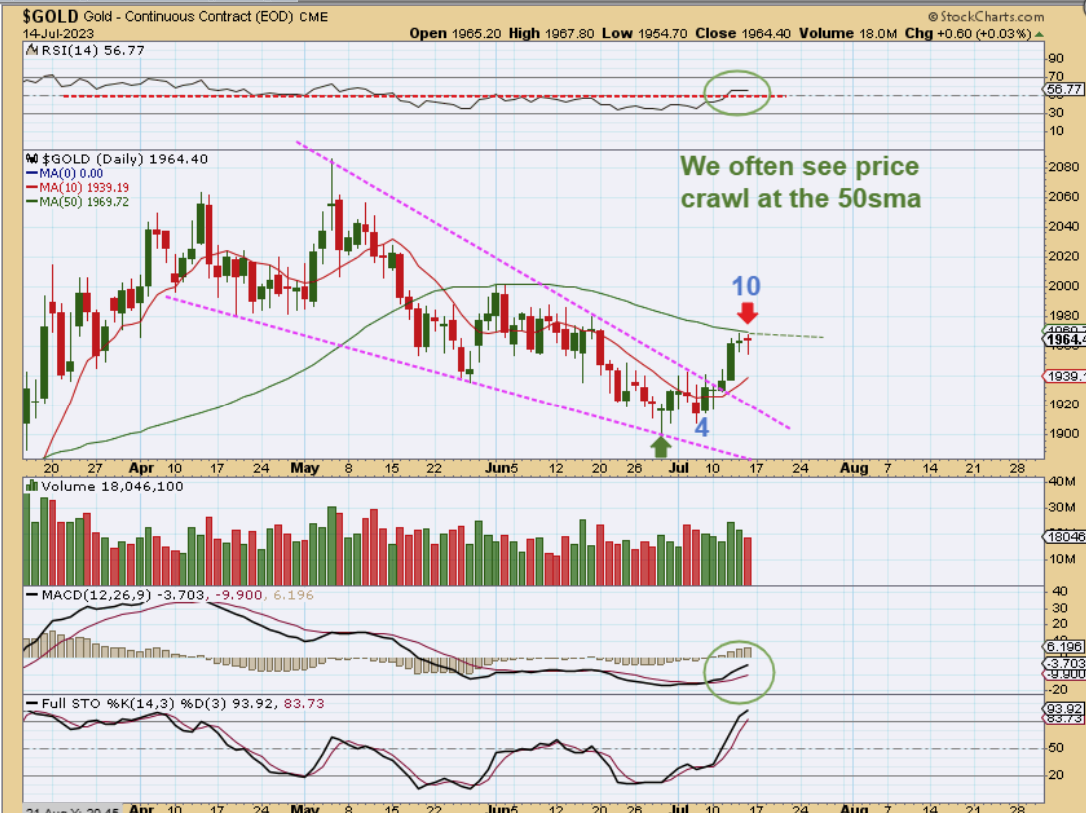
GOLD ran up to the 50sma on the daily chart, but stalled there Thursday and Friday. Often you will get ‘crawl’ along the 50sma before the breakout, and especially so with a possible USD bounce. I just want us to be prepared for a possible chop sideways next week. The set up is currently still very bullish.
.
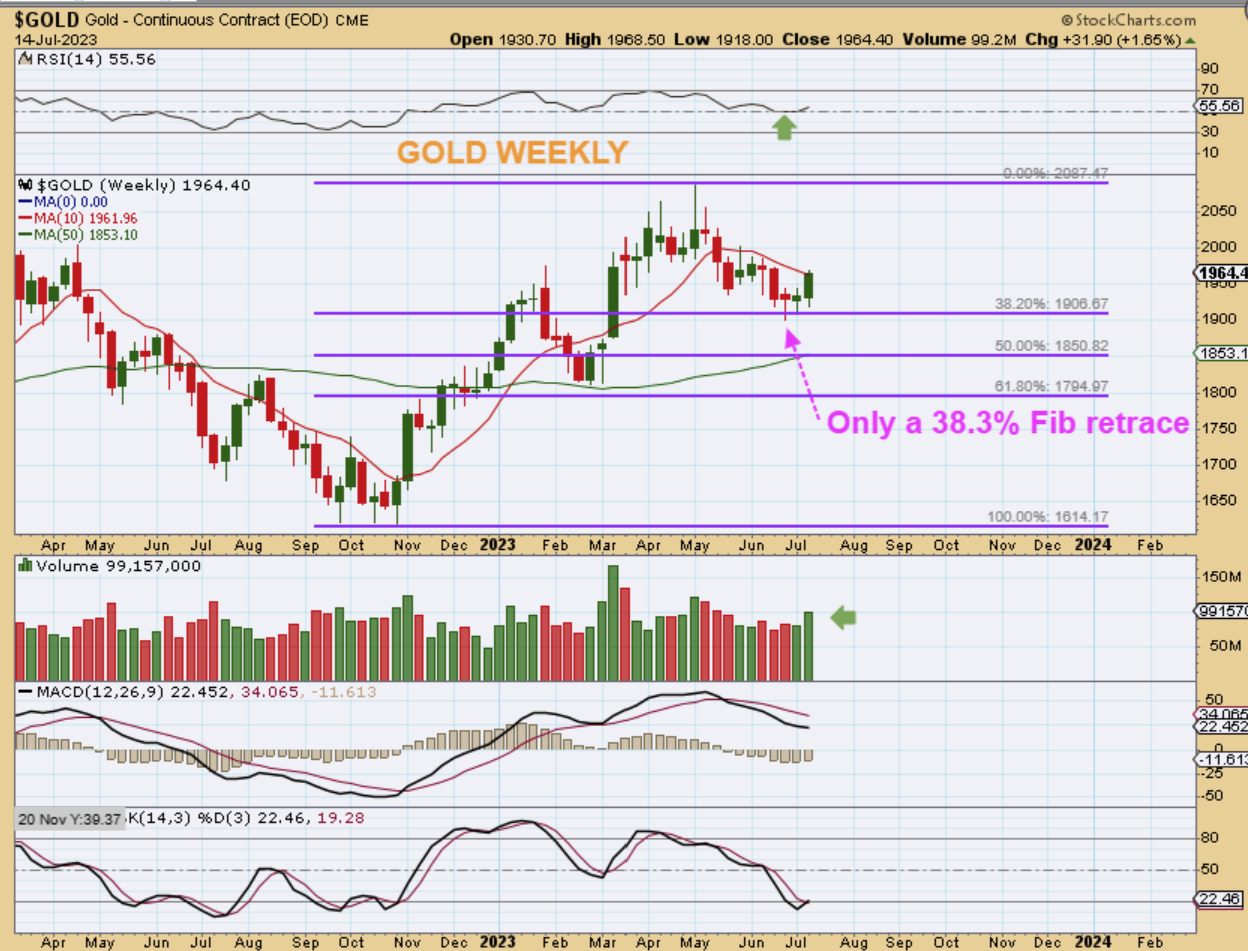
The Weekly Gold Chart landed at the 38% Fib area and reversed higher. That is a Strong set up and Gold looks to be prepared to run up and break out to all-time highs and more. This is a very bullish set up and the pullback was minimal.
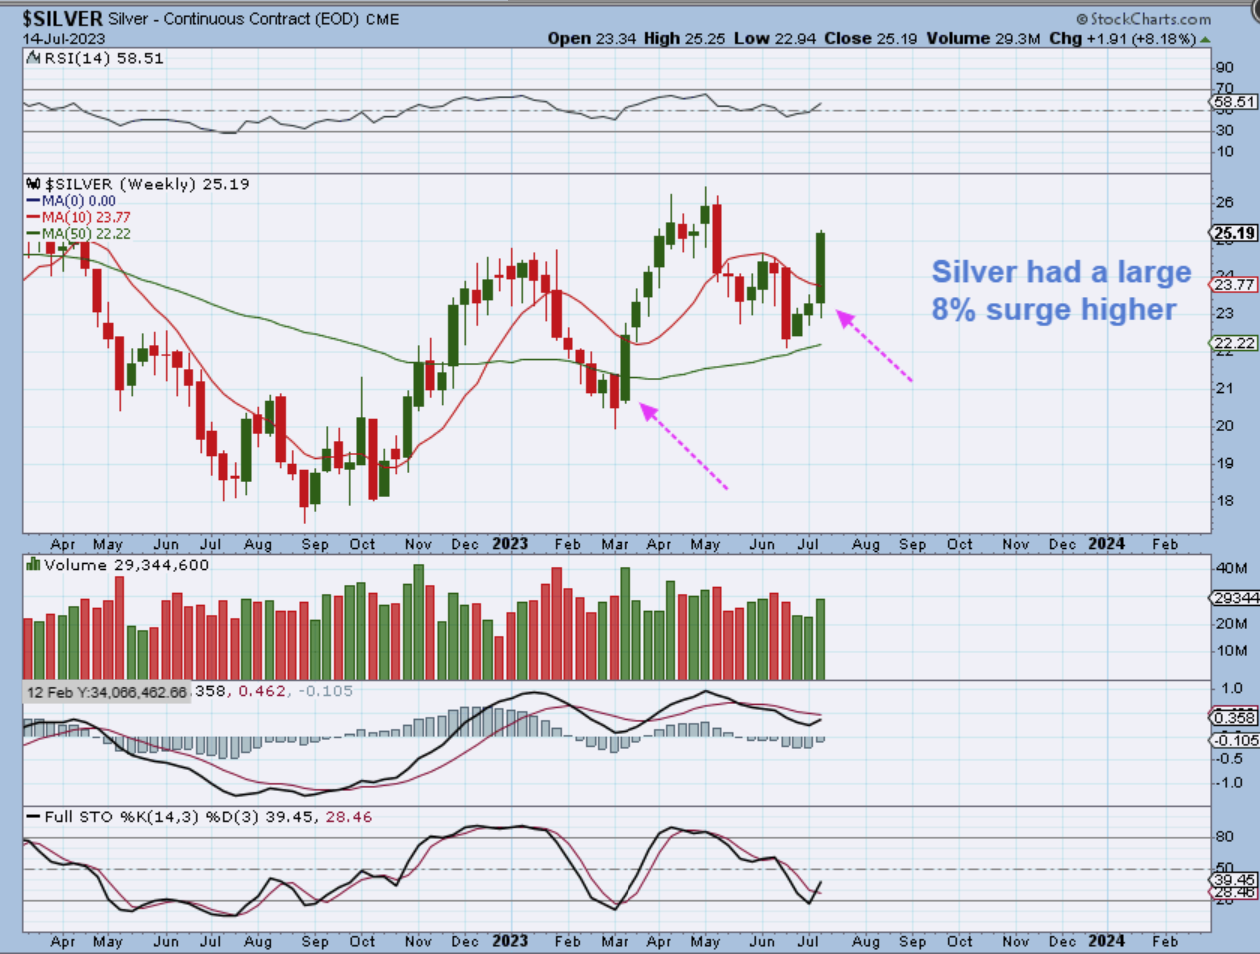
SILVER exploded higher by 8% this week. Look at that candle and think to yourself, “Is there any doubt that Silver on this chart looks like it wants to break to new highs?” What is negative here? NOTHING. I want to show you something else too…
.
I want to show you something, and this applies to many Silver Stocks…
.
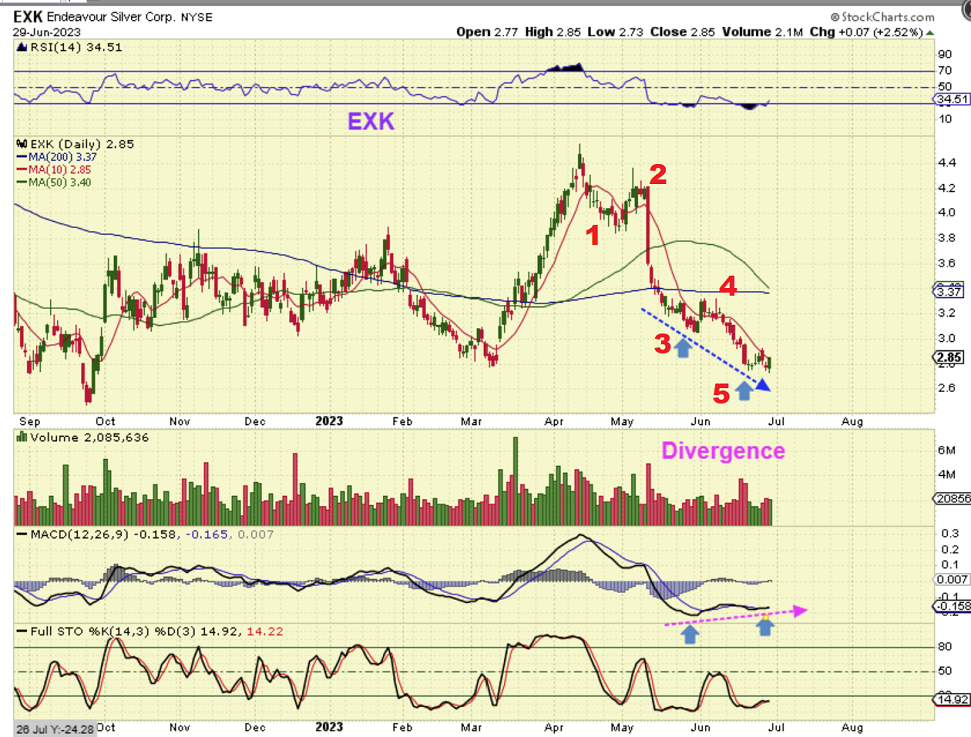
EXK is one of the Silver stocks that I said was a buy with the divergence in June and again in July. It also had 5 waves down indicating that selling was finished and a buy with a stop was possible.
.
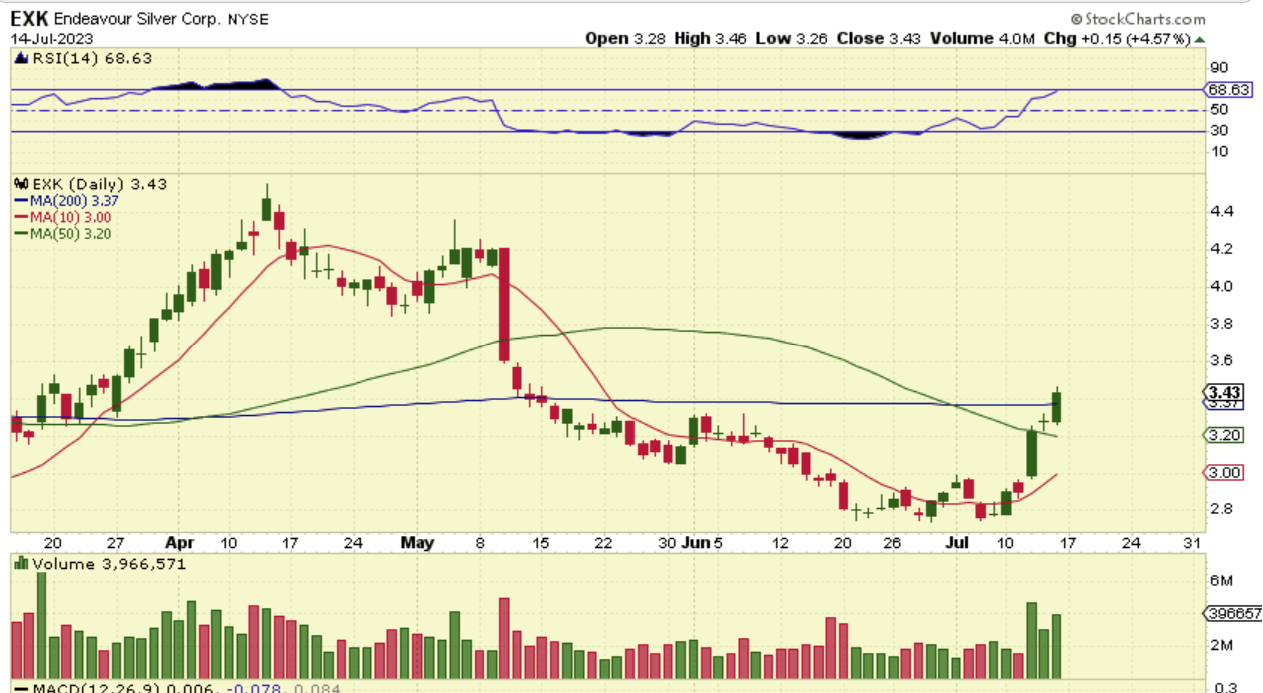
EXK moved up & out of the base and has broken above the 50sma and now the 200sma. Seems like a normal run higher, but since this all happened in 1 week, guess what? …
,
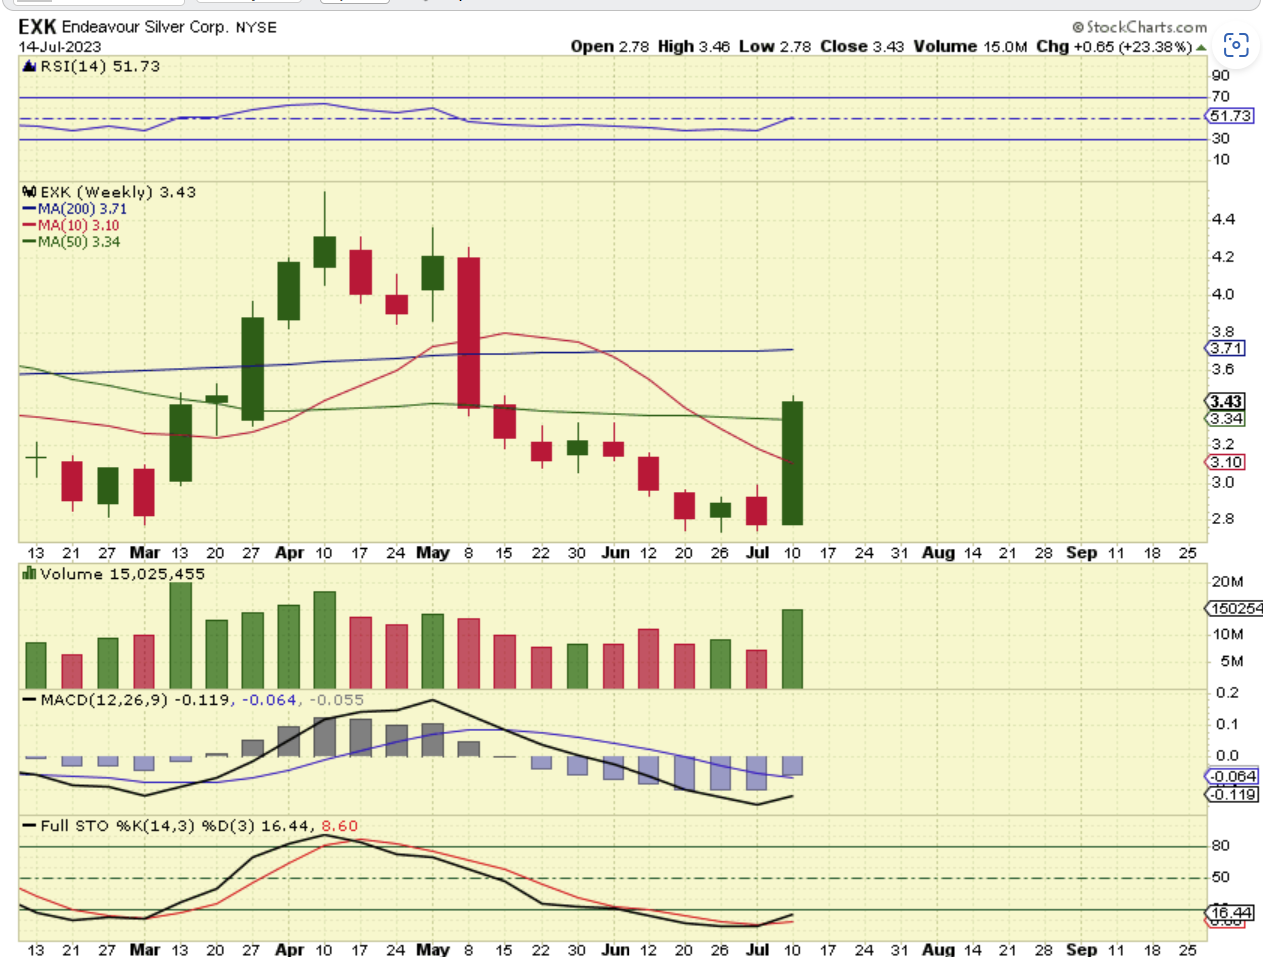
That means that EXK & many of the Silver stocks are up HUGE for the week, yet they are still oversold. EXK was up 23.38% this week alone.
.
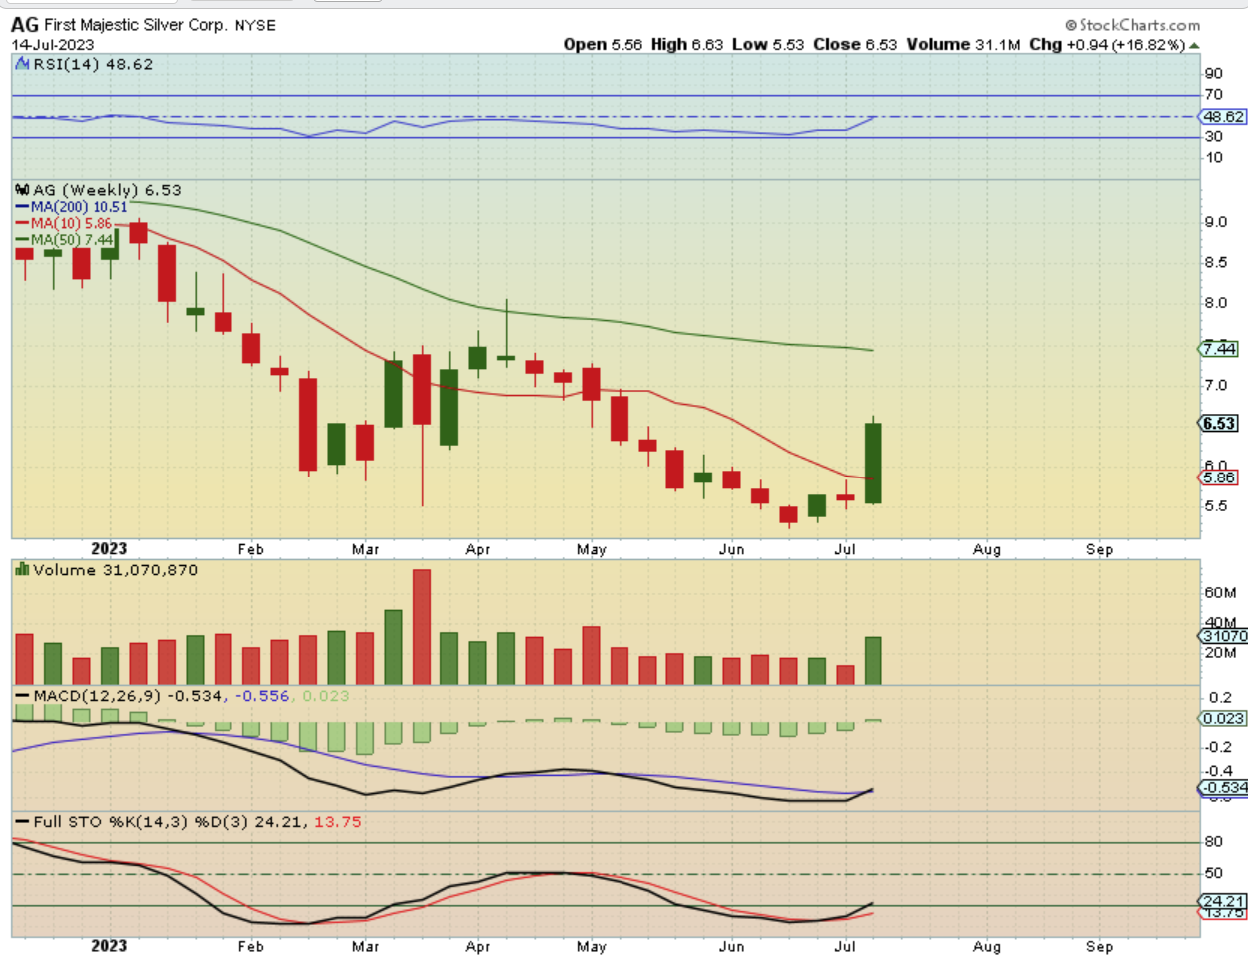
AG was up 16.82% last week and it remains oversold and the weekly MACD is just crossing higher now. Again, these are still at the lows, so this could be a very good end of the year for Miners, my friends.
.
Last week the USD failed and Miners started to move, Silver stocks were up 15-20+%, so I wrote:
GDX
.
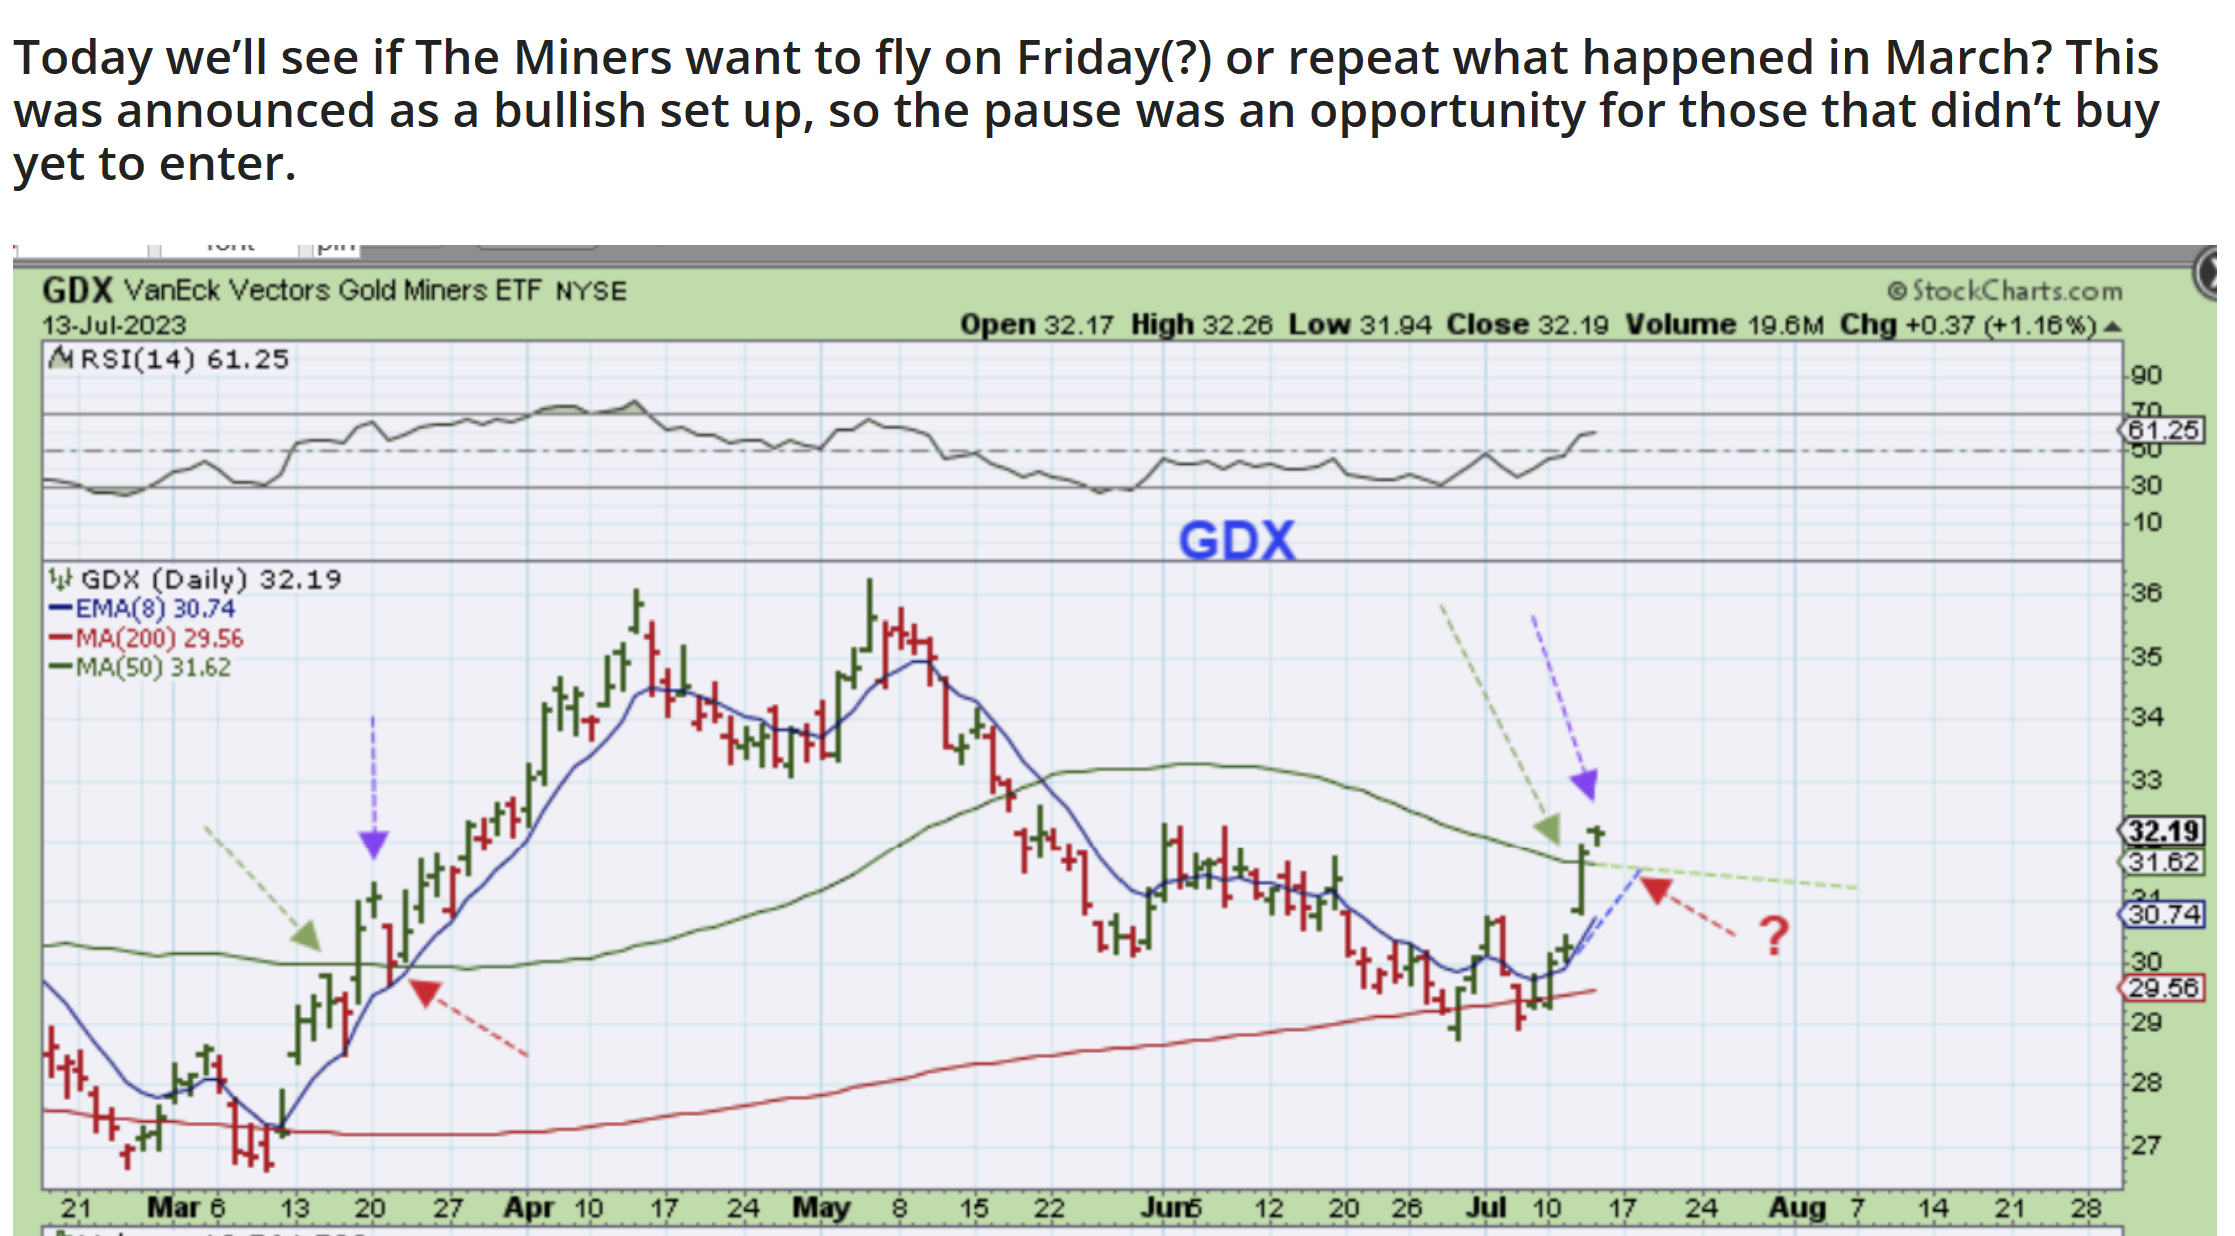
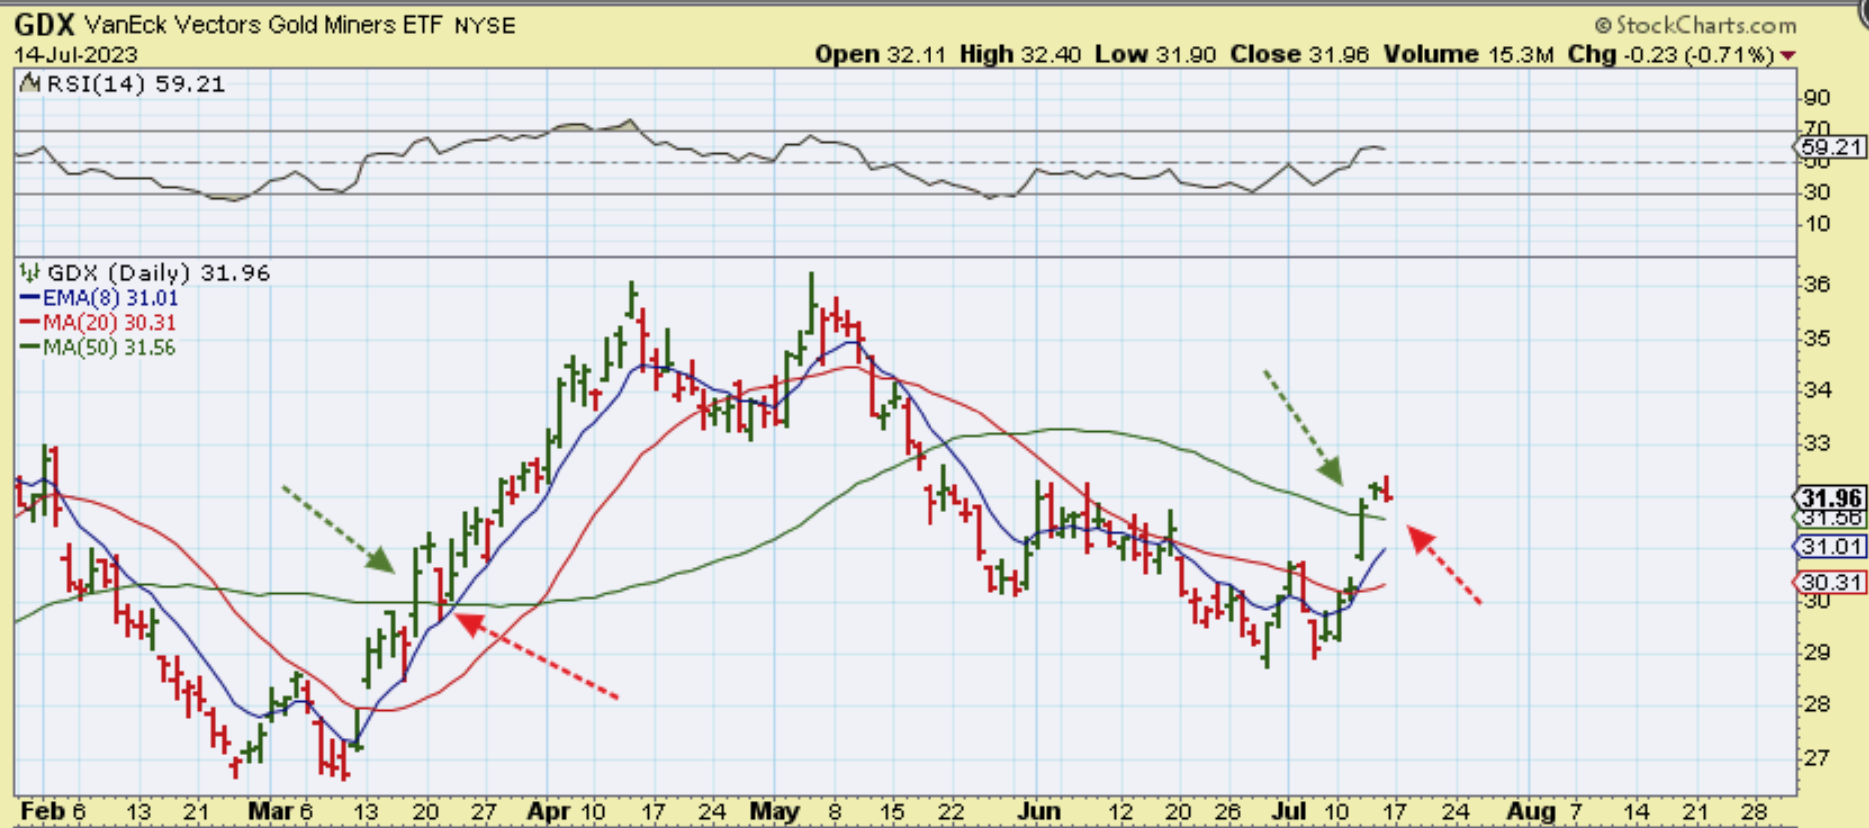
GDX : On this chart I continued to show that in March when the GDX broke the 50sma, it then paused, so I mentioned that this could happen again. It does NOT mean that there is anything wrong or weak in this sector. GDX paused Friday, so should you be worried? No.
.
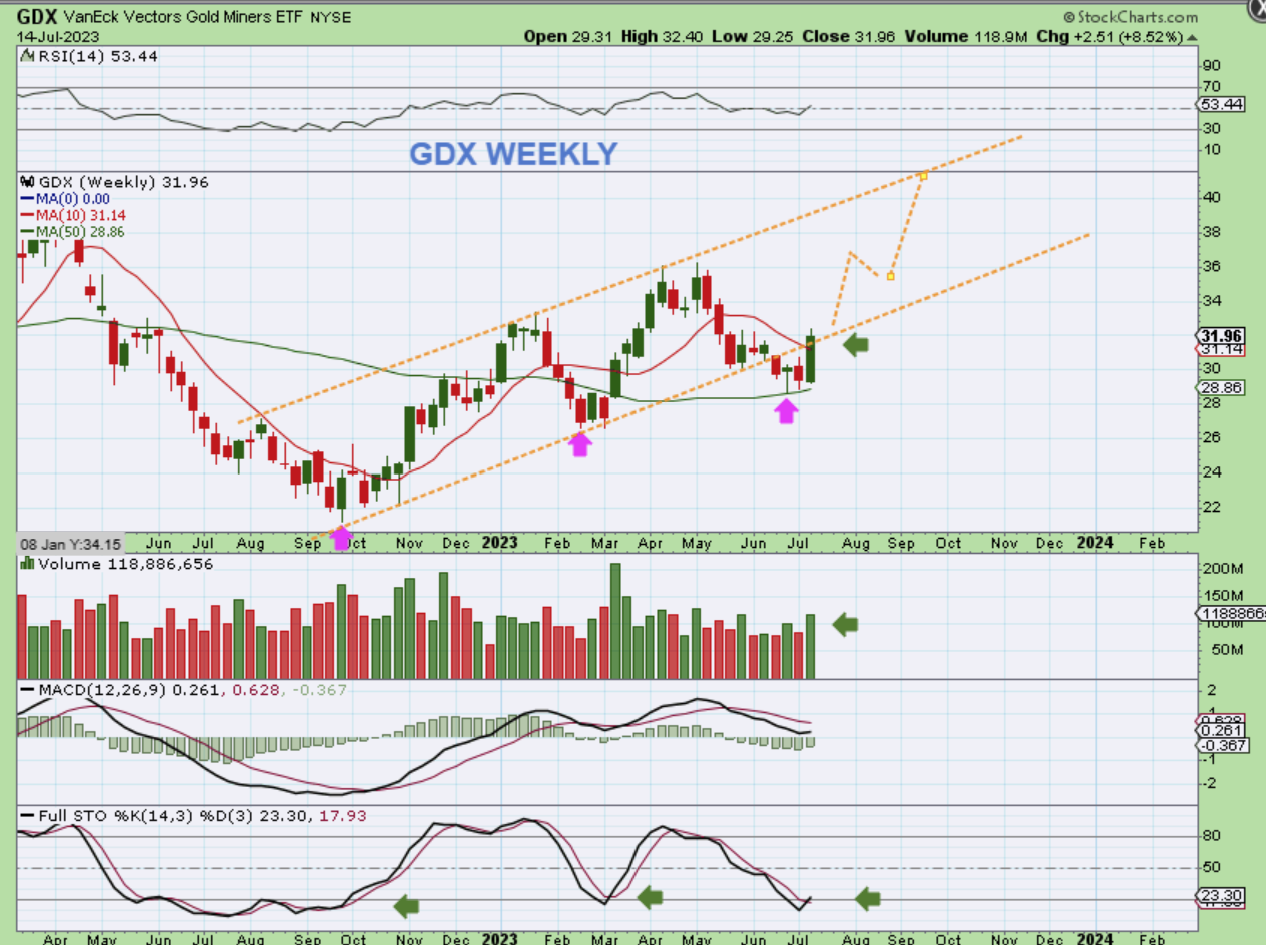
When I look at The GDX ETF Weekly Chart, it looks to me to have bottomed perfectly on the 50 week ma, and is recovering from a shake out under the lower trendline or upward sloping channel.
.
Not only is the bullishness still with us in this weekend report, the chart of SILVER and the Silver Miners was very impressive, with 20% gains! They are still oversold and near the lows, so even if we see a pause, there is nothing to worry about, there should be a plenty of gains ahead.
.
Enjoy your weekend and thanks for being a Chartfrealk with me!
.
~ALEX
.
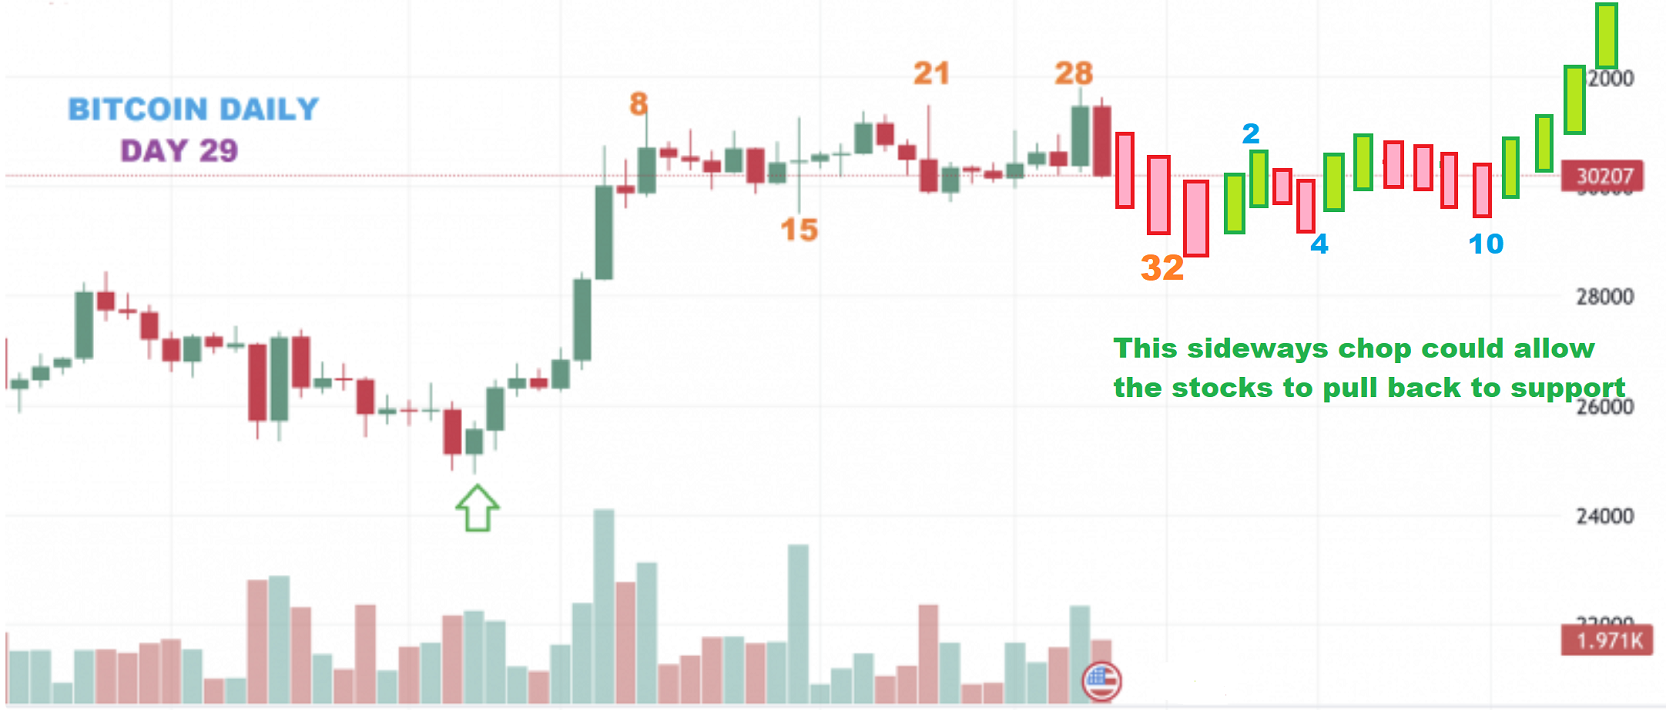
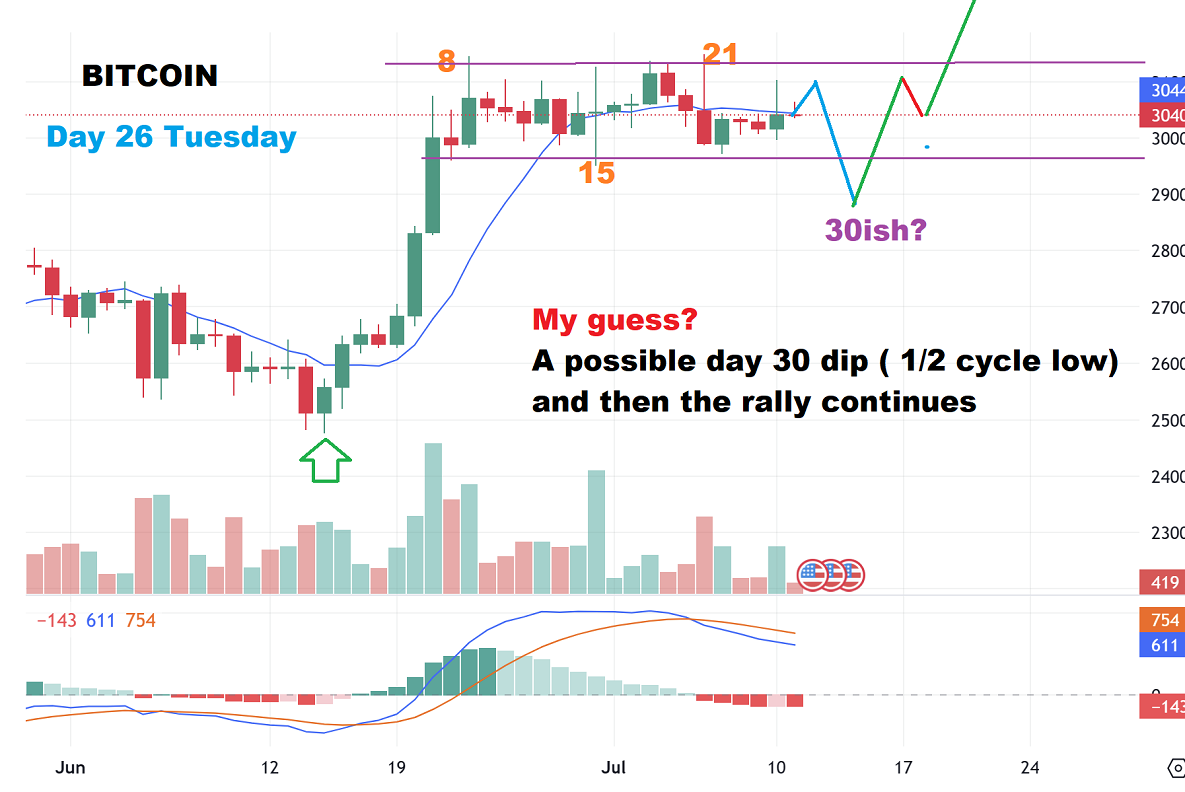
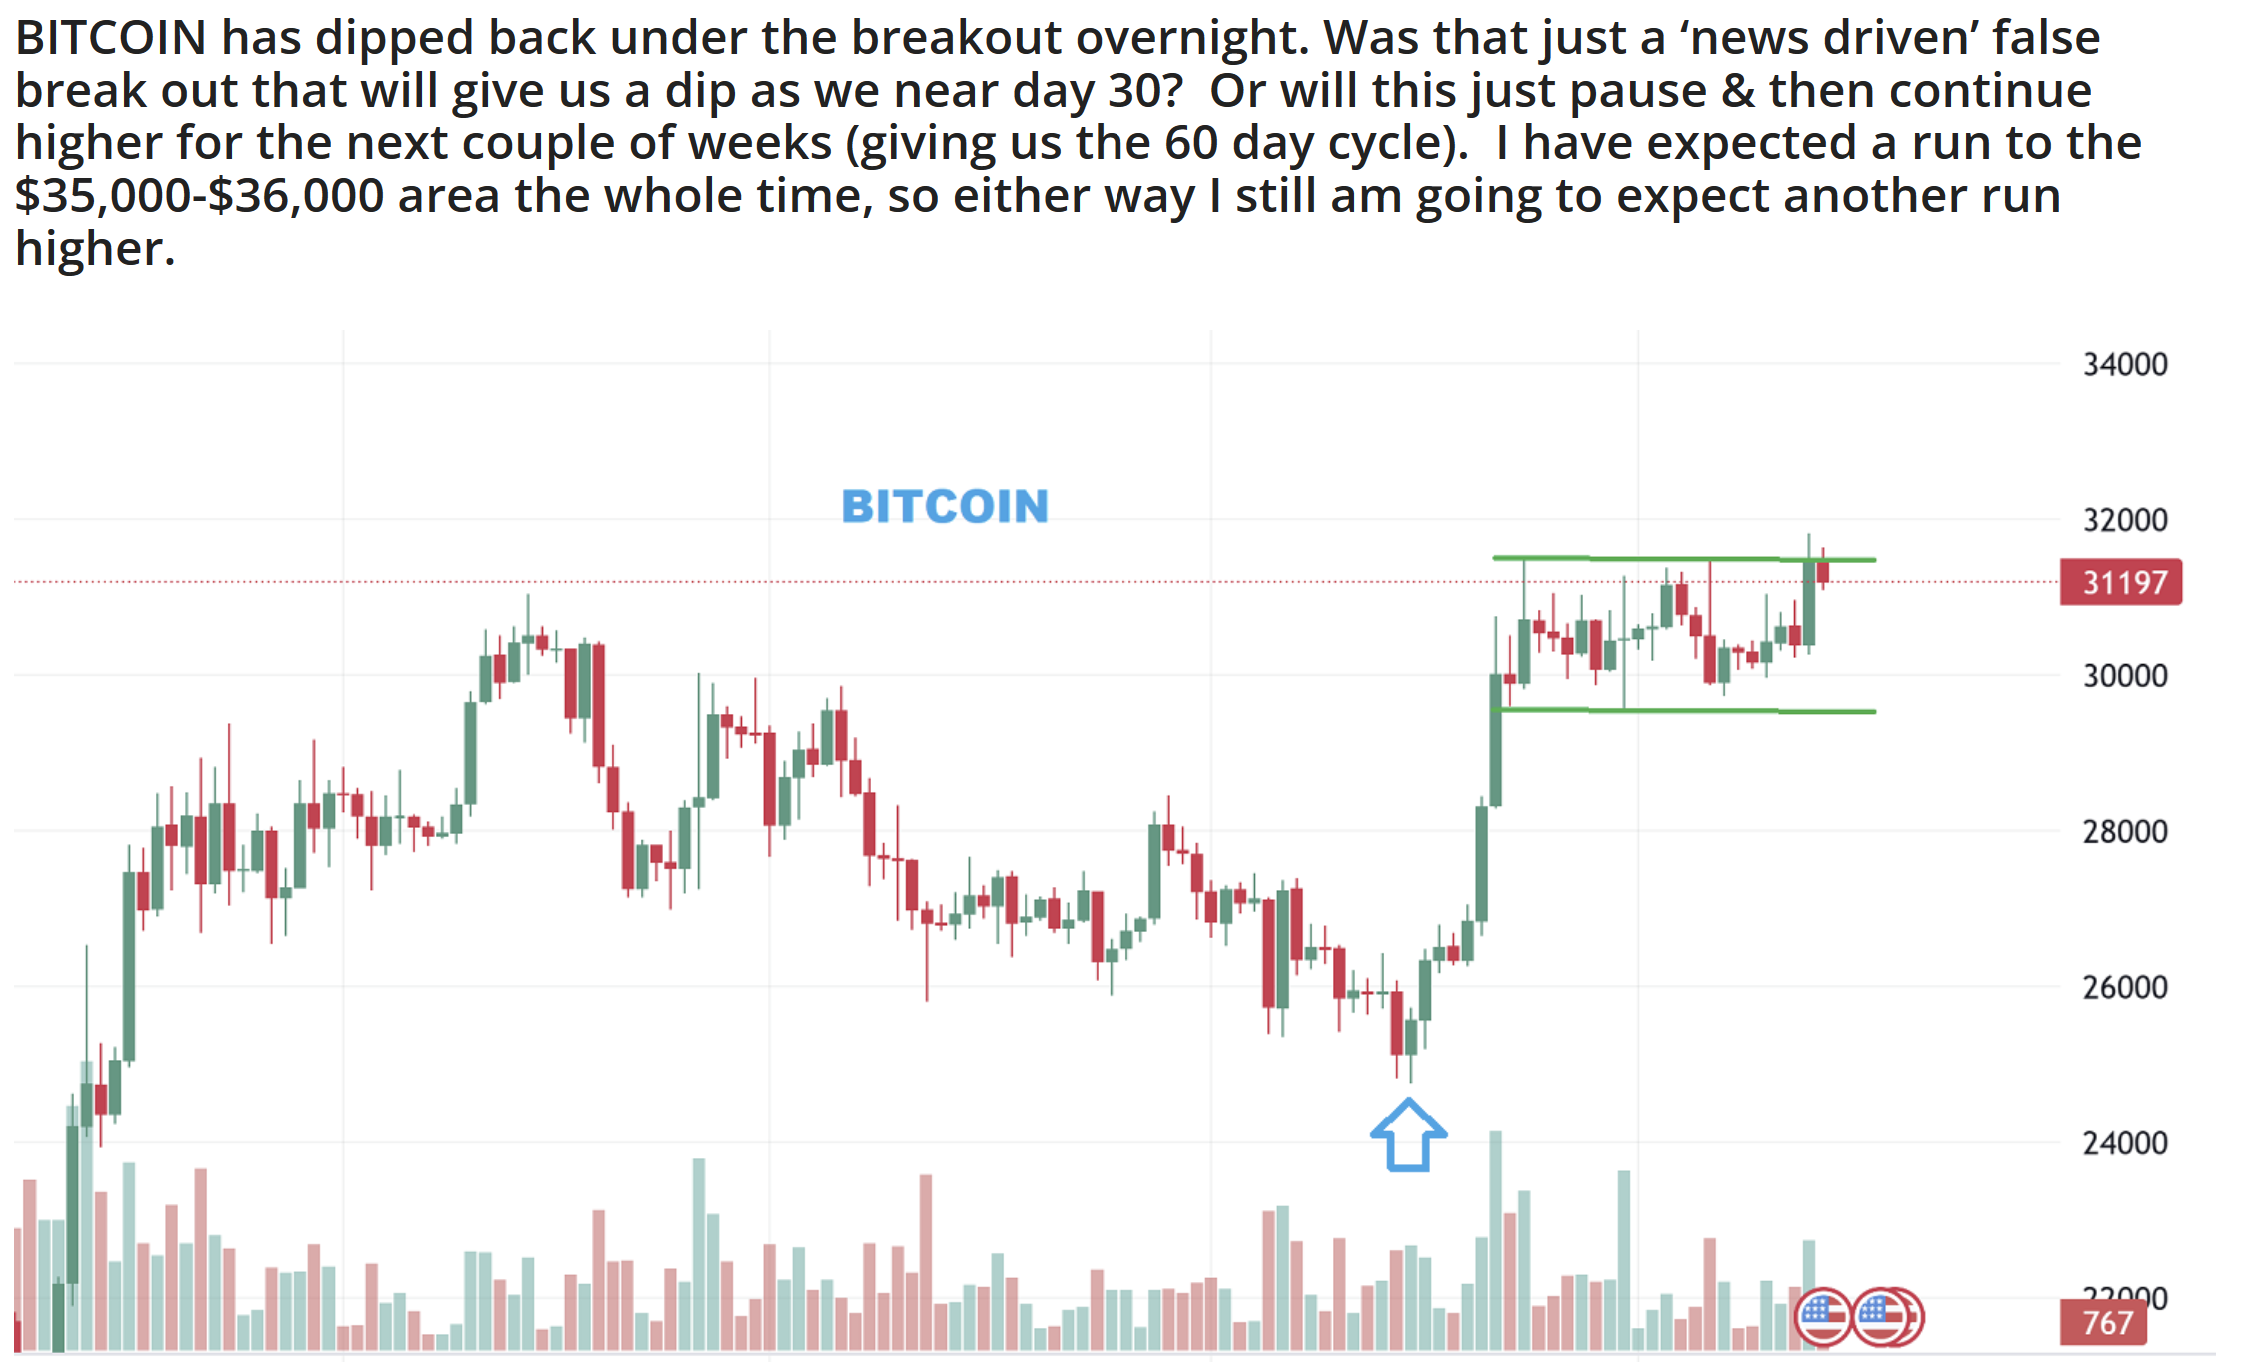
BITCOIN – Do you remember? Last week we were on day 25 and I mentioned that I was expecting a dip in Bitcoin as we approached day 30, because I use 30 & 60 days for my lows. I view day 30 as a 1/2 cycle low and day 60 as a dcl. So I felt that we should see a dip, and then continue higher, but…
.
BITCOIN rallied? I wrote in Fridays report…
.
Suddenly we did get that dip in BITCOIN as hit day 29.
.
I feel that Bitcoin can drop to a new low near day 30 (or maybe 31 or 32) and then push higher. The next question is: “ Crypto stocks are quite overbought. How can they re-set or run higher?” Let me show you what I think…
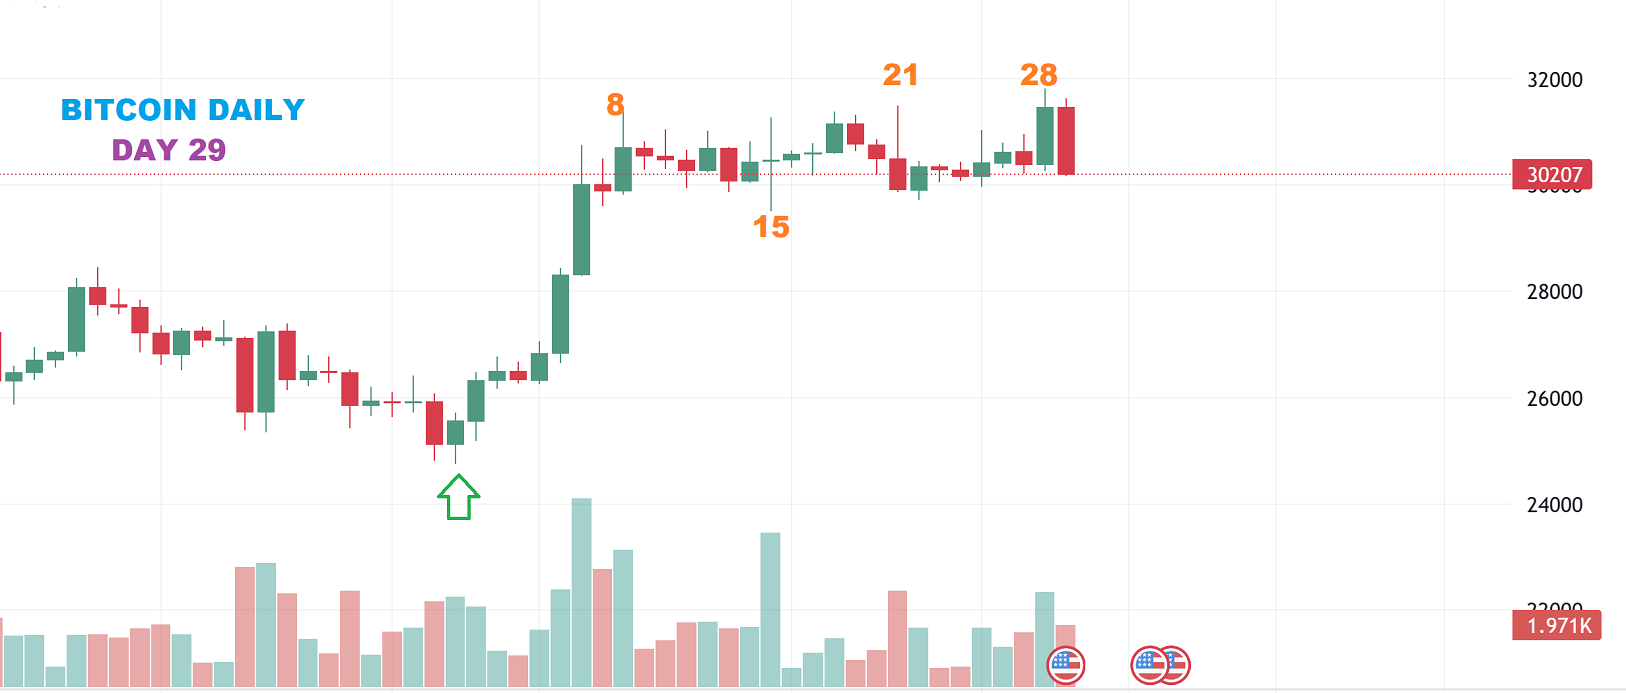
BITCOIN can drop to that new low and it can then meander sideways for several days as the crypto stocks drop to support. A 50% drop from the recent run with MARA or RIOT for example could re-set their sentiment for another run higher. We’ll see.