Weekend Review June 18
Hey all!
Well, we certainly had a data filled week, but it really didn’t change very much, except that the USD finally sold off a bit deeper than expected. We’ll discuss that. I wanted to get this report out on Sunday and not Monday morning, so I am putting it together now and releasing it before I leave to meet up for dinner with my wife and some old friends tonight. That means I may not have time to proofread for typos, so please excuse any if you find them. Thank you!
.
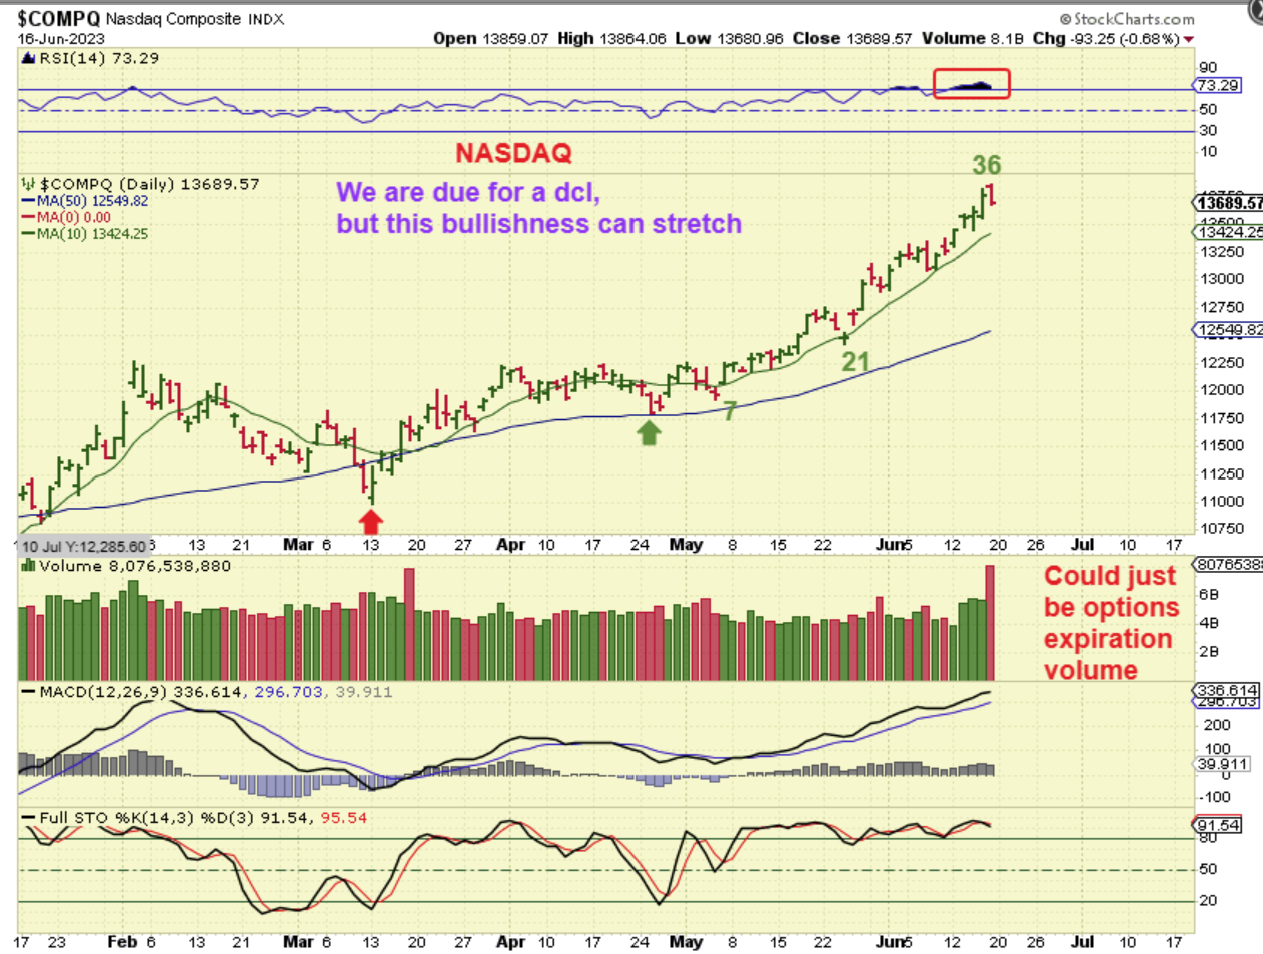
THE NASDAQ Daily shows us as being on day 36 with a pop and sell down on Friday. It was a strong week and it has been a good run out of the March lows. It is possible that this is the ‘peak’ of this daily cycle, because a normal daily cycle last around 40 days give or take, however some may just continue to raise stops at the 10sma support, because……
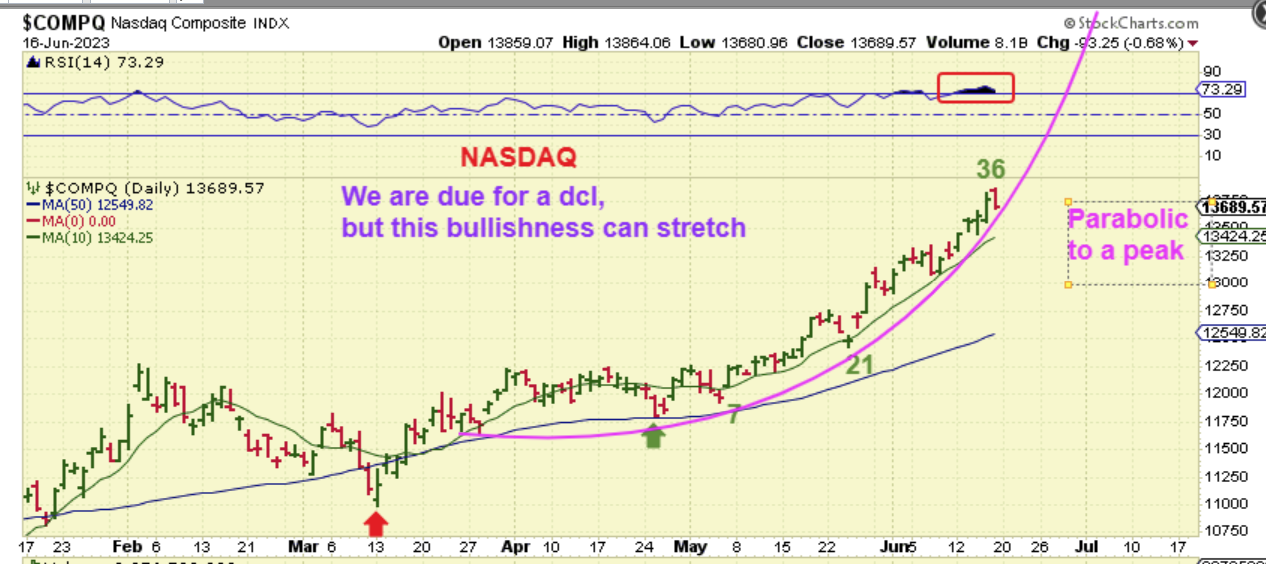
If the NASDAQ is doing a parabolic run, it can still stretch out further and extend. It is hard to call a top on a solid bullish move.
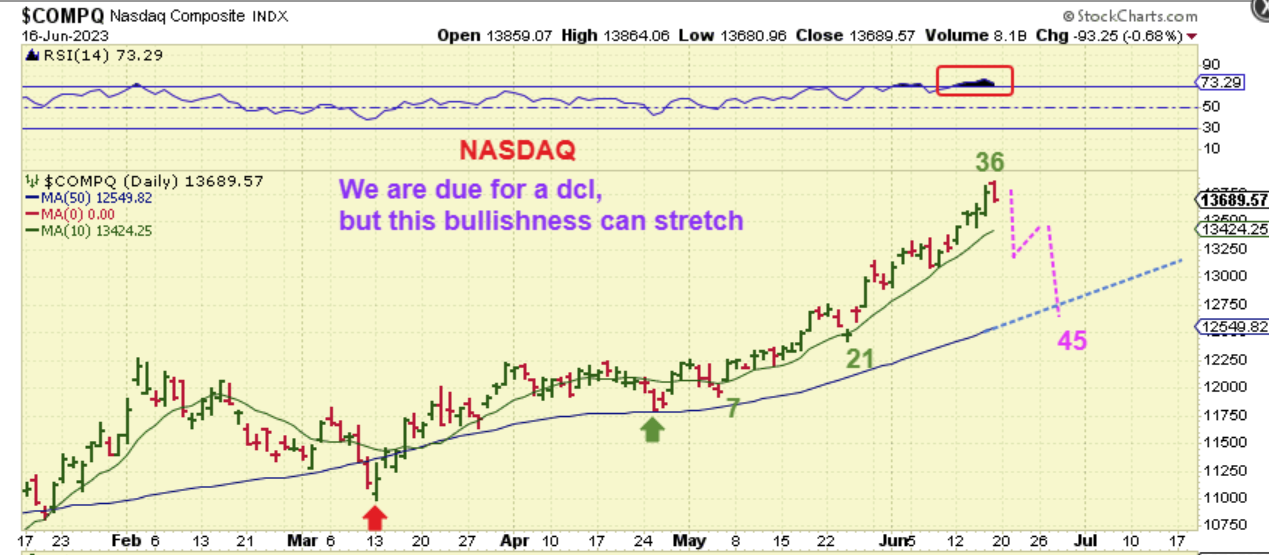
NASDAQ – A drop down into a dcl may look something like this move to the 50 sma (just an example as a visual aide).
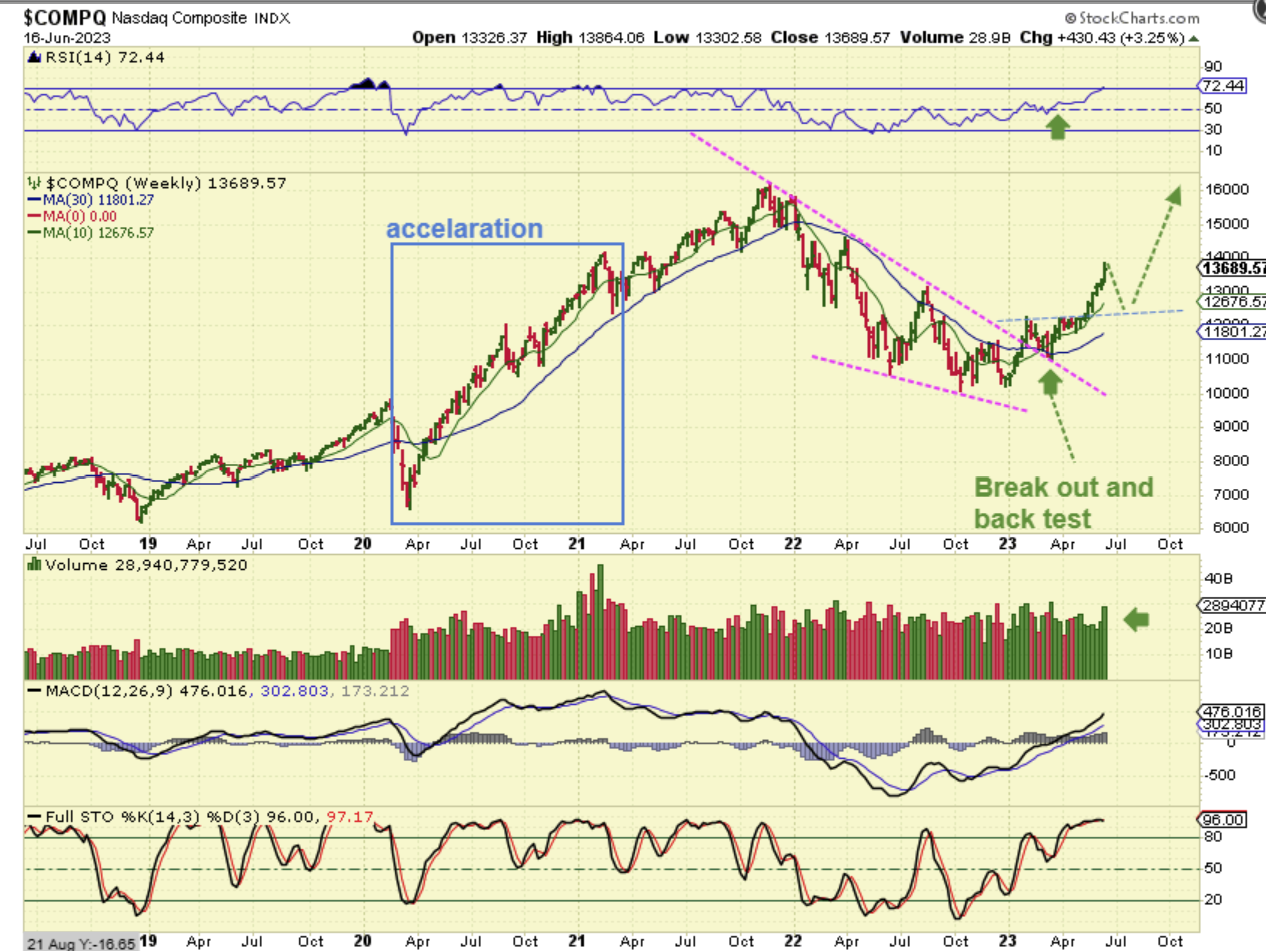
NASDAQ WEEKLY – In recent reports, I was pointing out the way that the NASDAQ accelerated in 2020 out of the lows. Notice that the pull backs became more shallow on that run. Currently, I can see a breakout from recent choppy consolidation, and I do see a bit of an acceleration starting, and that is why I pointed that out. Our markets may rally back to 2021 highs over time.
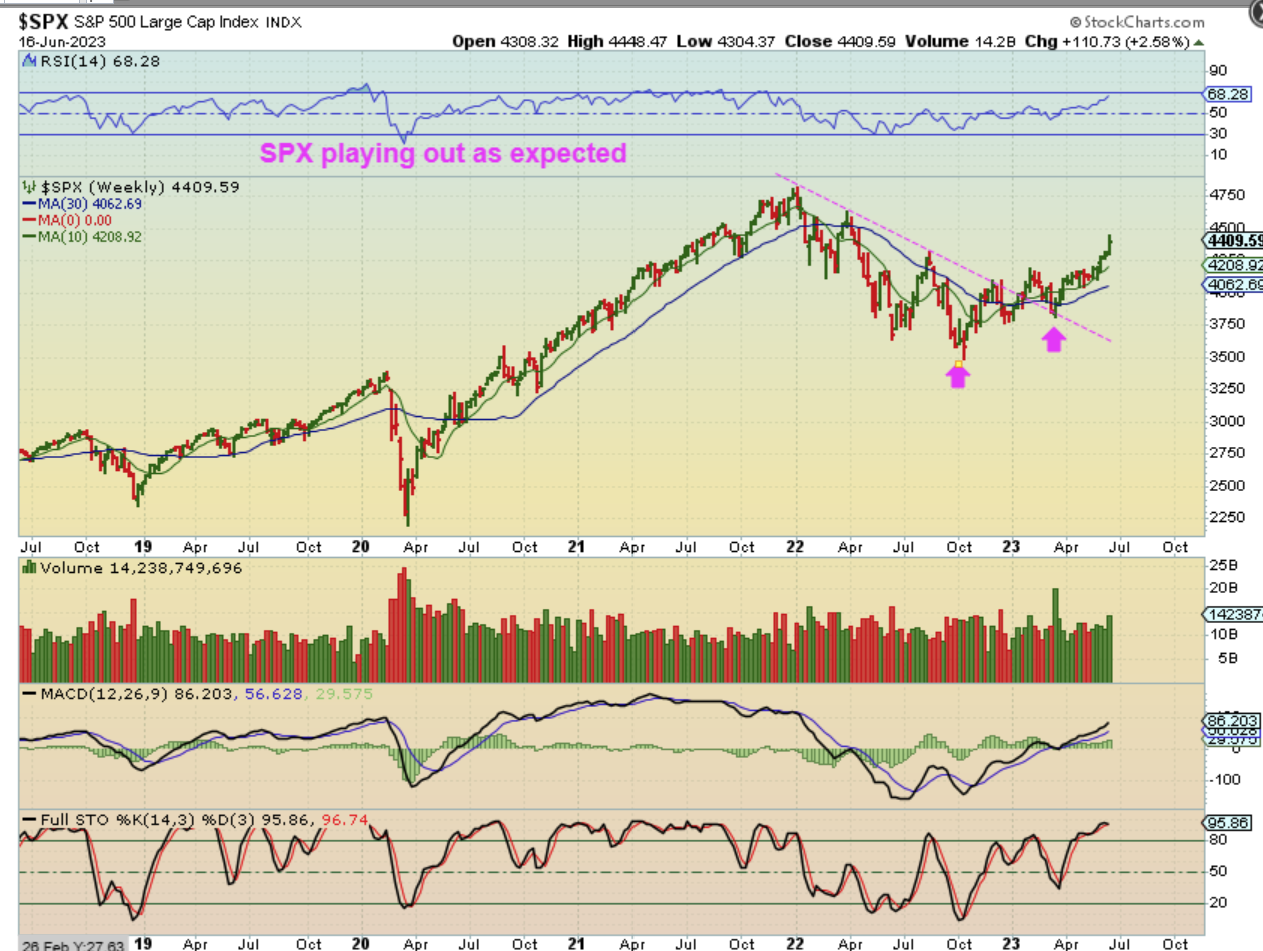
The SPX was also chopping sideways for weeks, but it is now pushing higher out of that consolidation too. We may dip into a dcl and then rally higher.
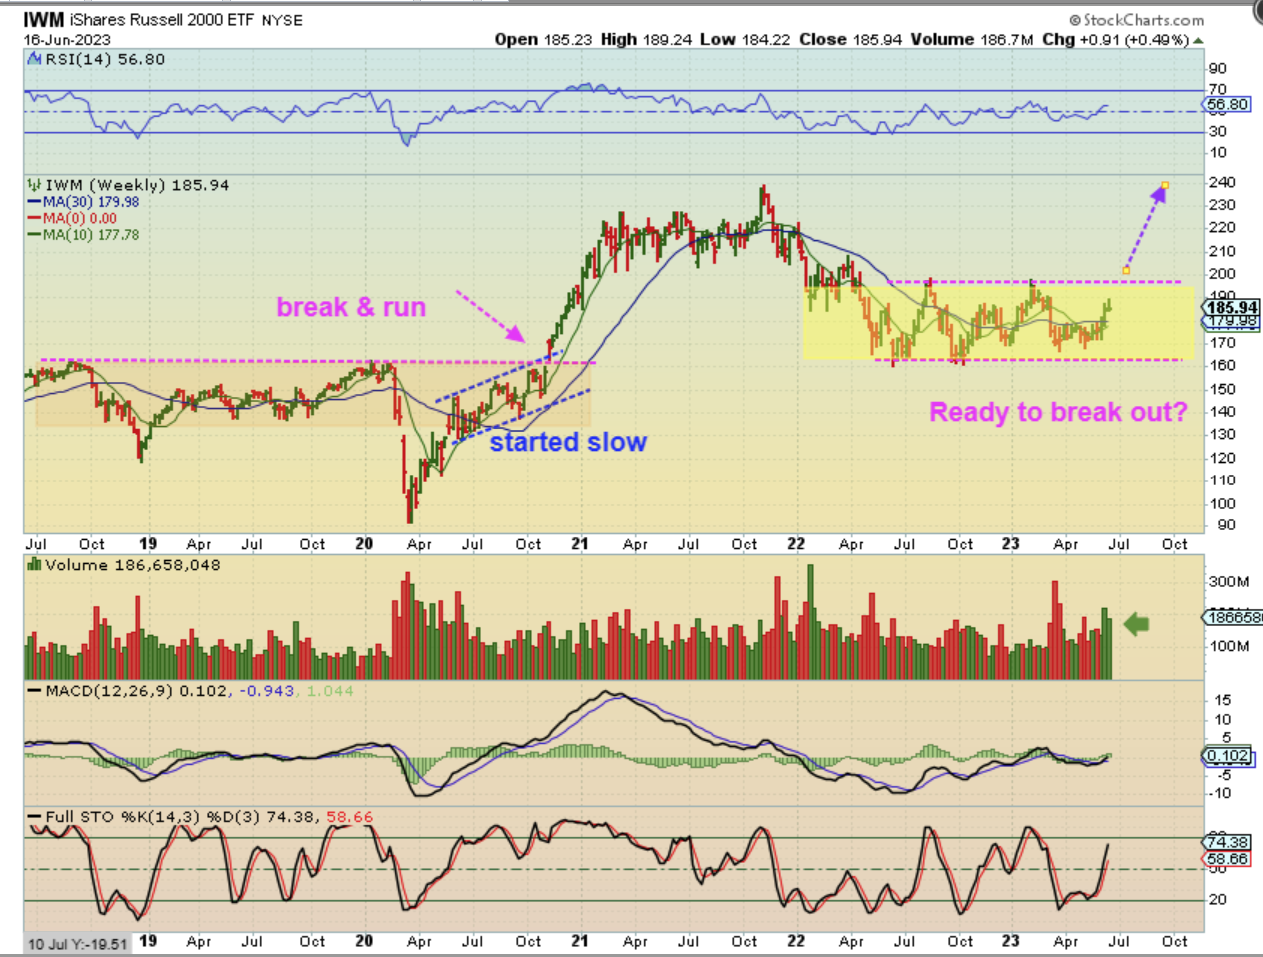
Let’s also discuss the one that I have been calling a ‘Laggard’
.
THE IWM is definitely making much slower progress, but if it gets running, the small caps should do very well. We’ve seen Clean Energy and EV perking up very nicely out of their bases. If this continues to play catch up and runs to the highs, they should continue to benefit and give out some nice gains. Take a look at the breakout in late 2020. That run quickly shot straight up once the chop stopped.
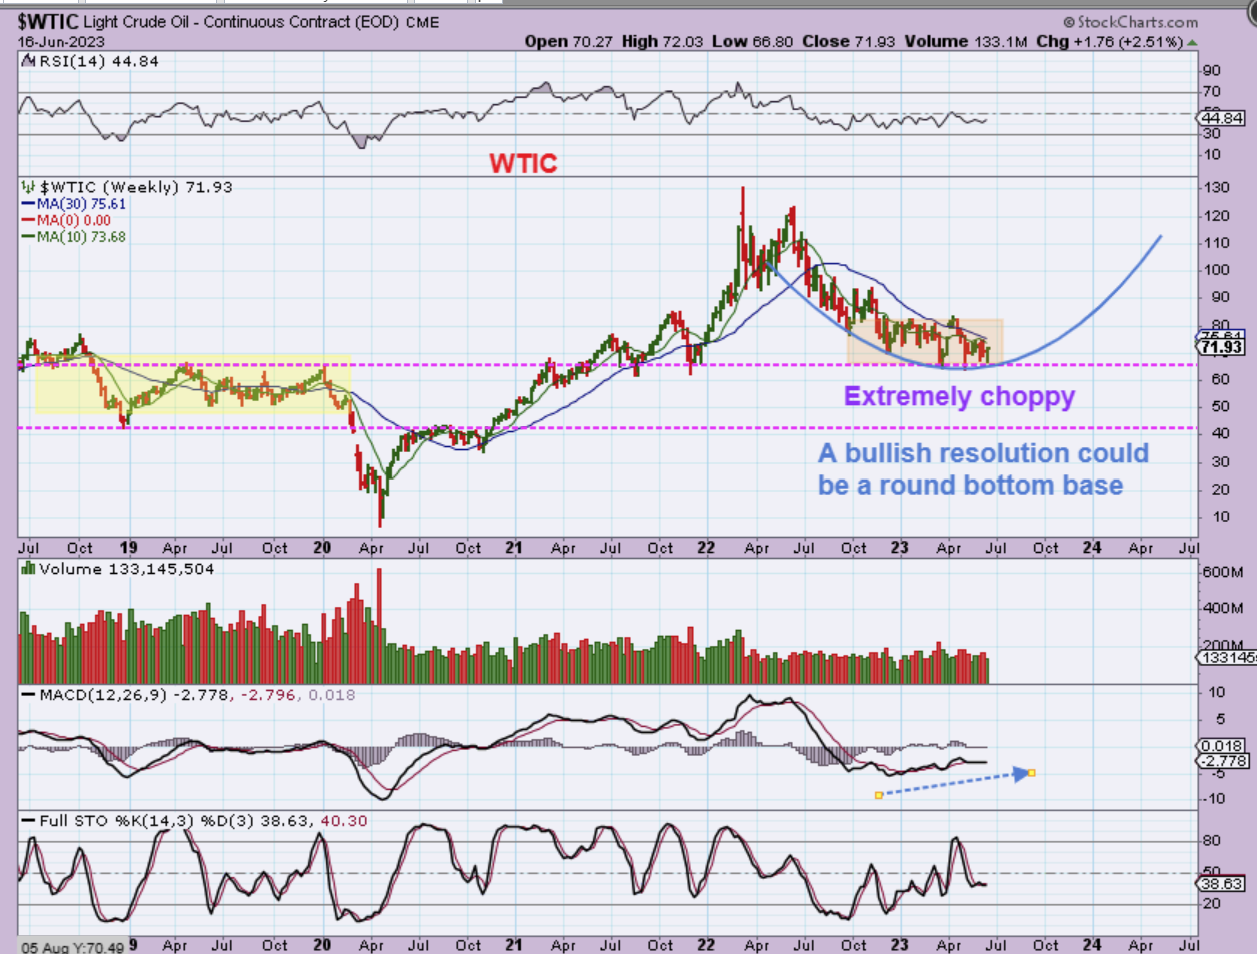
WTIC – Oil has been very choppy as it crawls along a possible support area. oil stocks have been a little more bullish than Oil, however Oil MIGHT base here and then rally, because…
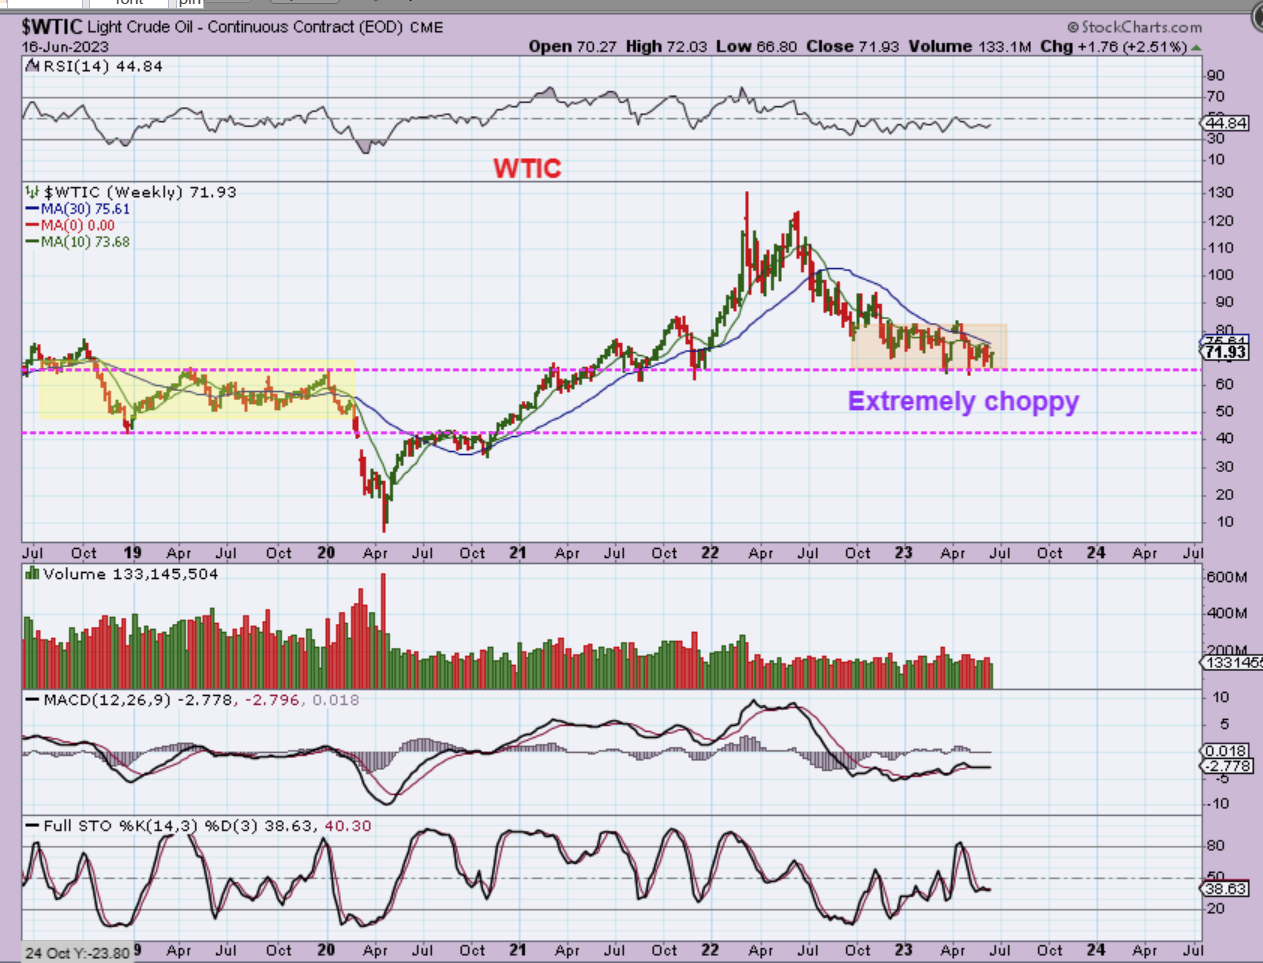
I can easily see what looks to be an curve forming. If that were to continue, we’d be forming a massive cup. As Oil climbed the right side, Oil stocks would probably rally nicely.
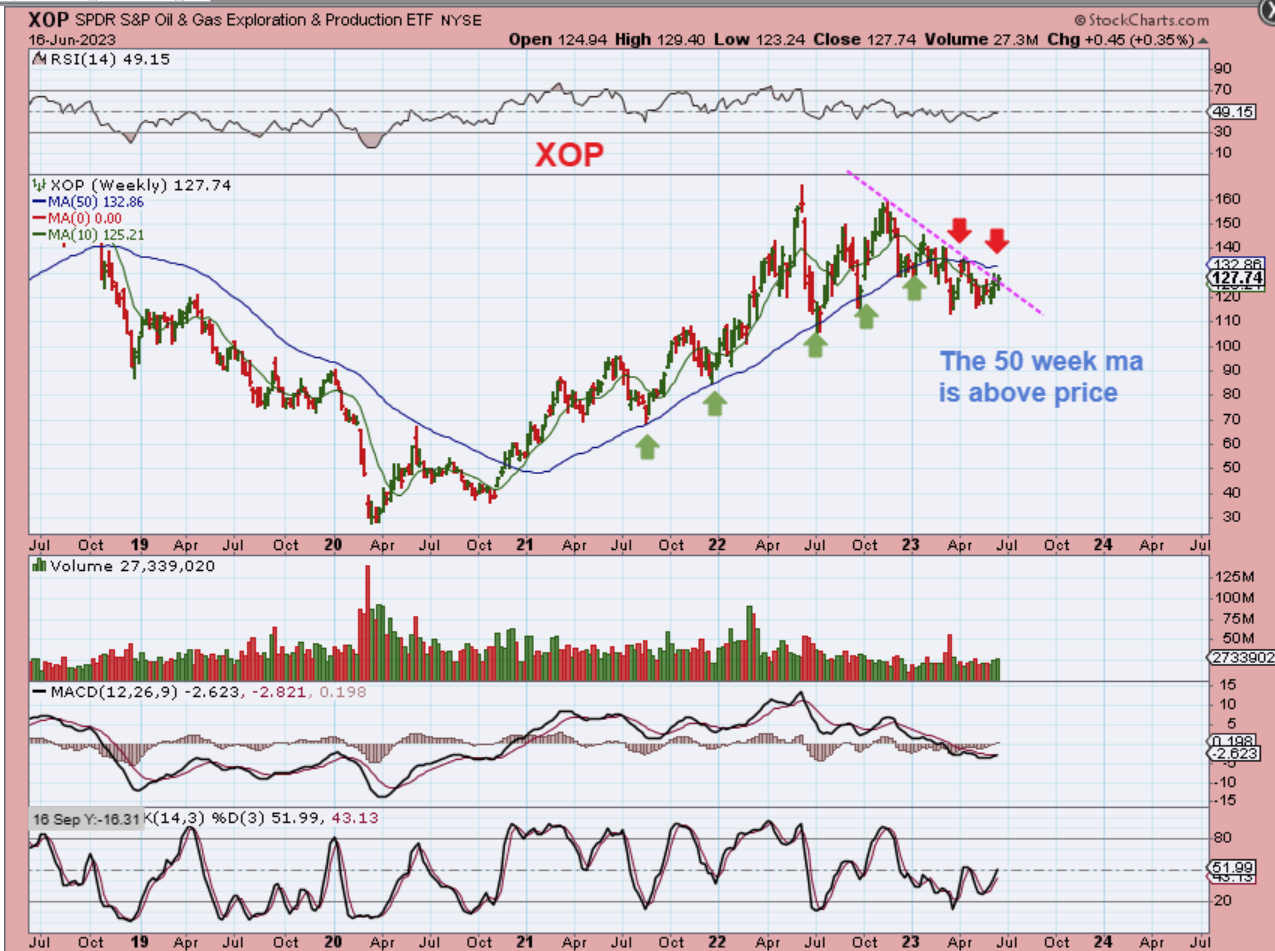
THE XOP is crawling along under resistance levels, but a break of the downtrend line or 50 week ma should lead to a bullish upside move. For now- Oil and Oil stocks have been frustrating and choppy, but that may change with this pattern setting up.
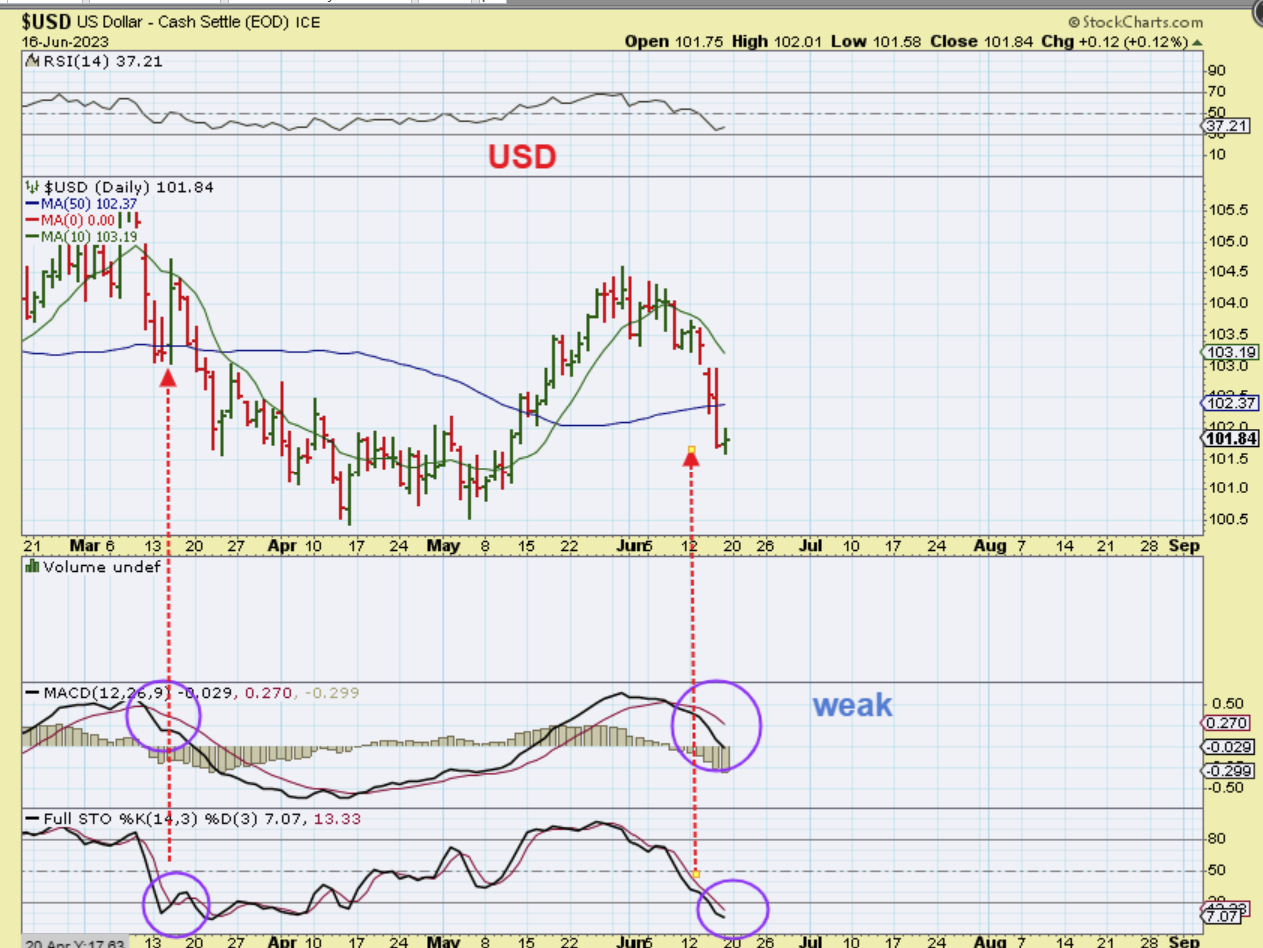
THE USD was rallying relentlessly in May, but it is now starting to lose its strength. It sliced through the 50sma. Will it out in dcl, or bounce and continue to drop? In March it had a 1 day VERY STRONG ‘up day’ (red arrow), all the way to the 10sma. That looked very strong, but then it just rolled over. At that time:
1. The MACD looked like it does now
2. The stochastics was oversold.
3. It lost the 50sma, regained it, and then dropped and Gold rallied.
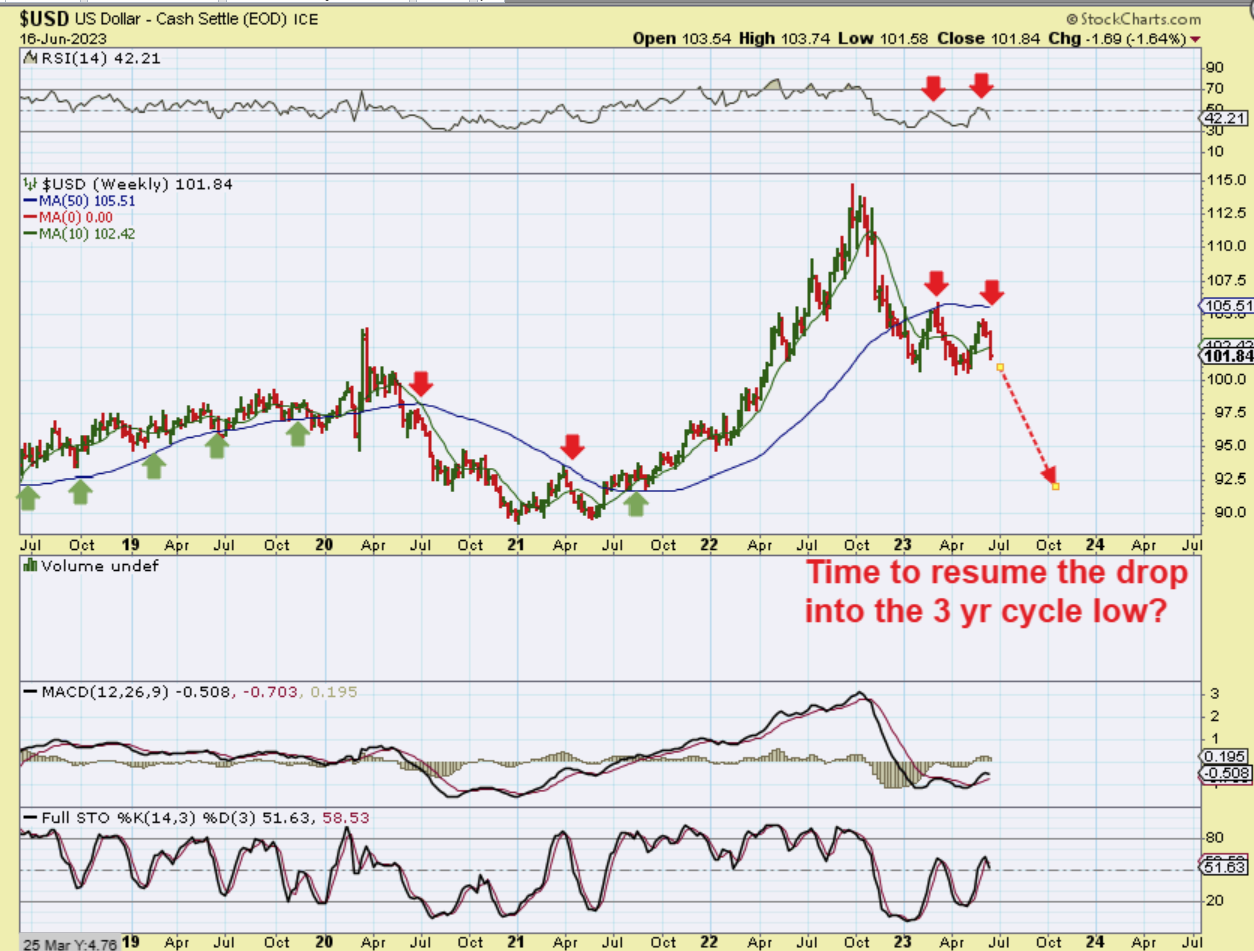
THE USD WEEKLY CHART actually looks very similar to the Feb March rally too. The blue line is resistance if the USD bounces. At the very least, this is showing us that no matter how strong the USD looked during that Feb or May rally, it can fall just as quickly. So the USD dropped last week, and…
.
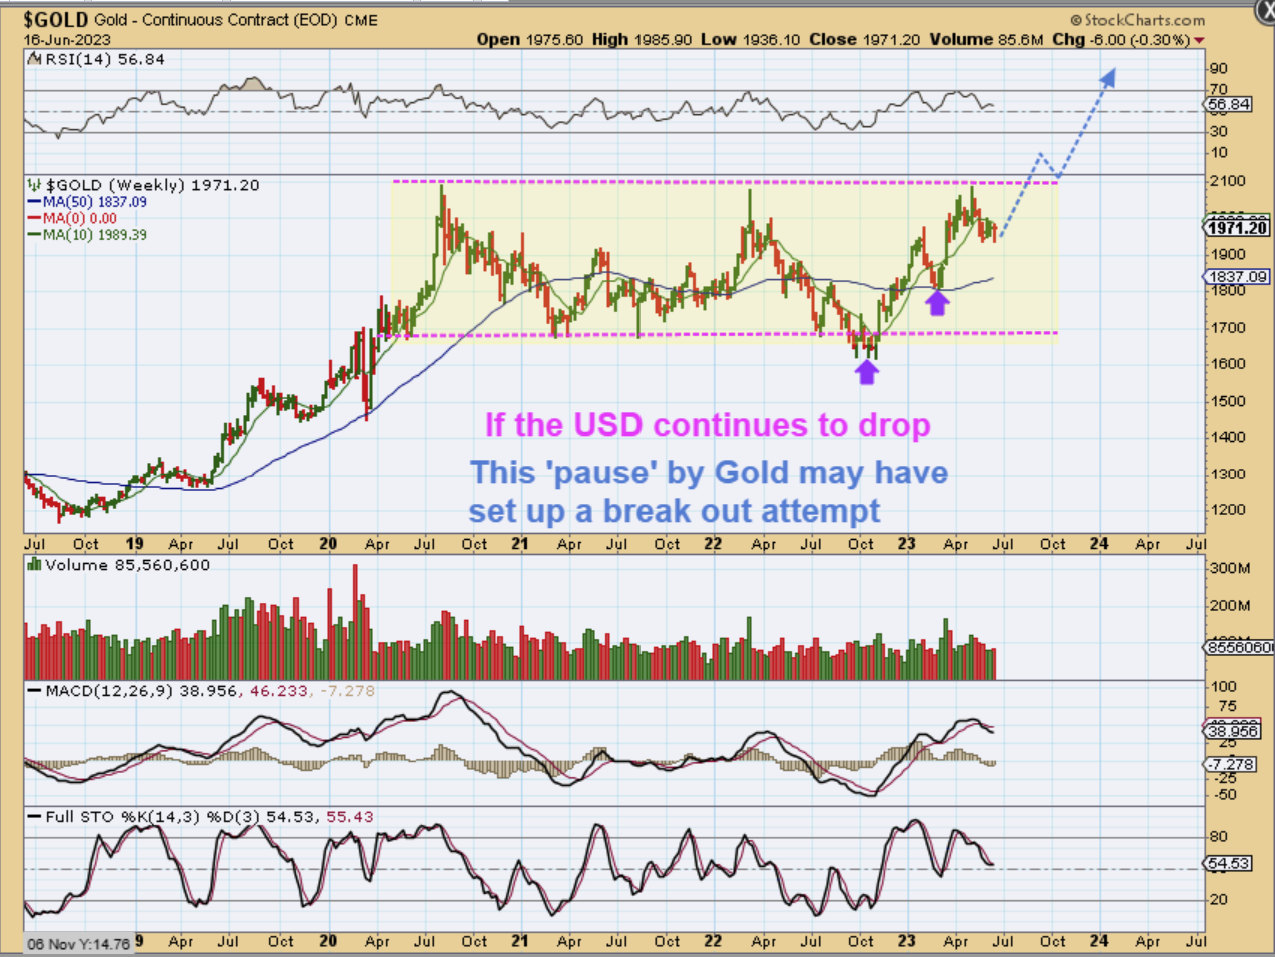
GOLD ran higher last week as the USD dipped lower. It held up just under the 500 Fib Number. A break above the 50sma has to be viewed as bullish and could indicate that the USD is just going to continue lower into that 3 yr cycle low.
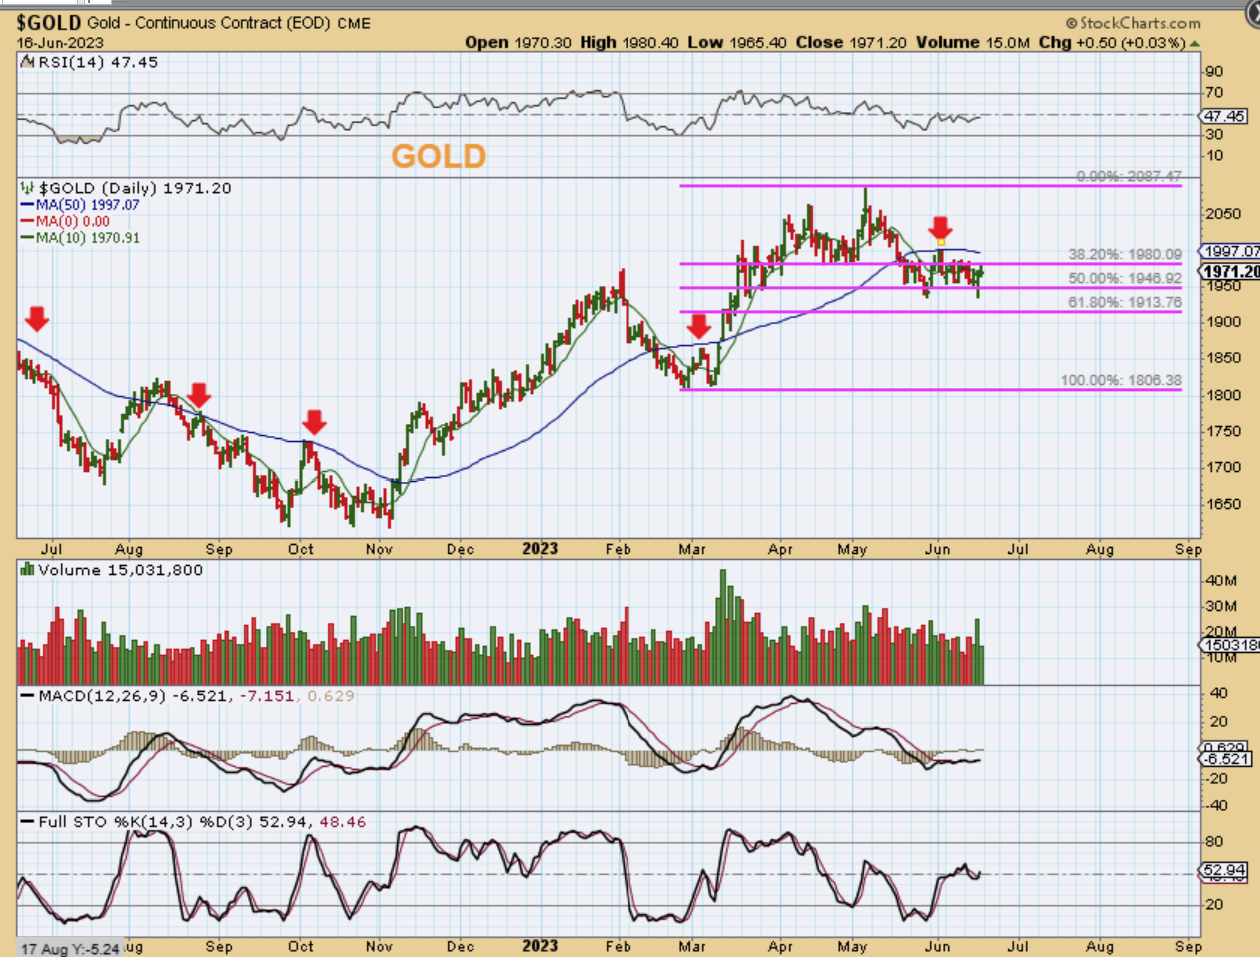
If GOLD drops as the USD bounces out of a dcl, then we could have a drop now in Gold. It could seek out an ICL at the next low or even into an August low (ICL) as drawn here. We have to let this play out with the USD and see how high the USD can bounce.
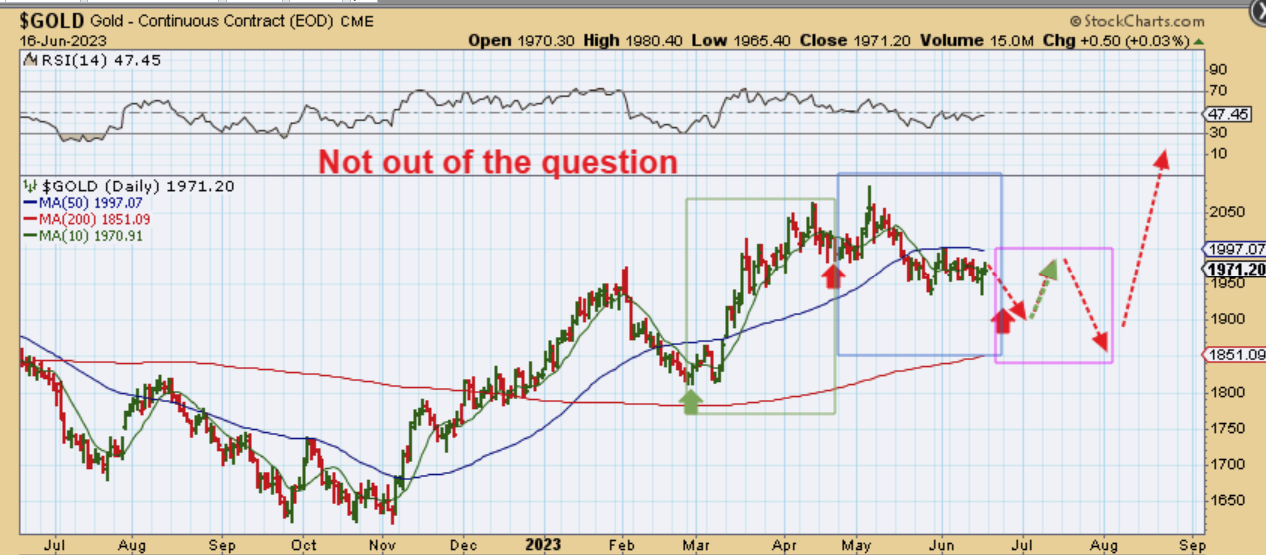
The Big Picture for GOLD is still on track. Gold has pulled back from all time highs and looks to be preparing to break out when this pullback finishes up.
.
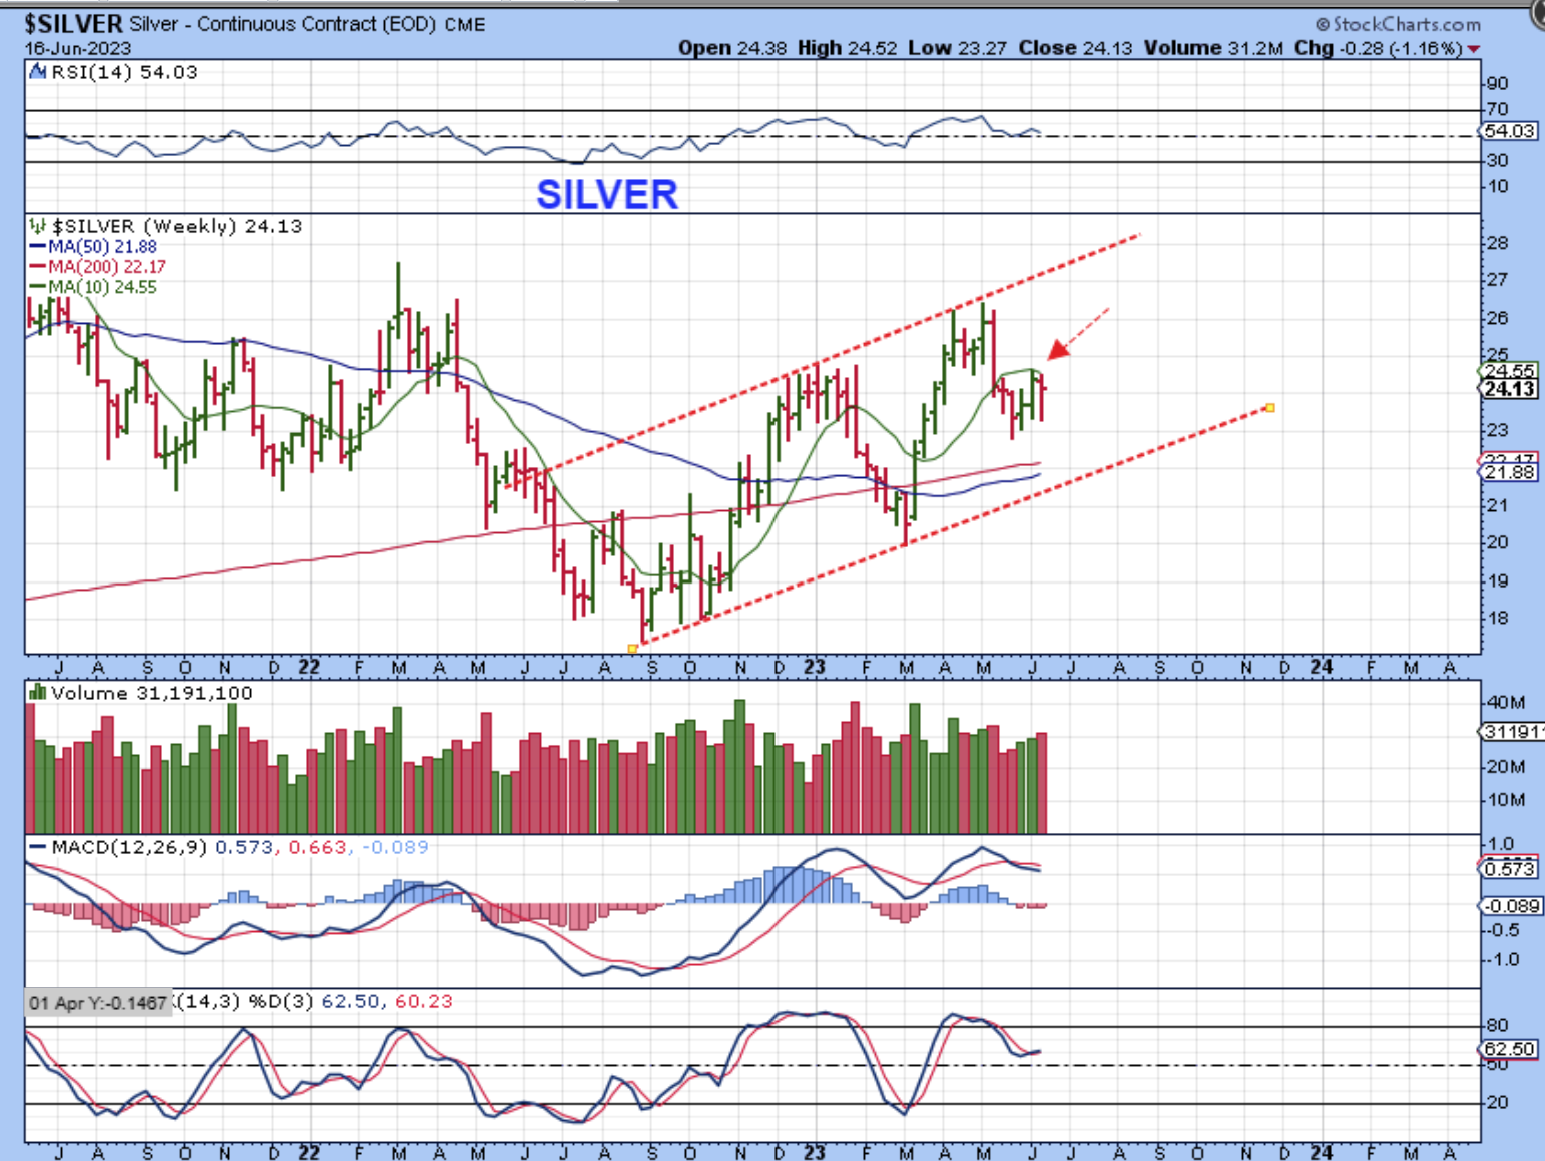
SILVER is right under the resistance of the 10 week ma. If it breaks out, that should be bullish and lead to a rally, but a bounce in the USD should drop silver and may lead price to the lower channel line. (50 & 200 week ma as support)
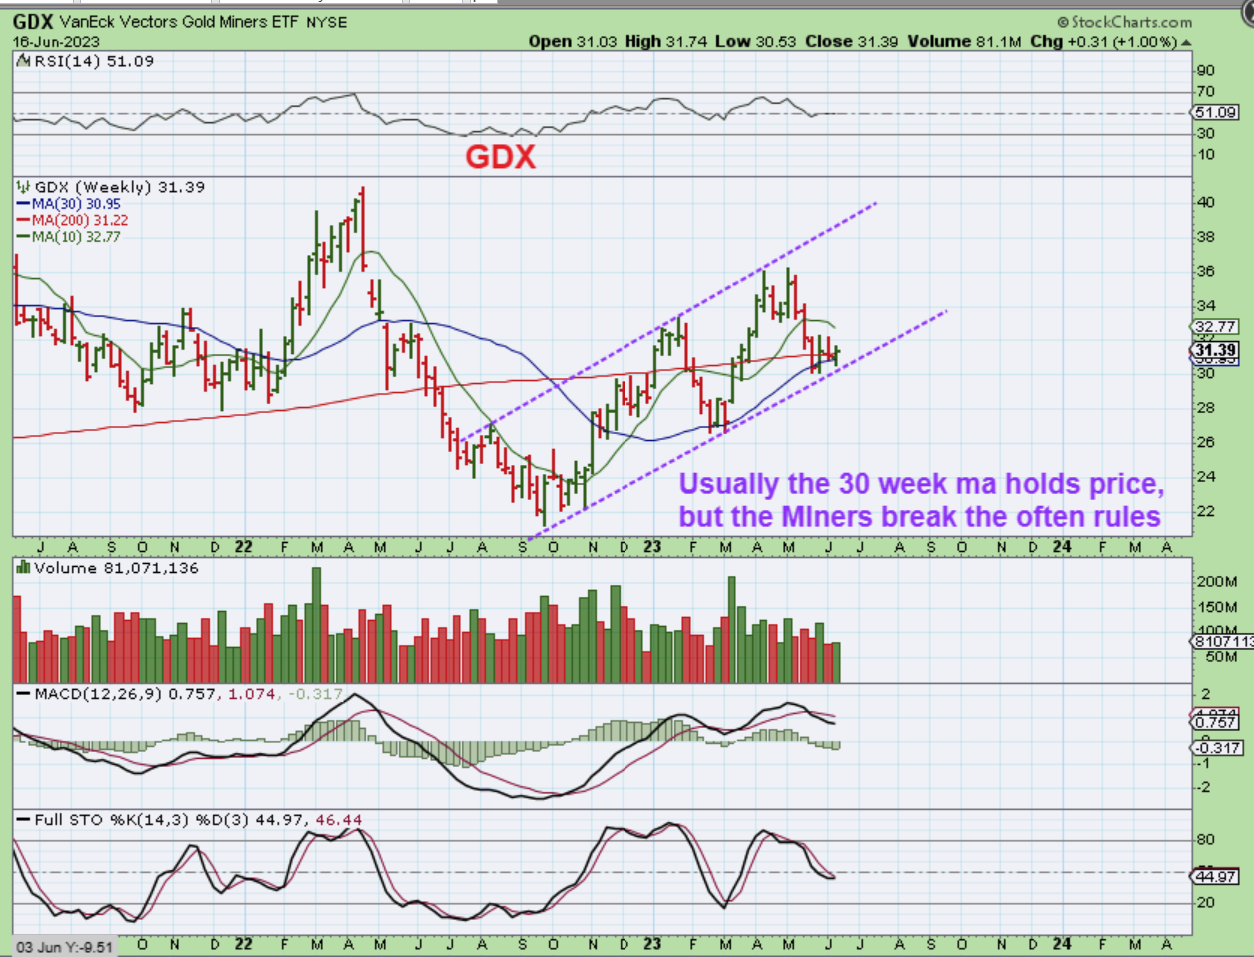
The GDX Weekly is set up differently than Gold and Silver. GDX is already right at the lows of a channel, and it is also already down at the 30 week ma & 200 week ma. It would seem like this should be a major support, but I don’t see how GDX could hold up if Gold & Silver drop, so at this point we need to see what the USD is going t go and this should give Gold & Silver a push in the next direction.
.
I’m going to cover Bitcoin below. For those in the U.S., the Markets are closed on Monday, enjoy your 3 days off, but I think other countries will be trading on Monday. I’d be watching the USD, Gold, Silver, Miners , and I also can’t take my eyes off of the EV & Clean Energy plays. They are moving swiftly out of their bases. Feel free to post any observations in the commenting area under the report, it helps the rest of us with the day off to know what we may have missed. 🙂
.
Enjoy your weekend and thanks for being here everyone!
.
~ALEX
.
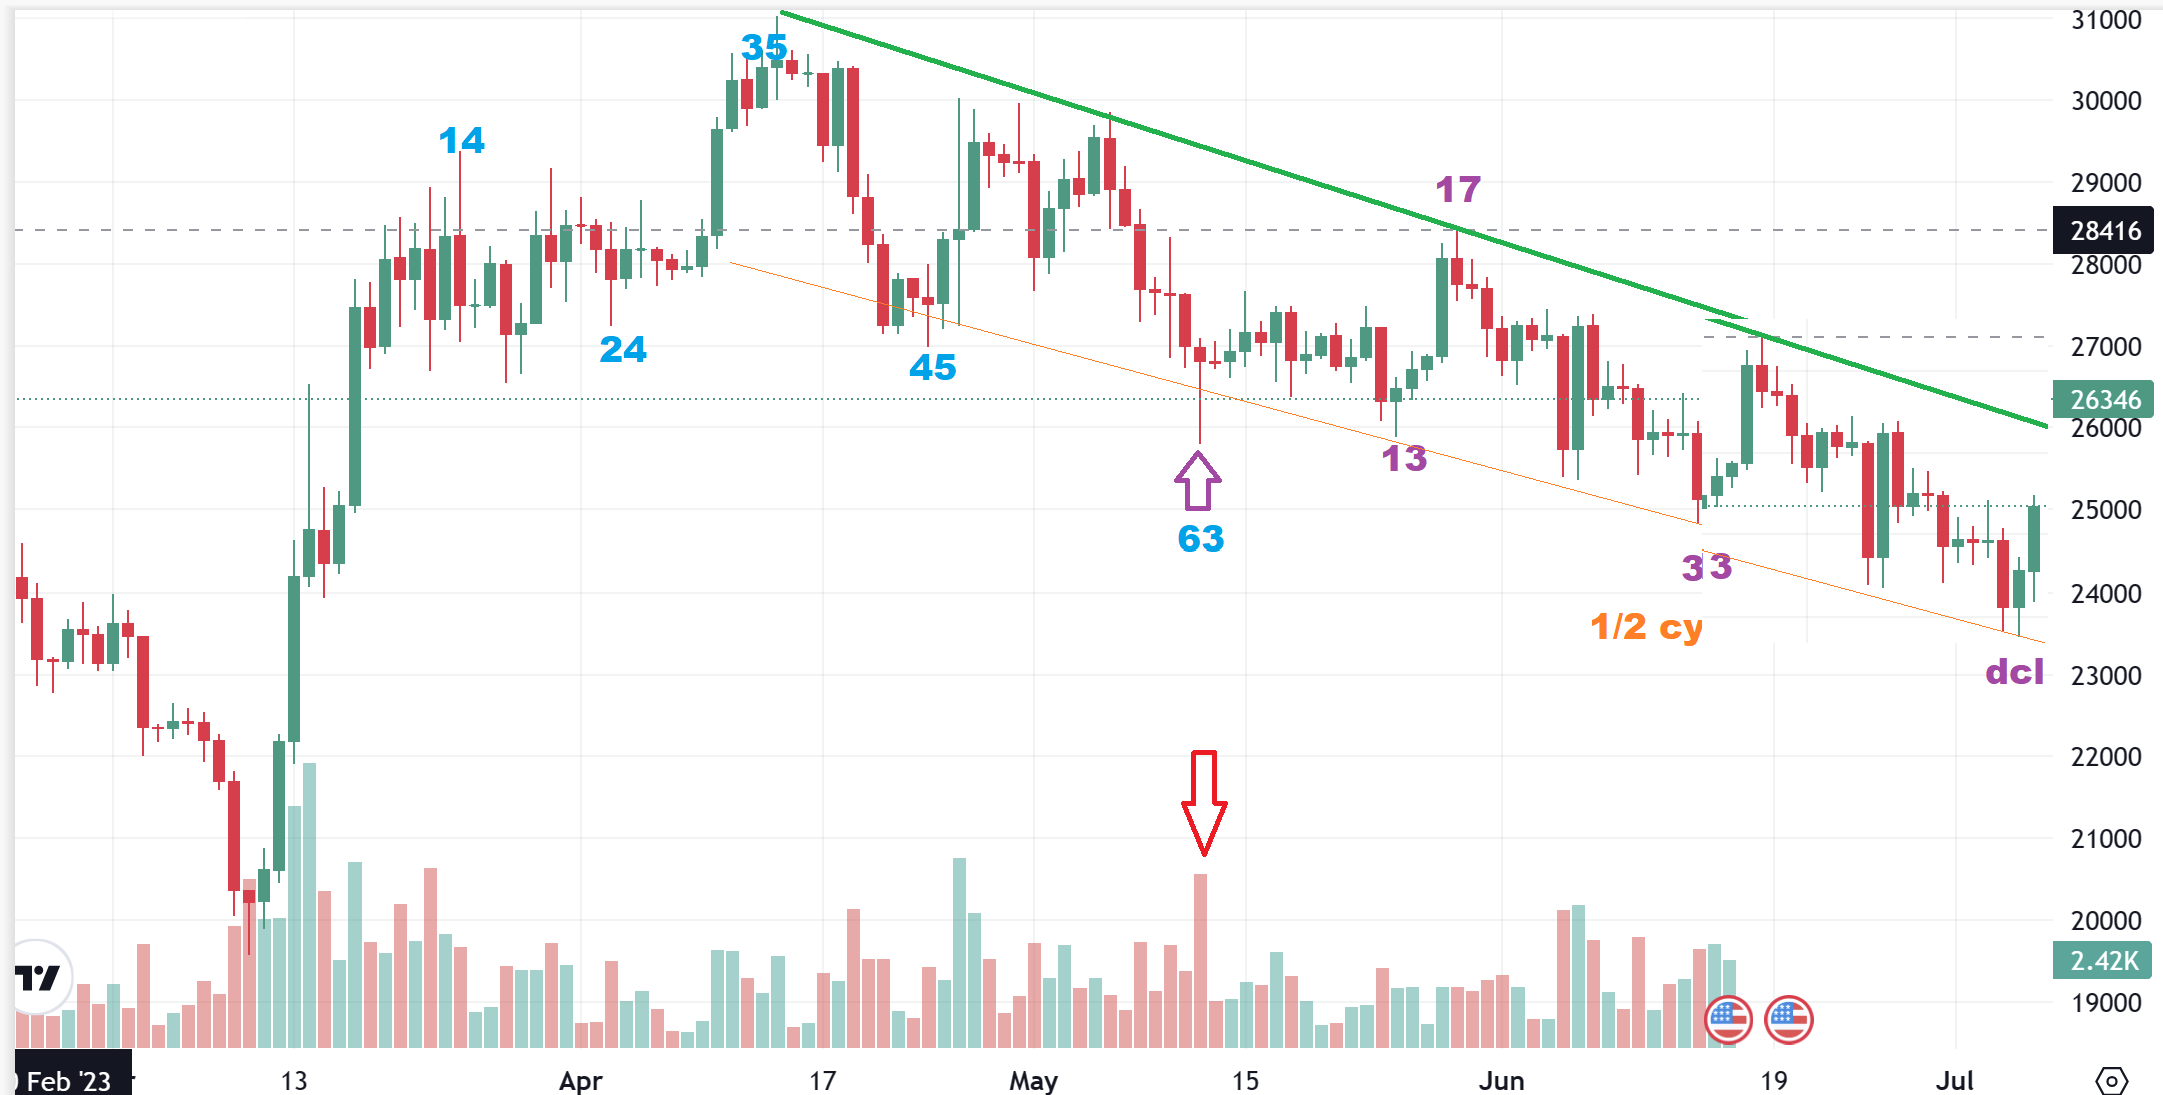
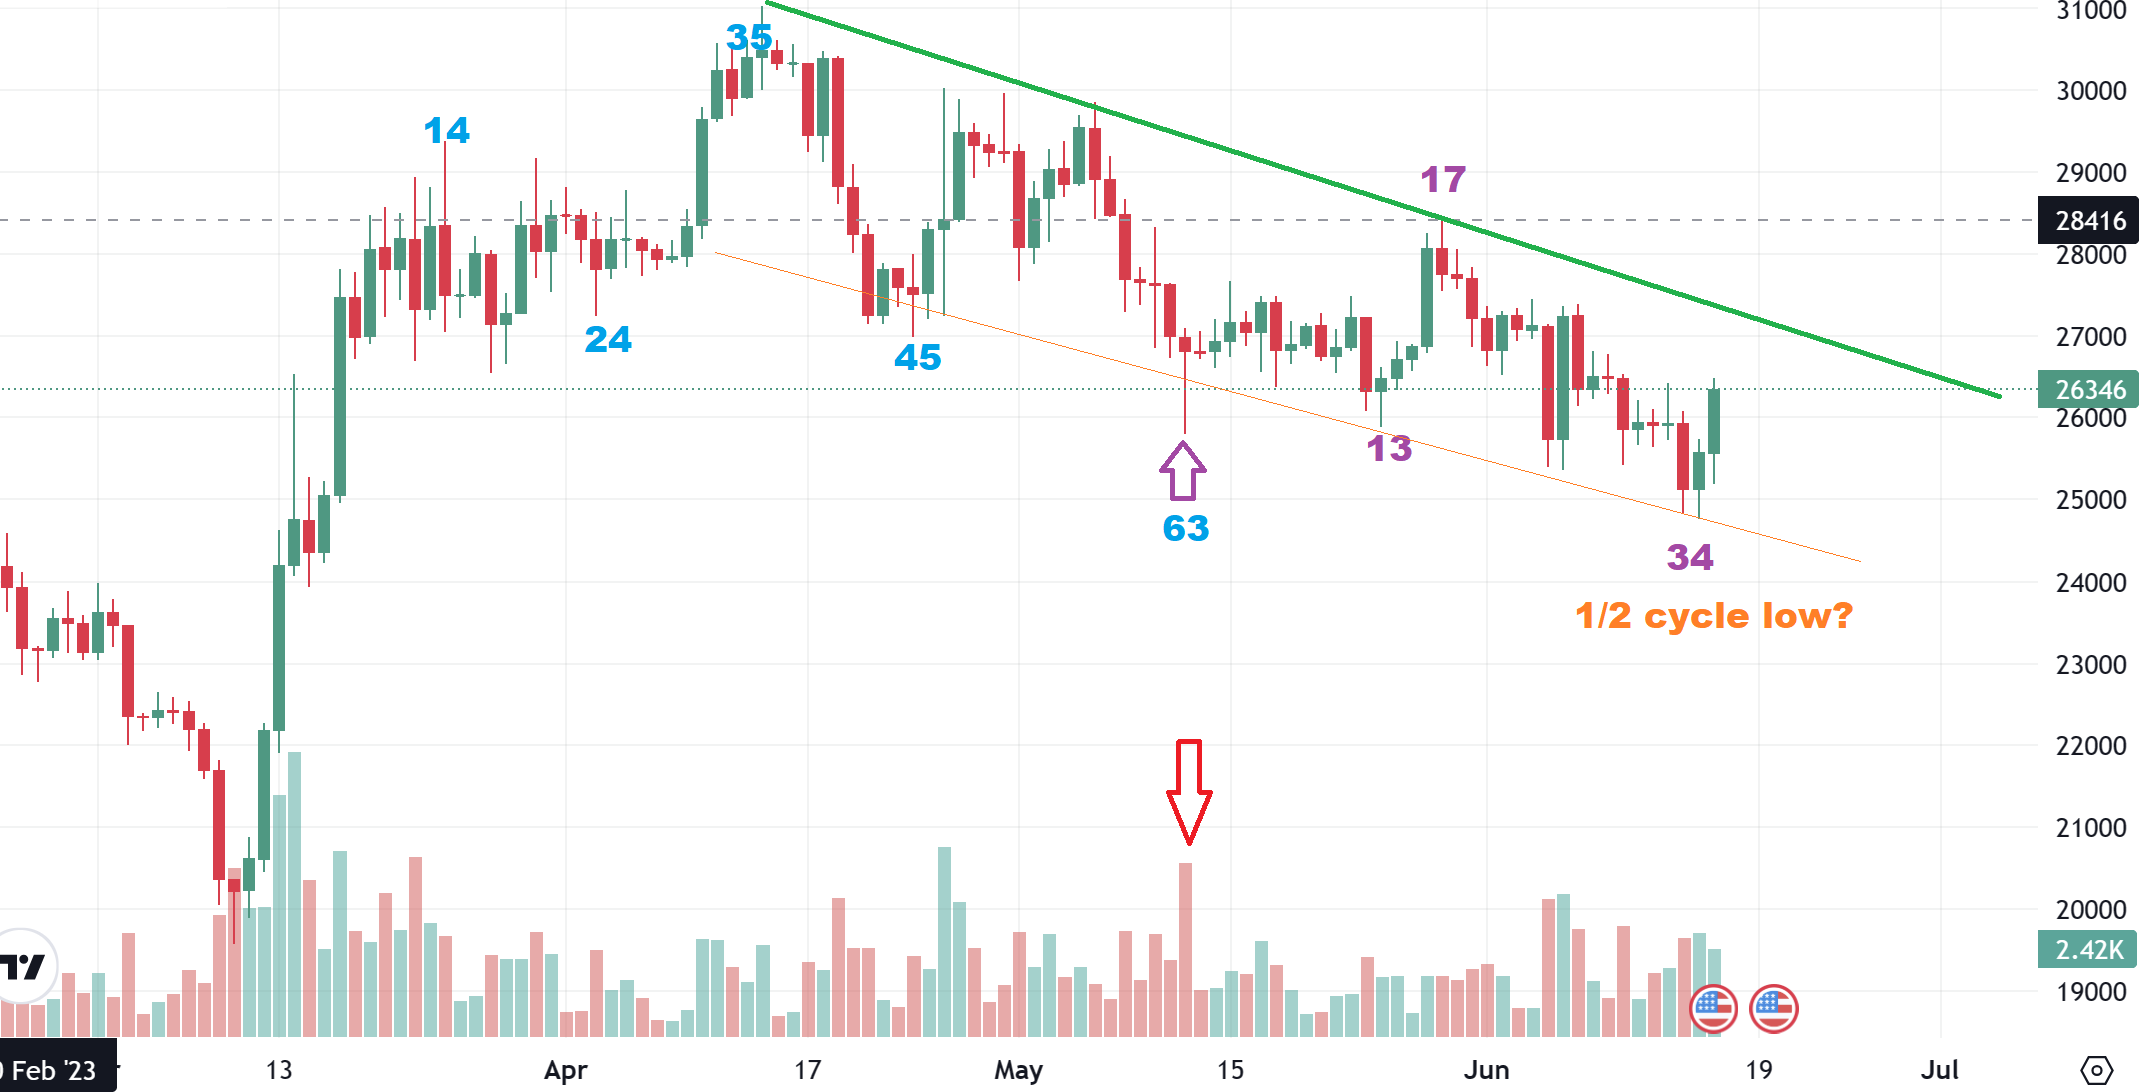
BITCOIN – We got a pop last week on Bitcoin, but I have pointed out that a downtrend in play and I think we just saw a 1/2 cycle low and not a dcl. I have mentioned 30 day and 60 day dips in Bitcoin as being fairly reliable, so I have placed the count here for you to follow where I think we could be.
.
BITCOIN – What I have done here is I have taken the price pattern from day 13 and simply copied it as a duplicate to extend the downtrend to a normal daily cycle length of 60 days. You can see that day 13, 14, 15, 16, 17 is exactly the same as 33, 34, 35, 36 etc. This would be what 60 days could look like when we are done with the choppy selling. HUT, HIVE, CIFR and others really popped with that reversal, MARA and RIOT really didn’t – so if you bought that low, just raise stops a bit, and we’ll see if that was THE low or if there is one more dip coming, like I think.