Thursday June 22nd – Dips
.
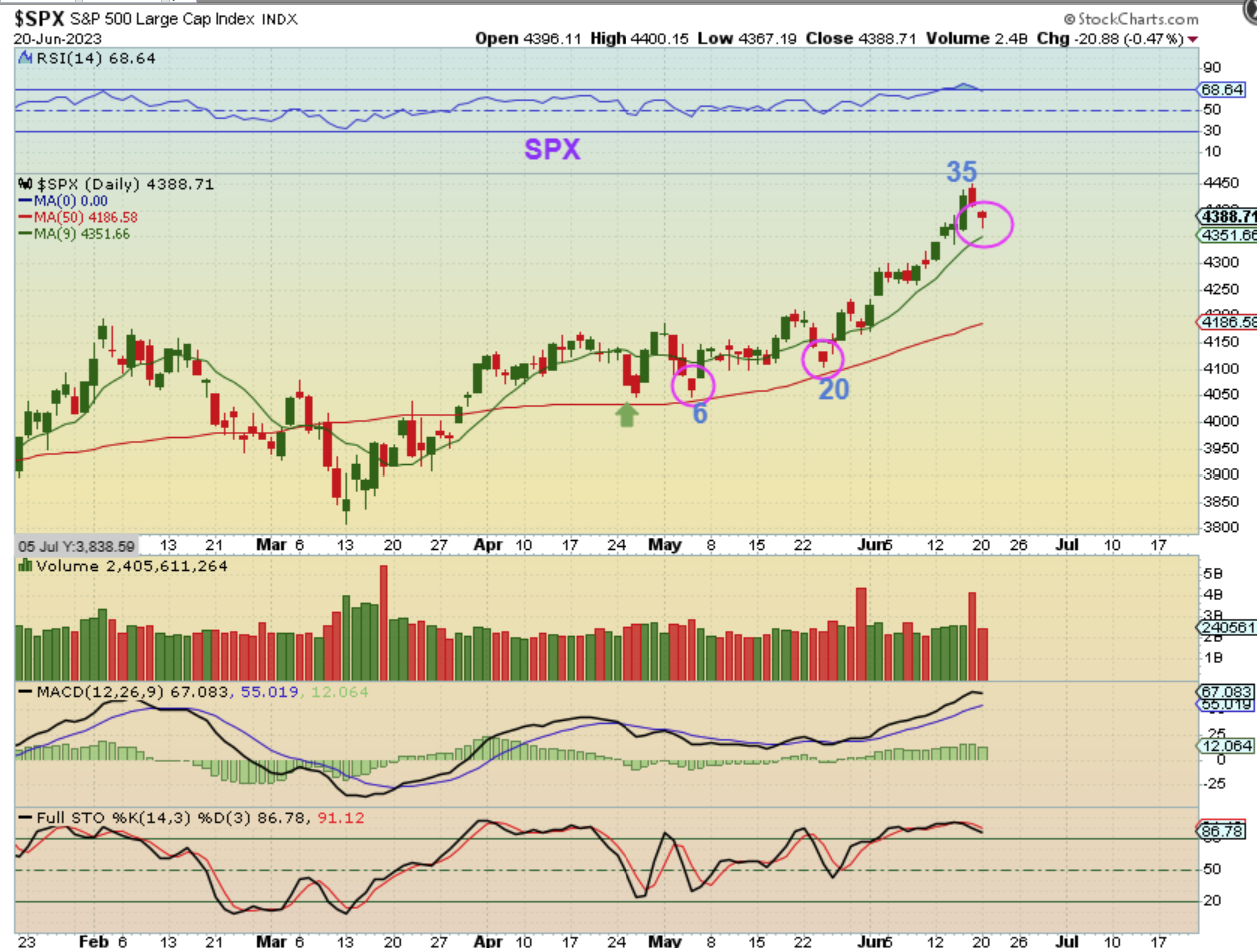
Yesterdays chart of SPX mentioned that on day 36, we are due for a dcl at any time. We did have this reversal candle on Tuesday, so the question was, “Could Bulls push it higher?”
.
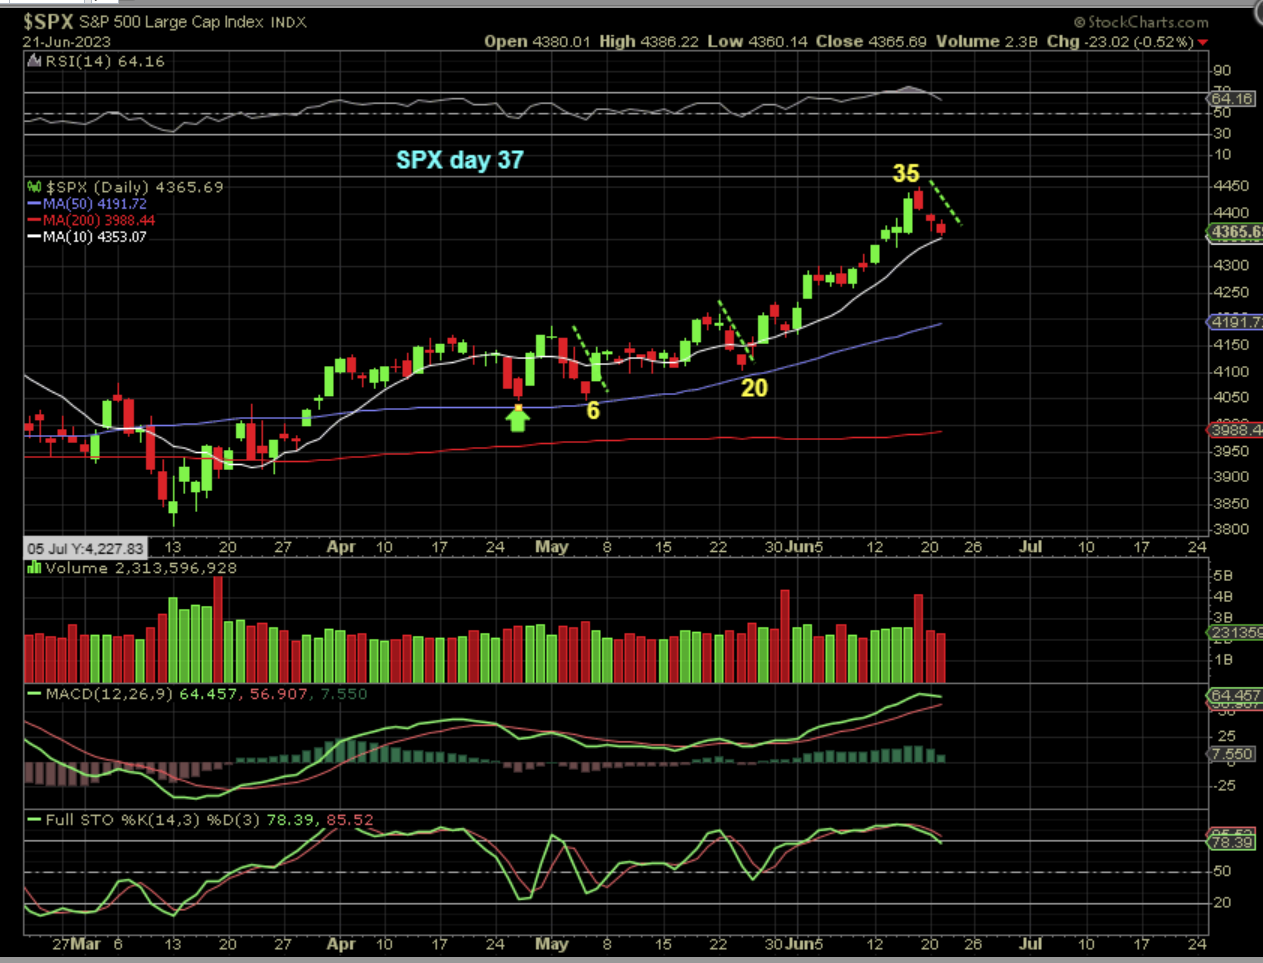
THE SPX dropped 23 more points, but it is still above the 10sm and the drop is now similar to the other recent drops (symmetry-wise). If we don’t bounce here at the 10sma, we have likely started the drop into the dcl at this point. The RSI and stochastics are overbought.
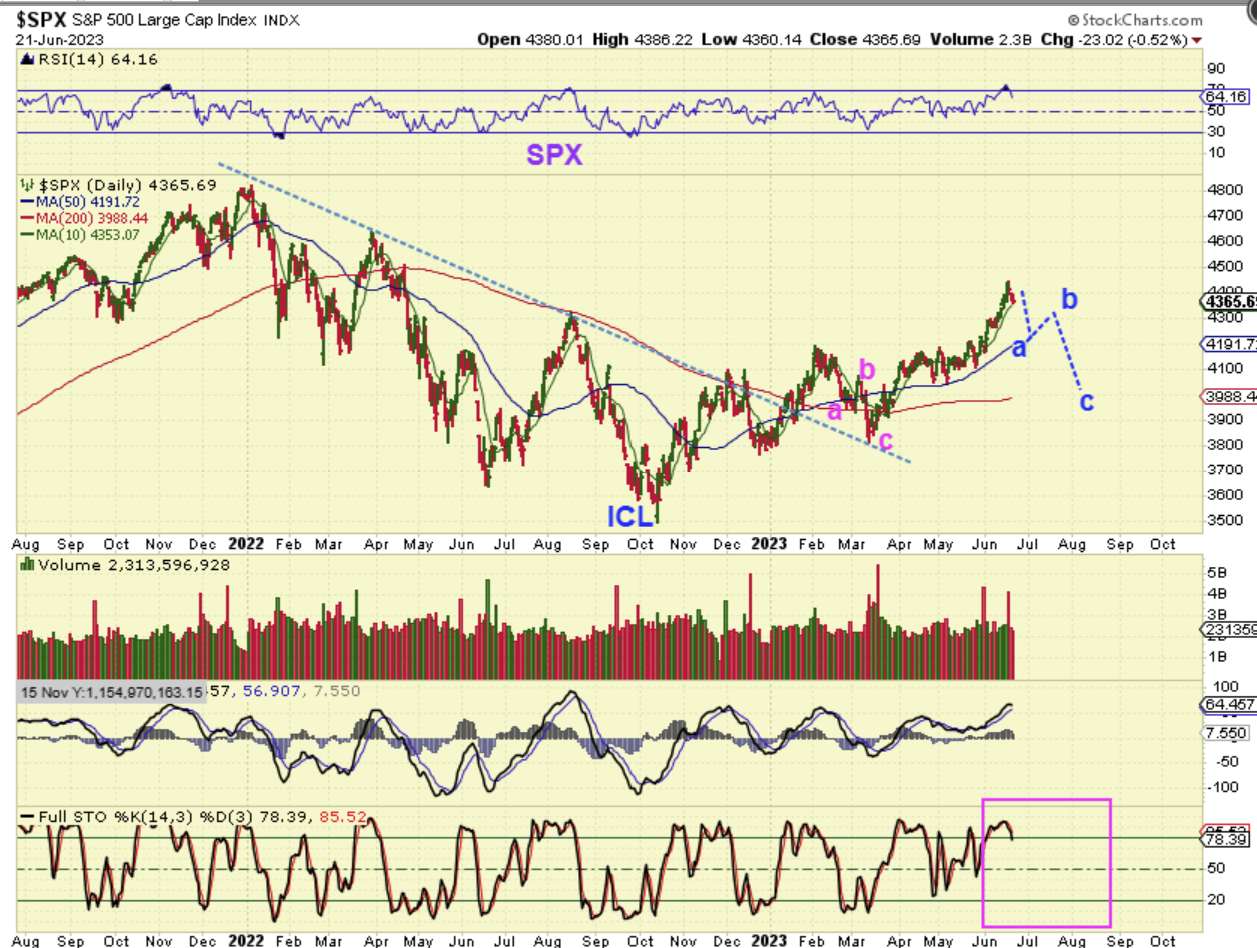
In the bigger picture, we also may be coming due for an ICL. For that to take place, we should have an a-b-c drop from here. That would be a dcl at ‘a‘, followed by a rally to ‘b‘, and then a dcl ( or ICL) at ‘c‘, and THAT drop to ‘c’ would be a STRONG BUY in August/ September.
.
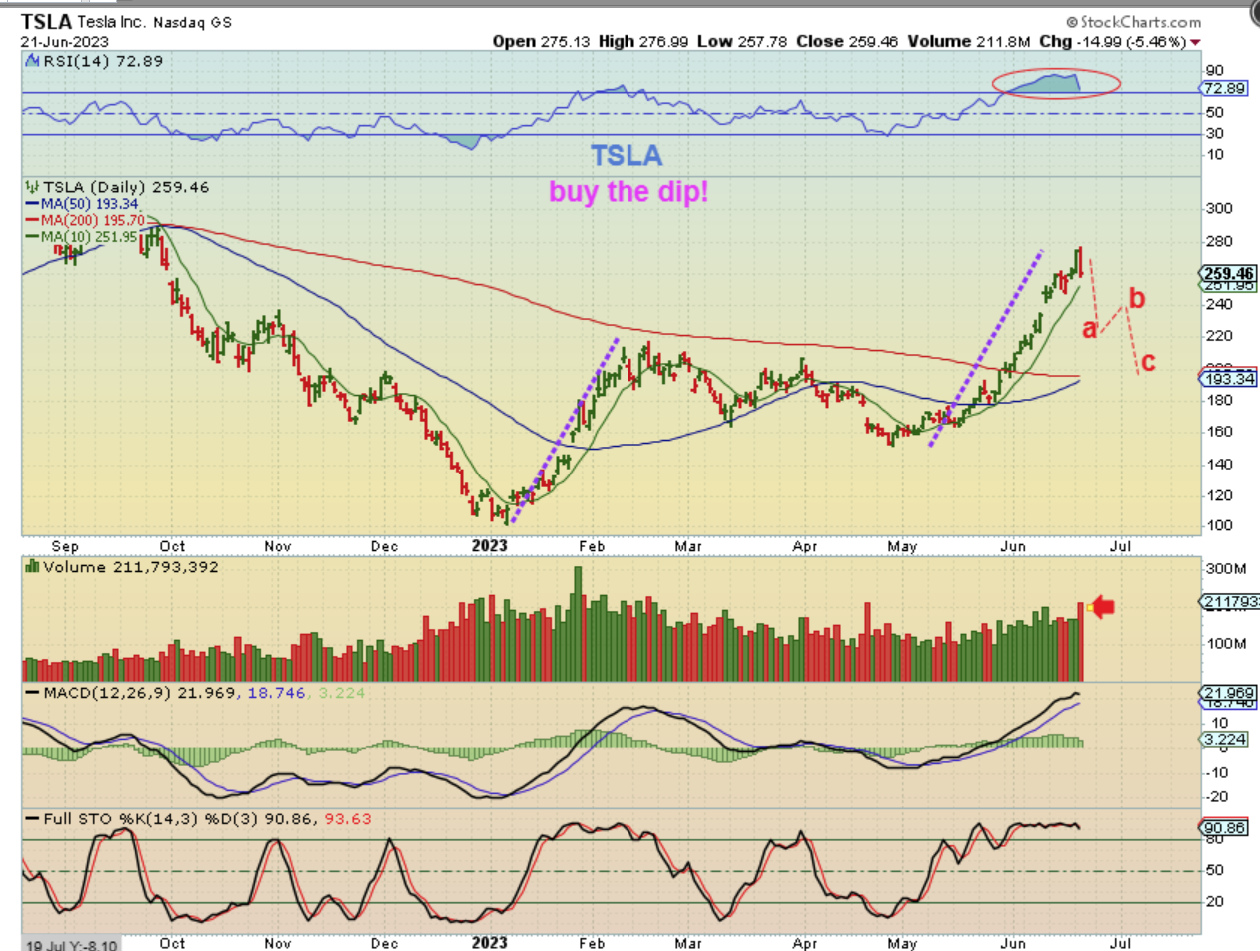
TSLA has had a very strong run, but at this point it looks like a high volume bearish engulfing off of the top. Also take a look at that overdone RSI. If this makes its way down to the 50 & 200sma in an a-b-c style dip, that should be a strong buy. This leg up has pretty much matched the first leg up from Jan lows.
.
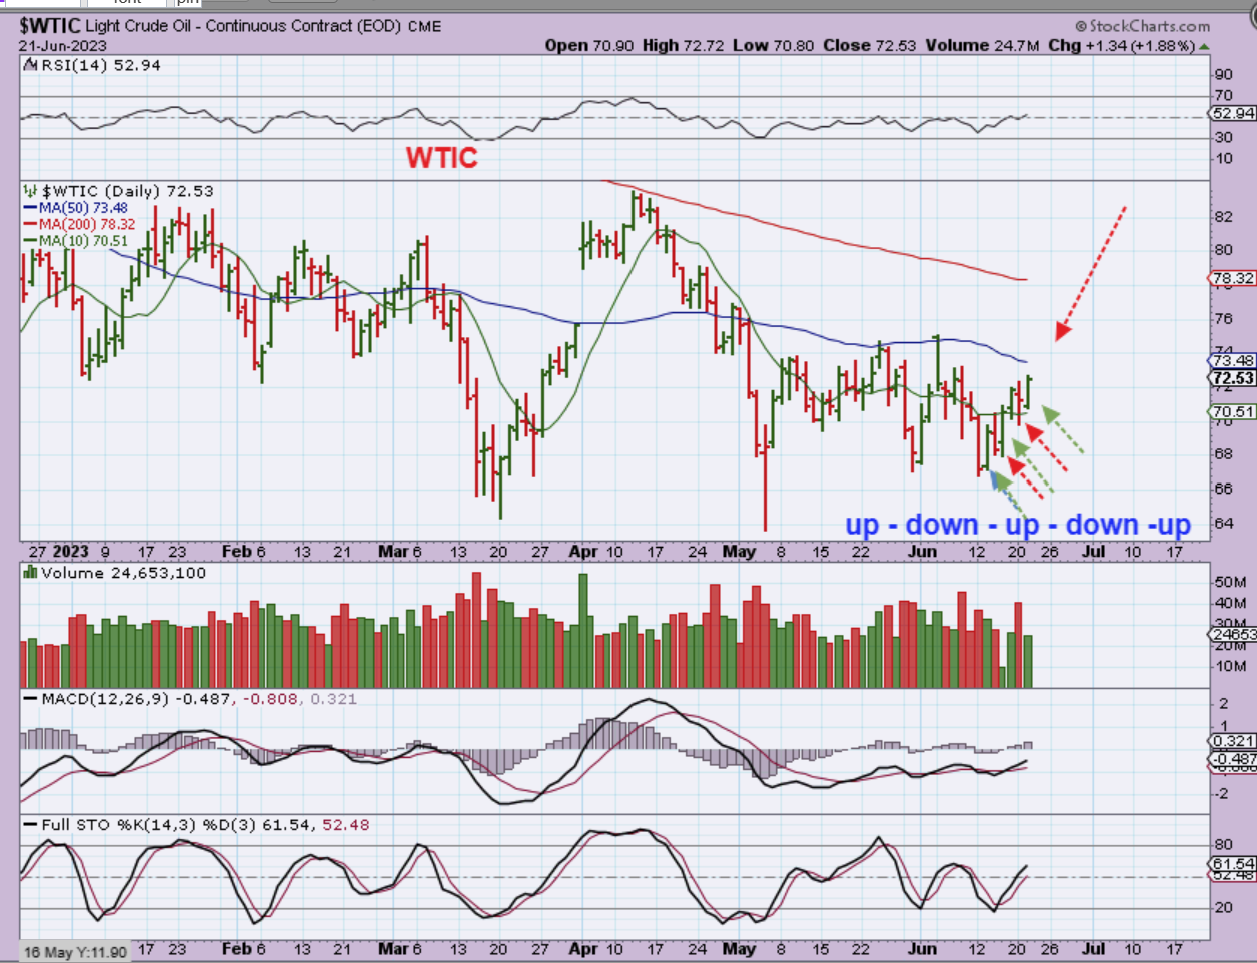
WTIC – Oil is choppy. Each day it goes Up, then down, then up, down, up. What will it do when it gets to the downward sloping 50sma? It is due to go down.
..
This was interesting.
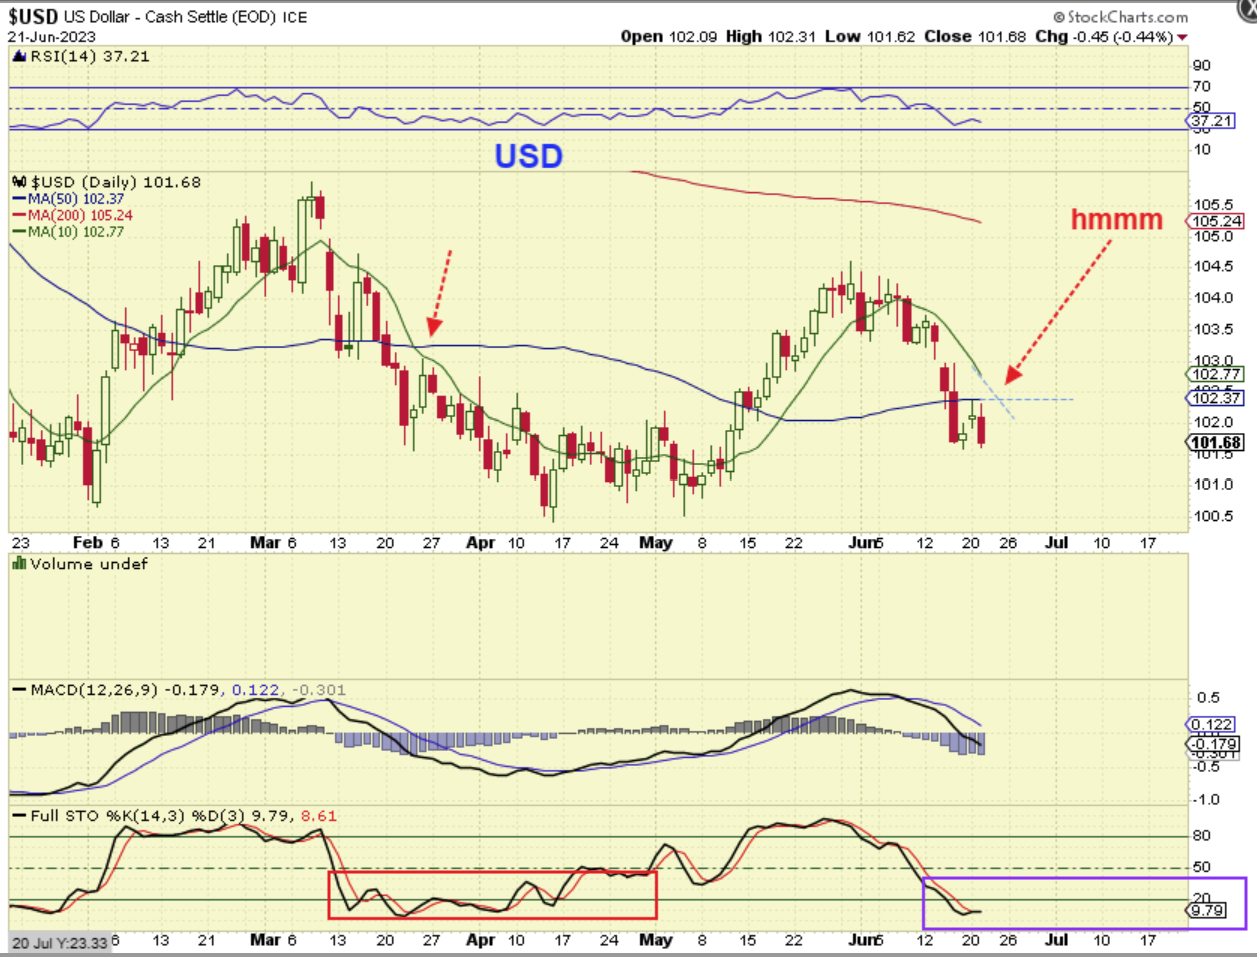
THE USD actually moved up to that 5o sma and then dropped. The USD was rejected. Is this sell off going to continue lower like we saw in March? Gold rallied when that happened (Banks failed in March), so let’s look at Gold. Did it Pop?
..
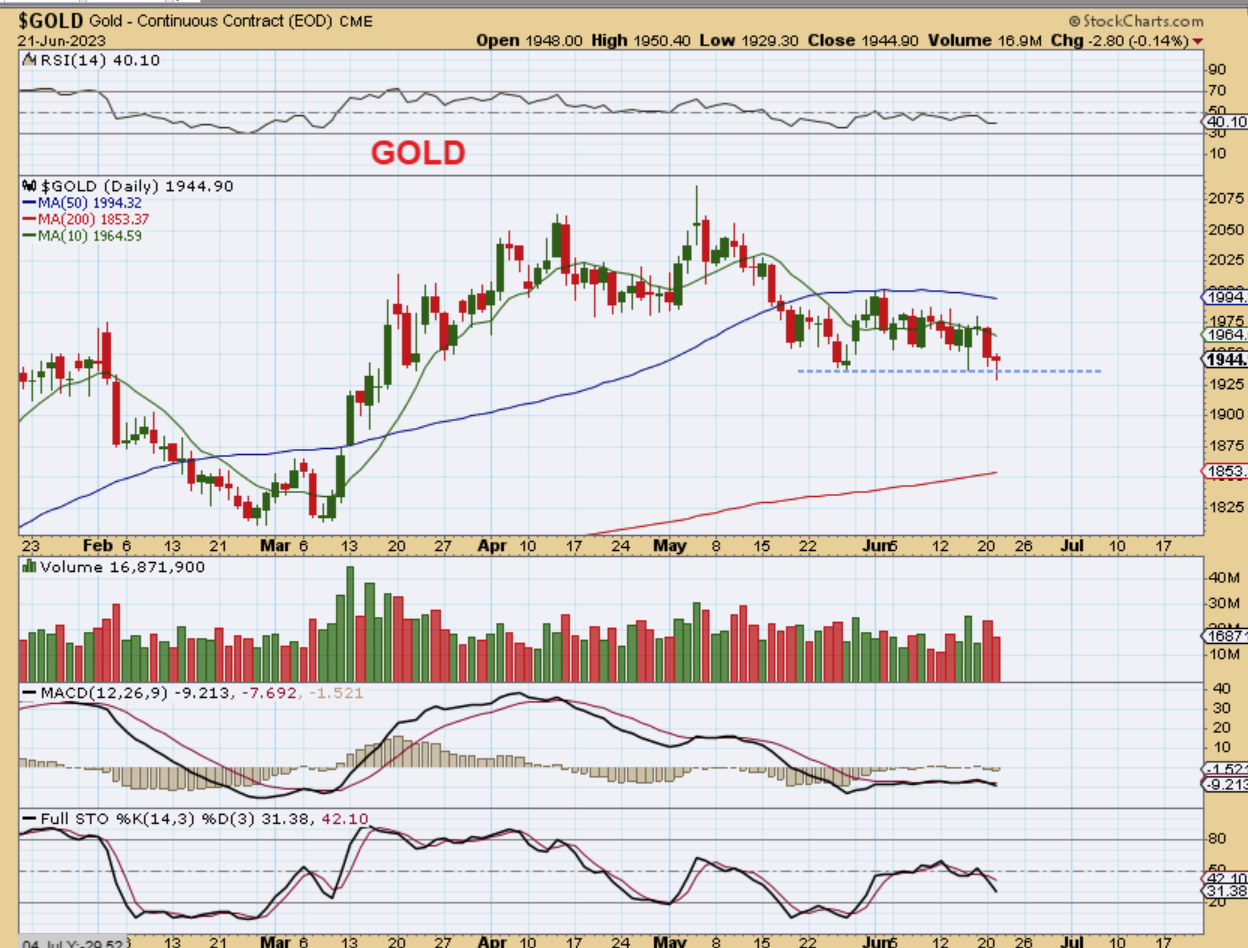
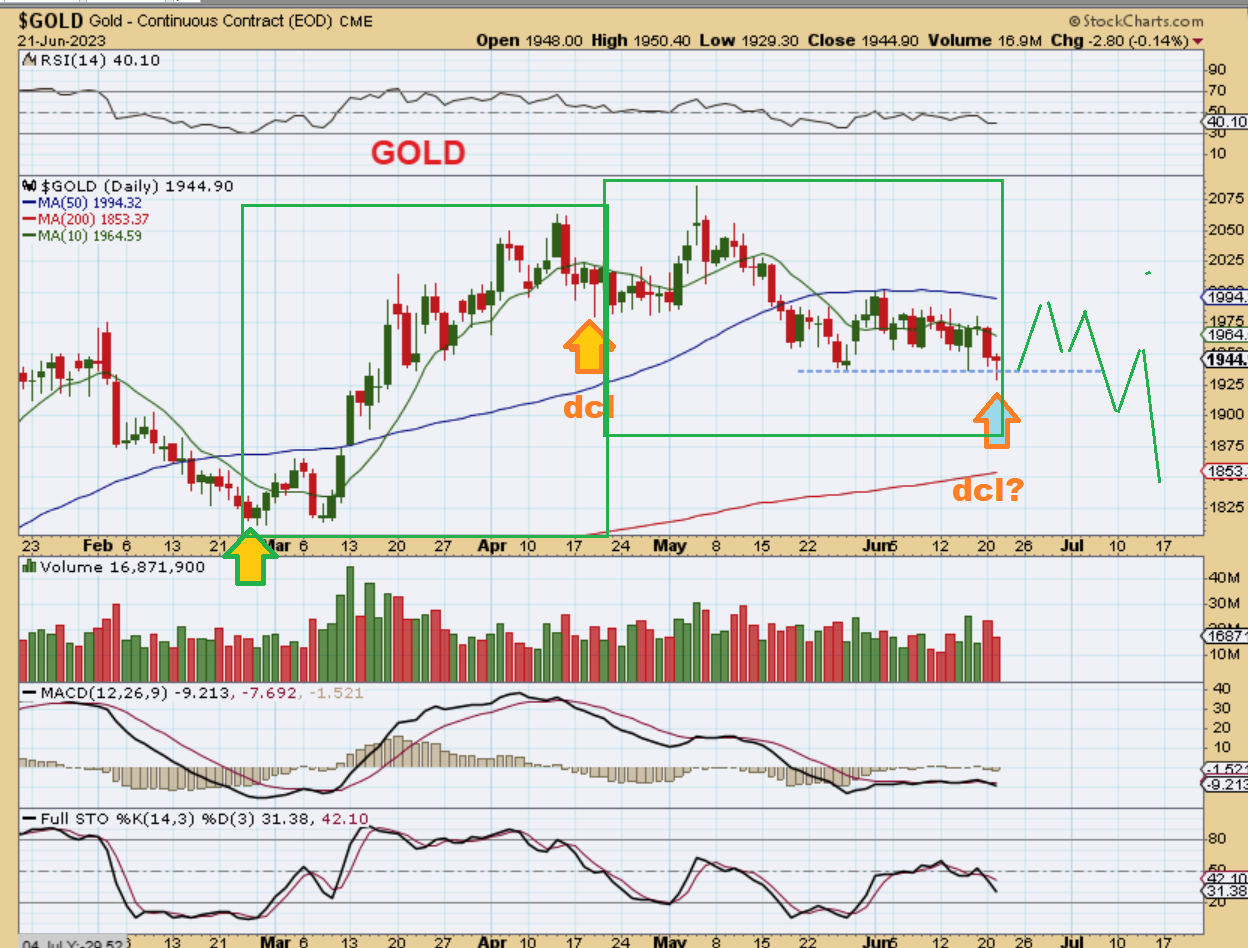
GOLD did not really Pop as the USD dropped, but it did drop to a new 3 month low and then it recovered. Could this be a dcl? Yes, it could, but we also may have seen an early dcl in late May. But before we get too excited, let’s take a look…
.
GOLD had a dcl in Mid April. Was that reversal to the 50 sma about 17 days ago a dcl? Maybe, but that would have been a bit early and yet this one would be a bit late. Either way, I still think that the final low would be ahead, so I drew it here as a drop to the 200sma (maybe a shake out). We really just have to wait and see what the USD does, but the 50sma will likely hold Gold back.
.
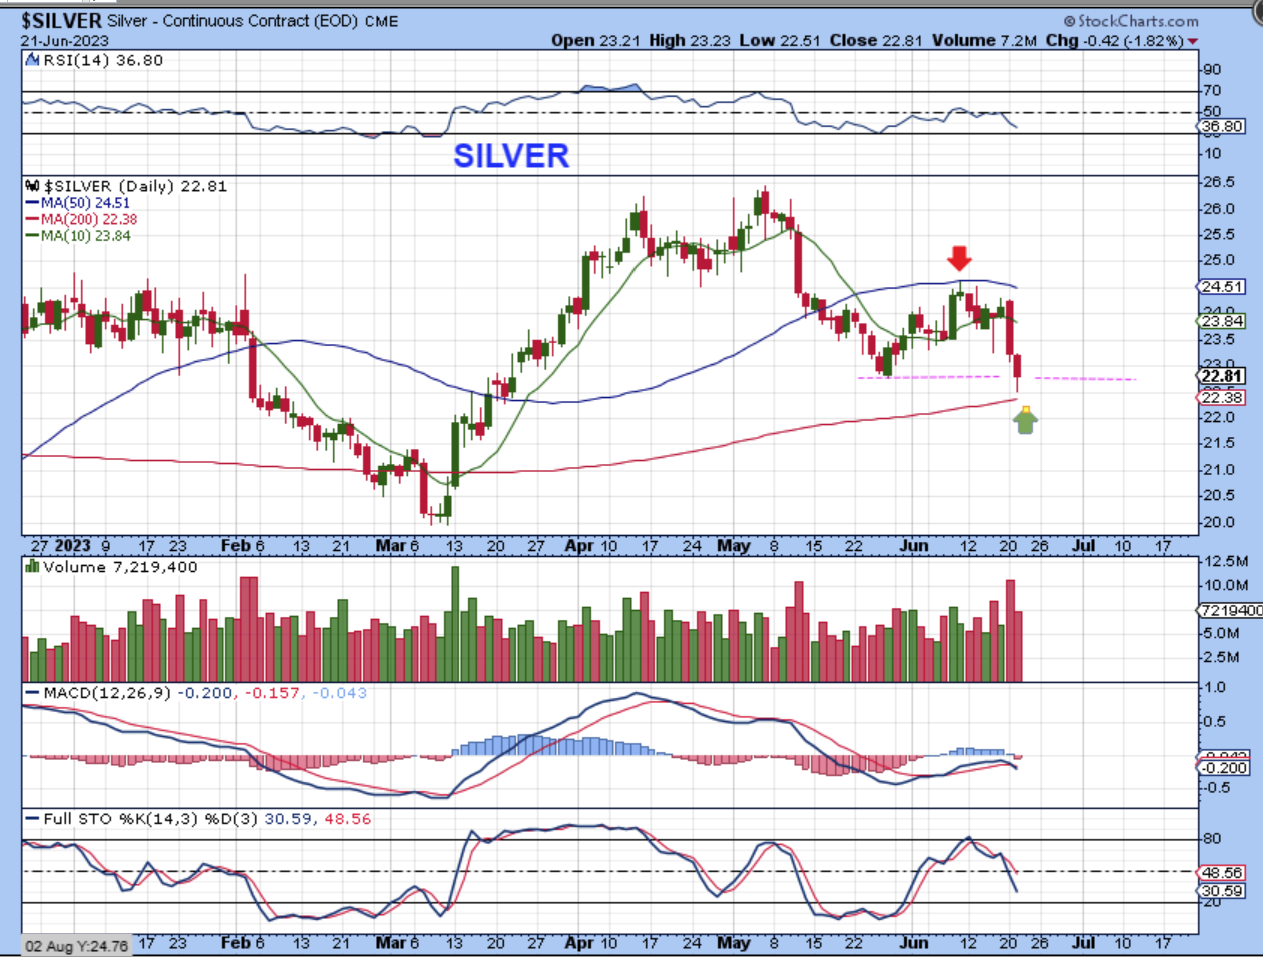
SILVER actually looks good here, doesn’t it? We had a reversal above the 200sma as that USD dropped on Wednesday. Silver could run to the 50sma if the USD keeps selling down, and then we’ll see what happens from there. These kinds of reversals are always considered a buy with a tight stop, because the risk / reward is worth a try. I did not buy it, based on cycle timing and the fact that its not oversold, but it could be bought as a reversal with a stop at the lows.
..
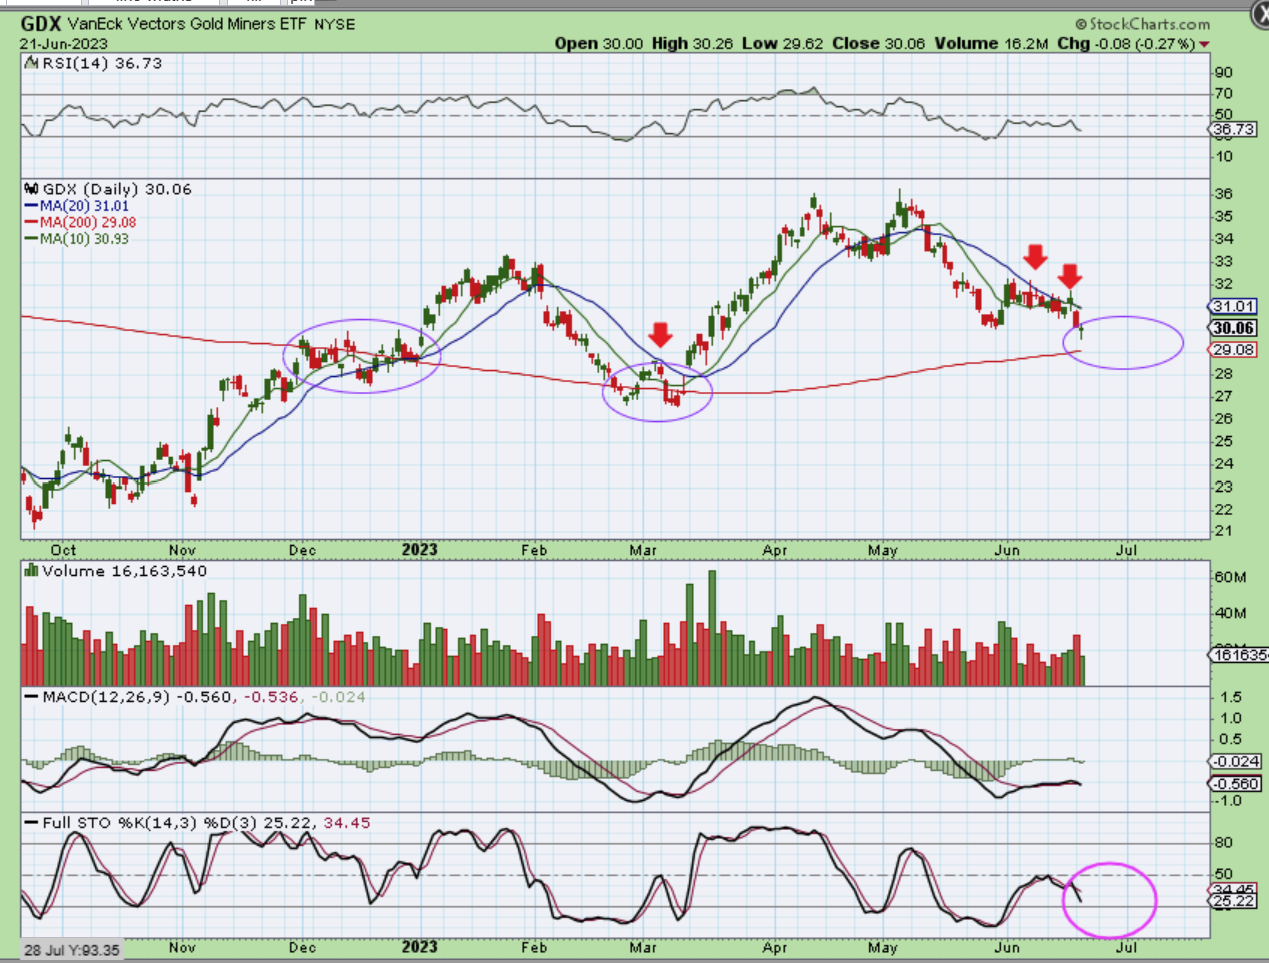
GDX also dropped to a new 3 month low & then put in a reversal. Again, I tend to think that it is not the right timing for a dcl that rallies strongly, but these reversals are considered a buy with a tight stop under those lows in technical analysis. I did NOT buy any Miners, I want to see how things play out with the USD and Precious Metals. GDX is not oversold.
.
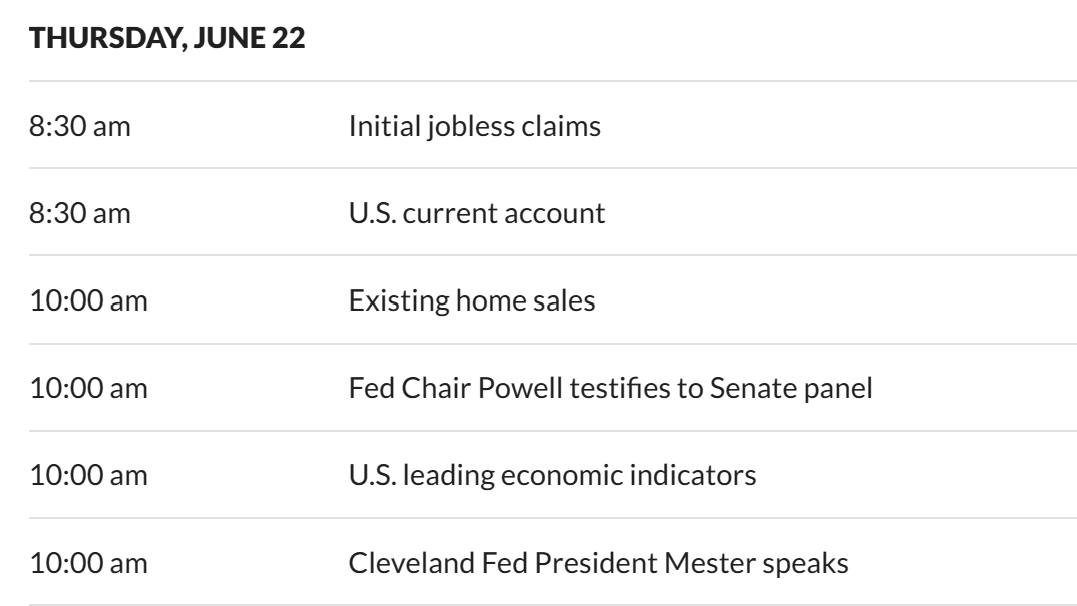
So it makes sense that the selling in the General Markets could continue, since we are almost at day 40 and a dcl can come into play any time around or after that time period. Some traders may be trading JDST, DUST, SOXS, SPXS, SQQQ for a quick short scalp during this market pull back / dip, but it can be hard to time a top in a bullish run. I’m going to watch the Precious Metals and the USD today, and I’ll discuss a bit more about Crypto below. Also below are todays headlines and economic events that may or may not affect the markets in the U.S.:

.

Enjoy your Thursday trading!
.
~ALEX
.
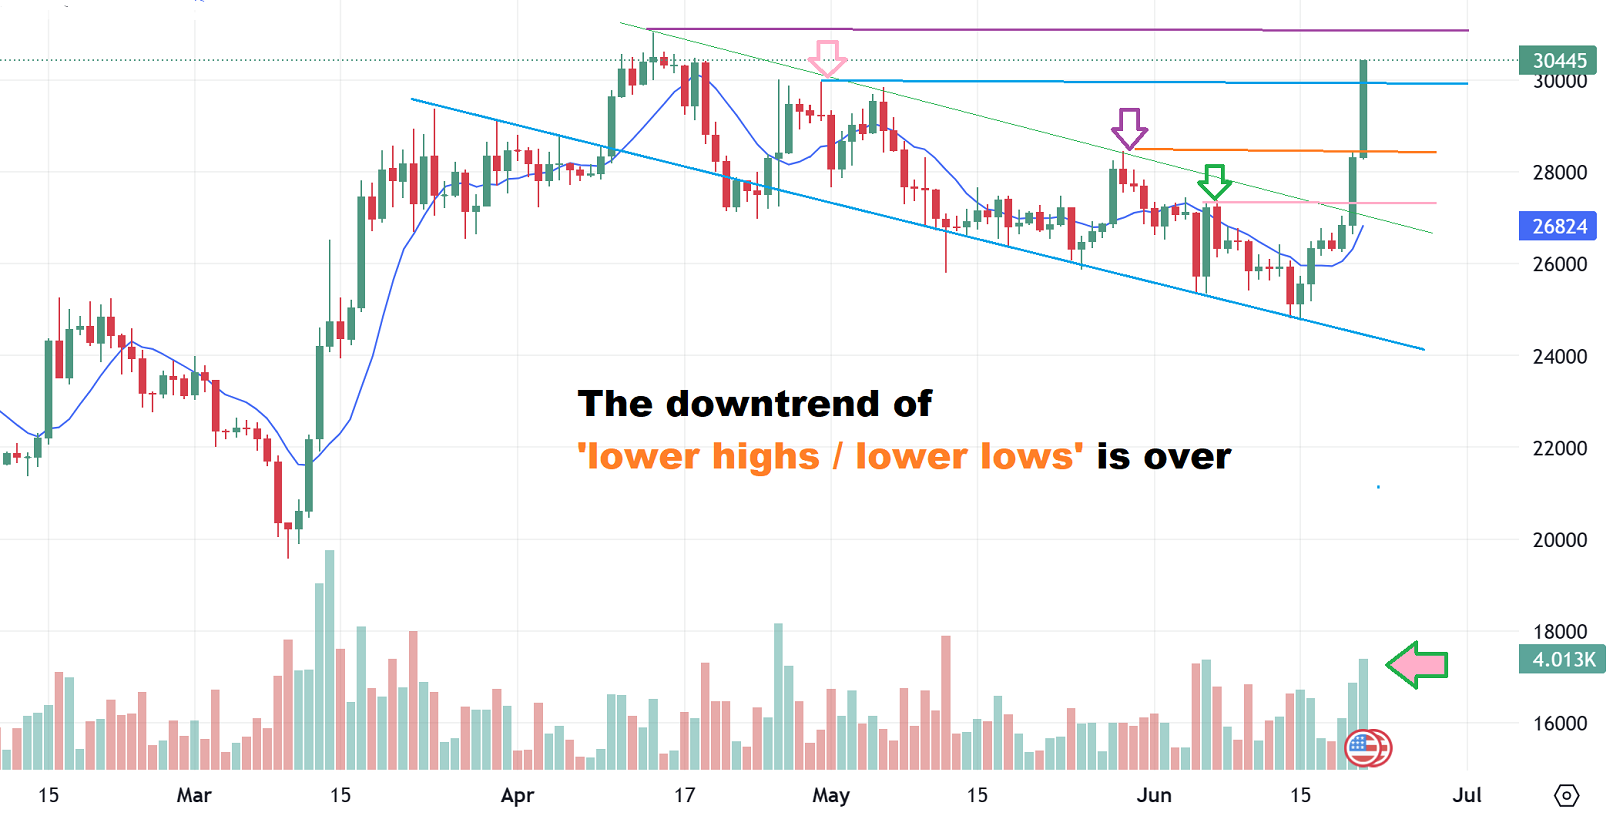
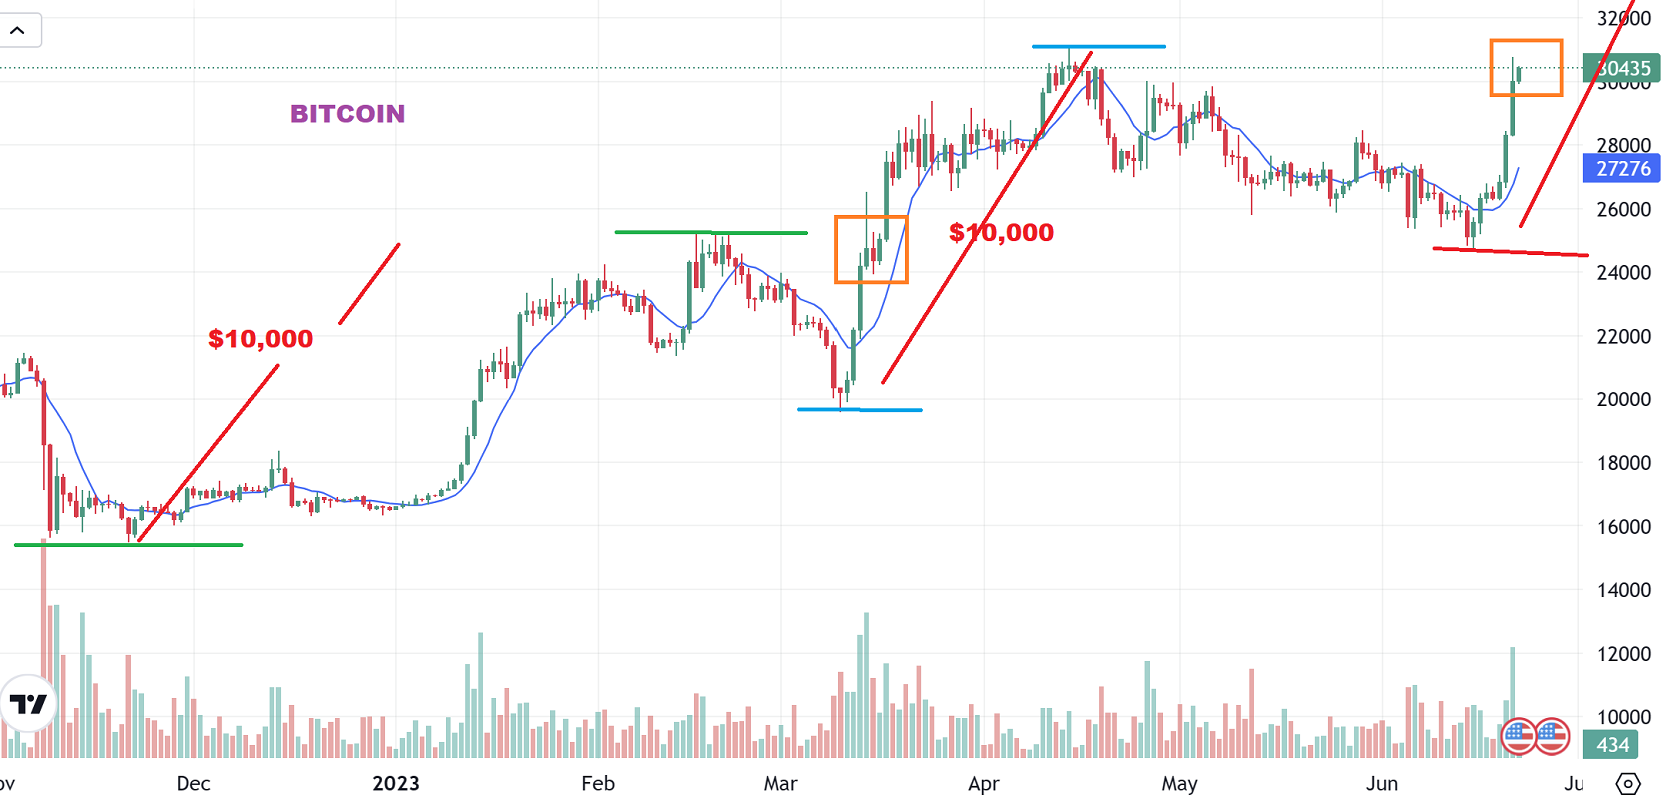
I was discussing the series of ‘lower lows and lower highs’ in BITCOIN, and that represents a downtrend. That down trending channel has definitely ended with this weeks surge in Crypto (especially Bitcoin, since some alt coins have not yet broken downtrends). I have also discussed trading or buying MARA, RIOT, CLSK, HUT, HIVE, etc etc as short term trades or buy and hold.
.
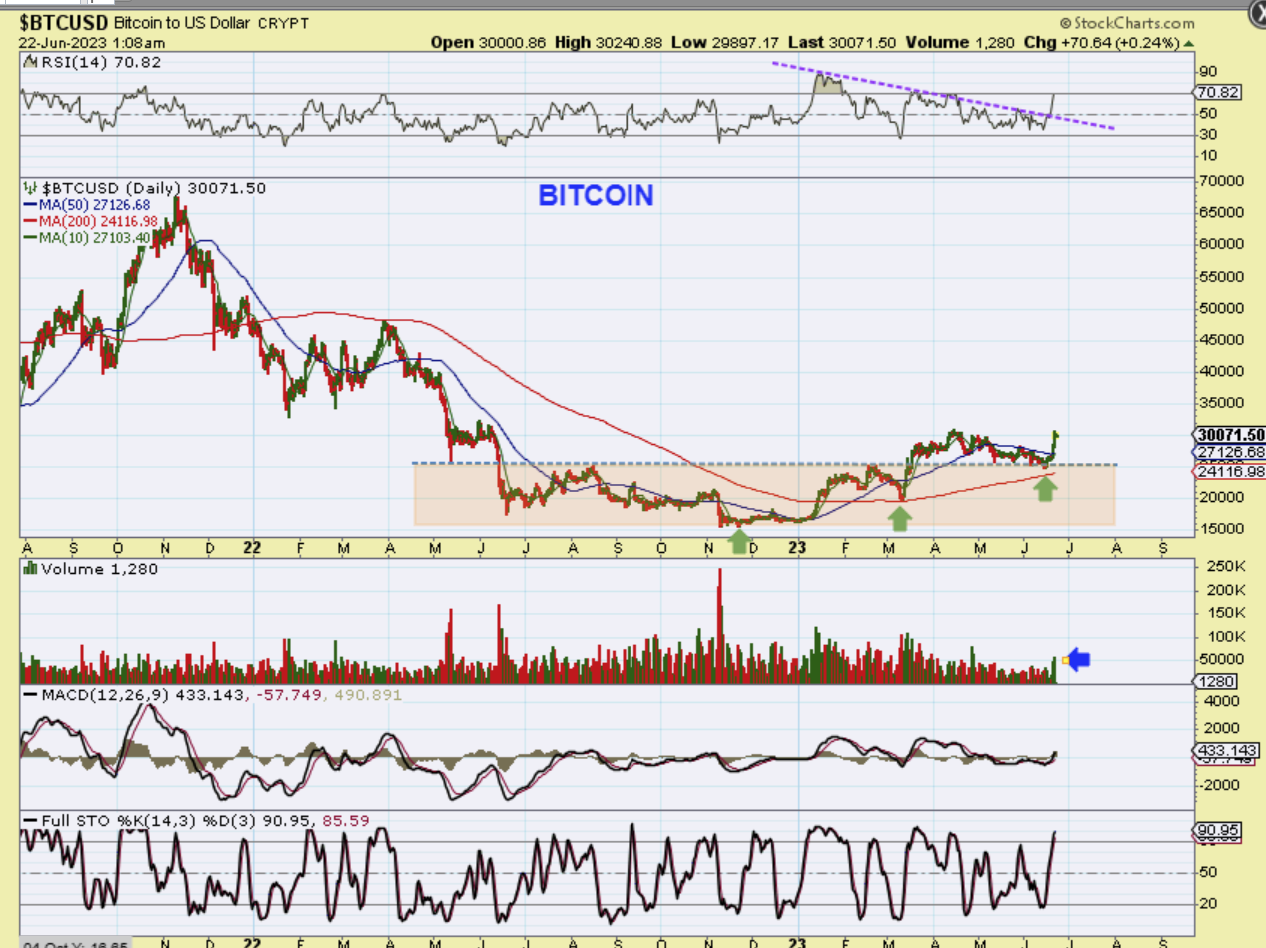
When I step back and look at Bitcoin I see a reversal just above the 200sma. I also see a break of the RSI above 50%.
.
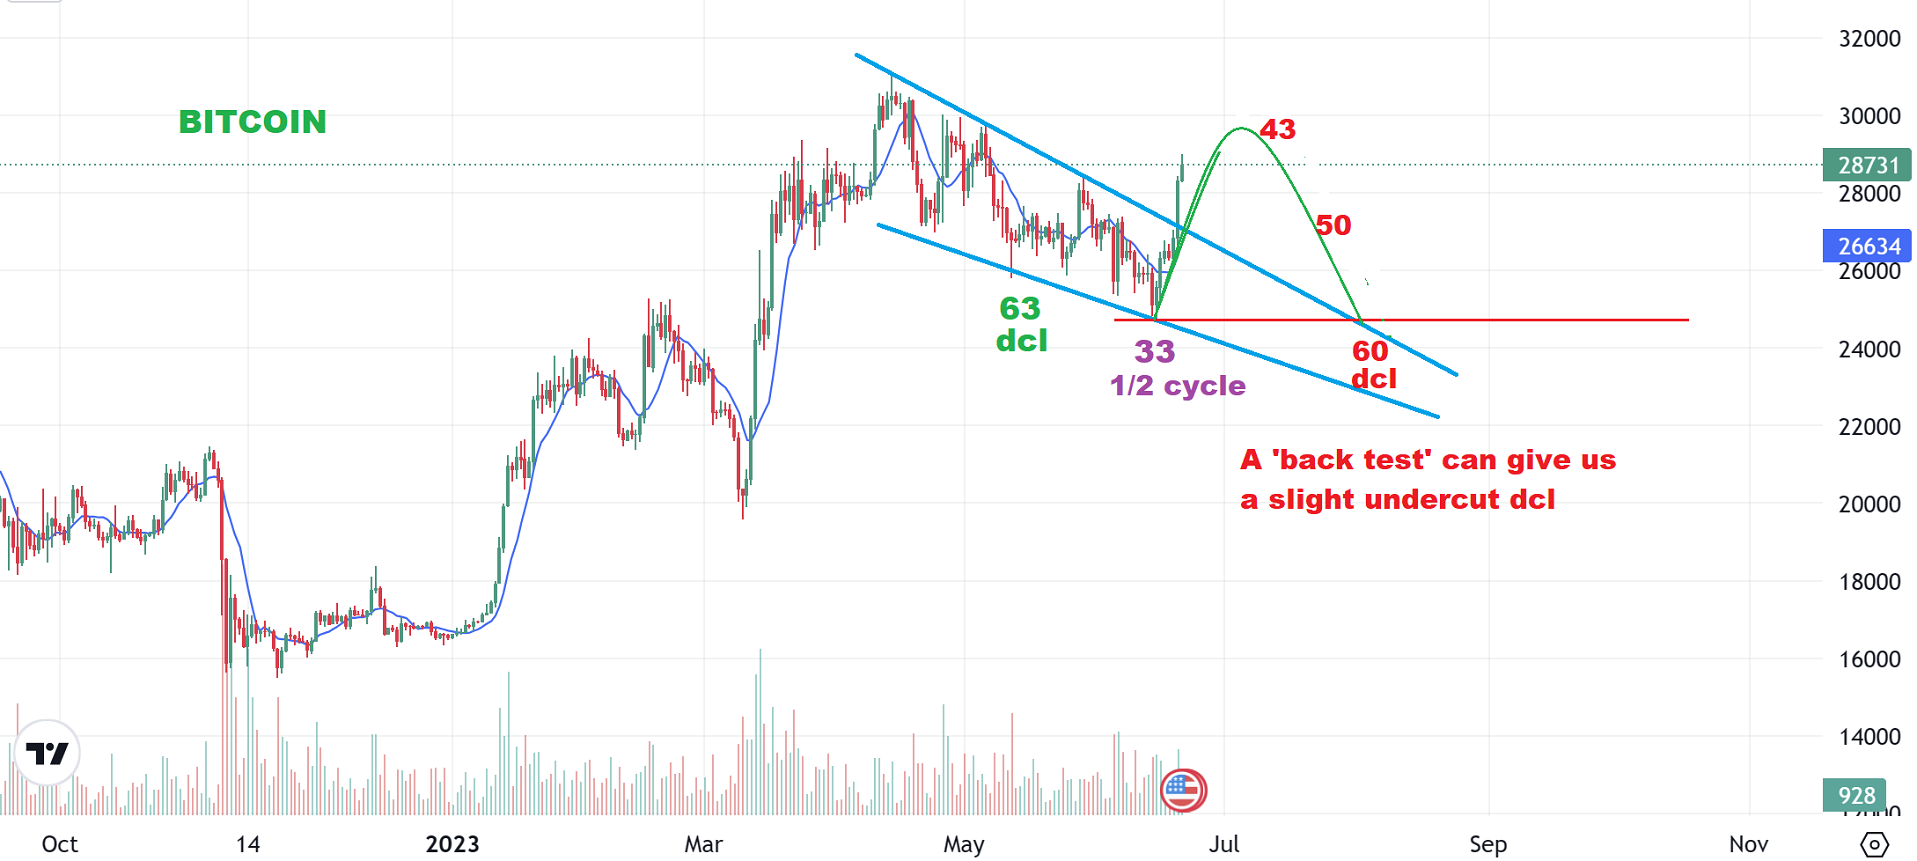
BITCOIN – I drew this yesterday simply to point out that we could rally and roll over to back test the downtrend. This is not a guarantee, we could just rally to $35,000, but it does fit one cycle pattern of 30 & 60 daywaves, so I put it out there as a cautionary note (something to watch for going forward).
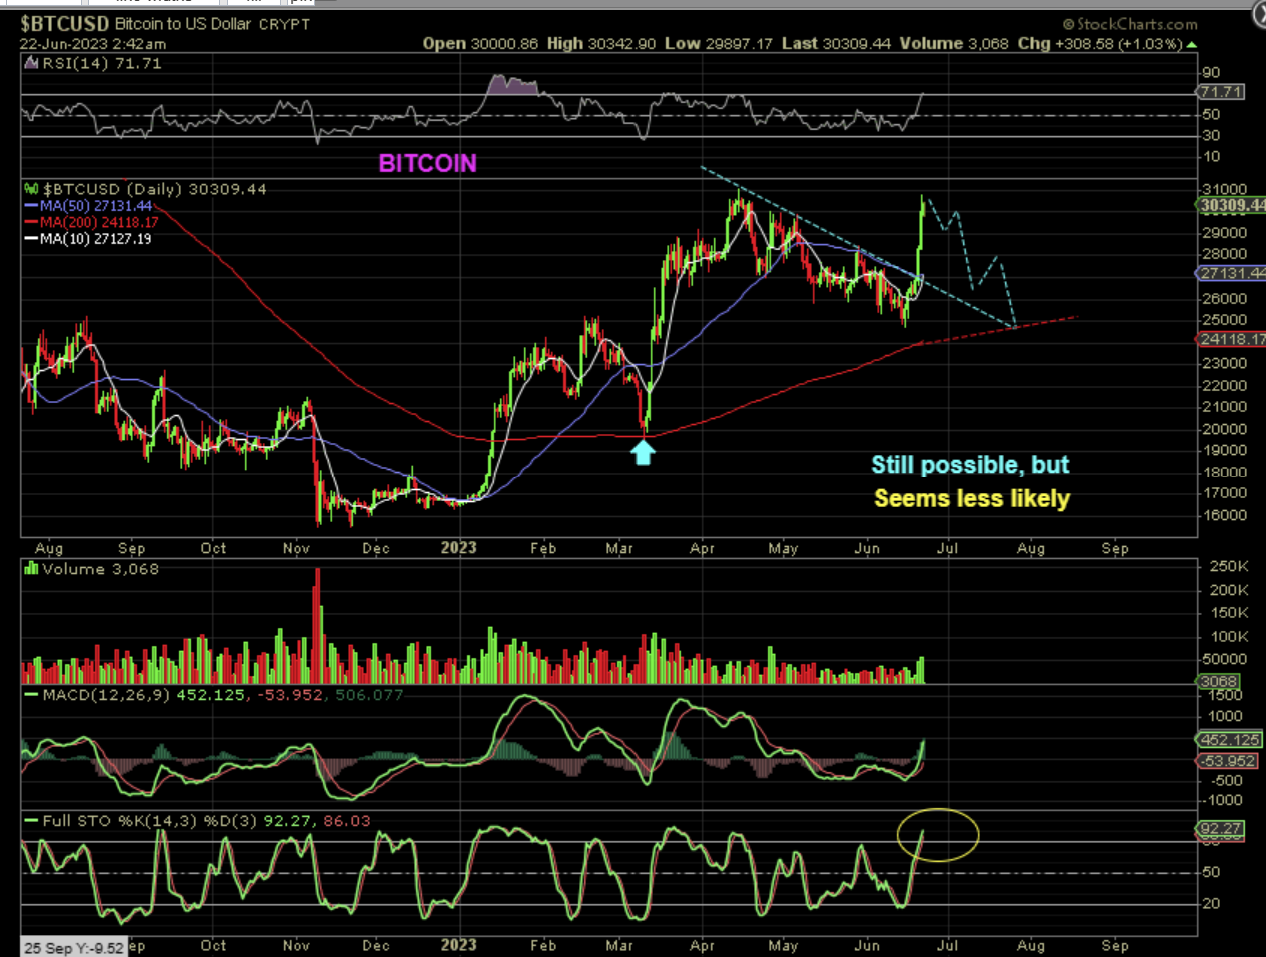
BITCOIN – If I draw it with that 200sma, we would actually back test the downtrend and tag that 200sma. It almost seems like too sharp of a drop after this rally, but at the same time it also almost mirrors the last sudden drop to the 200sma after a burst higher in Feb – March. If I did see this drop to 25,000, I would actually scoop up large positions in MARA , RIOT, etc.
.
BITCOIN IF THE LOWS ARE IN PLACE – We saw roughly a 10,000+ run out of the last 2 lows, so a repeat would cause us a run to roughly 35,000 if we get a symmetrical run.
.
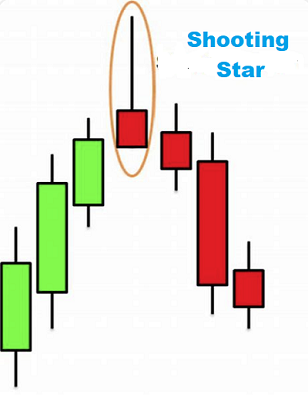
A SHOOTING STAR is often a topping candle or a pause. It can become a long term top or just a quick pullback. Nothing is really a 100% guarantee, but we did have quite a few of these in crypro stocks yesterday, so I just wanted to point it out.
.
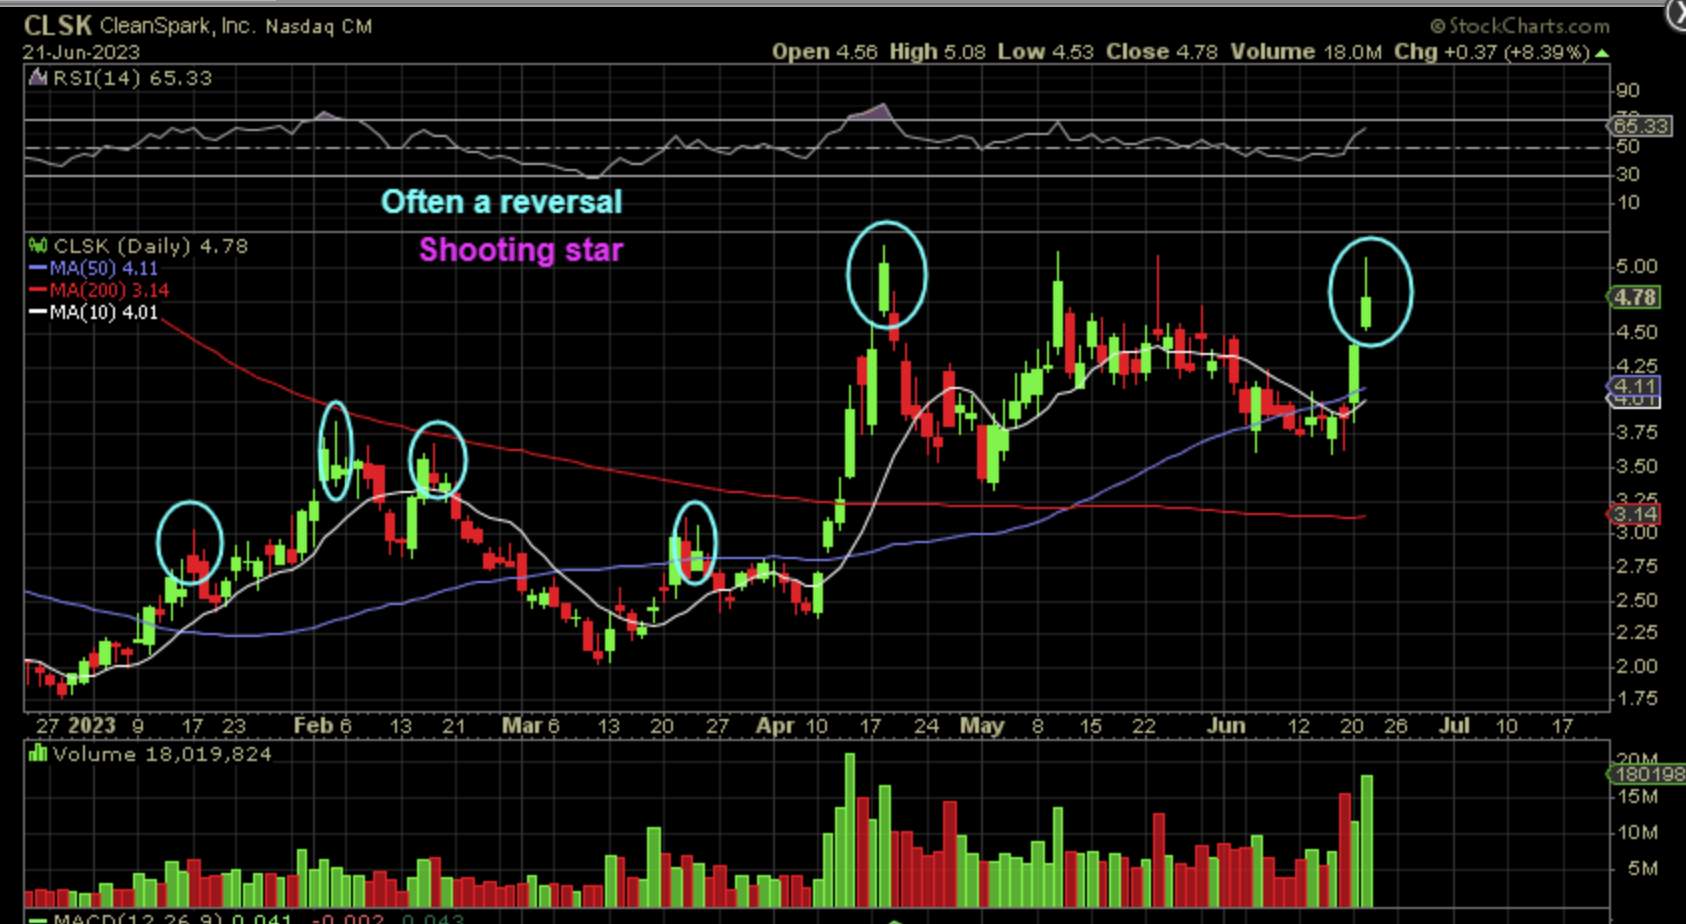
CLSK – As you can see, these candles are often where a pause, top, or sideways chop can begin.
.
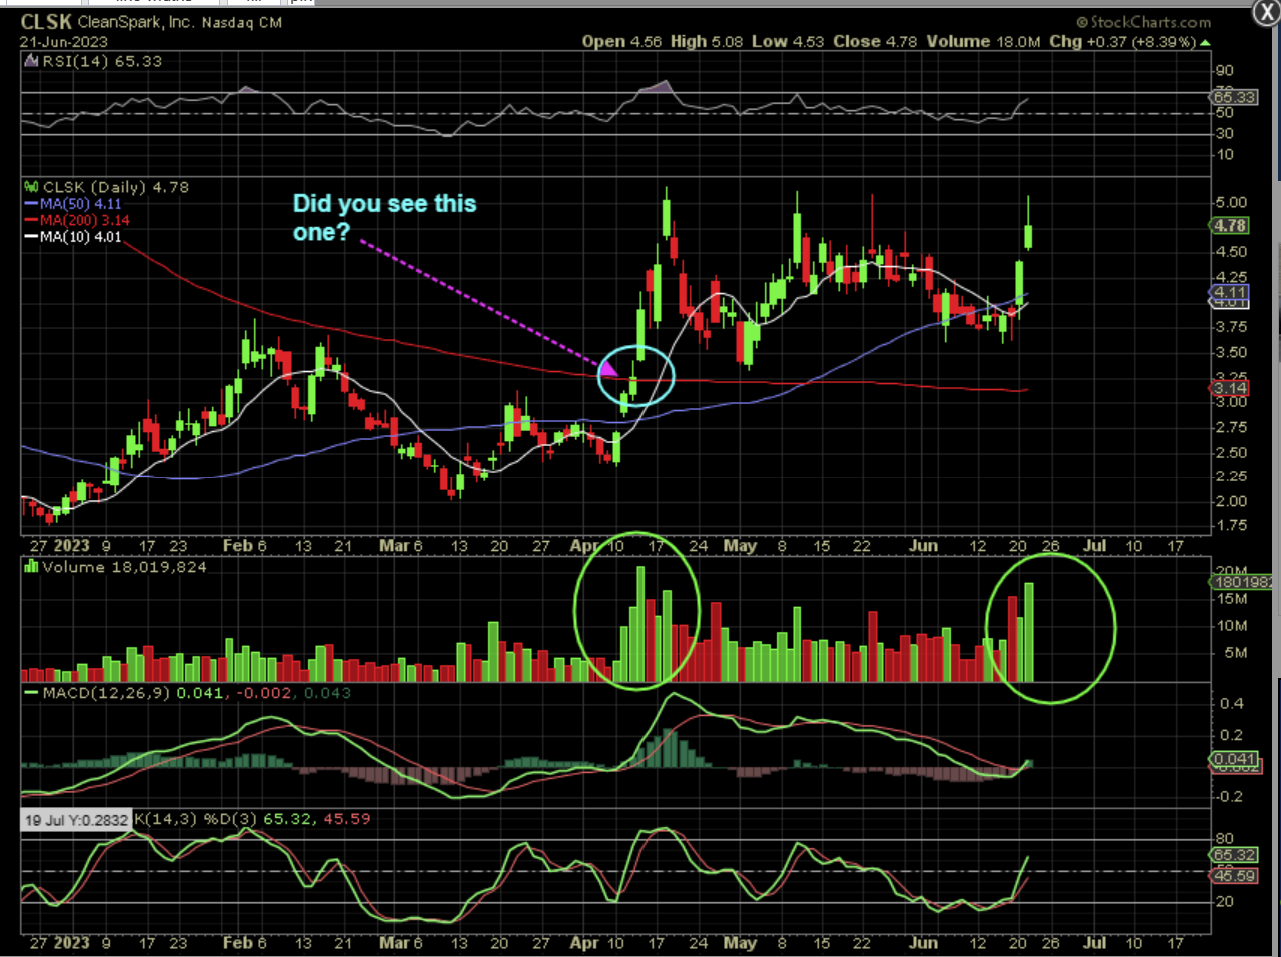
CLSK – That being said, I am also pointing out one of those candles that formed at the 200sma in April. It was NOT a top or pause at all, so we can continue higher, I’m just pointing out that the odds favor a stall when I see those.
.
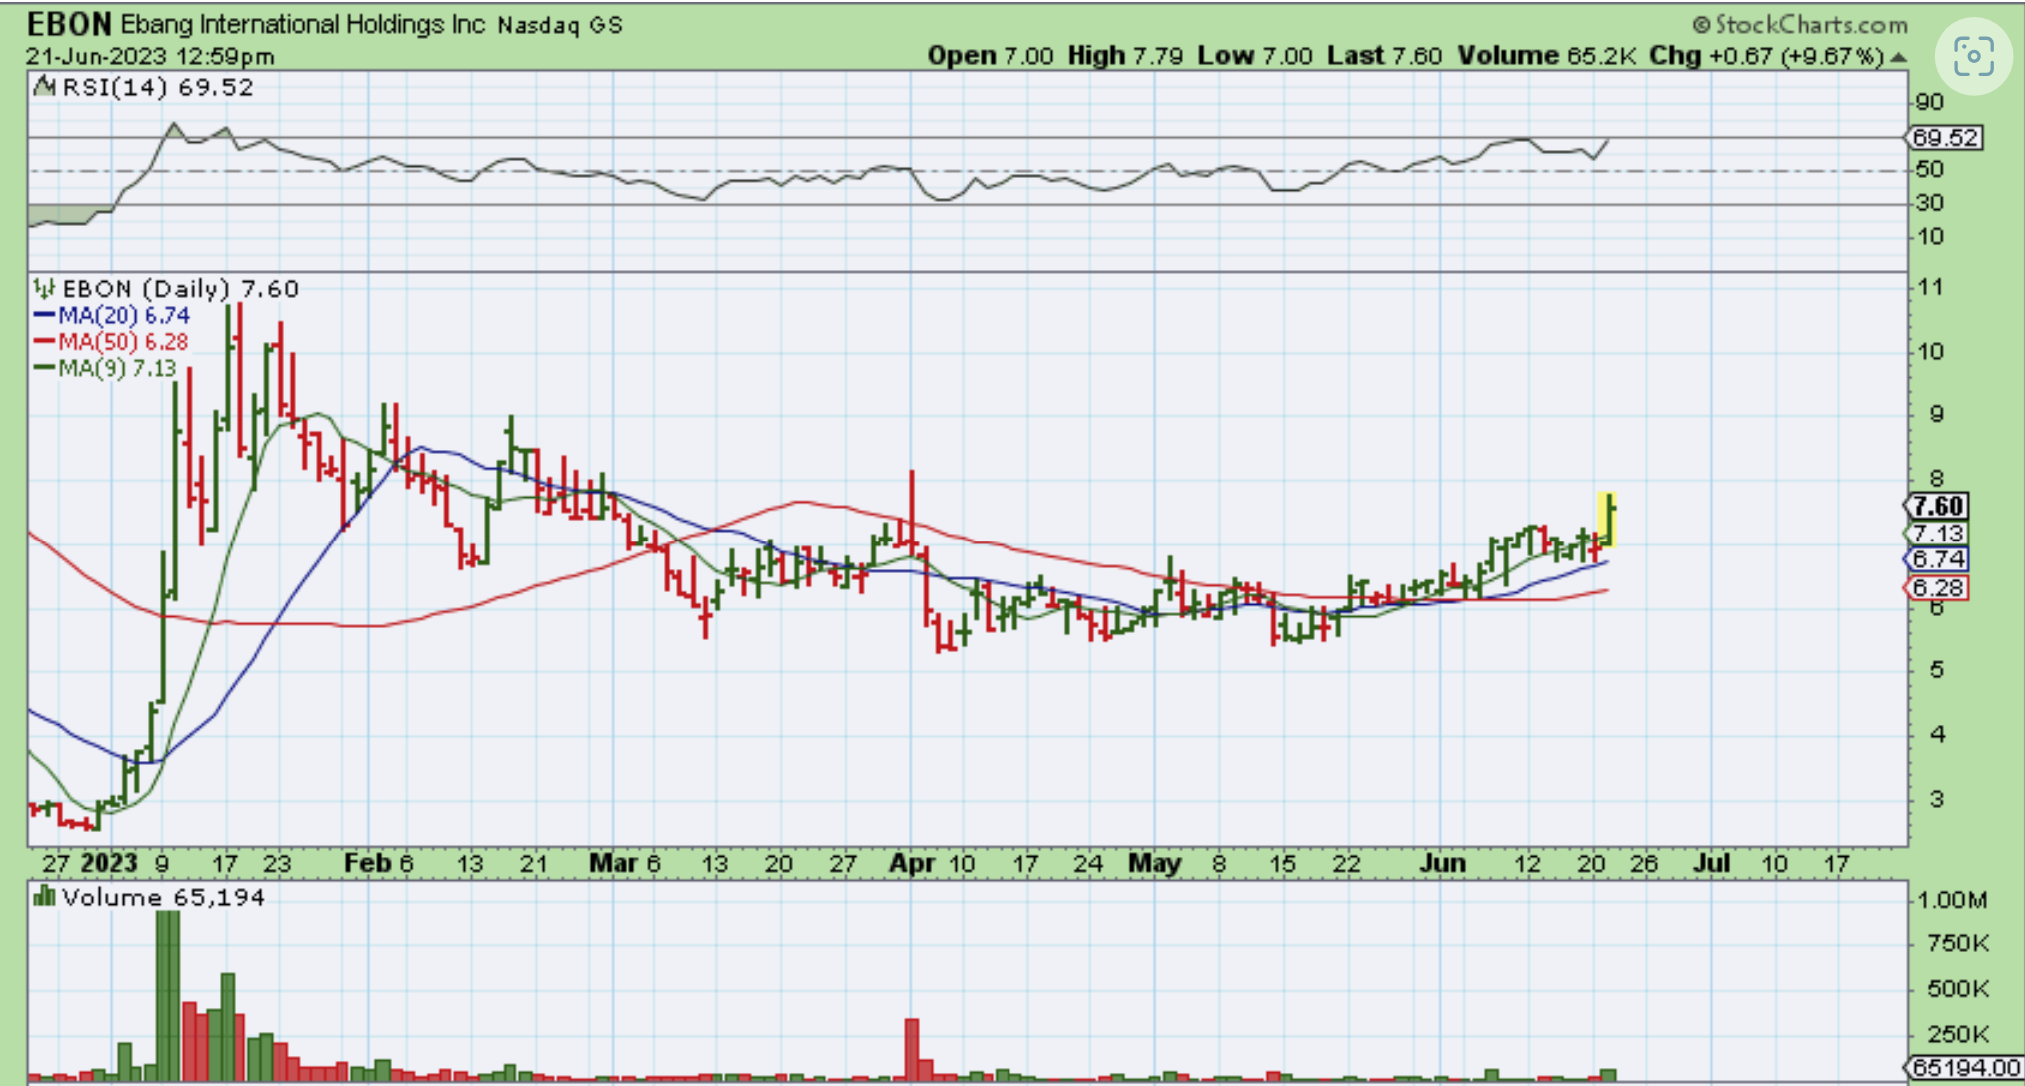
Yesterday I also pointed out that some of the laggards like EBON, CAN, etc were starting to move higher too. EBON has actually been trending higher since May as Bitcoin sold off, but it did go red on Tuesday, when Bitcoin was up BIG.
.
MARA also put in a possible topping candle as it reached the prior highs. I am pointing out the similarities between this consolidation box and the last one. The pull back in March dipped to the 50sma. IF we see that here, that would become a possible Buy Point or a place to ‘add’ if you’ve been buying & holding MARA.
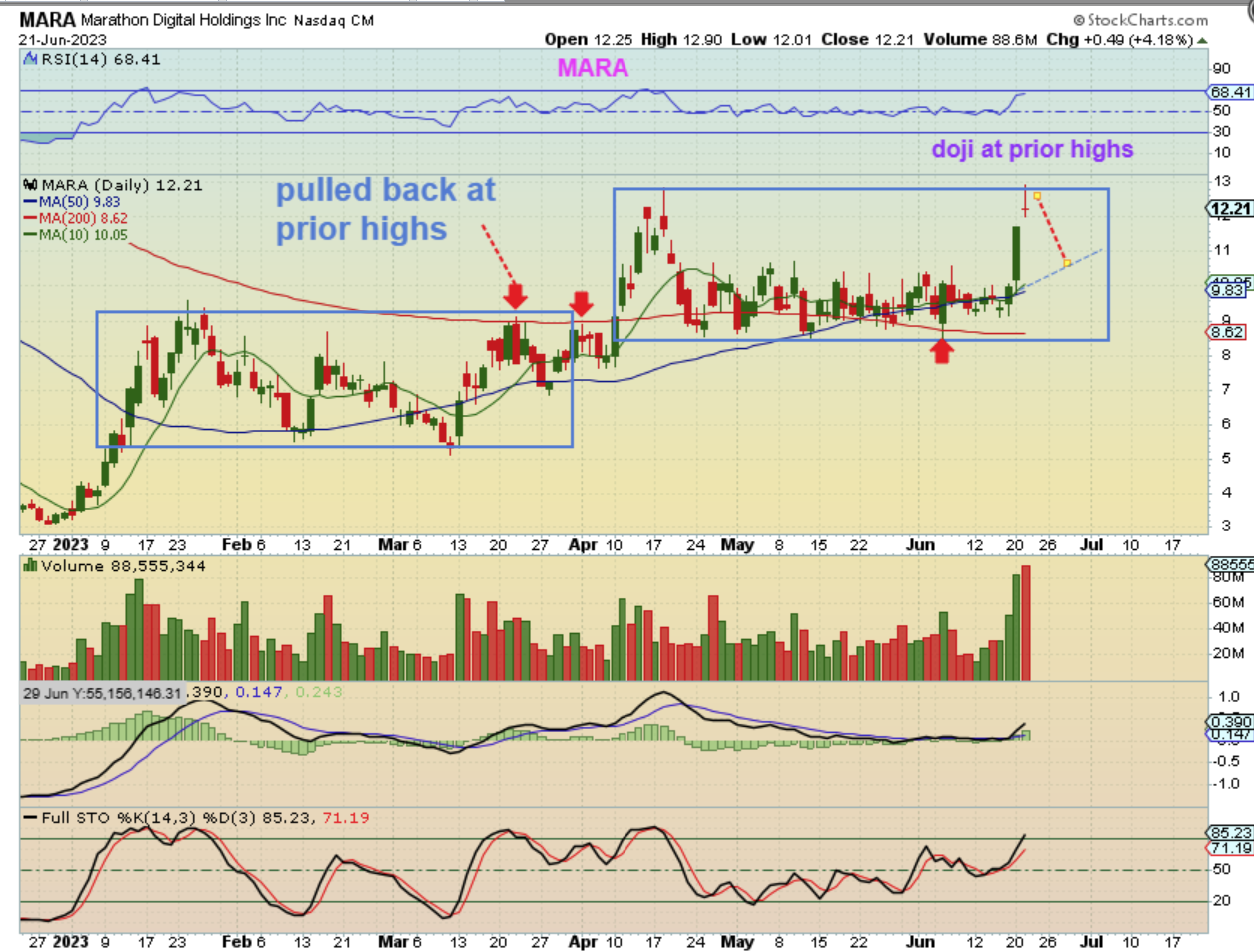
.
.
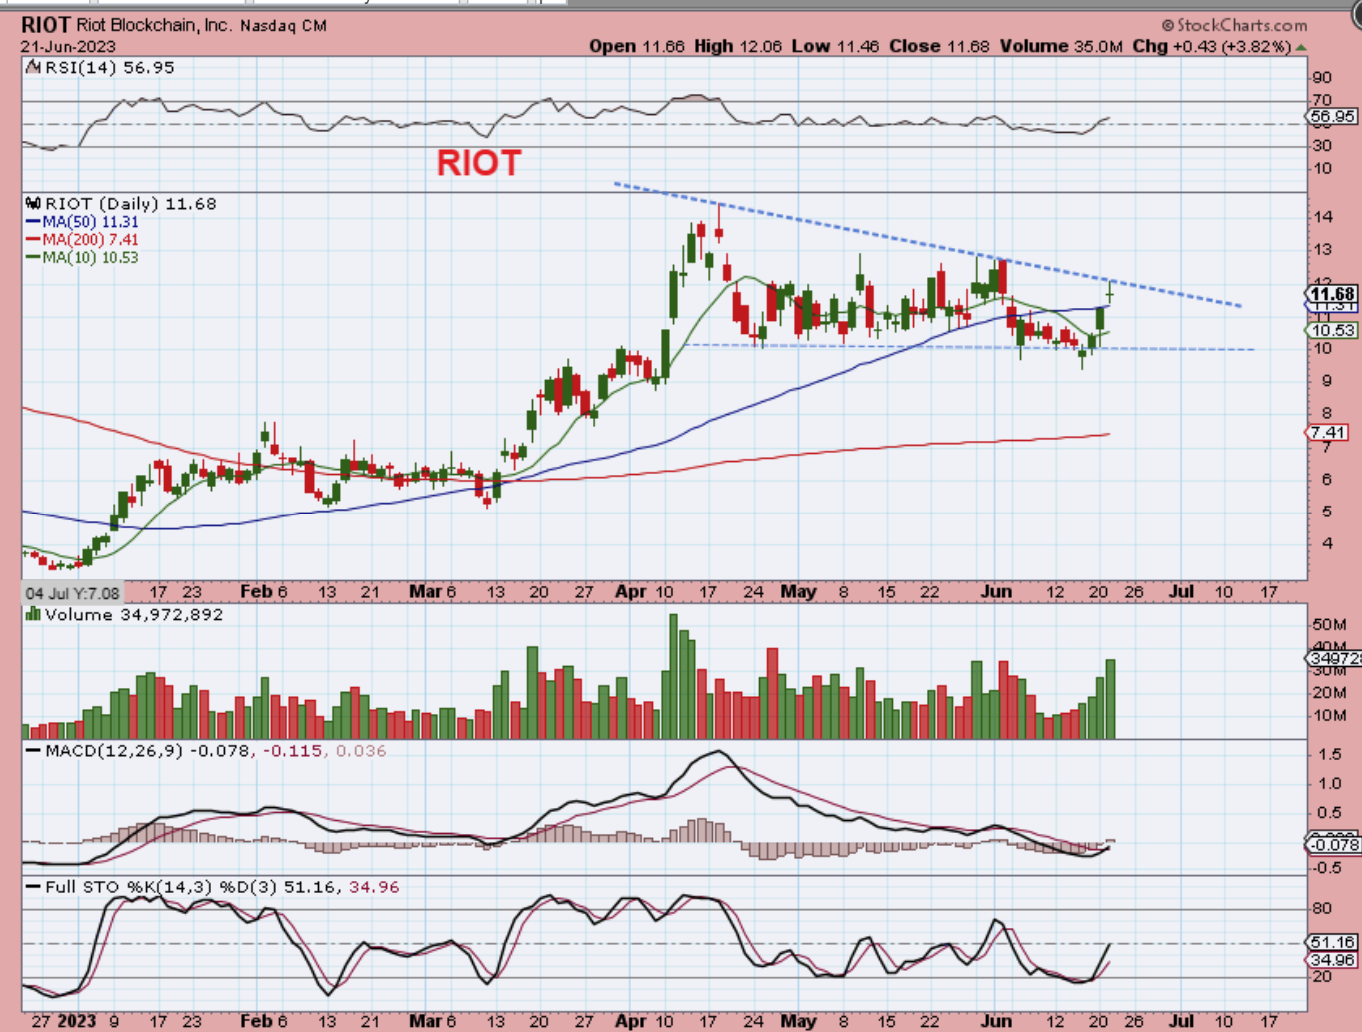
RIOT is at a downtrend line, and it put in a doji, so we did see various possible topping candles or pausing candles. RIOT just pushed above the 50sma, so that can be used as a stop if the sideways chop continues. If you bought RIOT near $10, you could lighten up and watch for a breakout or pullback to re-add. The sideways chop of RIOT may continue here for a bit unless Bitcoin keeps running. You can also just BUY & HOLD this consolidation if you are long term bullish.