June 11th Weekend Report
SPX WEEKLY #1 of 3 – The Markets have been bullish for weeks and as you can see, they closed up near the recent highs. We have now reached the August 2022 highs, so we almost have 1 year highs.
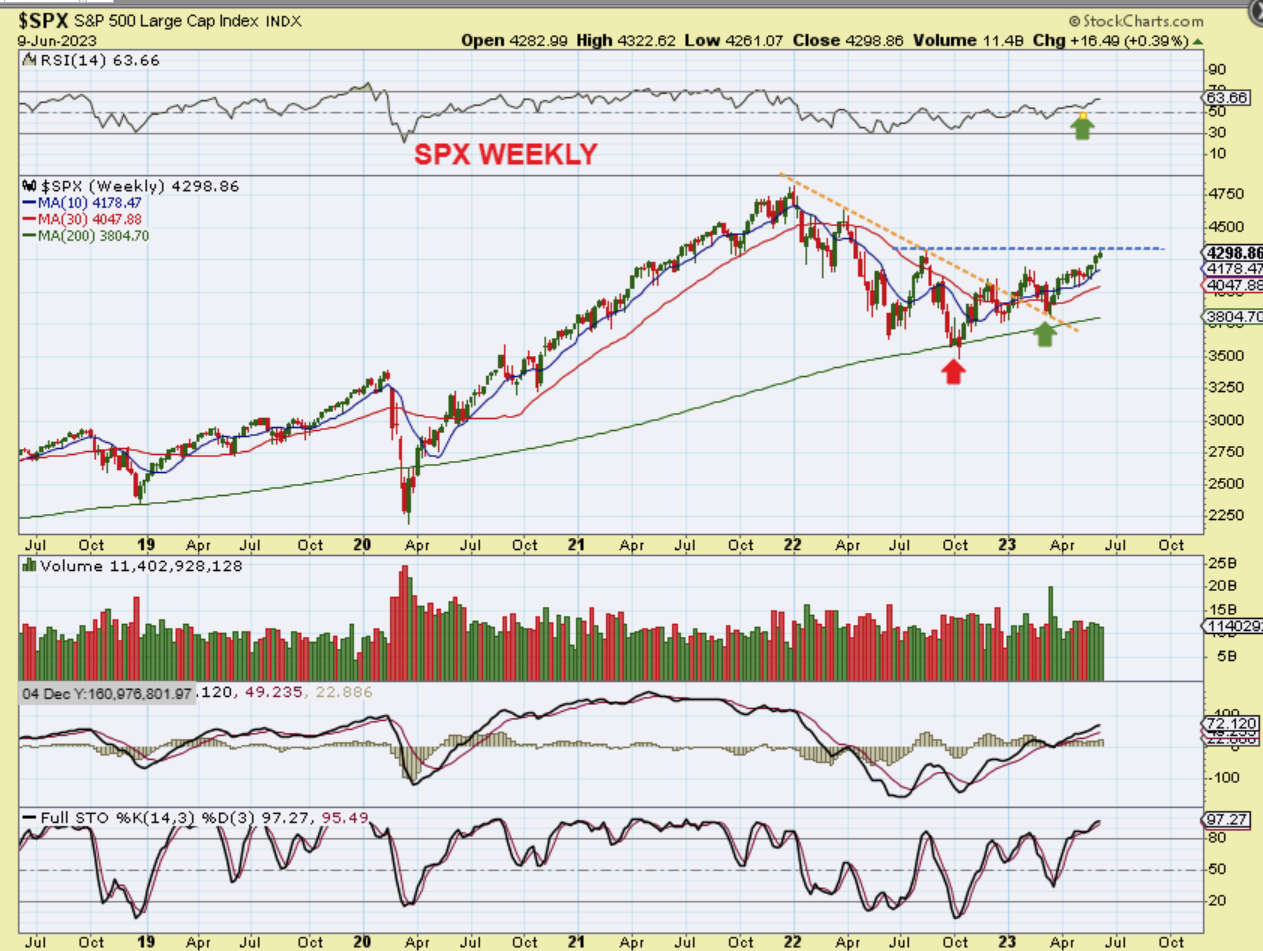
SPX WEEKLY #2 of 3 – And when I draw an upward sloping channel, the SPX looks as though it can push a little higher. We are within the timing that a dip into a dcl can start at any time, so using a rising stop has been recommended for this run. A drop into an ICL could also come into play after the next dcl, since one should be due around Augst or September, but that would make for an Excellent buying opportunity as the SPX tries to run back up to the all time highs. Thay said, Are ALL ICLs deep dips, like I have drawn here?…
.
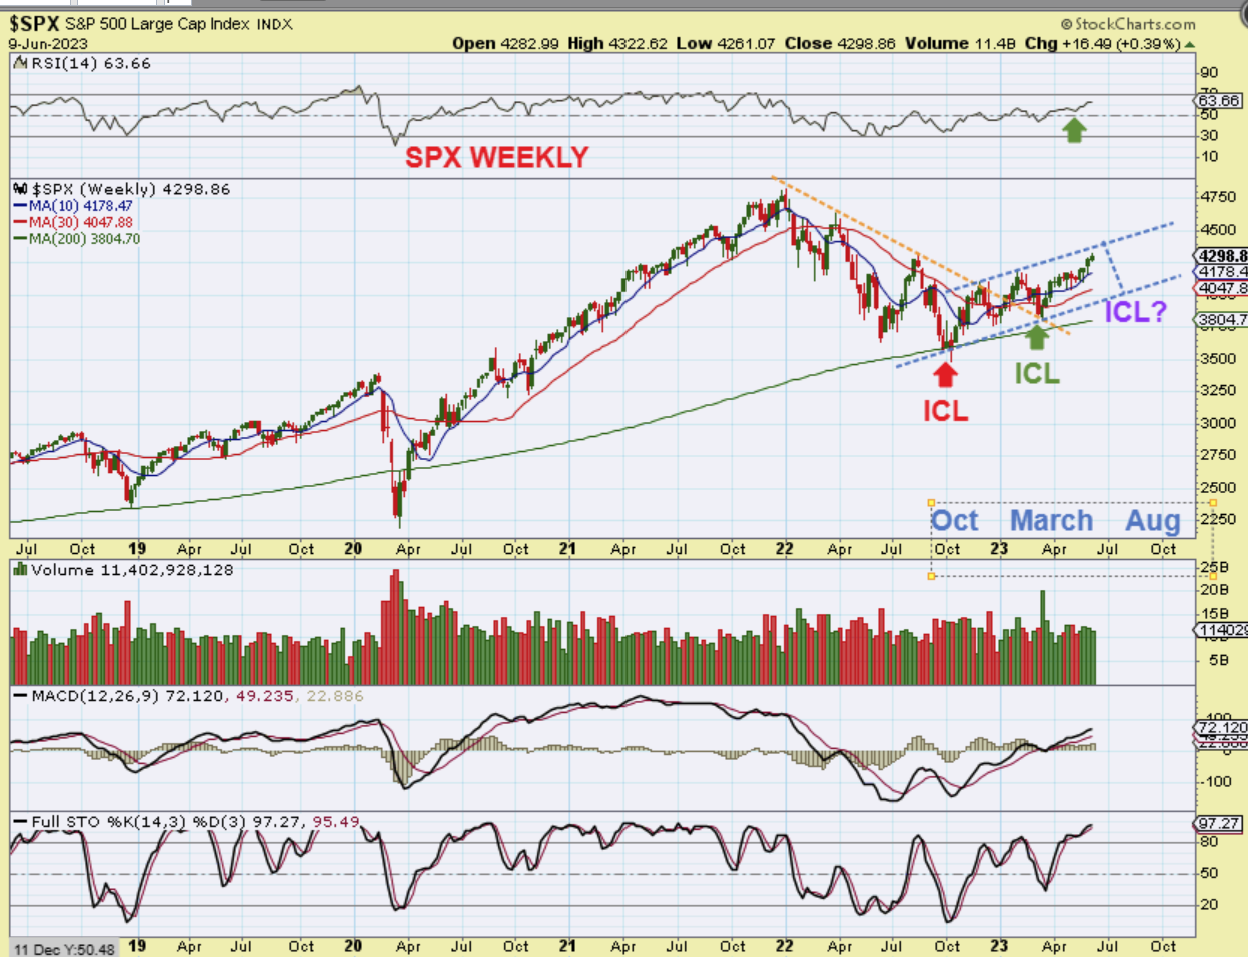
Are ALL ICLs deep dips, like I have drawn on the chart above? No, …
.
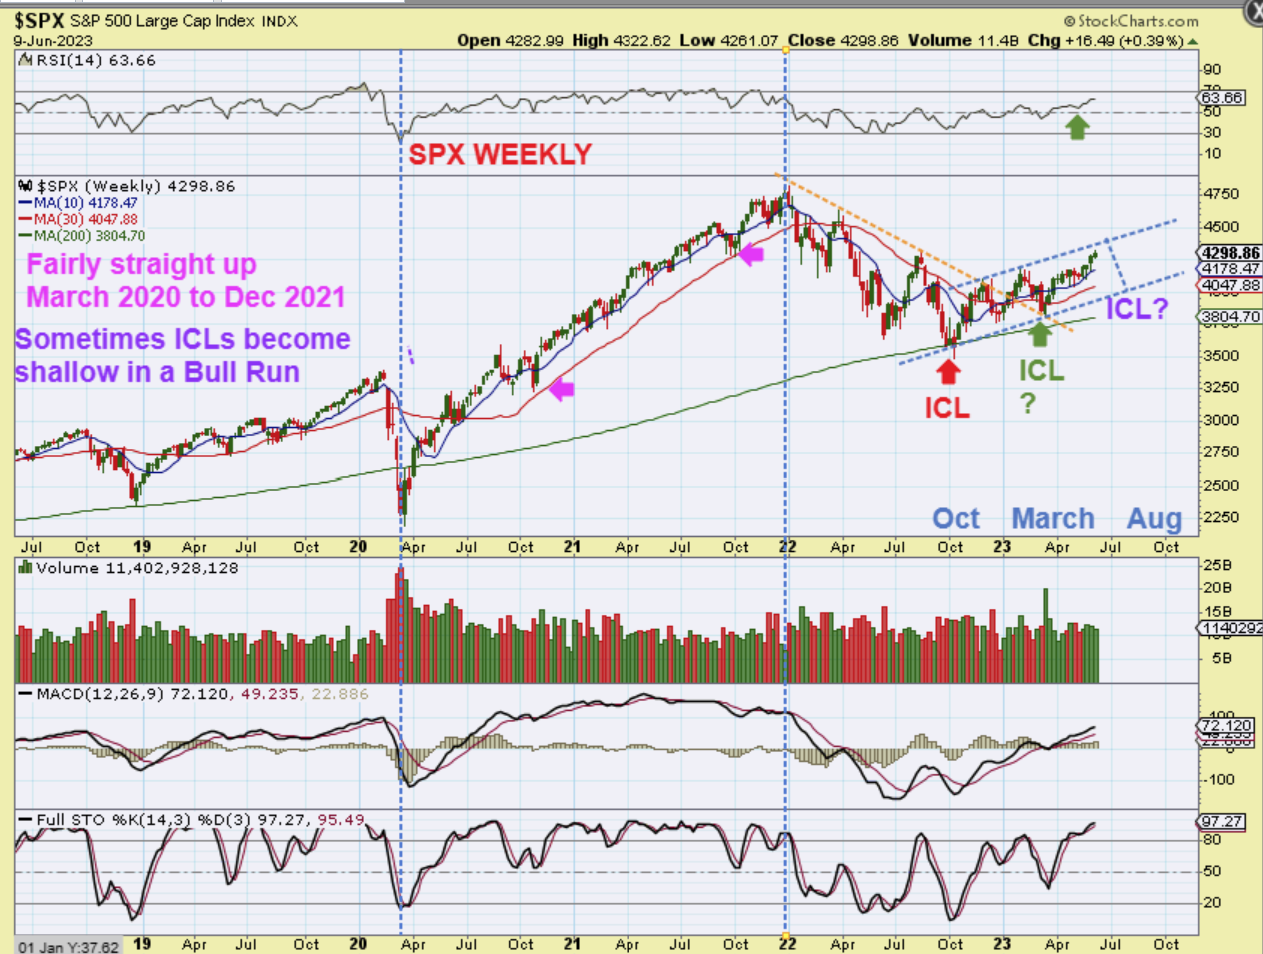
SPX WEEKLY #3 of 3 – Take a look at the rally out of the COVID ICL in March 2020. Many of the dips held that 10 week ma. If this rally started to follow this path, dips would become quite shallow, so I want to keep an eye on things as we come out of the next dcl.
In fact, please take a look at the run from Magenta arrow to Magenta arrow. That is Oct 2020 to Oct 2021 and in that 1 year period, I hardly see a deeper ICL type dip. I want to keep THAT in mind to, in case this ramp up continues in that manner.
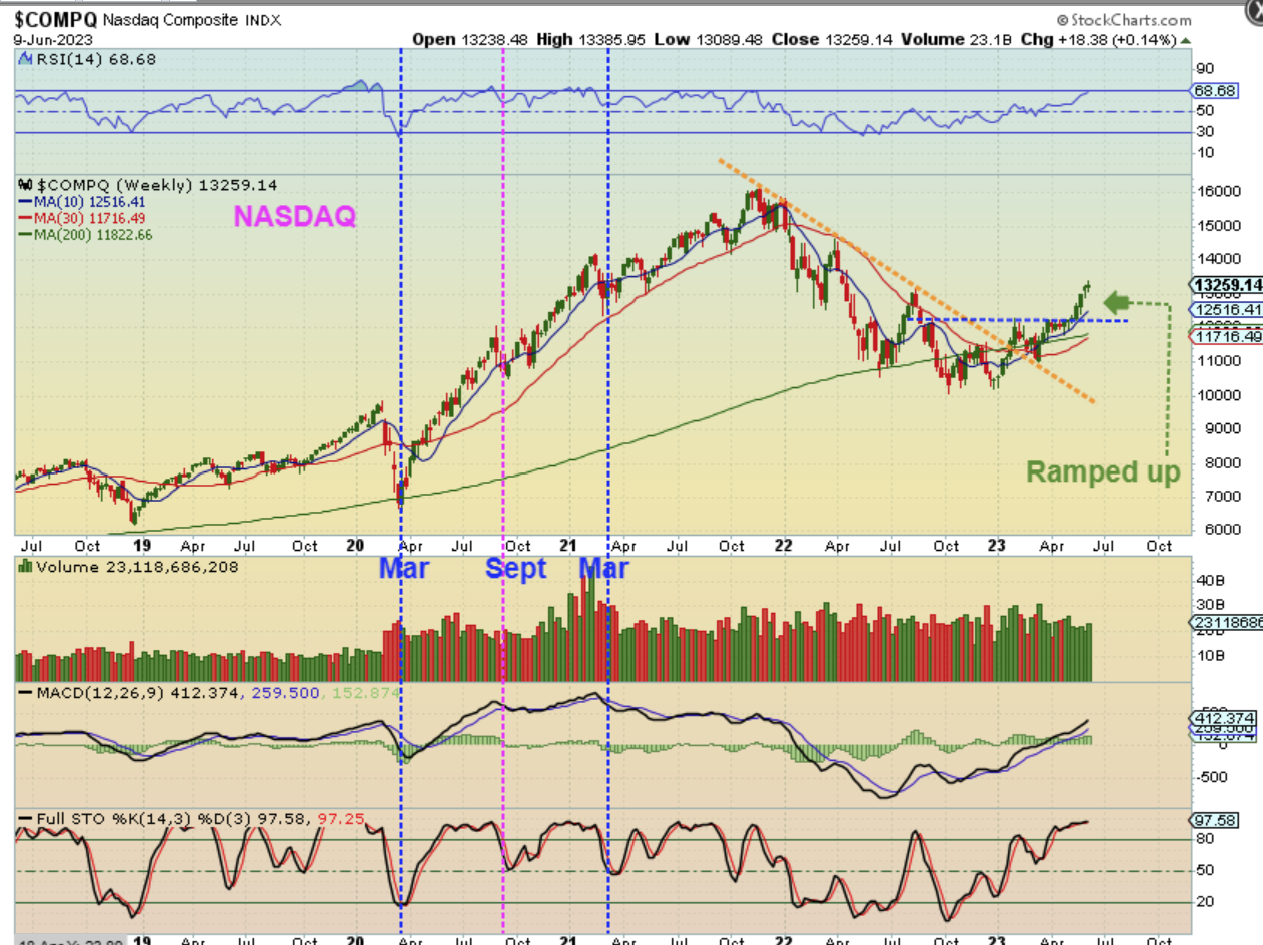
NASDAQ WEEKLY #1 of 2 – The NASDQ was lagging a bit, chopping sideways forming a base, but it has caught on fire going straight up for 6 or 7 weeks actually. I also wanted to point out the 2020 rally here. March to September was straight up for 5 months and then a quick drop into an ICL. It then went straight up September to March again, so if this remains bullish, we should watch to see if it begins to accelerate ( It actually already did start to accelerate over the past few weeks and that is why I mention it.
.
NASDAQ #2 0f 2: I also wanted to point out the 2020 rally here between the blue lines.
– March to September was straight up for 5 months and then a quick drop into an ICL. It then went straight up September to March again, so that is a 1 year rally that was lamost all straight up. If this current set up remains bullish, we should watch to see if it begins to accelerate like it did back then. This actually already did start to accelerate over the past few weeks and that is why I mention it.
.
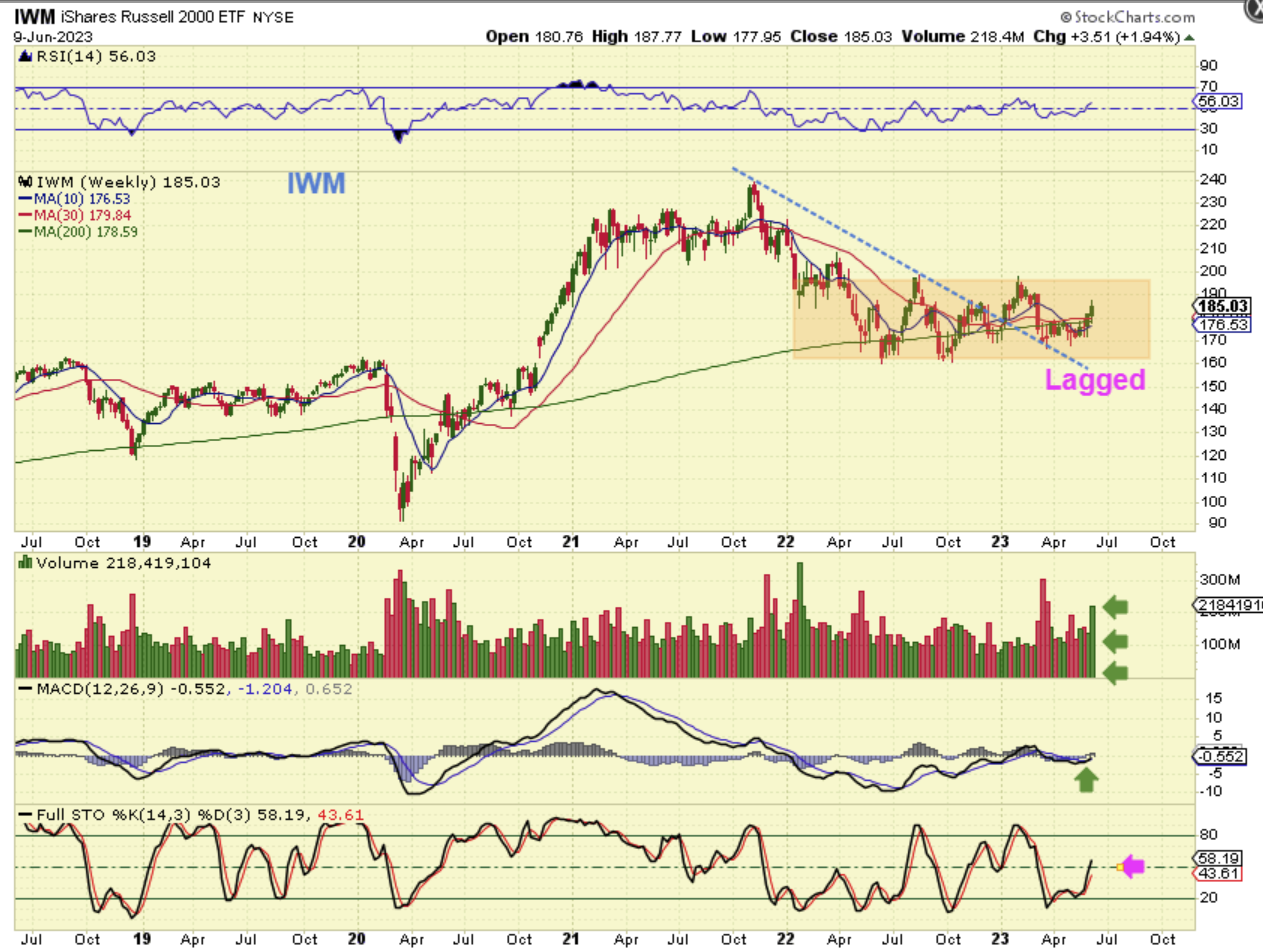
IWM WEEKLY – The Small Caps lagged and are still in a base, but they do seem to be perking up. The IWM is putting in higher lows in this base and has regained the 10, 30, and 200 week Ma. It also broke the downtrend and is trying to push higher.
WTIC WEEKLY – Oil has been choppy and it still remains choppy along the bottom, and notice that Oil was down over 2% for the week. With that, Oil stocks look a little more promising.
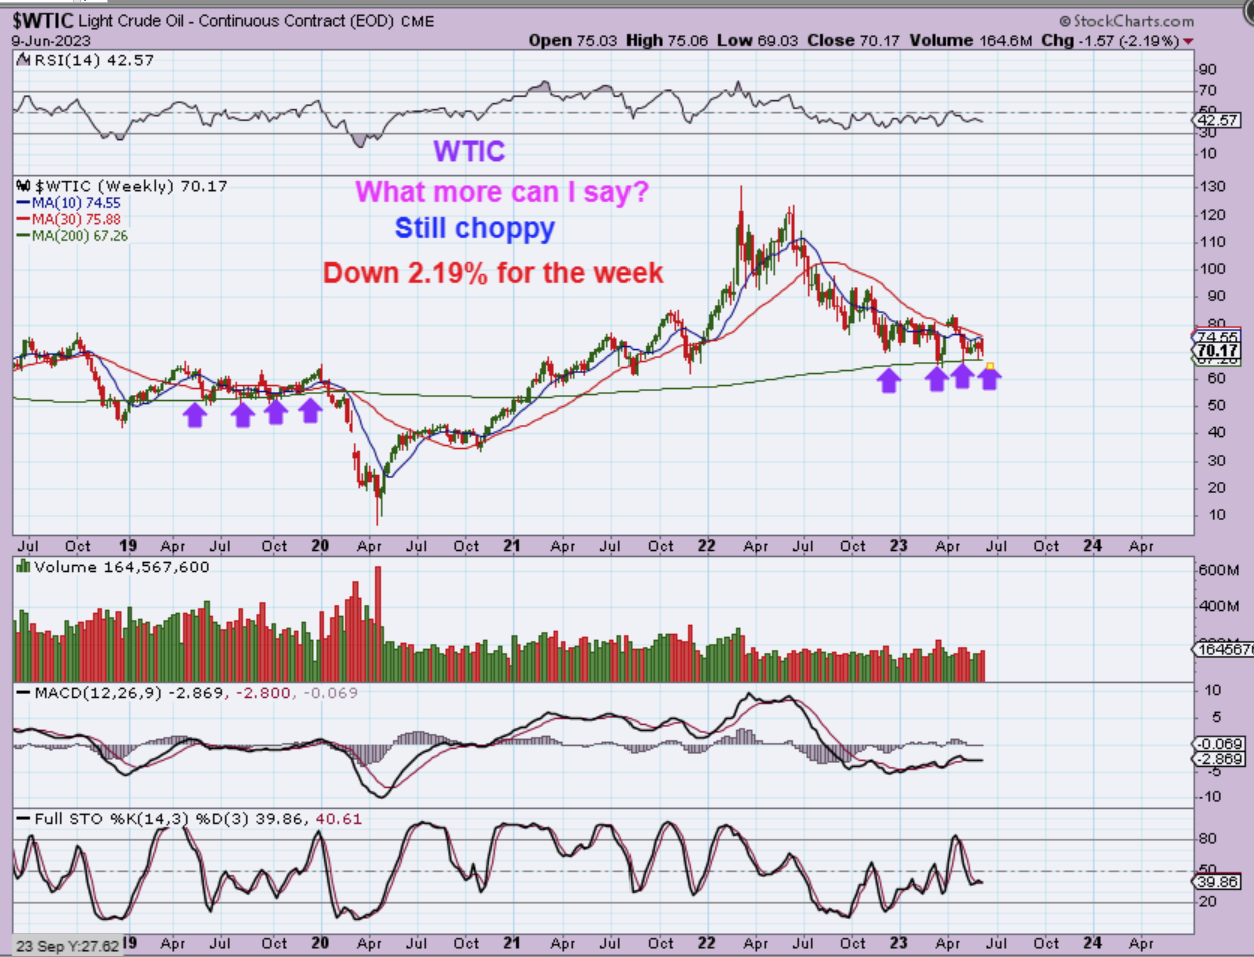
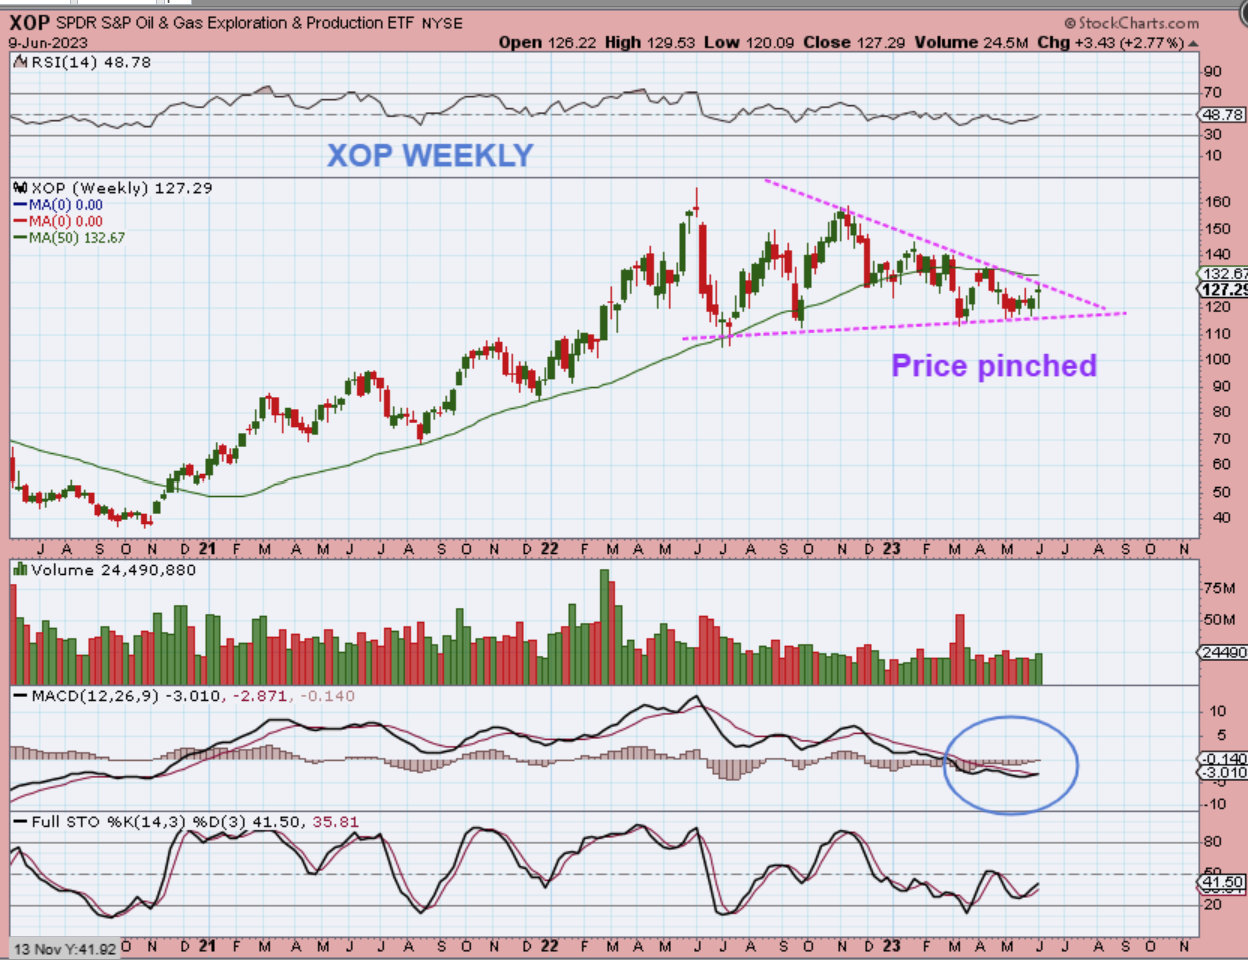
XOP WEEKLY – Oil was down 2%, but Oil stocks were Up 2%. They have been choppy lately too, but you can see that they are chopping sideways up at the 2022-2023 highs and not at sell off lows like Oil. So…
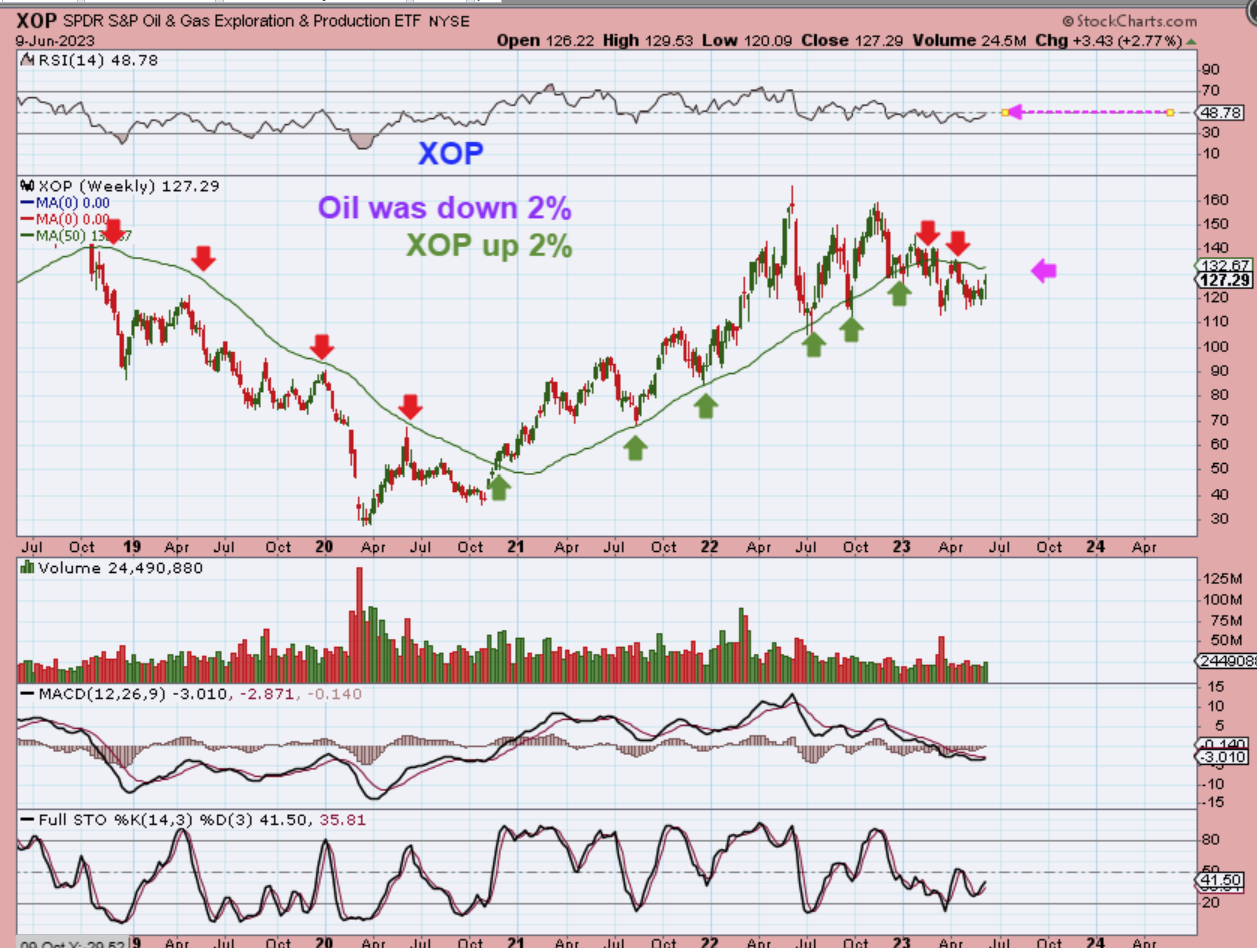
XOP WEEKLY – The set up in The XOPs weekly chart is actually looking like a large triangle consolidation that is being pinched now. This is bullish if it breaks out, and many Oil Stocks have been starting to look good lately. I’m watching for a breakout.
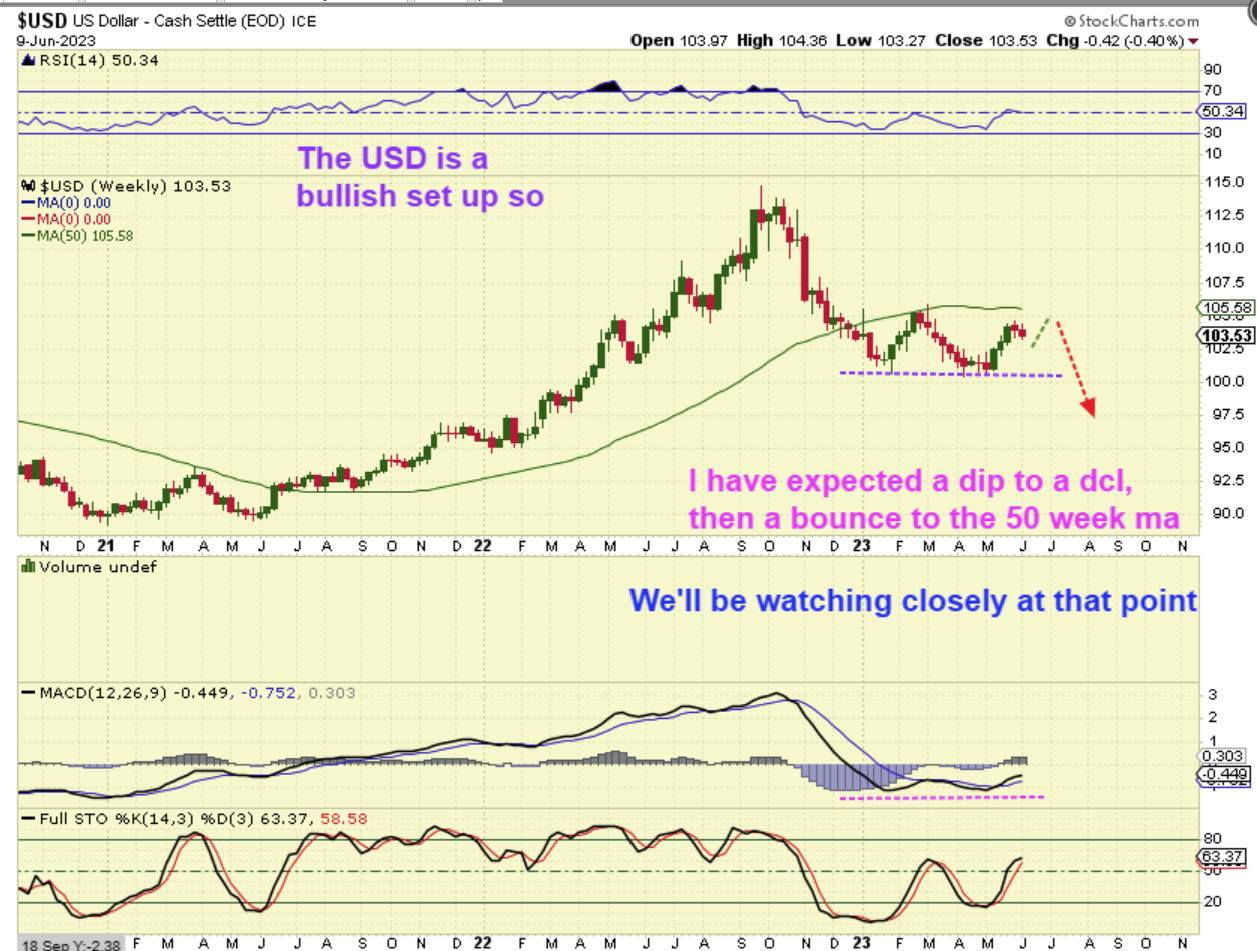
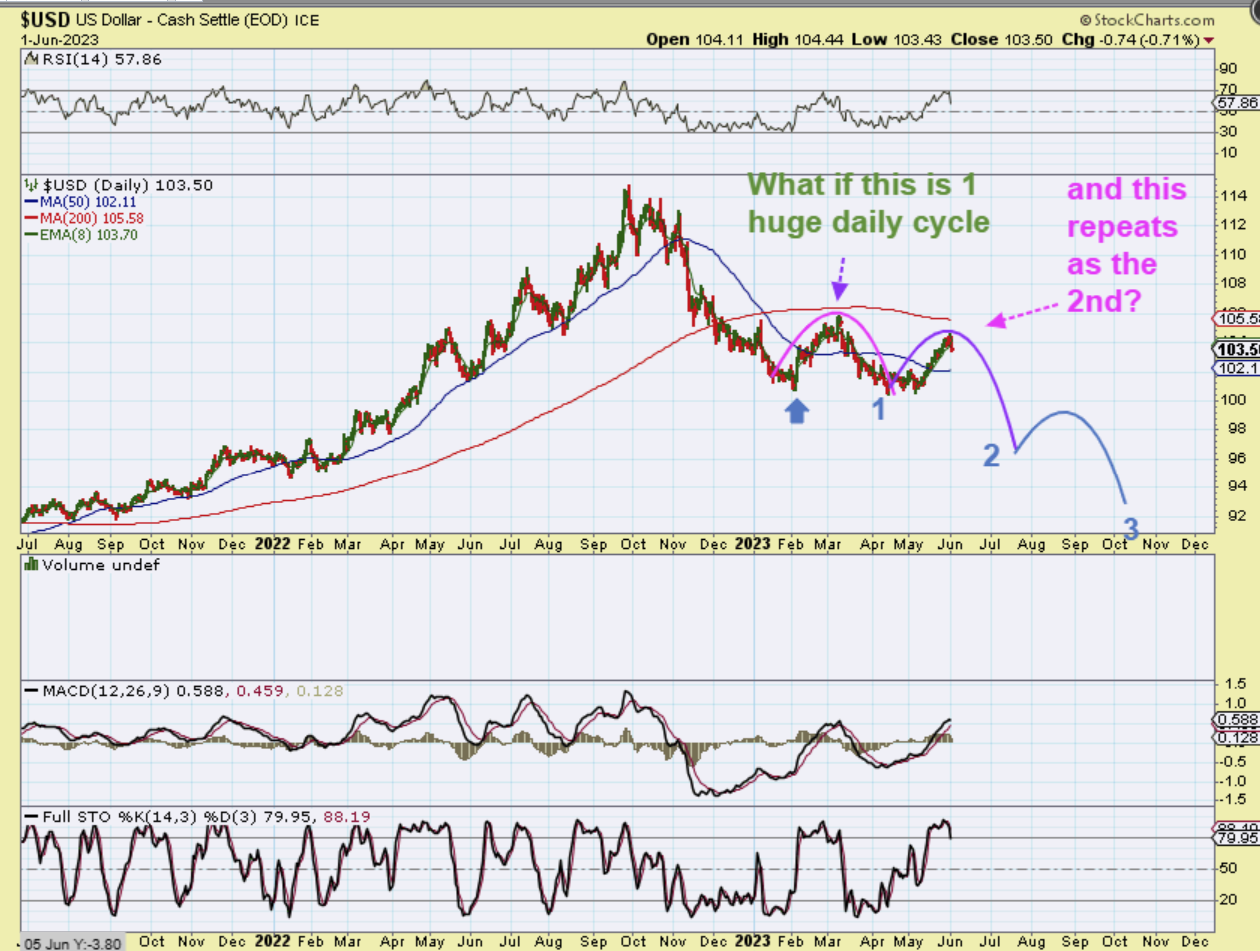
THE USD WEEKLY – The USD stalled over the past 2 weeks and we have expected a dip into a dcl. I was thinking that we’d see a weaker bounce from there, maybe to that 50 week ma, and then roll over.
.
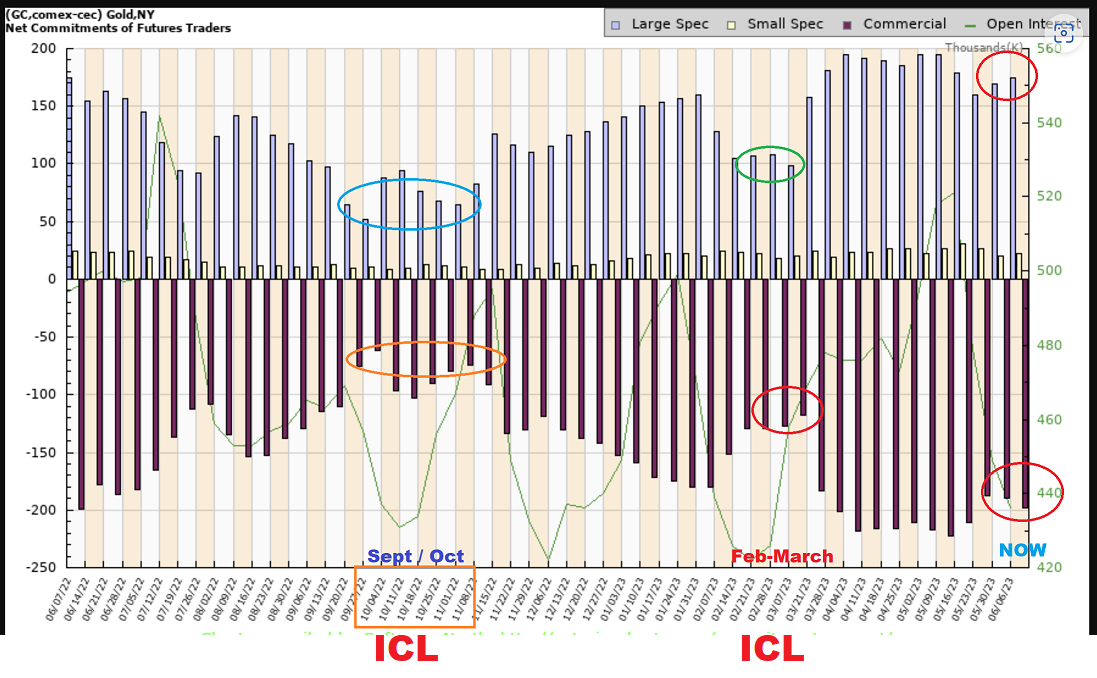
If you are a fan of the Gold COT readings, you won’t love this one.
.
COT – I’ve highlighted where the ICLs came in last September/October and on that last march drop. We are not even close to ICL levels right now.
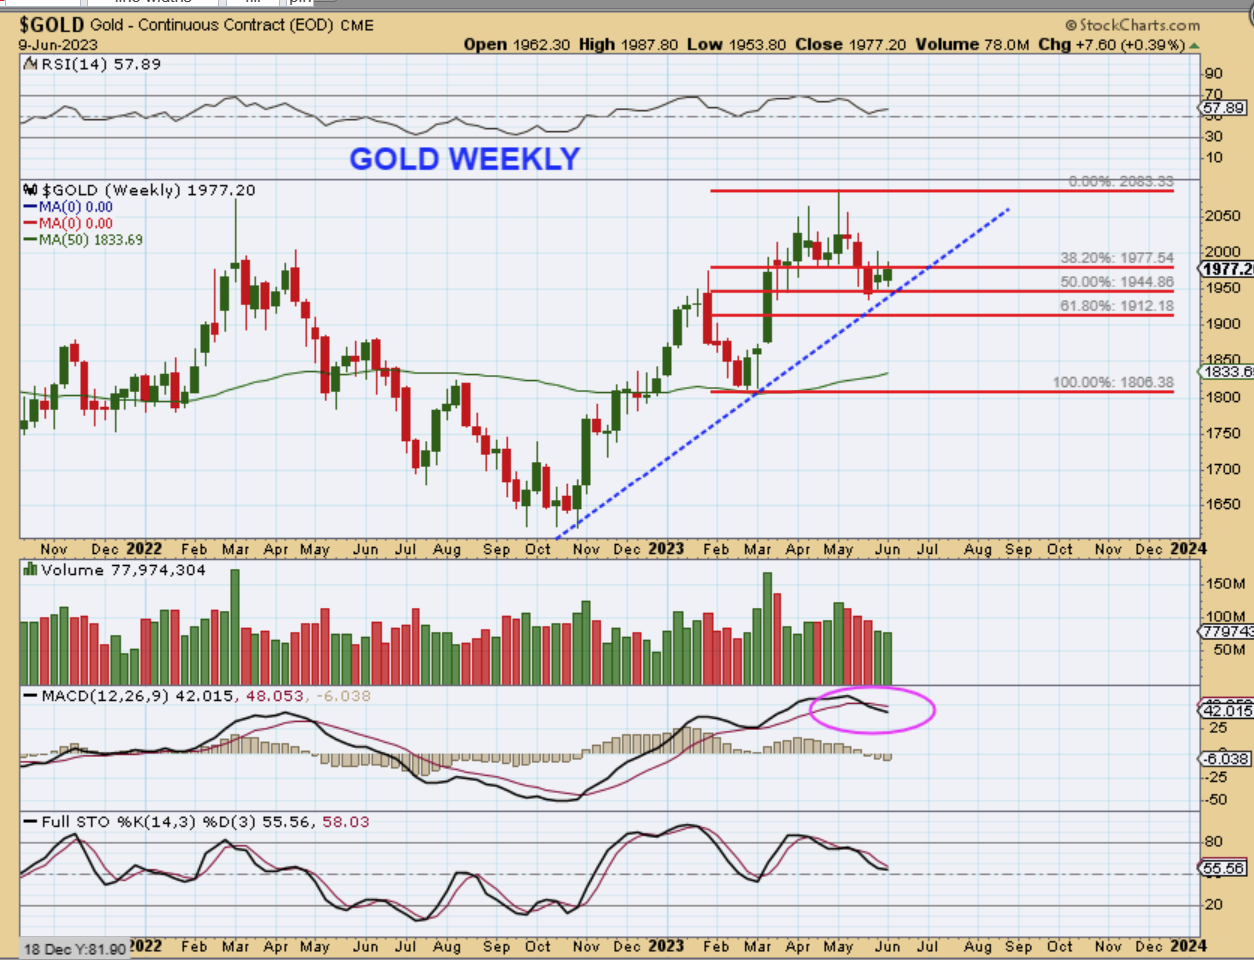
GOLD WEEKLY – So we go to the weekly and we see that Gold has already dropped to the 50% area of the last Rally from March to now. It also looks to be forming a trend line, so this remains a bullish set up, but that COT reading does make it a little hard to expect an ICL soon.
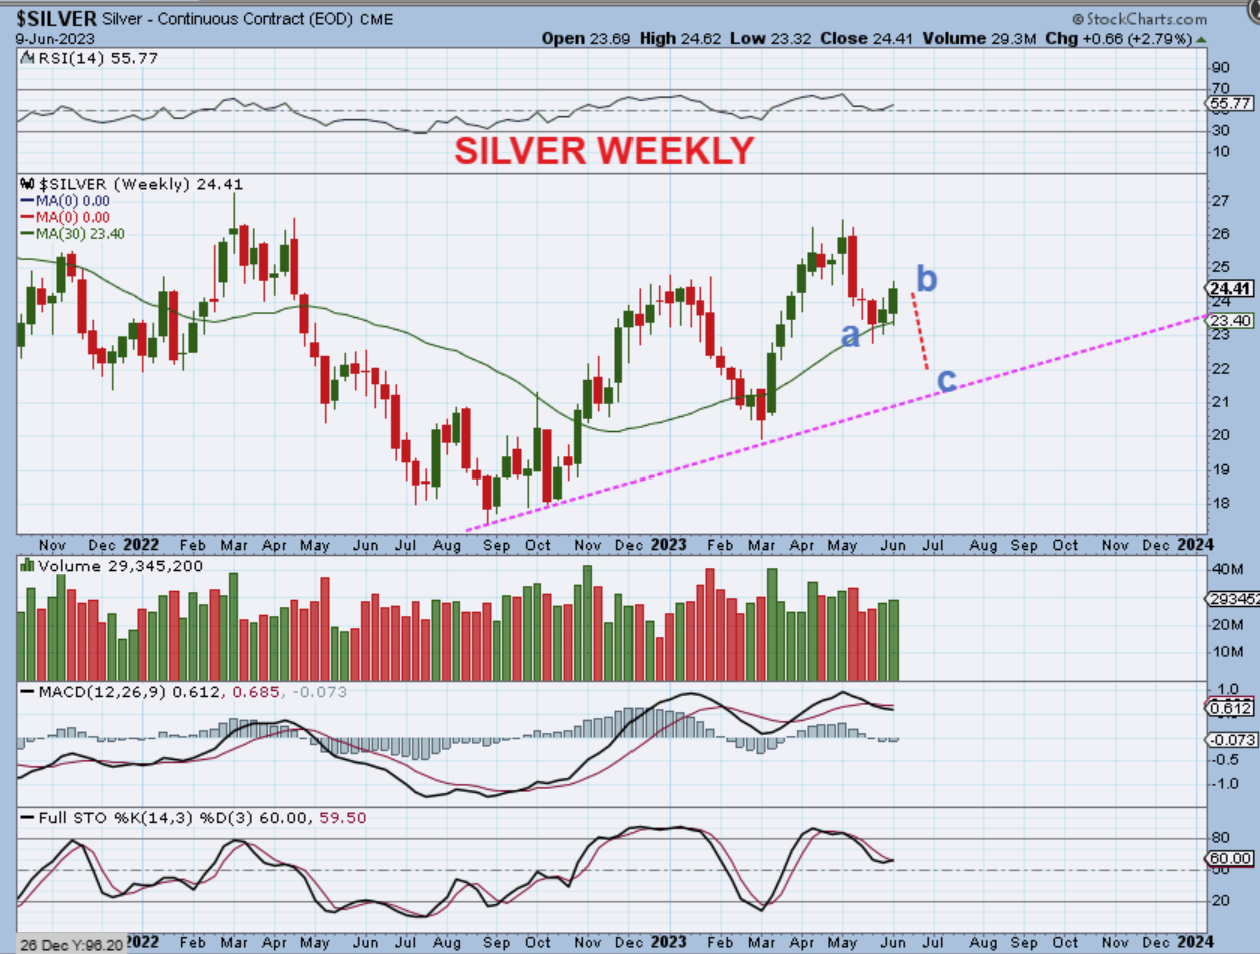
SILVER WEEKLY – Silver is a bullish chart and it reversed off of a support area with that 30 week ma. If I am expecting a deeper drop with an ICL, this could become an a-b-c type of a drop, but honestly at a glance this looks like it just wants to run higher from that 30 week ma support. That said, the GDX chart looked just like Silver until this week, and it did NOT react the way Silver did. Notice here that Silver was up nicely last week and the week before…
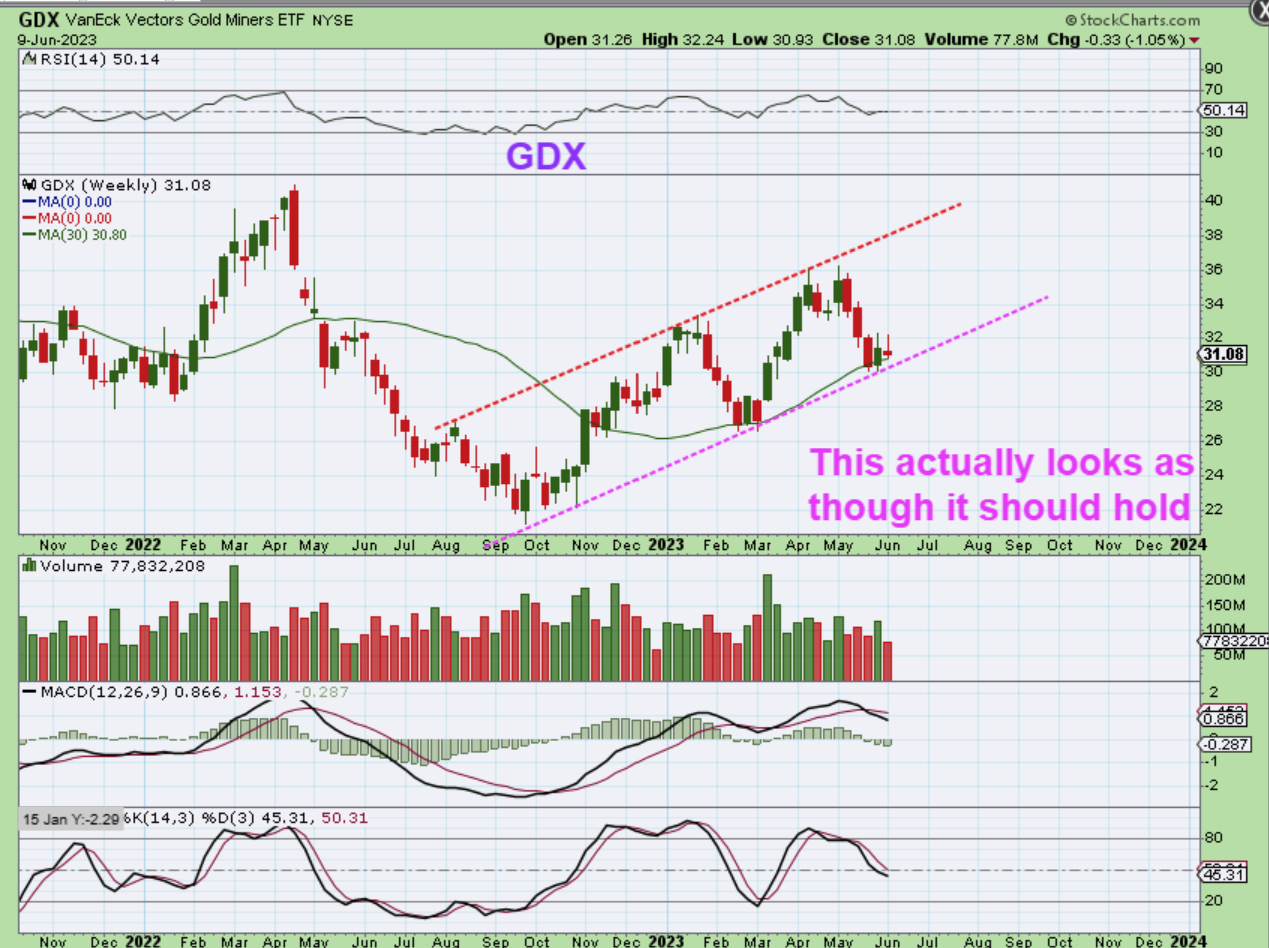
GDX WEEKLY – GDX was not up this week when Gold and Silver were. That USUALLY needs to change very quickly or it is a sign that Miners aren’t leading the move higher and the Metals are just bouncing. Again, at a glance this looks like a Bullish set up on the support of a 30 week ma and a possible trend line.
.
– The General Markets have been bullishly aligned in all of 2023, and they remain bullish week here. They have broken out from bases after the bear market sell off of 2022 and continue to look ready to run back to the former highs at this point. There will be normal dips along the way (Dcl, Icl) and those should present buying opportunities unless something changes.
.
– Oil & Oil Stocks : Oil has been choppy all year, but take a look at a 1 year chart of Oil and a 1 year chart of XOP and you see a big difference. Oil stocks look like they are churning bullishly to attempt another run higher, but they are also choppy and difficult at times too.
.
– The USD has pulled back a little over the last 2 weeks allowing Gold and Silver to bounce. GDX ( Miners) have bounced and then dropped, however, with no follow through higher. The USD may bounce and drop similar to the way it did in March and April, allowing Precious metals to just rally. That is a possibility.
.
– What I mentioned above with The USD is giving me an unclear picture with the Precious Metals. The COT does not really reflect that a sell off into an ICL has started. If I had to guess at what I am seeing, it would mean that past analysis is still in effect, but the drop into a Gold ICL may take a bit longer for that COT to reflect it – OR – as I have stated in past reports, this may have been one extra long daily cycle out of a March ICL (CoT was fine then) and we are just set up to break out and run to new all time highs soon, in a 2nd daily cycle. What about the Miners lagging? Time will tell.
,
So again, with Cycles being stretched and cut short in the past due to banking failures, it has affected how we read the set up in Precious Metals and the USD. That rally in the USD in Feb – March made no sense when it seemed to have one or 2 long daily cycles. On June 2 I showed you this. I don’t see obvious DCLs in that first USD rally from the blue arrow to the #1, and we could just get a 2nd one like it. If So, Gold isn’t putting in an ICL now, it is setting up to continue higher out of that March shortened ICL. We just have to wait and see how this continues to play out, due to the abnormalities. With all of this there was a new oddity this week…
.
With all of this there was a new oddity this week.
The Set up for Gold, Silver, and the Miners were Bullish in technical analysis, but Miners just couldn’t follow Gold & Silver higher. As a reminder, this was Silver: And it looked exactly like GDX until this week, but Silver rallied last week.
.
As a reminder, this was GDX: And it looked exactly like SILVER until this week. No push higher here.
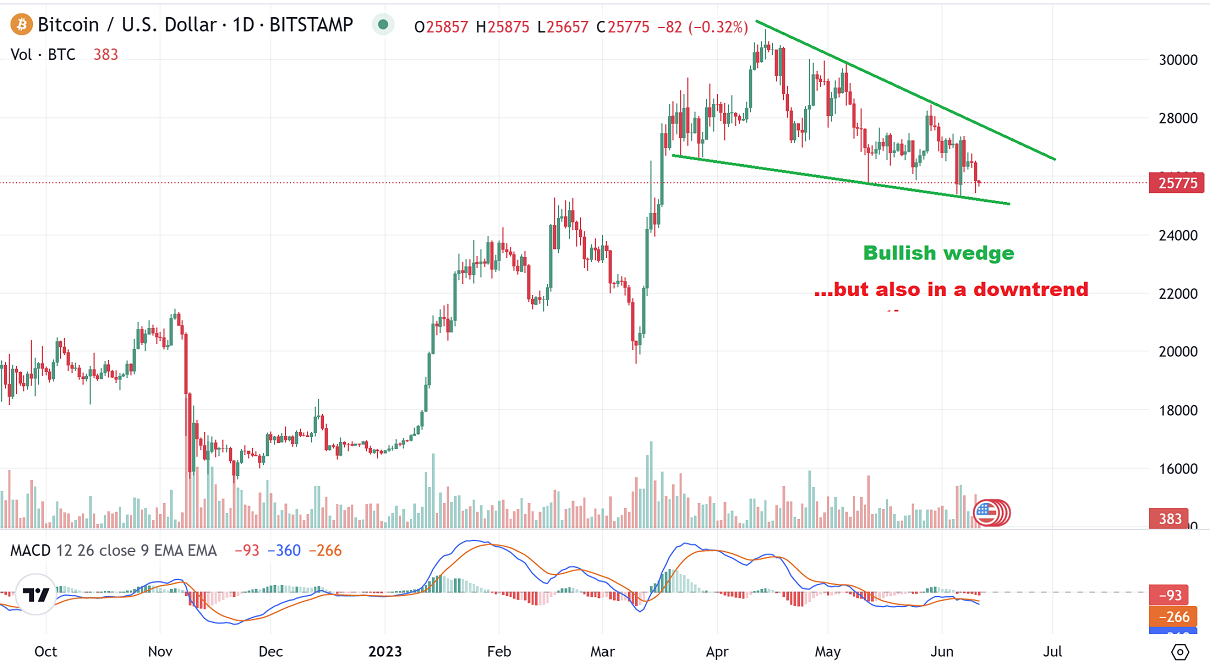
We really need to continue to watch how this plays out. Step by step these sectors will slowly reveal their full intentions. For now I use smaller positions, I always use stops, and try to trade less just to be safe. I am actually trading more as a daytrader or short term trader, but some of my recent buy & hold trades over the past couple of weeks have worked out well too, like MVLA, TWST, ARQQ, SENS, and so on, but I am out of all of these trades with a possible dcl coming due. Cryptos got choppy and Bitcoin is in a downtrend, so I exited those positions a while back too. ETFs in the General Market have been very good trades out of the lows and have not violated the 10sma. I am really looking forward to a low in the Miners and for Gold to break to new all time highs. I think that Miners will put on quite a show if Gold breaks out and runs toward $3000. That will be a real money maker, even if it doesn’t bottom for a month or so from now, so let’s be patient and see how that all plays out.
.
Enjoy your Sunday and thank you all for being here at Chartfreak.
.
~ALEX
.
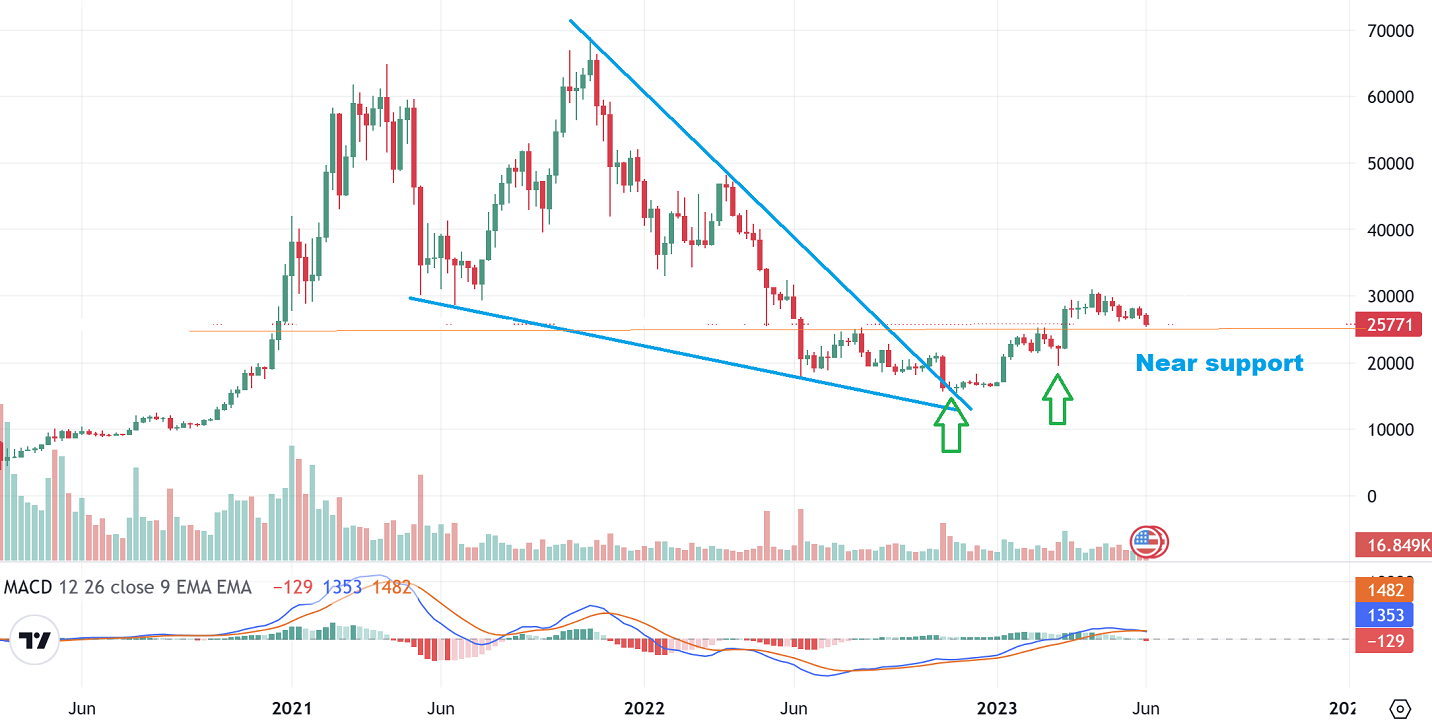
BITCOIN has been selling off into the next low in a downtrend, but it is choppy so it isn’t in freefall. This is a steady chop lower and now it also looks to be forming a Bull Wedge on the daily. So for now I have to expect lower lows with bounces until we reach the next lows. The weekly is interesting too.
BITCOIN WEEKLY is dropping, but there does look to be a decent amount of support just below current price. I like the set up a lot, and the LONG TERM set up remains VERY BULLISH. This is a hard sector to trade with such long daily cycles and big moves, but this chart makes it easy to see that a solid low is in place, the bear market correction ended, and upside potential is very good. Note: Long term weekly charts of crypto stocks like MARA, RIOT, CIFR, CLSK, HUT, etc are all very nice charts too.