Friday June 23rd
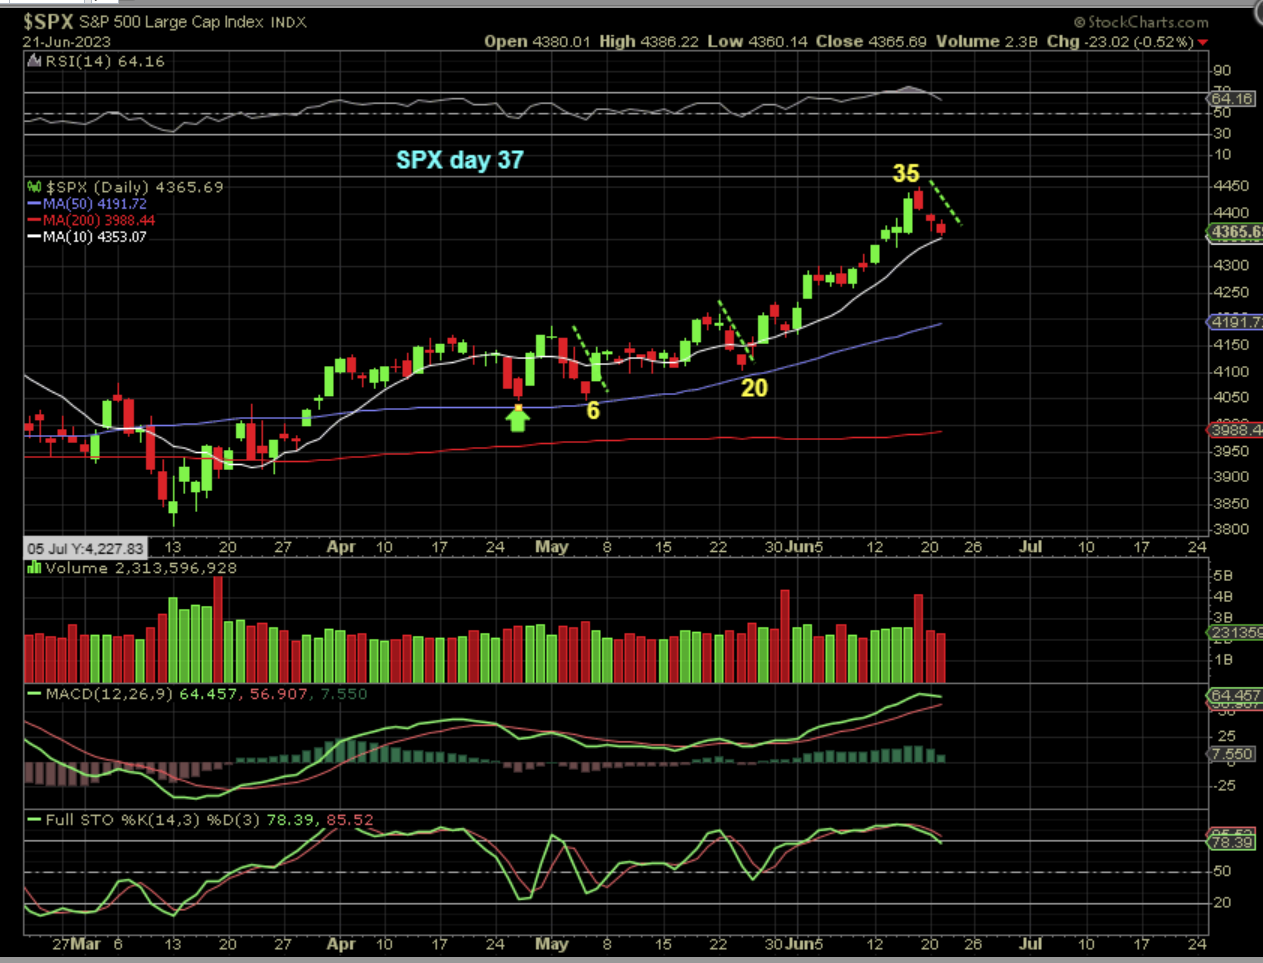
In yesterdays report I used this chart and mentioned the symmetry of the pull backs. Until this is broken, we are usually still inside of the same daily cycle: Yesterday I said…
.
THE SPX dropped 23 more points, but it is still above the 10sm and the drop is now similar to the other recent drops (symmetry-wise). If we don’t bounce here at the 10sma, we have likely started the drop into the dcl at this point. The RSI and stochastics are overbought.
.
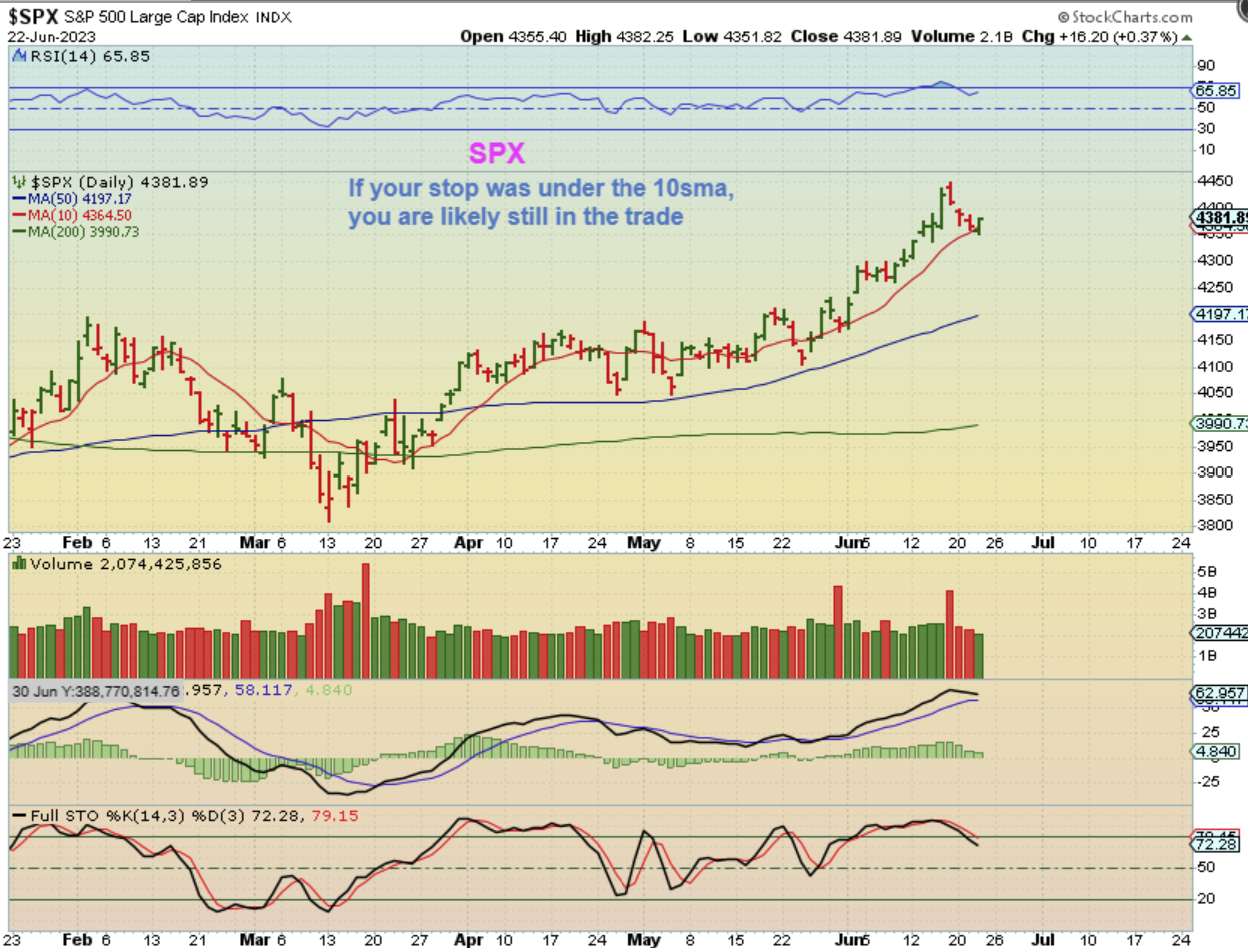
THE SPX actually reversed at the 10sma and the symmetry is still in tact, so I feel that we have a ‘continuation’ of the run higher and not a dcl yet.
.
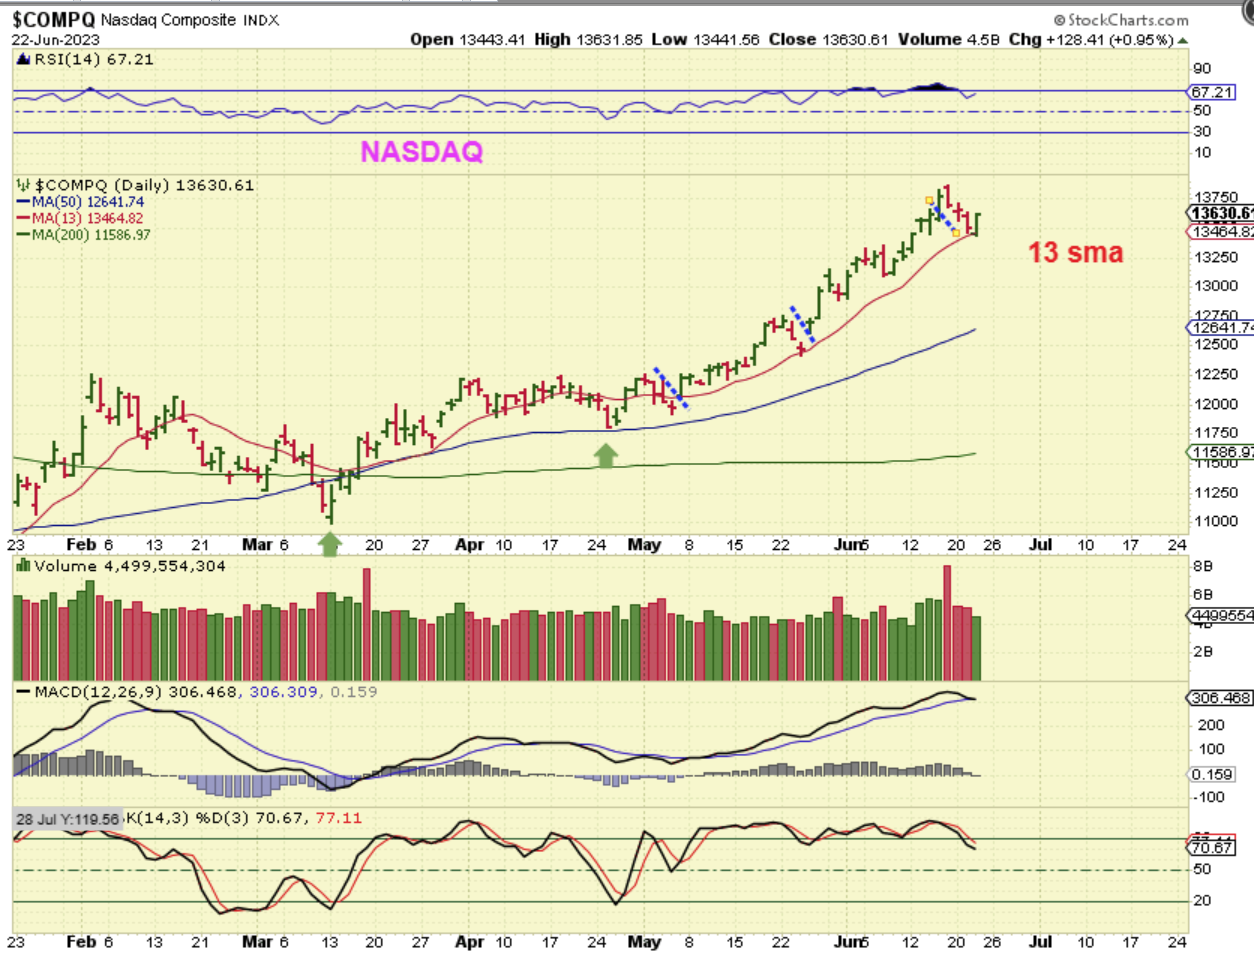
THE NASDAQ also reversed at the 10sma ( I have the 13 sma here). Again, the symmetry is consistent, so until that breaks, we are likely going higher. Anyone that is still long can just continue to raise stops along these lows. So far these are 3 or 4 day dips.
.
THIS IS WHAT I SAID YESTERDAY FOR OIL
.
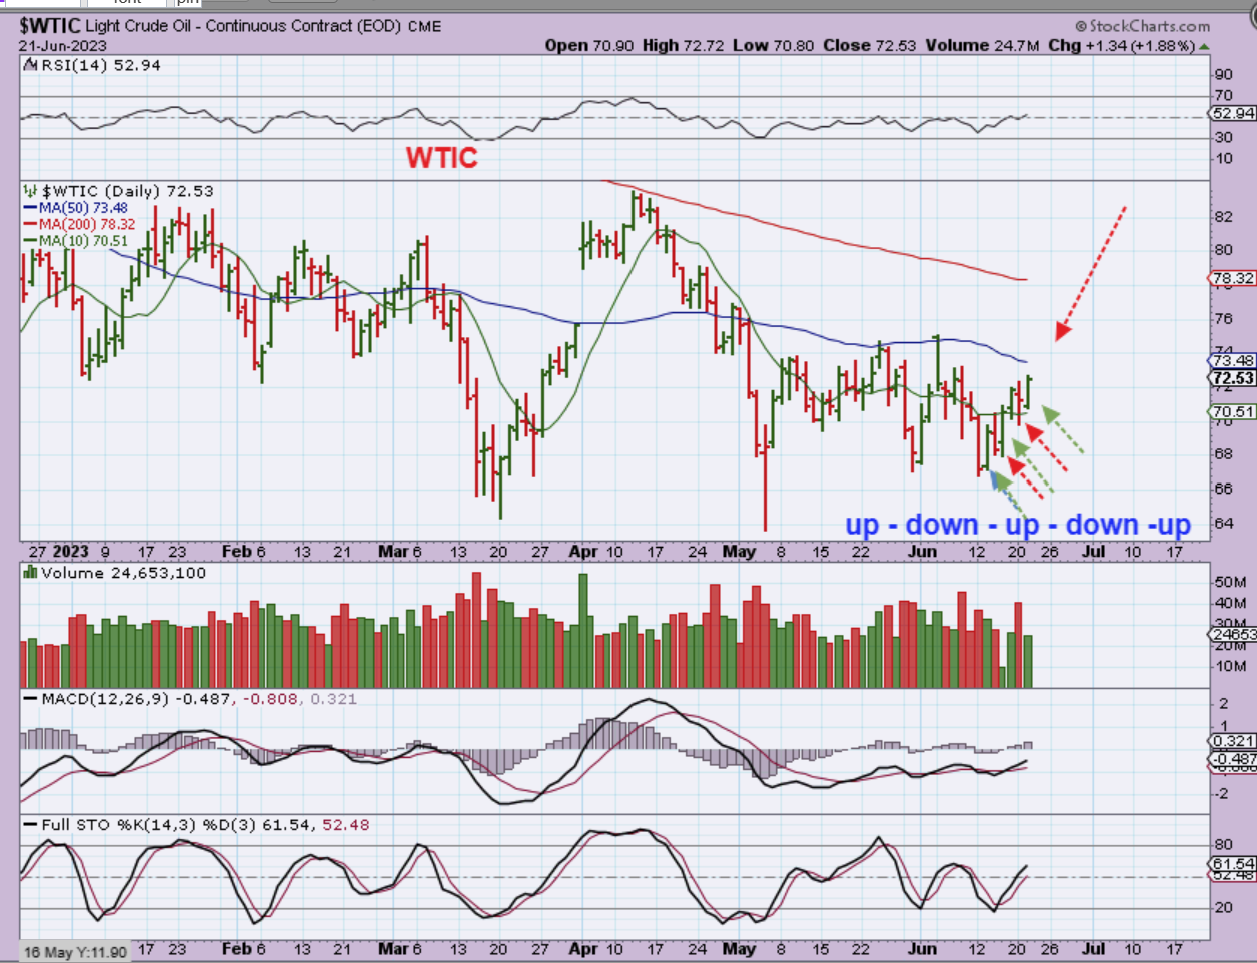
WTIC – Oil is choppy. Each day it goes Up, then down, then up, down, up. What will it do when it gets to the downward sloping 50sma? It is due to go down.
.
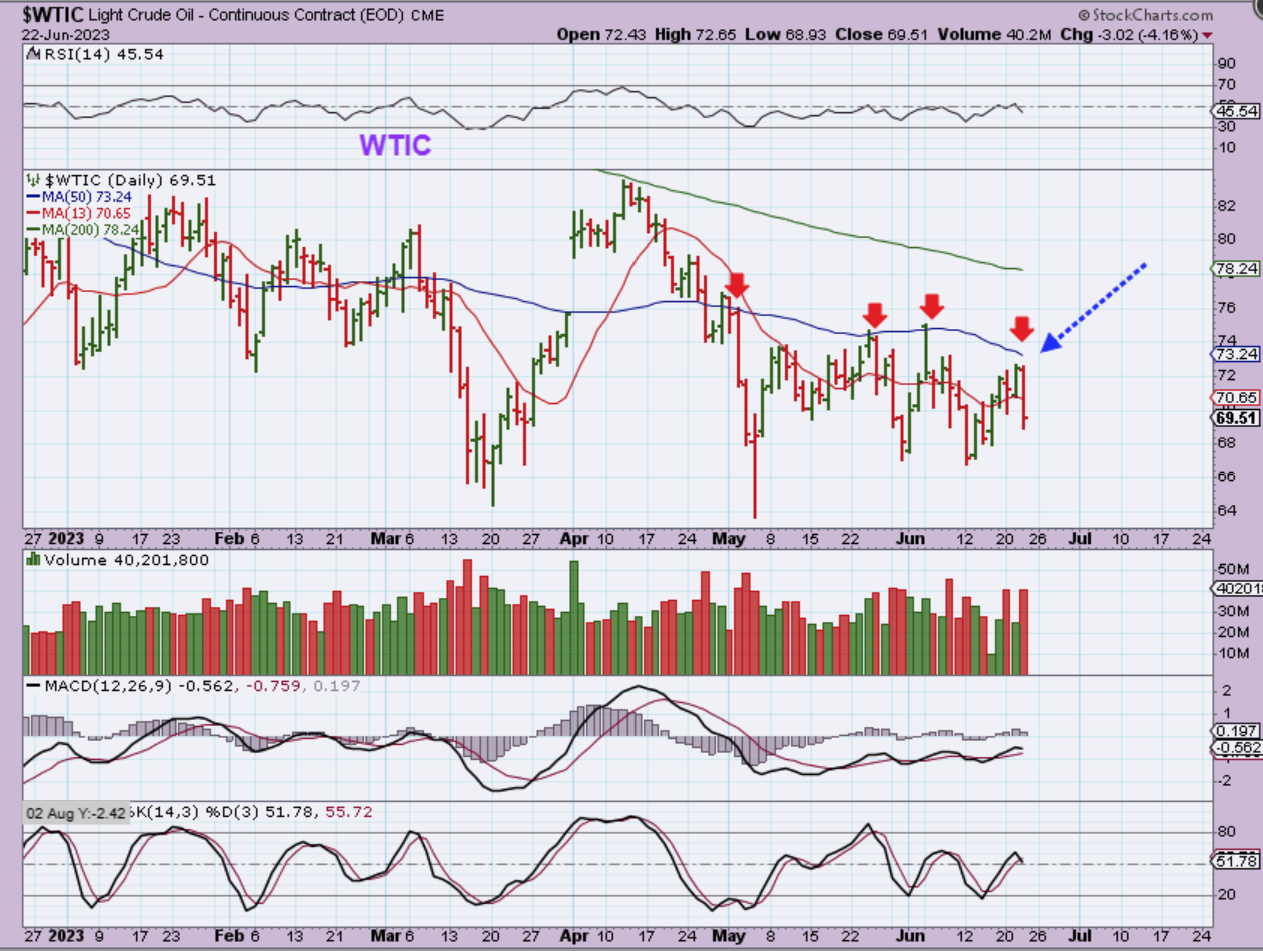
WTIC – As expected, OIL Took a dive under the 50 sma. Oil remains very choppy and quite frustrating for traders.
.
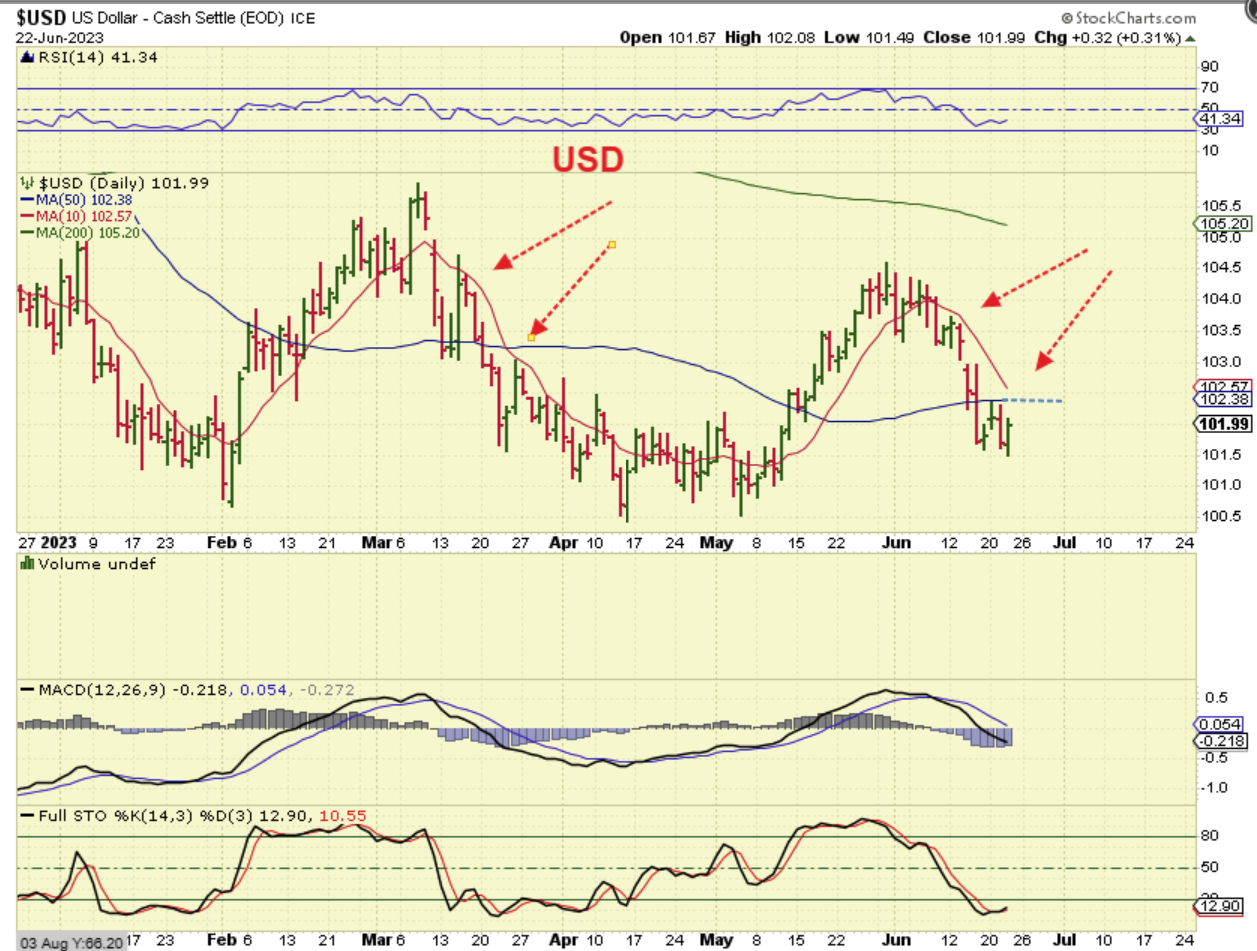
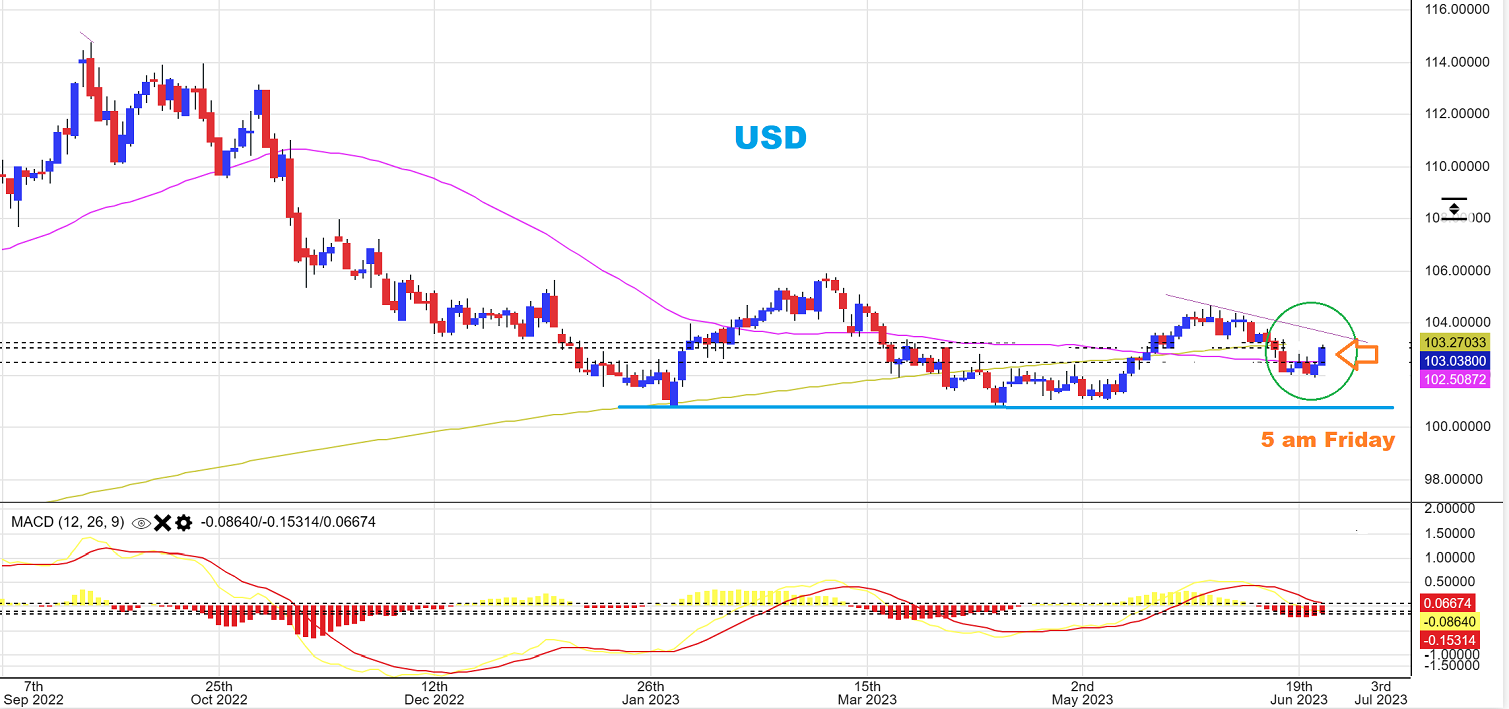
THE USD made a new low and then reversed higher. As I write this report at 5 a.m. Friday ET time, the USD is actually up quite a bit, but Gold is slightly green too.
.
As I write this report at 5 a.m. Friday ET time, the USD is actually up quite a bit, but Gold is slightly green too. This looks like a daily cycle low has formed.
.
For Gold, Silver, and the Miners, I want to look at a few charts to get a few different viewpoints.
.
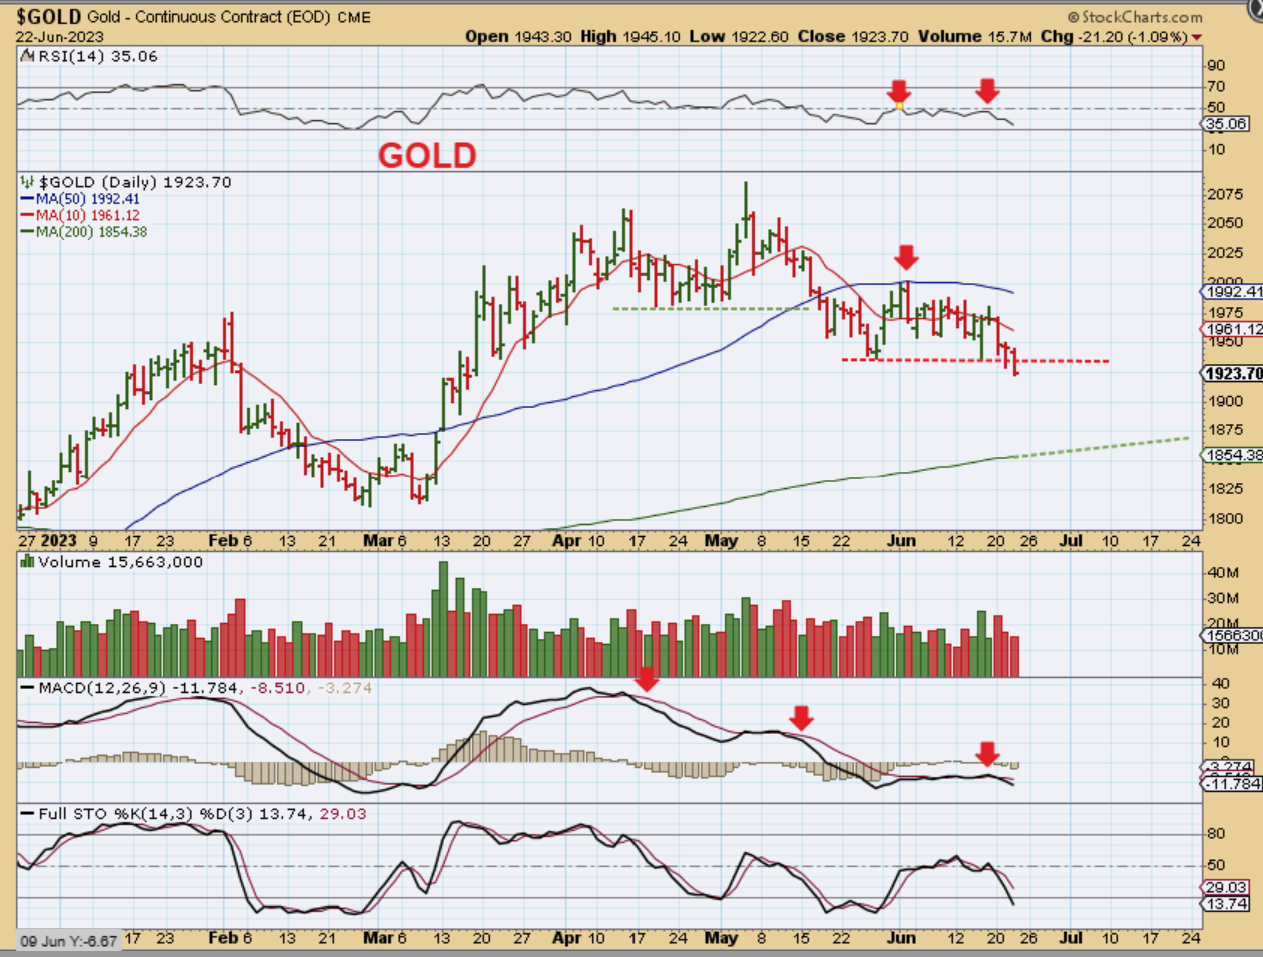
This view of GOLD shows that a new low clearly broke below the lows of late May on Wednesday and then again on Thursday. It would seem that Gold could drop to the 200sma, so let’s look at a few different charts.
.
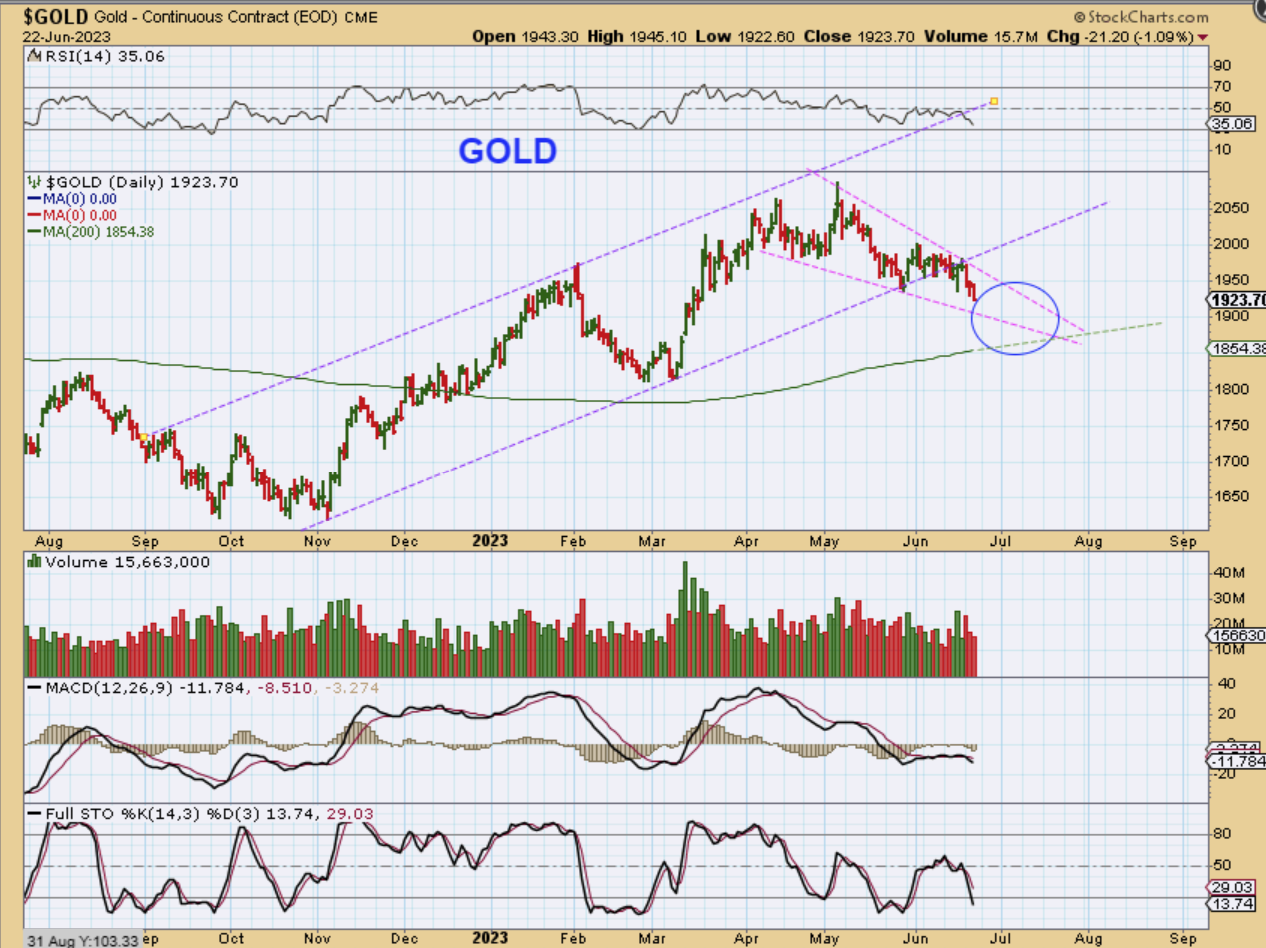
Here we see that GOLD did NOT tag the 200sma on that Feb-March drop, but it was close. If you remember correctly, that early reversal was due to the Bank failures. When the first Bank failed, it rocketed Gold straight up and interrupted the sell off toward that 200 sma. Could this chop lower to the 200 sma this time? It could do that as an A-B-C drop into an ICL 4 months from the March lows (with a USD bounce out of the dcl). What about Fib levels?
.
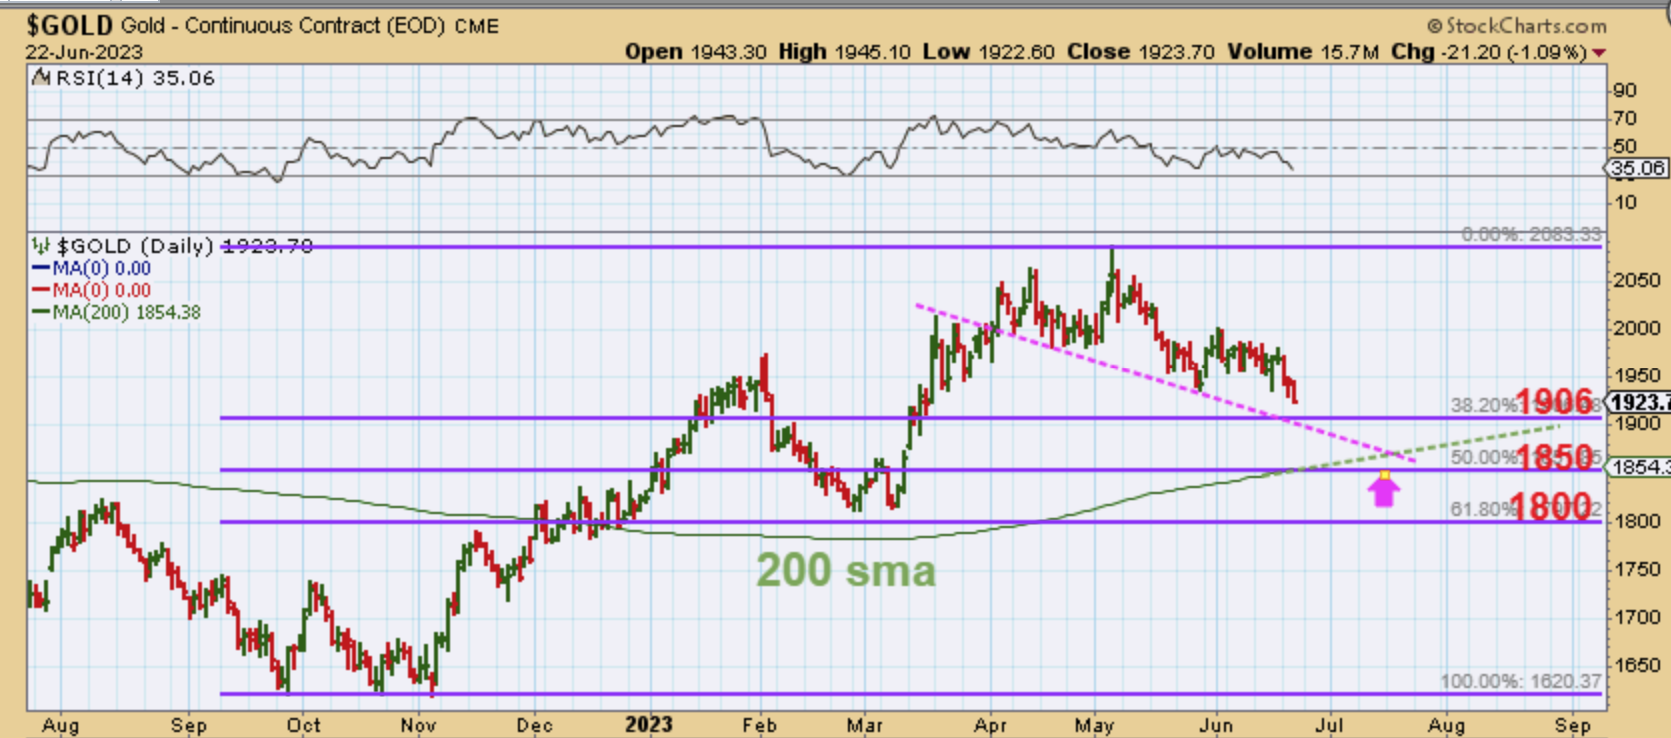
GOLD – I rounded these off to make them easy to remember and they were only a few dollars off from these nice round numbers. Levels are $1906, $1850, and $1800. The 200 sma is right about at the 50% fib level, so $1850 is a good support area that we can keep an eye on.
.
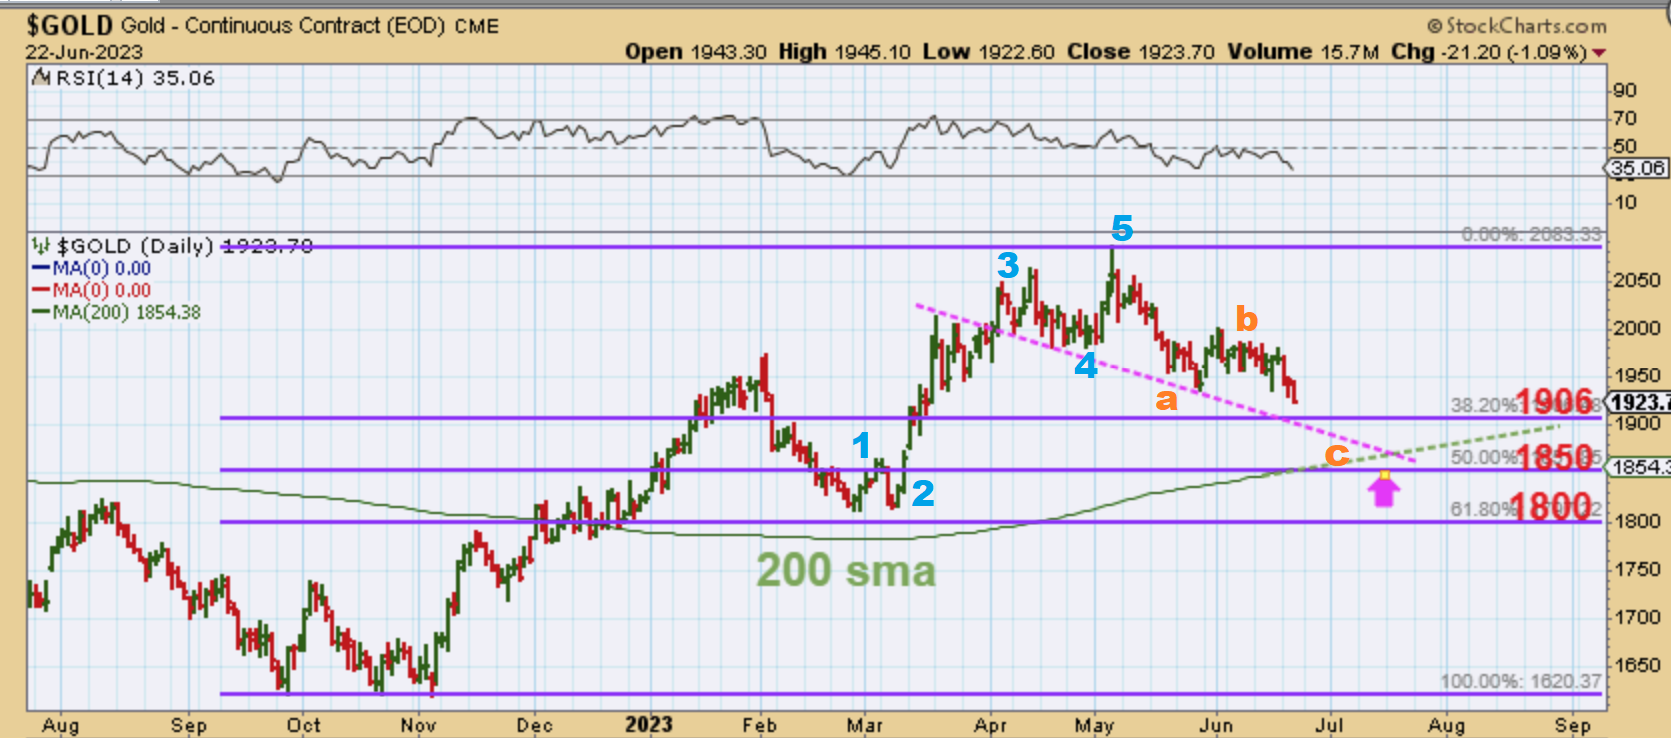
ICLs are almost always in an A-B-C form.
Originally in May I was saying that we could get a low in Late June, but Gold is not selling off sharply, it has been chopping sideways, so it may take until early July to reach the next low. This may or may not be proper E.W. labelling, but I can see 5 waves up from March and an a-b-c down forming.
.
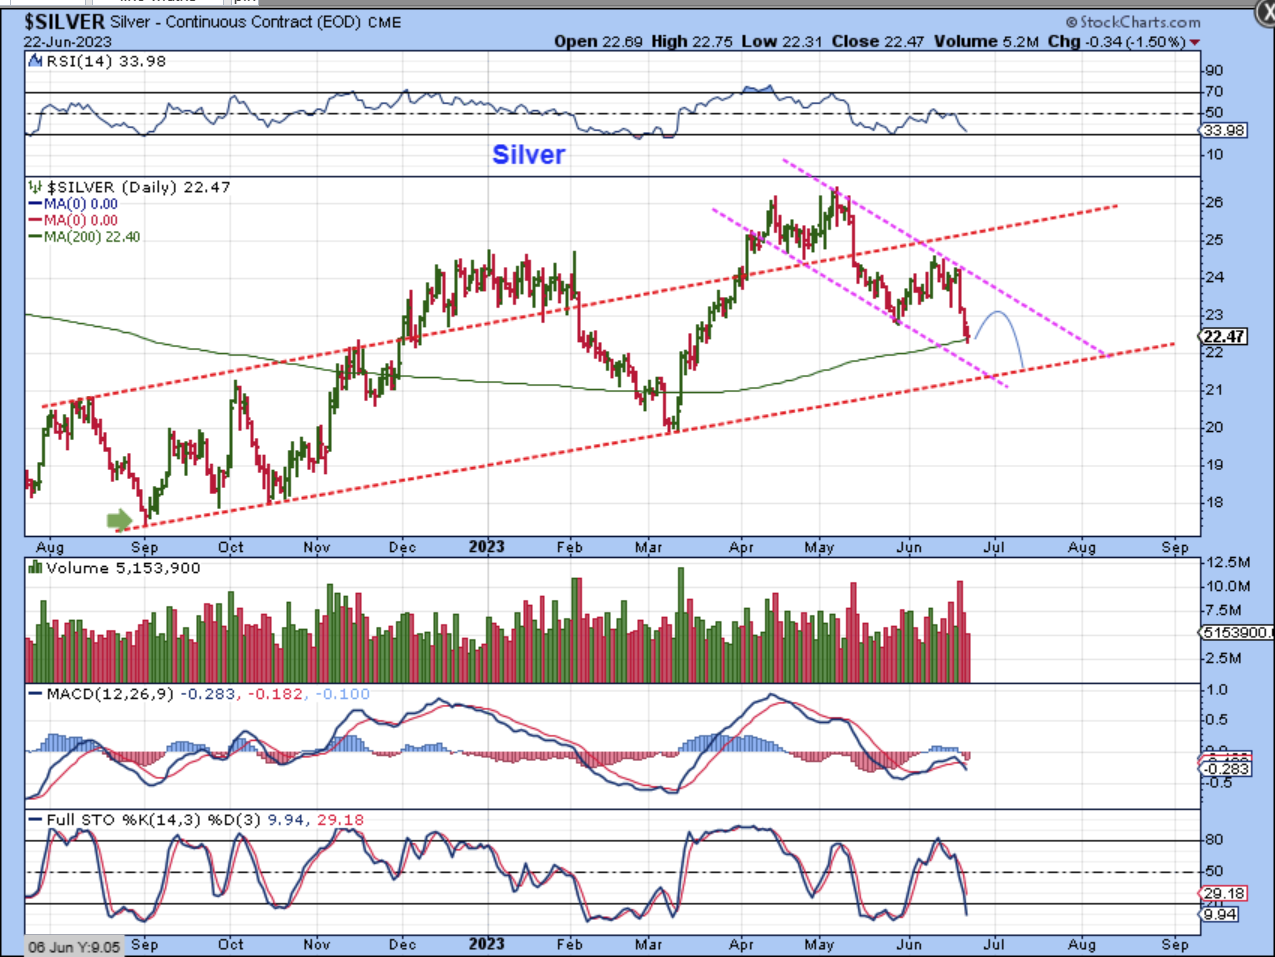
SILVER is at the 200sma, but because Silver can move so swiftly, I wouldn’t really count on that support holding up if the selling picks up. One thing that I do want to mention is that Silver bottomed in Late August /Early September last year, and that was 1 month ahead of when Gold bottomed.
.
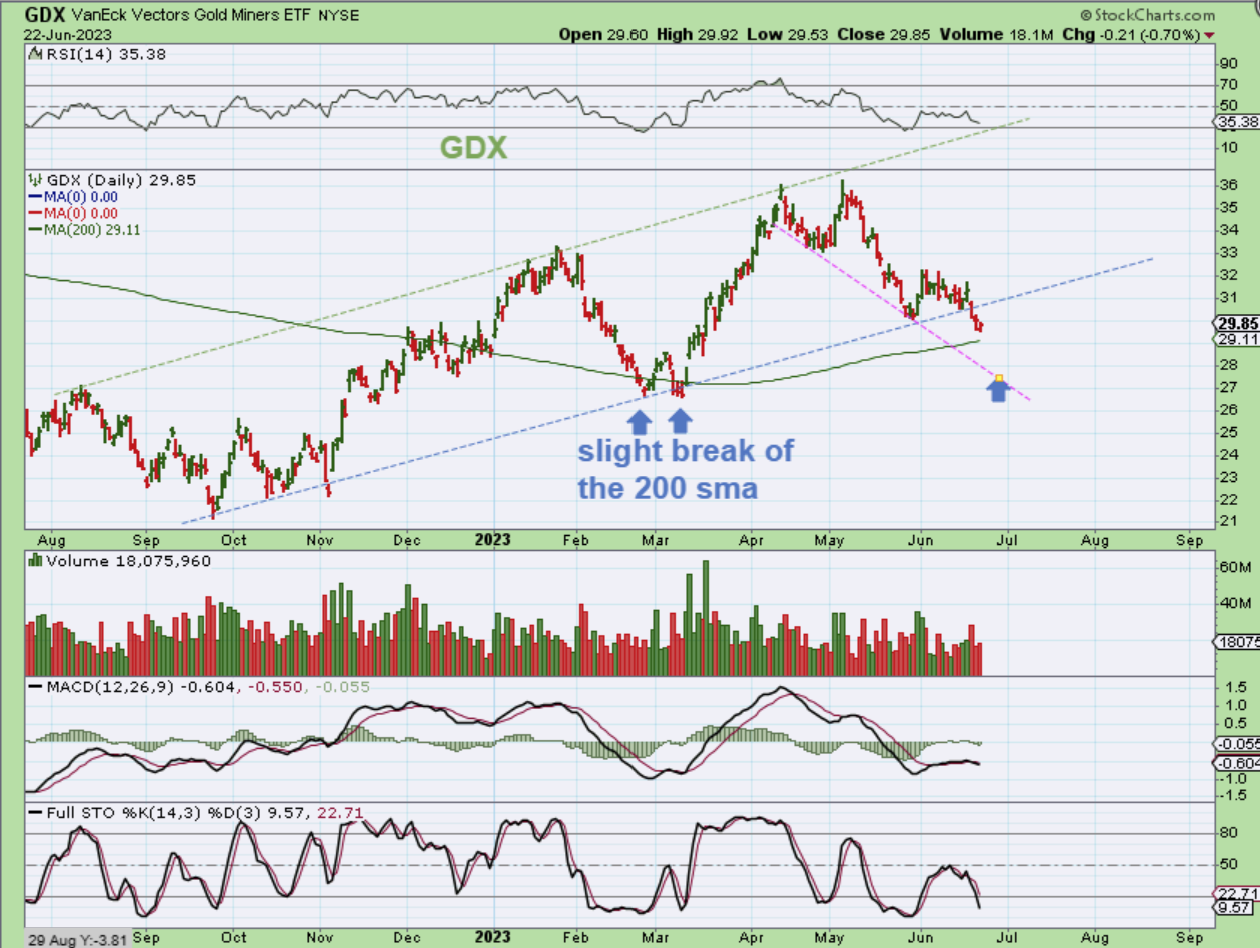
GDX is closing in on its’ 200sma. I have drawn an upward sloping channel using the ‘best fit’ method along the lows, and price has broken that lower line again. In this case, ‘Best fit’ keeps the channel parallel to the top line and has frequent touch points. The March lows also slightly broke below the 200sma and again, that dip was even cut short with Bank Failures.
.
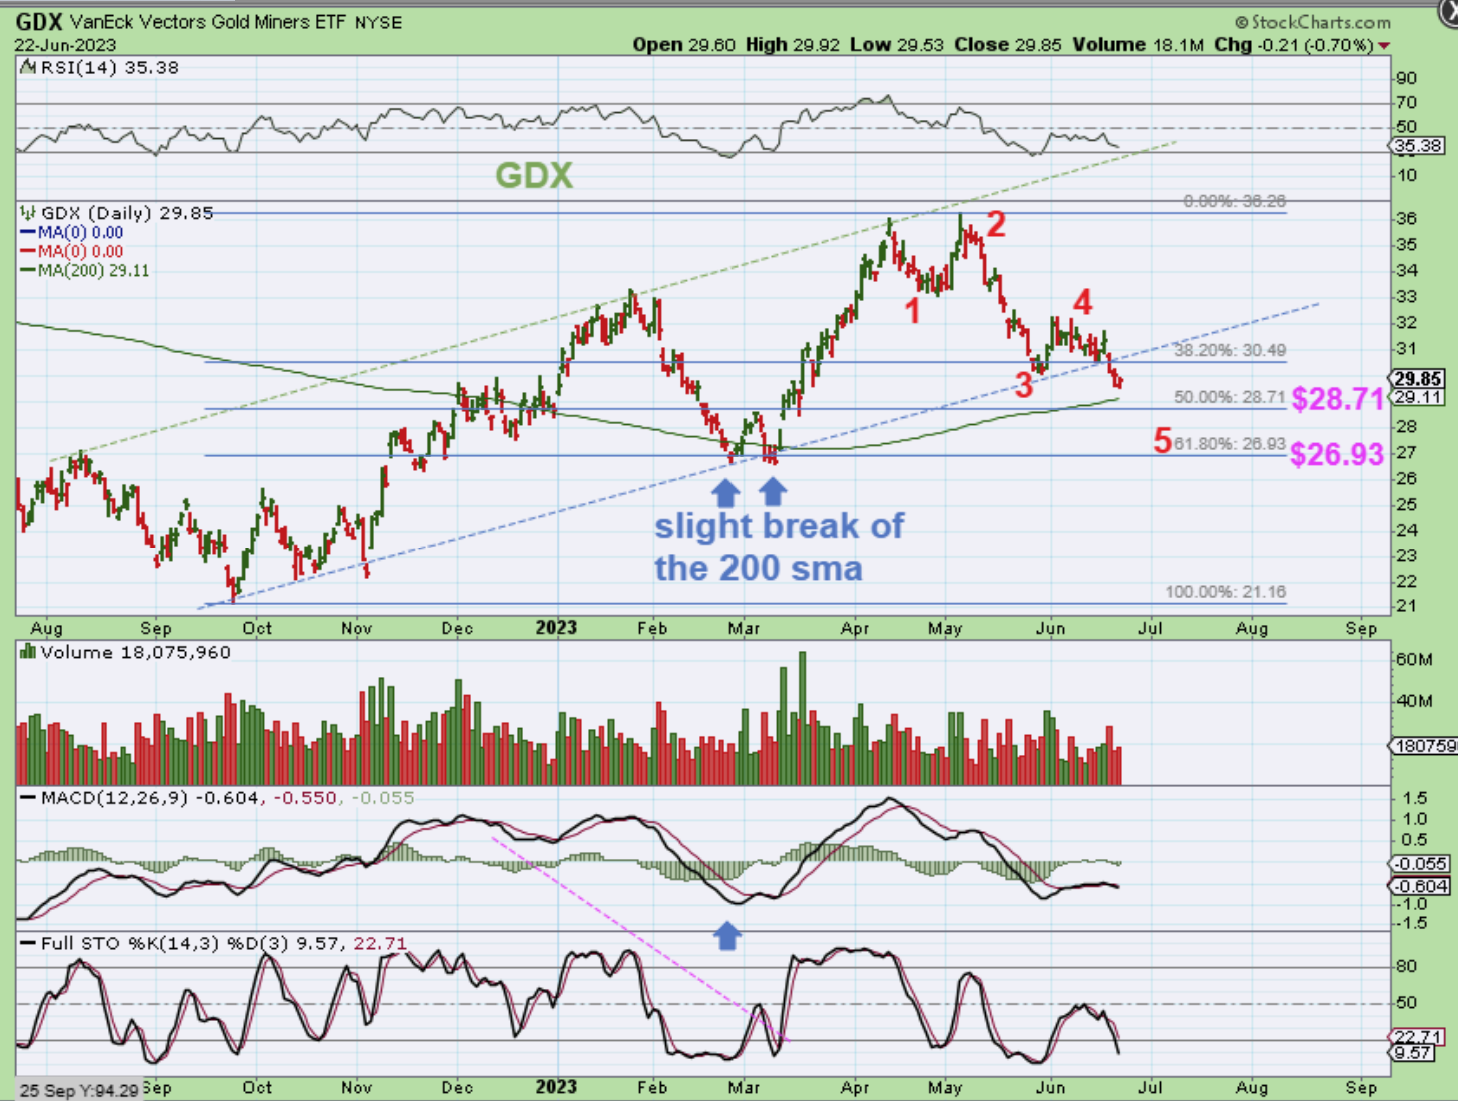
GDX – I can see 5 waves of selling forming here so far. The 200sma is a little above the 50% Fib number. Possible target areas with this chart are $29 (200sma) or $28.71 ( 50% fib), and $26.93 ( 618% fib). It may be easier to remember $29.00, $28.75, and $27.00.
.
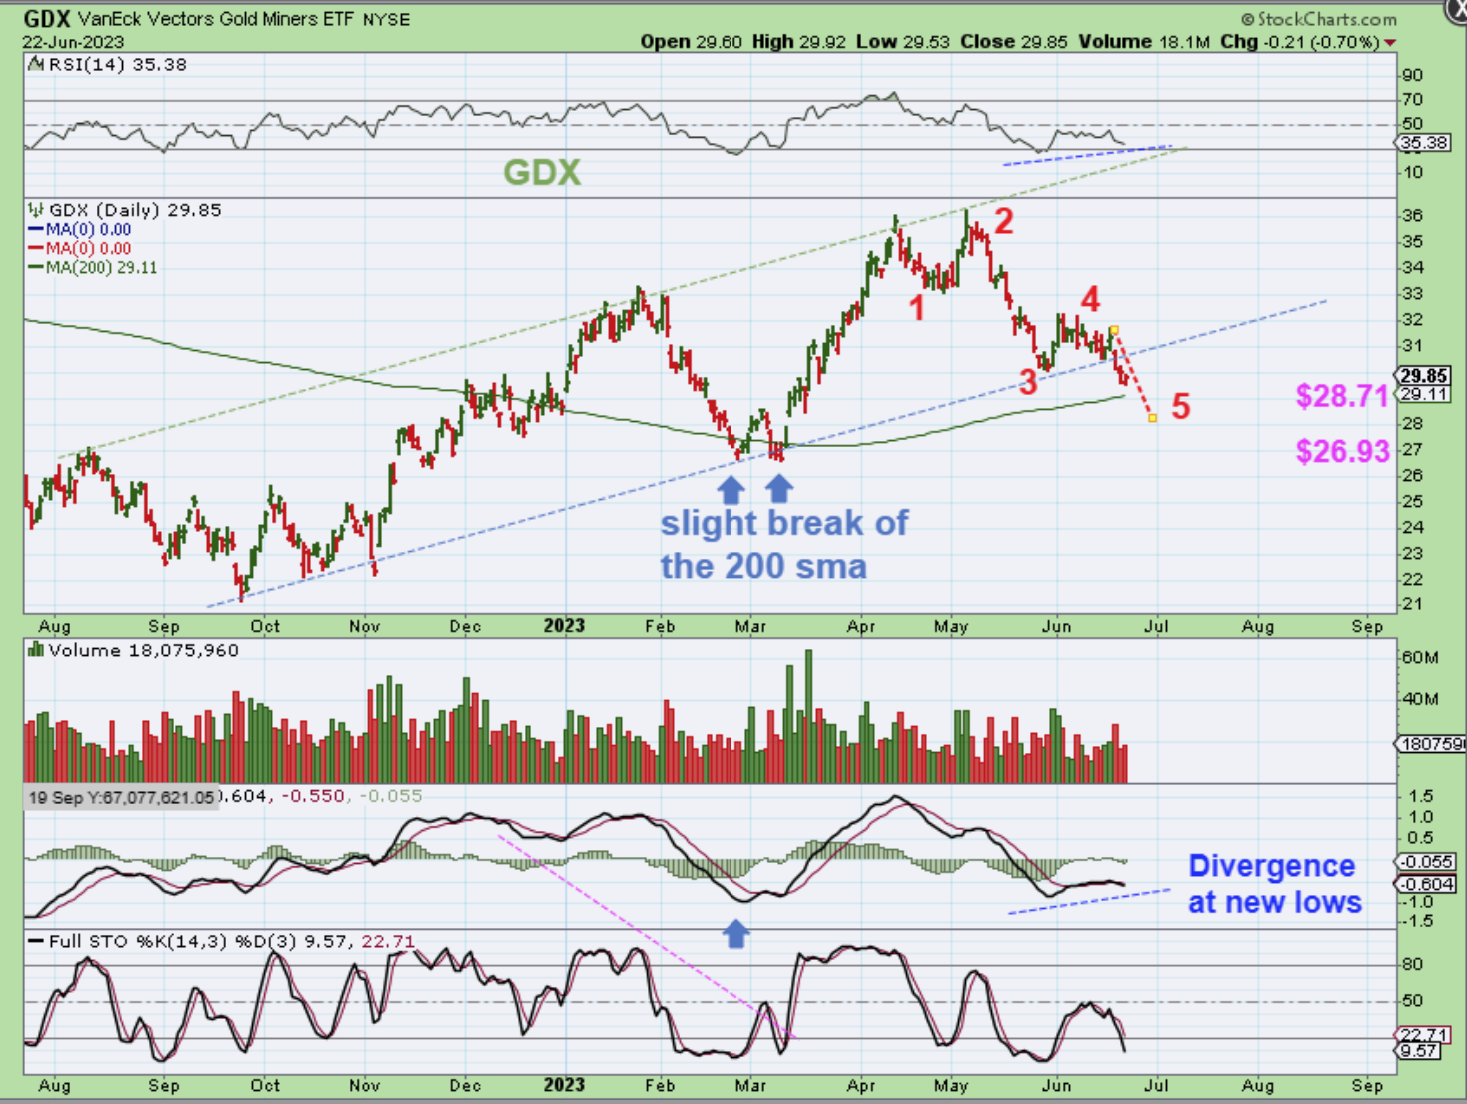
GDX – We can’t tell if this sell off will just remain choppy and tag the 50% fib area(?) or will this sell off accelerate to $27, but here I have drawn it as a 5th wave just slightly breaking that 200sma again like it did in March. I do already see divergence at the new lows, so this could bounce at the 200sma.
.
Today is Friday, the last trading day of the week. The General Markets are late in their daily cycle, but they also continue to find bullish buying on the dips. Oil remains choppy, and the Precious Metals continue to chop lower as they eventually seek out a final low. At this point, we could see bounces along the way (choppiness), but it seems too early for that low to appear, at this point. That will be a great ‘Buy the Dip’ opportunity, especially since we are expecting Gold to have a Major break out and rally higher. Miners should rally strongly out of these sale prices 🙂 Enjoy your Friday and Weekend!
.
~ALEX
.
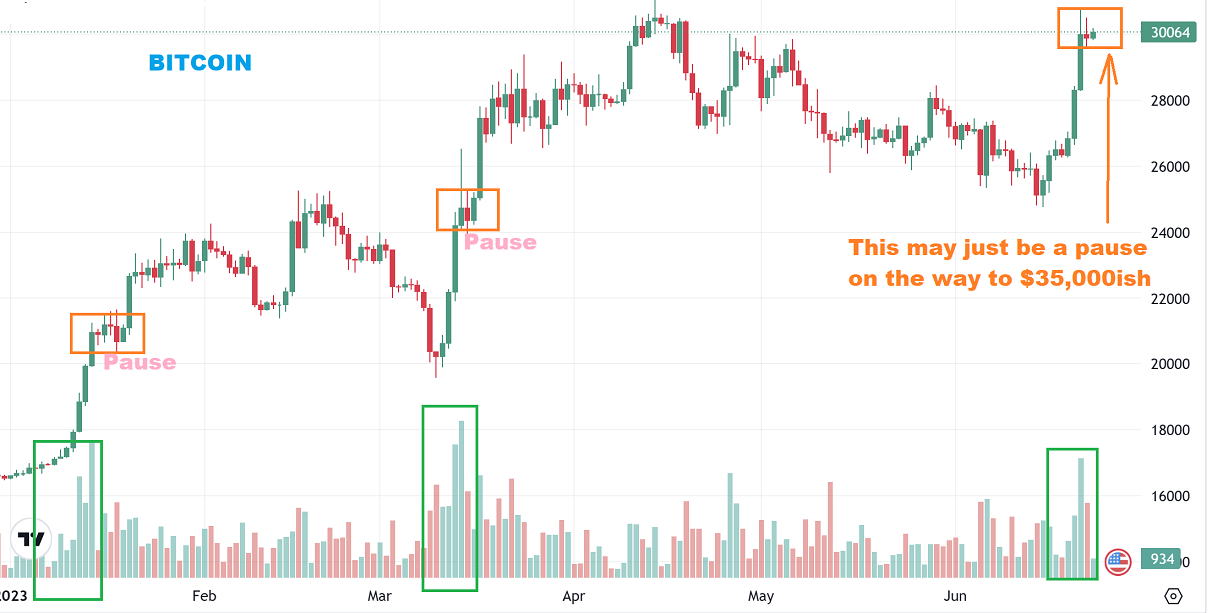
Bitcoin: The volume surge out of the recent lows was healthy and in past rallies out of the lows, we saw multi-day ‘pauses’ and then a continuation higher. That makes me think that we may just be pausing here before another rally higher continues. The hard part is trading Crypto Stocks 5 days a week, while the Cryptocurrency trades 24/7.