
Wednesday May 17th – Pullbacks
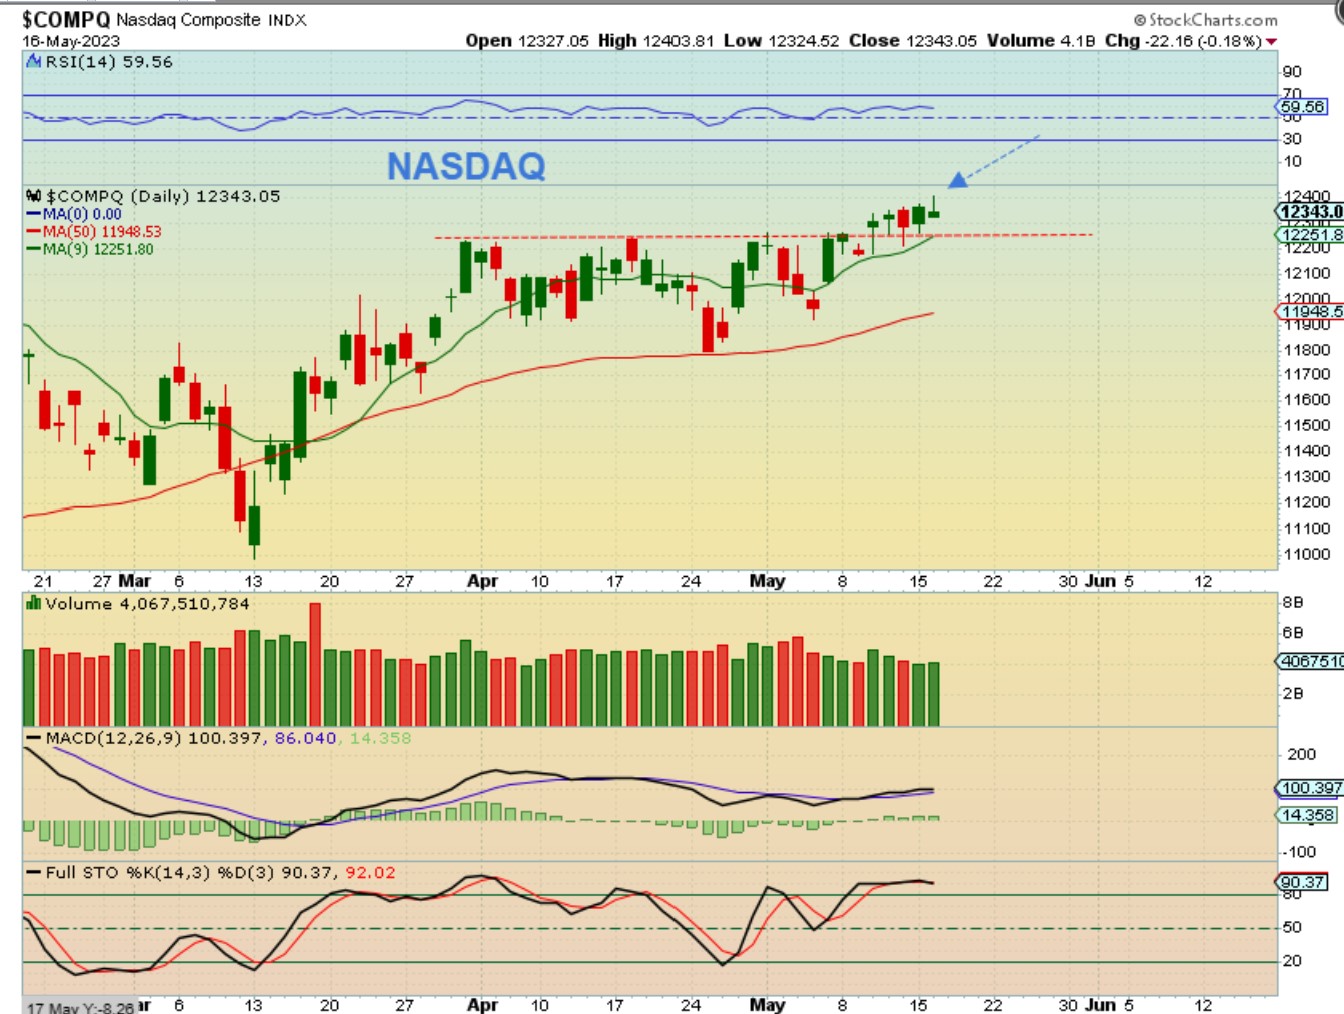
Nothing really changed with the General Markets, but there was noteworthy price action in the Precious Metals Sector, so this report is just going to focus mainly on that Precious Metals area. It will take me hours to gather charts and try to explain some things in that area alone. As a quick note though, The Nasdaq, SPX, and SOXX did have reversal candles, so we may begin to see a pullback start in the General Markets. This is day 15 from that last low on the 50sma.
.
.
Precious Metals and the USD: I want to talk about the abnormal situation that took place in March when the Banks failed. It cut short the normal expectations and Cycles were thrown off. Let’s revisit that time.
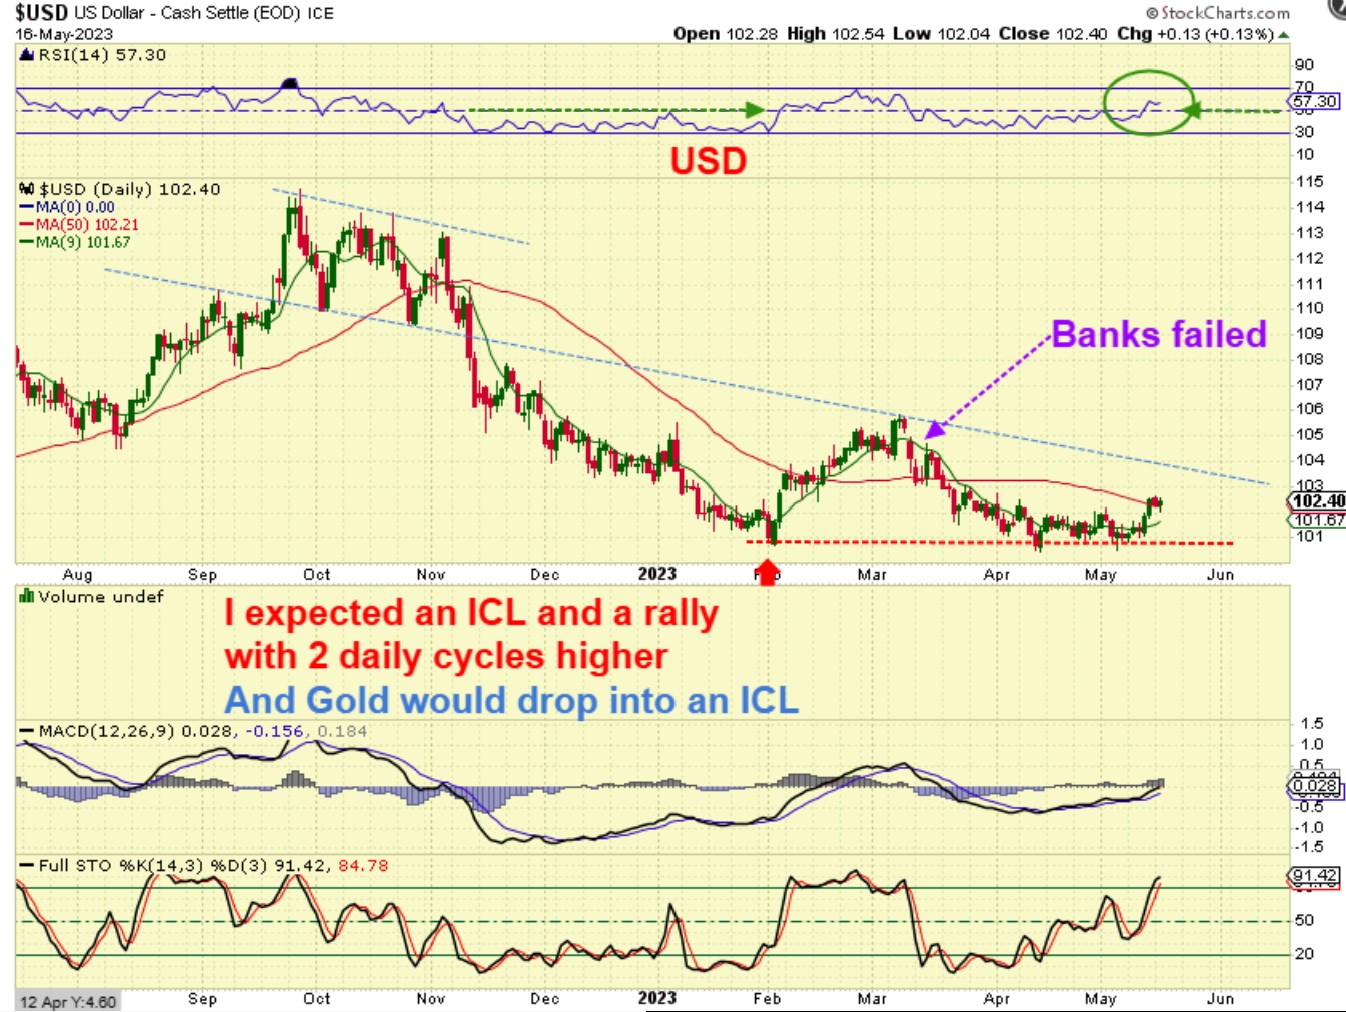
You likely recall that in February I was looking for a rally in the USD out of an ICL( 2 daily cycles higher), and a drop in March & possibly into April for Gold to find Its’ ICL. That was cut short with the Banking failures…
.
THE USD started to rally in February, but you can see that it looks like one strong rally out of the ICL, and the Banks caused it to gap down sharply. That became the ‘peak’ and it just continued to roll over ever since. Let’s zoom in.
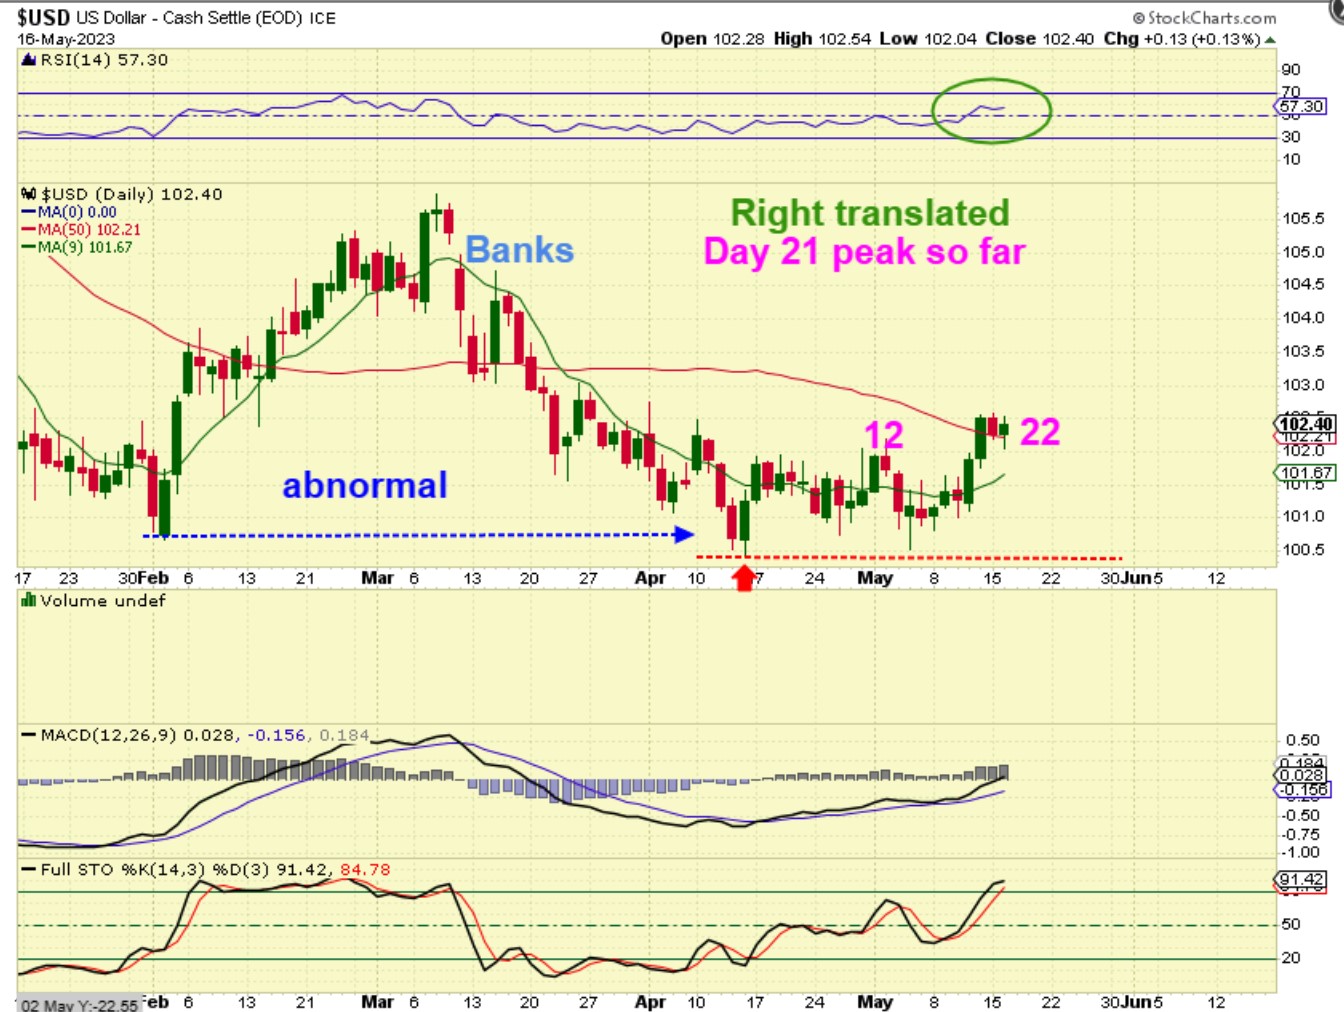
THE USD: So that was abnormal. It was about 24 days straight into a peak, and then a 2nd daily cycle never made a new peak. We just had one round rally and drop that then broke to new lows below February. So…
.
So April broke below what should have been the ICL in Feb. That is weakness. That that is a failure – but now we have the USD with a new daily cycle chopping sideways and it pushed to a peak this week on day 22. It closed above the 50sma and the RSI is above 50%, and those are signs of strength. THIS has me wondering if the USD is going to discount that abnormal bank induced movement and finish what it started? If so…
.
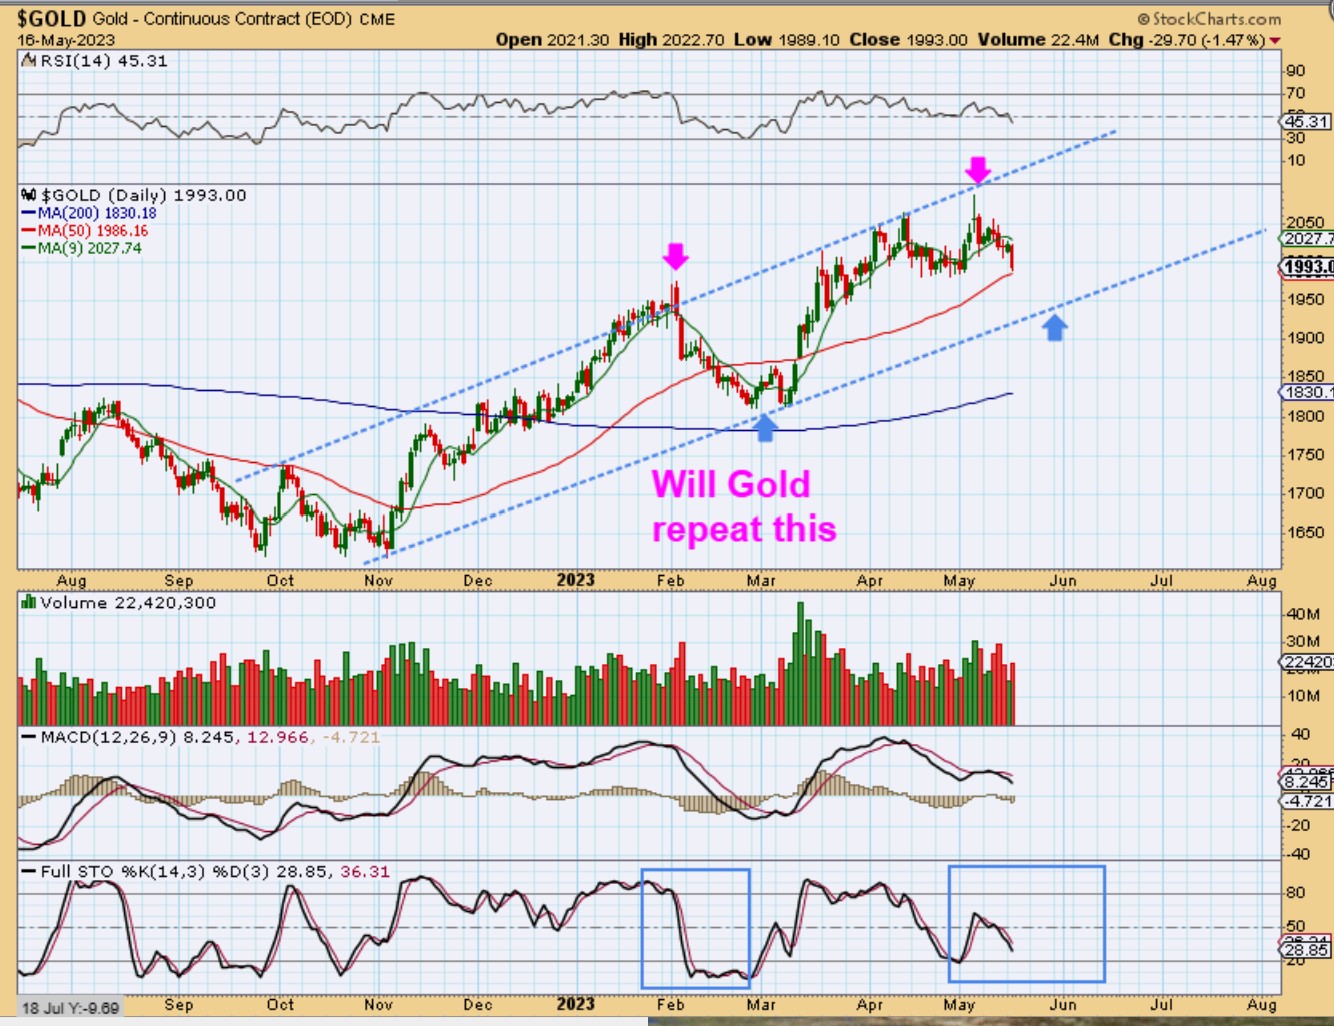
THIS has me wondering if the USD is going to discount that abnormal bank induced movement in March and finish what it started, but if so what about Gold? Golds drop to an ICL was cut short too by the banking crisis. Gold reached that area of All Time Highs, and I would expect a pause or sideways chop to build energy for a break out, but is Gold about to finish what the Bank Failures interrupted? This is all uncharted waters, so we cannot know for a certainty how this will play out, but let’s review some charts and discuss possible price action.
.
This is GOLD today. I expected it to be a choppy daily cycle as it prepares to break out to all time highs, but yesterdays drop caused GDX to break the dcl. So Gold has NOT broken below the last dcl, but Silver and GDX have. That can happen, because Silver & miners tend to overshoot the main moves or exaggerate the moves, but WHAT IF GOLD breaks the recent dcl? In cycles that is a Failure and calls for even lower price.
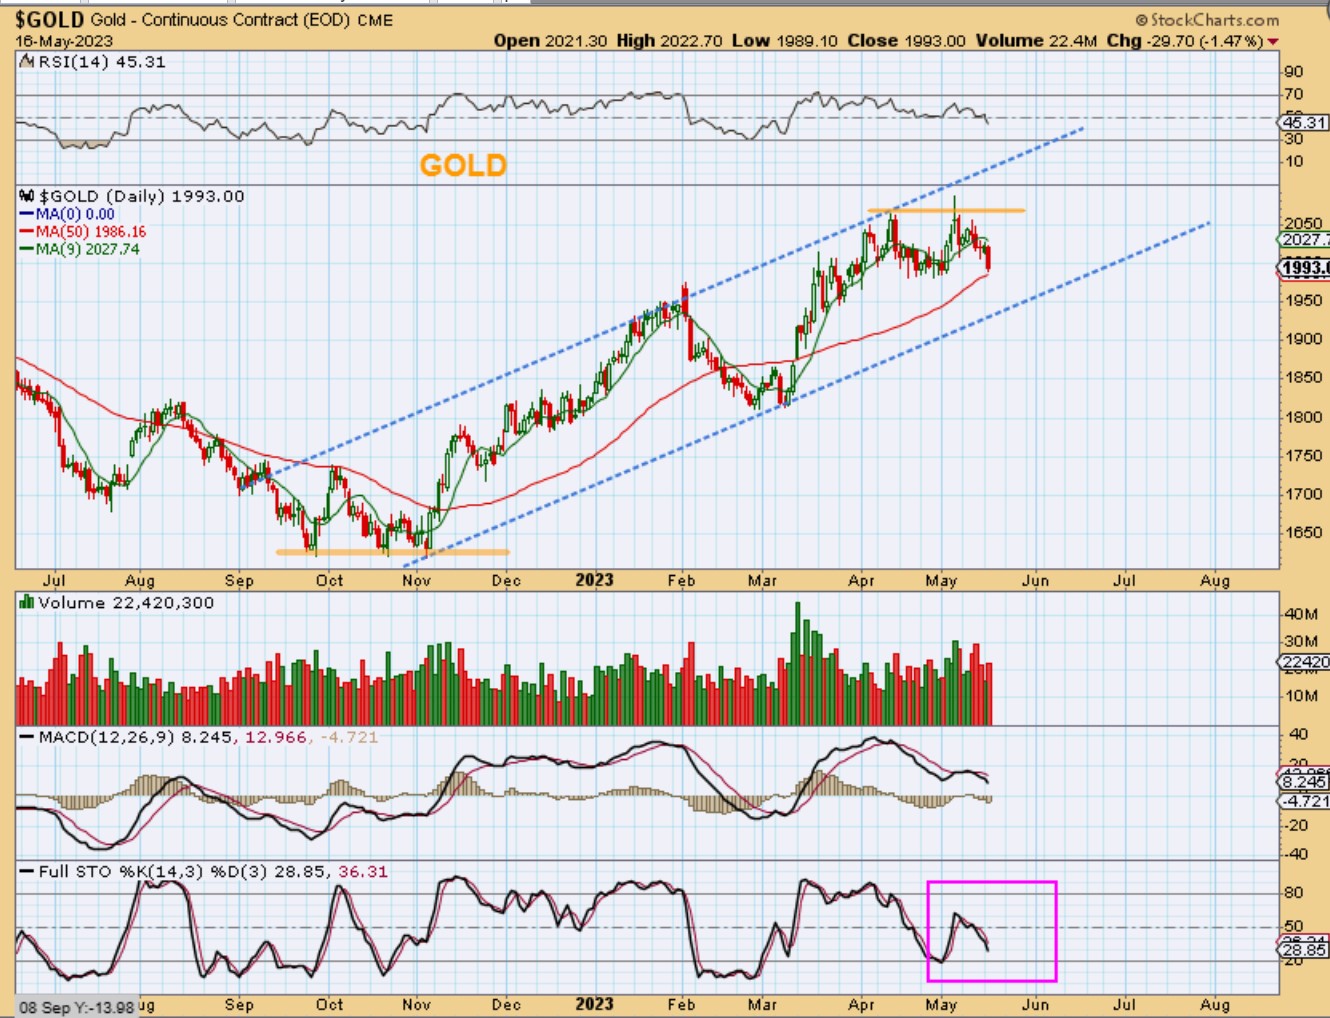
GOLD : If Gold breaks that last low ( the dcl), then I have to wonder if the USD & Gold are just going to finish what they started in Feb-March, before the Banking crisis. This is not normal cycle movement, but bank failures aren’t normal either.
.
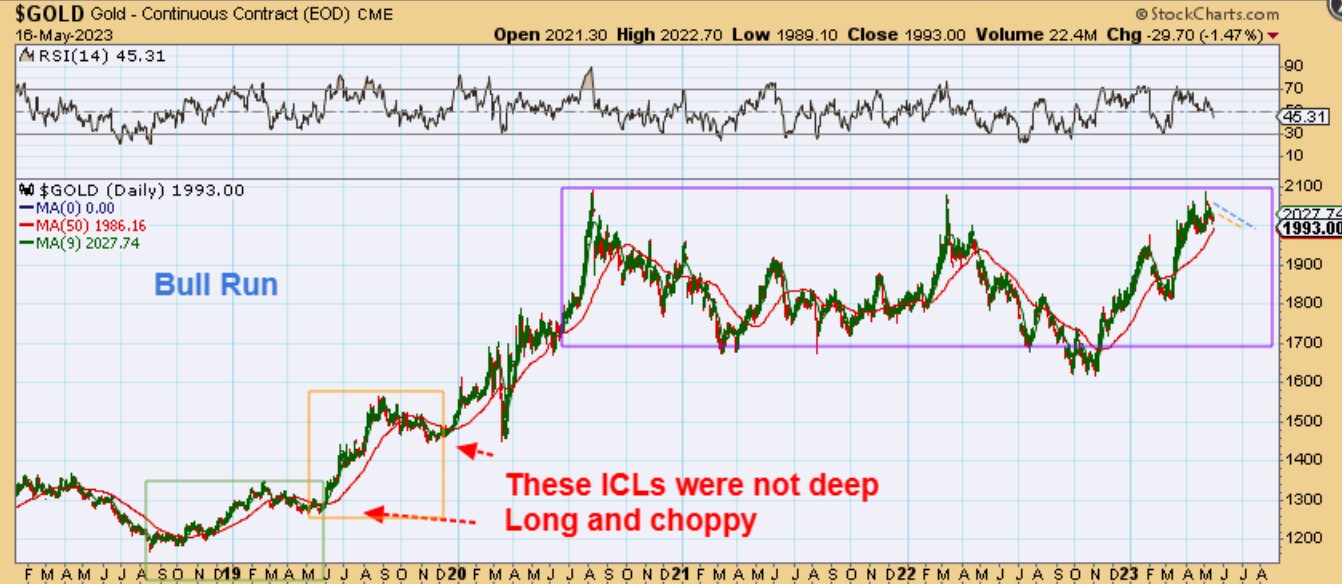
So the best thing that I can do here is to review past ICL dips in a BULL RUN. They are often not very deep, however they can be prolonged and boring and choppy. That often frustrates many. So let me review a few charts that I drew up, to simply give us possible visuals of the uncharted waters that we may end up in. By the way: In technical analysis, this is all fairly normal, but with cycles, it just throws off normal cycle counts.
.
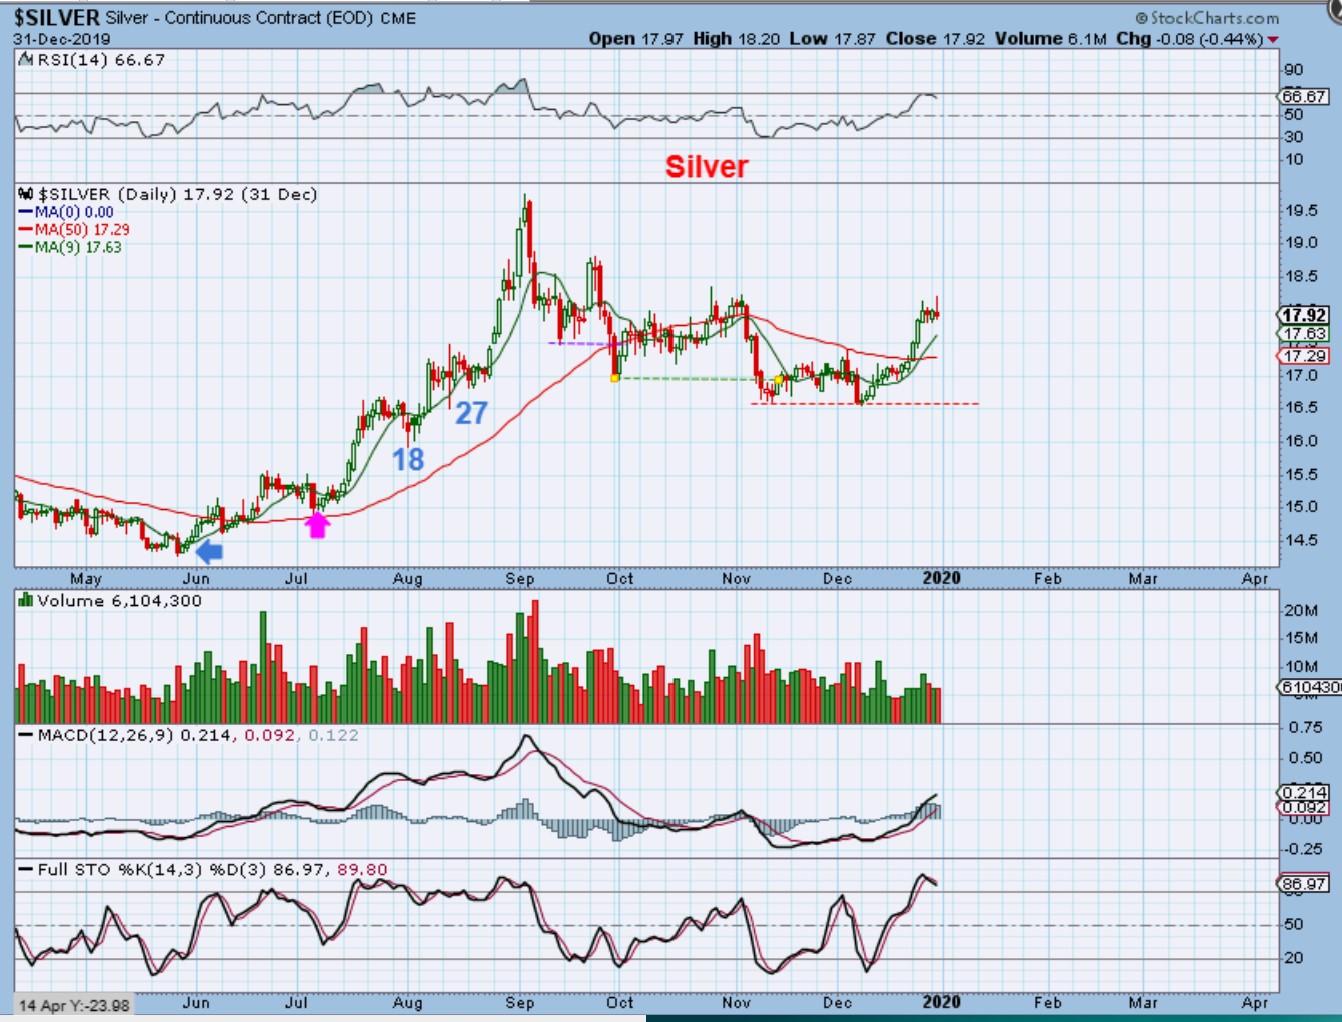
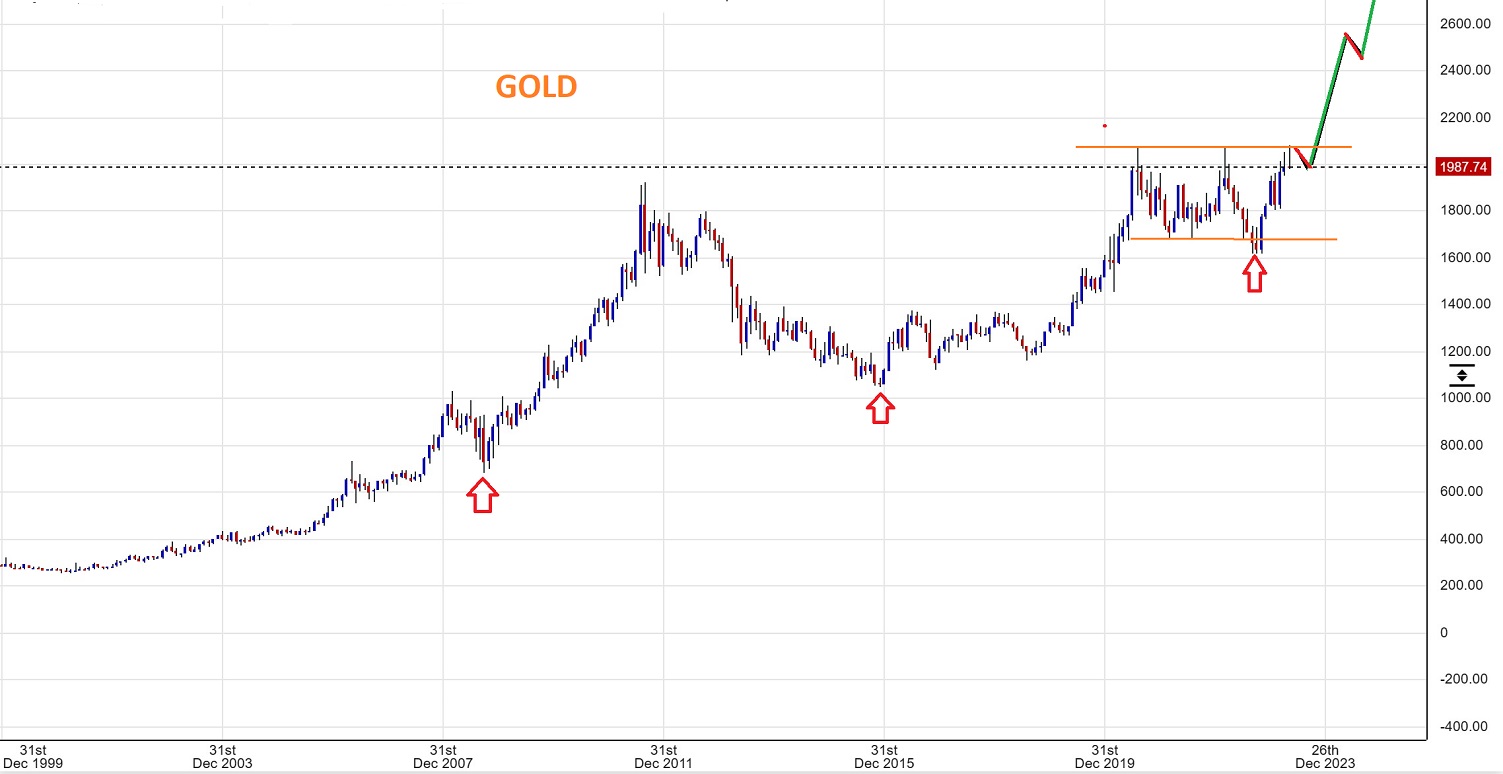
GOLD has reached that ‘all time high’ area and is pulling back. That is totally normal. When we look at the strong bull run of 2019 and take a look at those ICL dips, you can see that they were long choppy drops, yet they were rather mild. We could see that here too. Lets zoom in…
.
This is GOLD during the 2019 Bull run.
After the strong rally higher, Gold had a LONG choppy multi-month drop into an ICL, but that drop only totaled a 38% Fib dip on both of these choppy time periods. So …
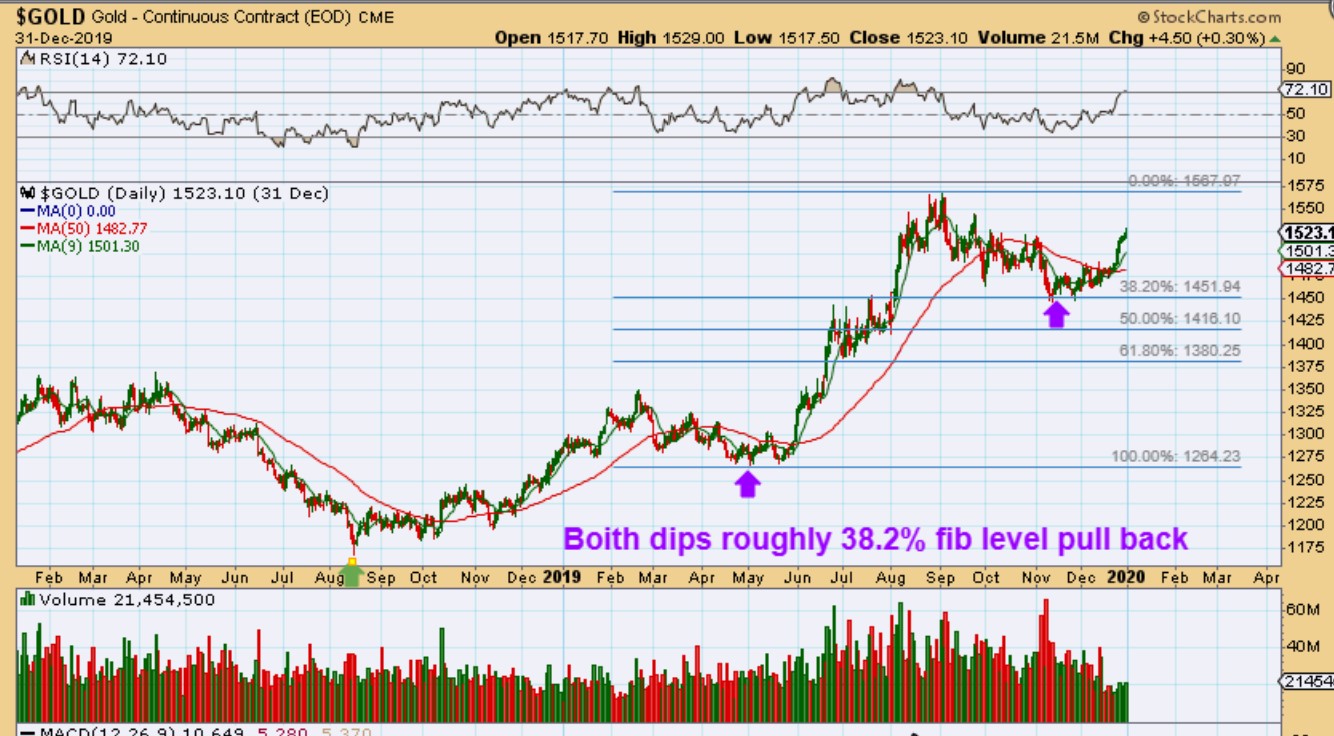
So what I am trying to say here is that if the USD starts to try finish what it started in Feb-March (a relief rally out of an ICL) , then Golds pull back could look like one of these if it stays bullish as it prepares for a breakout to all time highs. LETS ZOOM IN ON THE LAST RALLY HERE AND THAT CONSOLIDATION…
.
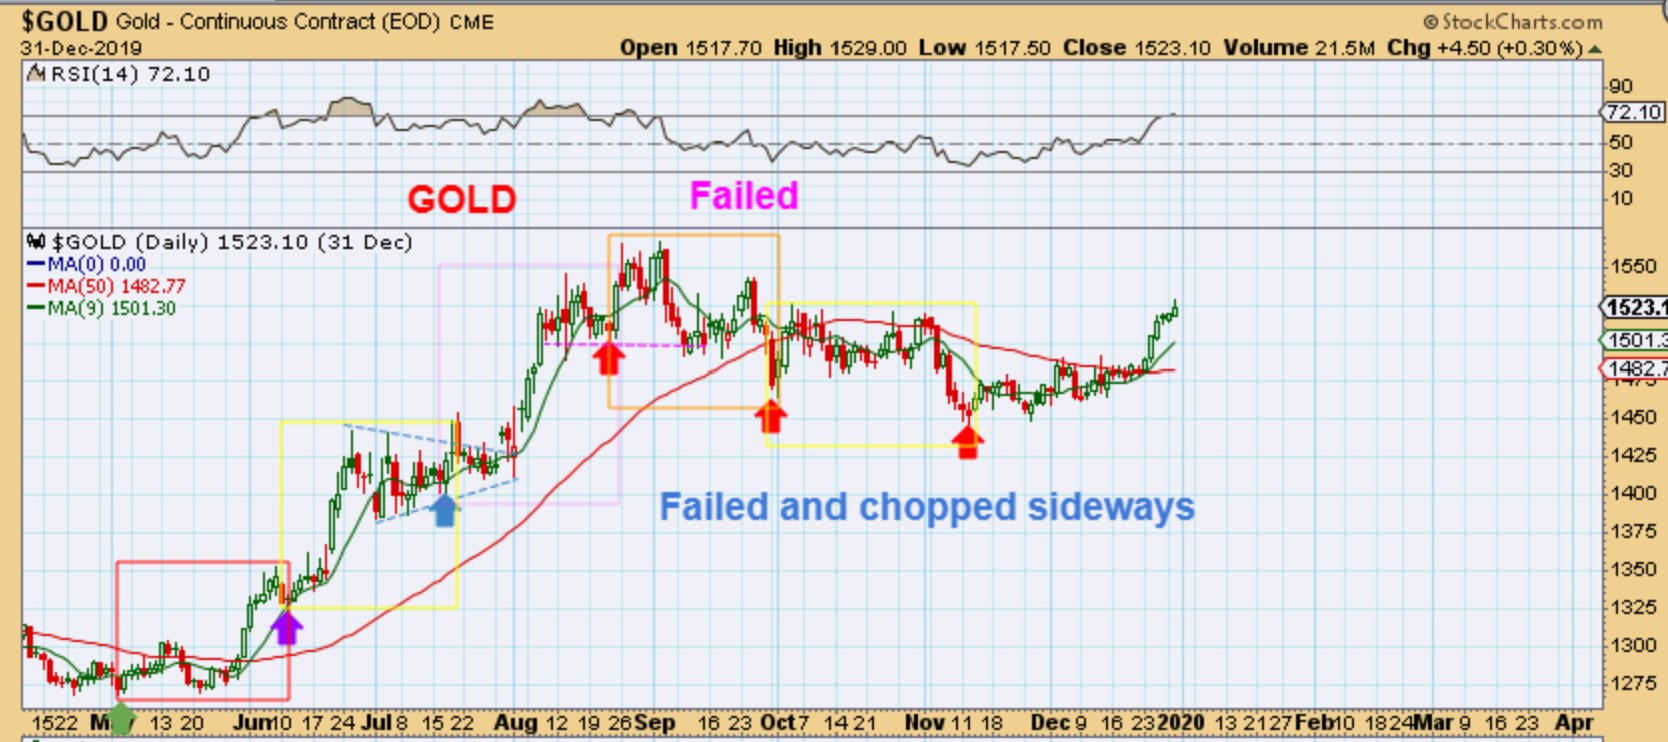
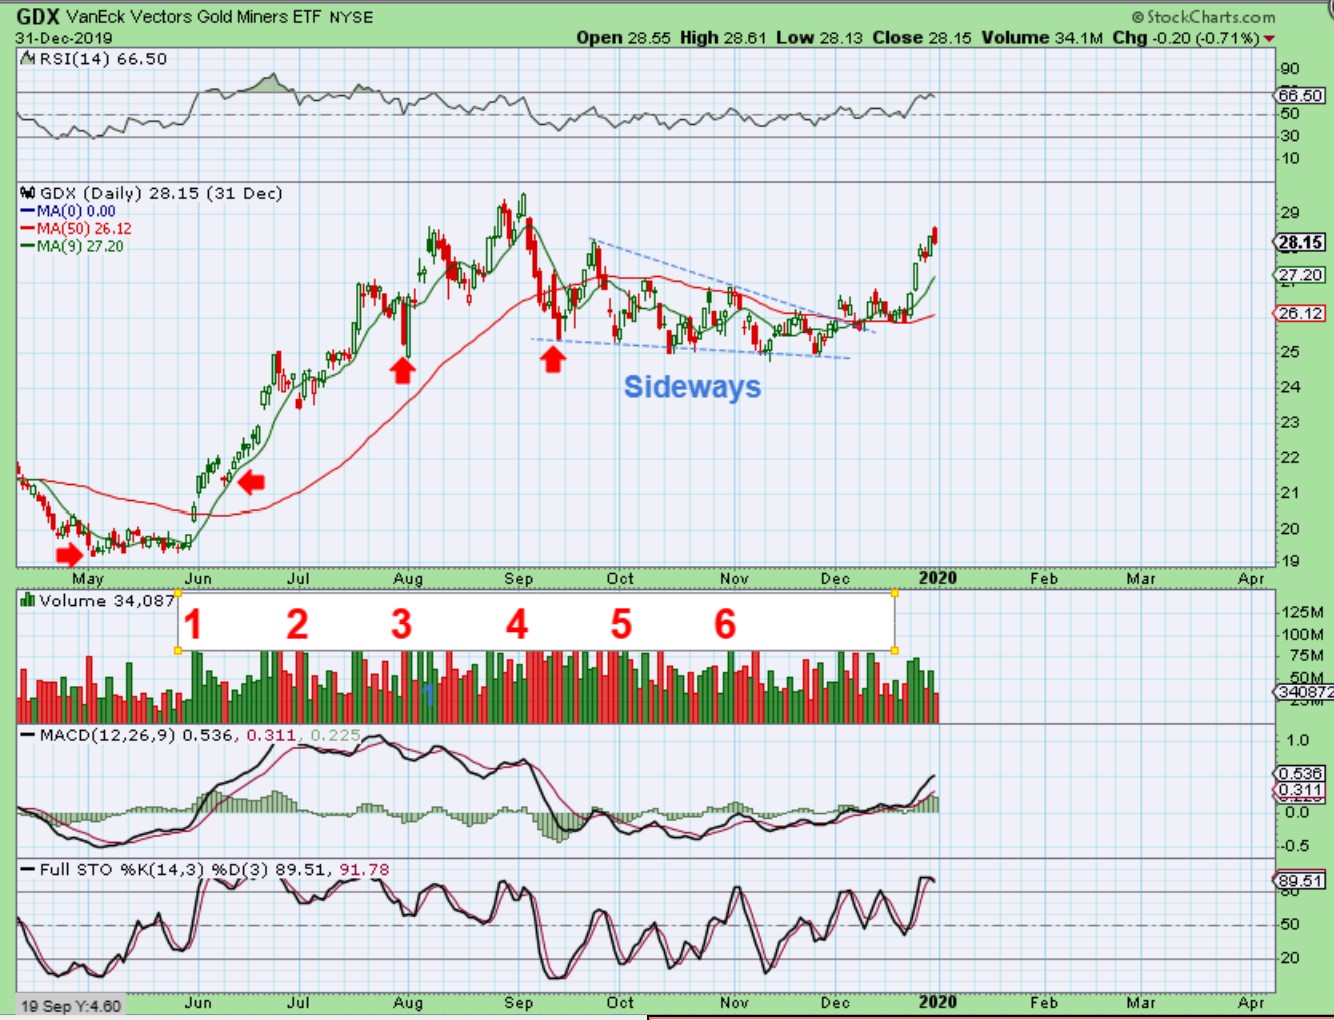
So this was GOLD using cycles and you see the strong rally with roughly 30 day boxes for each daily cycle. At the top it ‘failed’ when it broke below the prior daily cycle. If Gold does this now, this gives you an idea of what could be next. A long choppy dip, and this one was 38% off of the highs, as seen on the Above chart.
.
As a review:
Red box #1 was the ICL,
Yellow Box #2 the rally into a pennant,
Pink box #3 a strong rally,
Box #4 ‘peaked’ quickly and then dropped and failed, so
Box #5 was the final daily cycle, mostly sideways into the next ICL.
.
SILVER at that time rallied sharply from roughly $14 to $20 and then the drops for Silver were sharper than Golds drops. That is just how Silver moves.
.
IN YESTERDAYS REPORT I WROTE THIS :
,
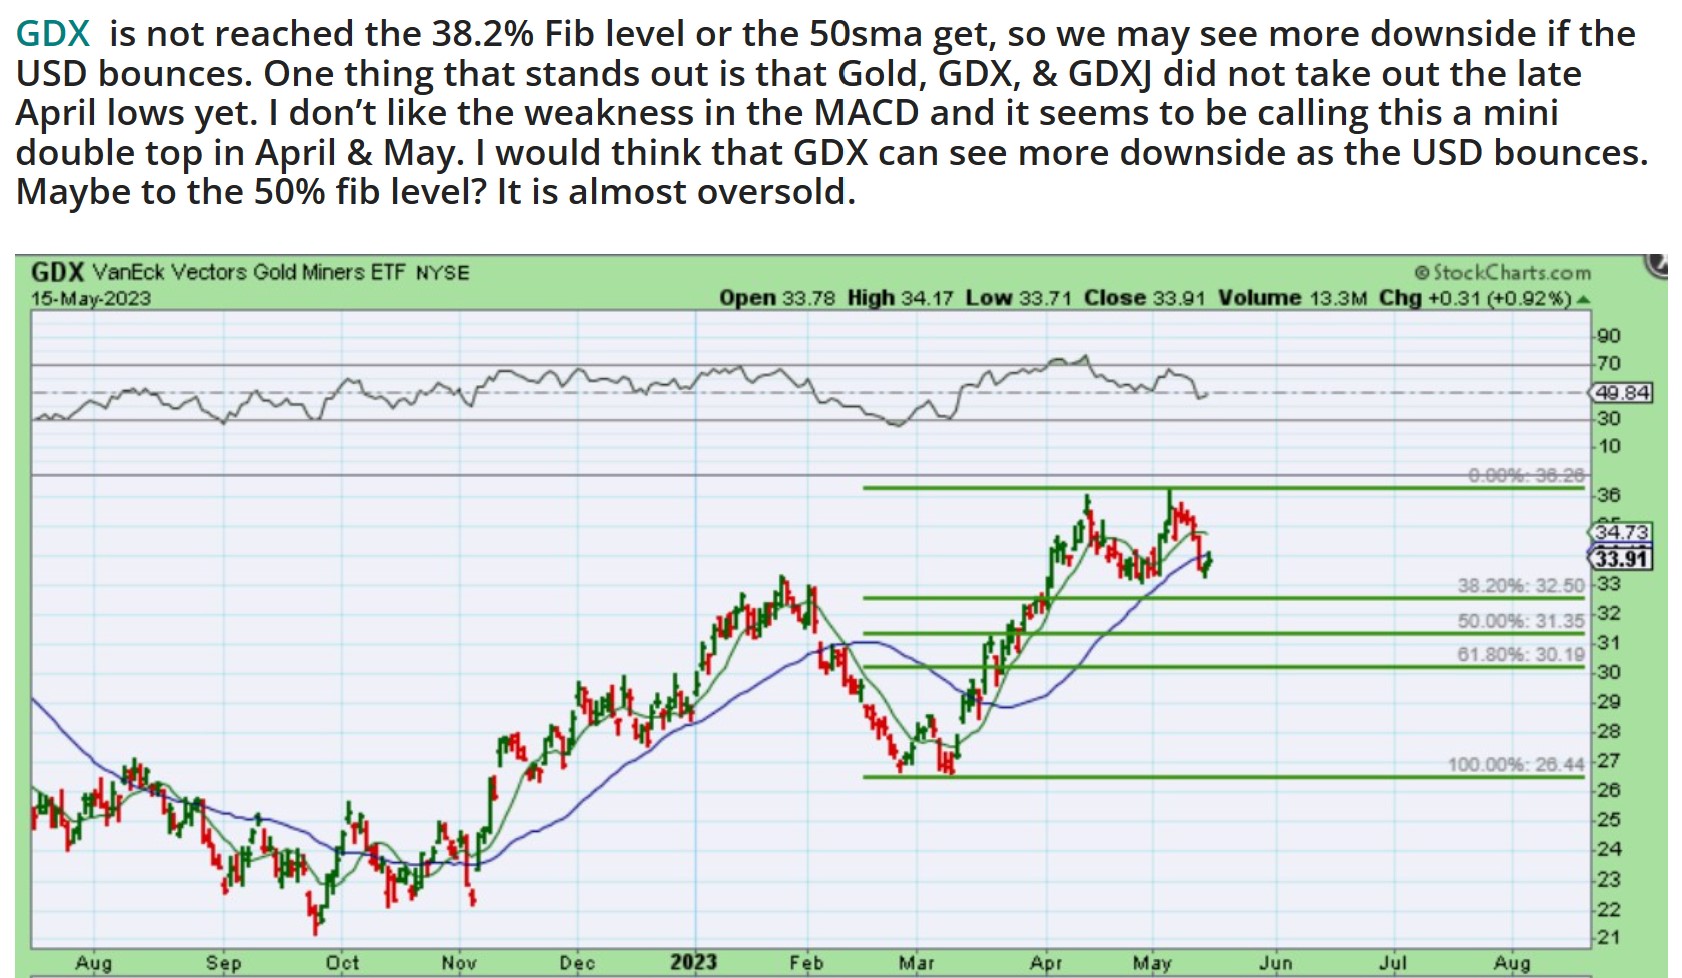
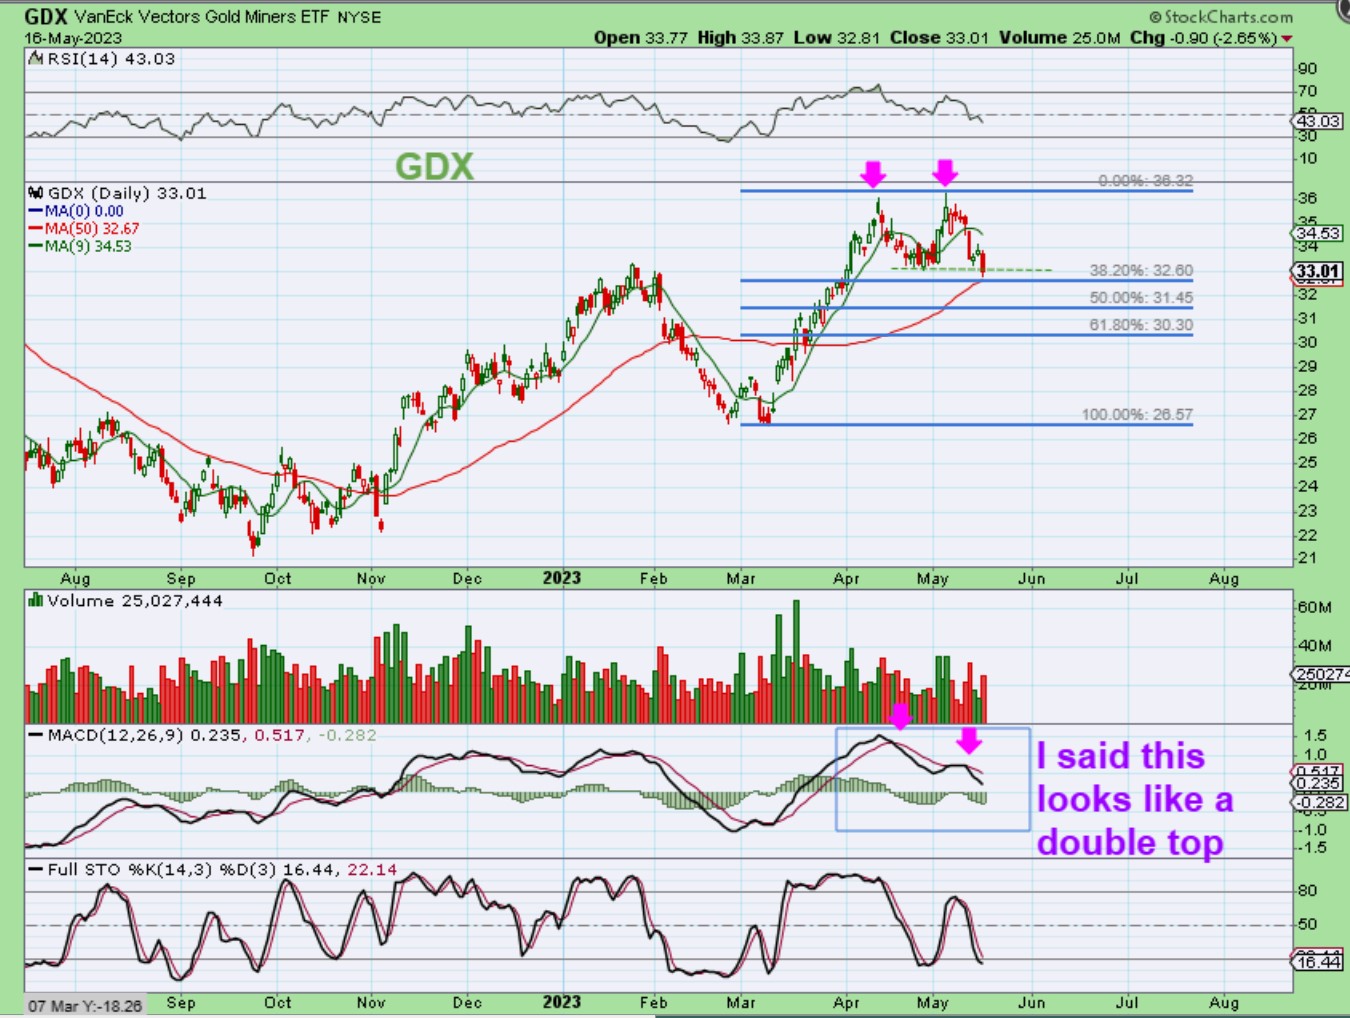
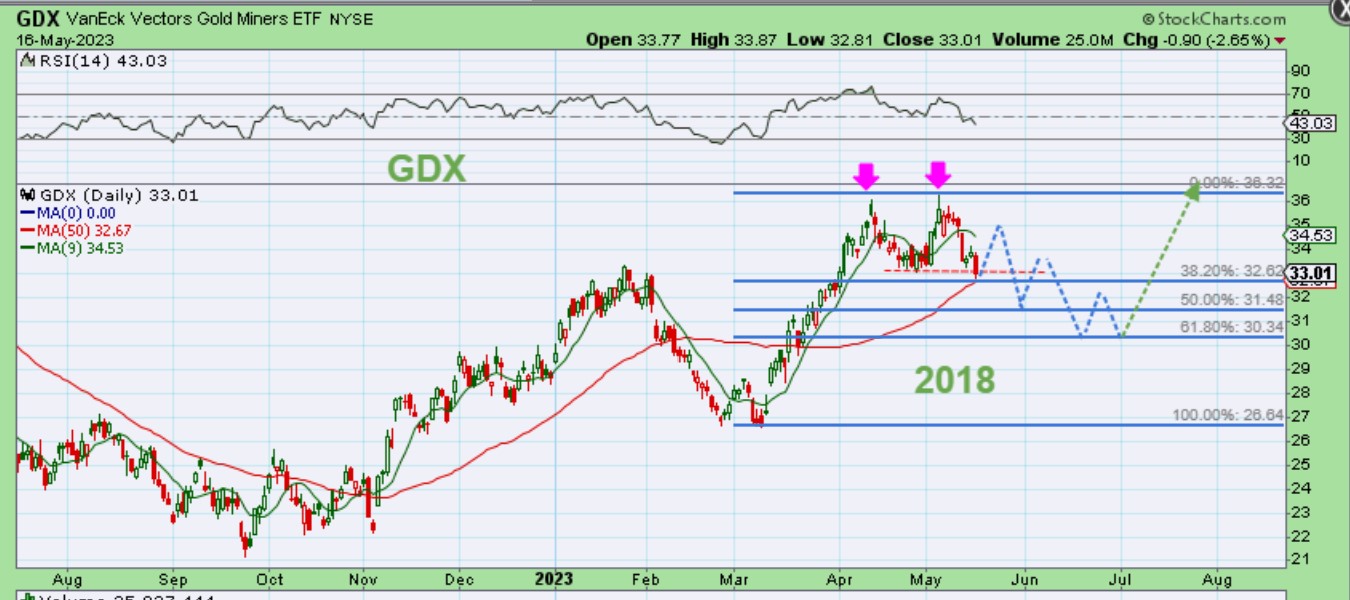
GDX dropped to the 50 sma , which is the 38% fib level too. This broke the last dcl and in cycles that calls for lower prices (even though I usually just focus on Gold, both Silver and the Miners have done this as the USD started to strengthen, so caution flags go up).
.
GDX might just chop sideways to the 50% fib, as drawn here, but we really do not know at this point how much they’ll drop if Gold fails the dcl…
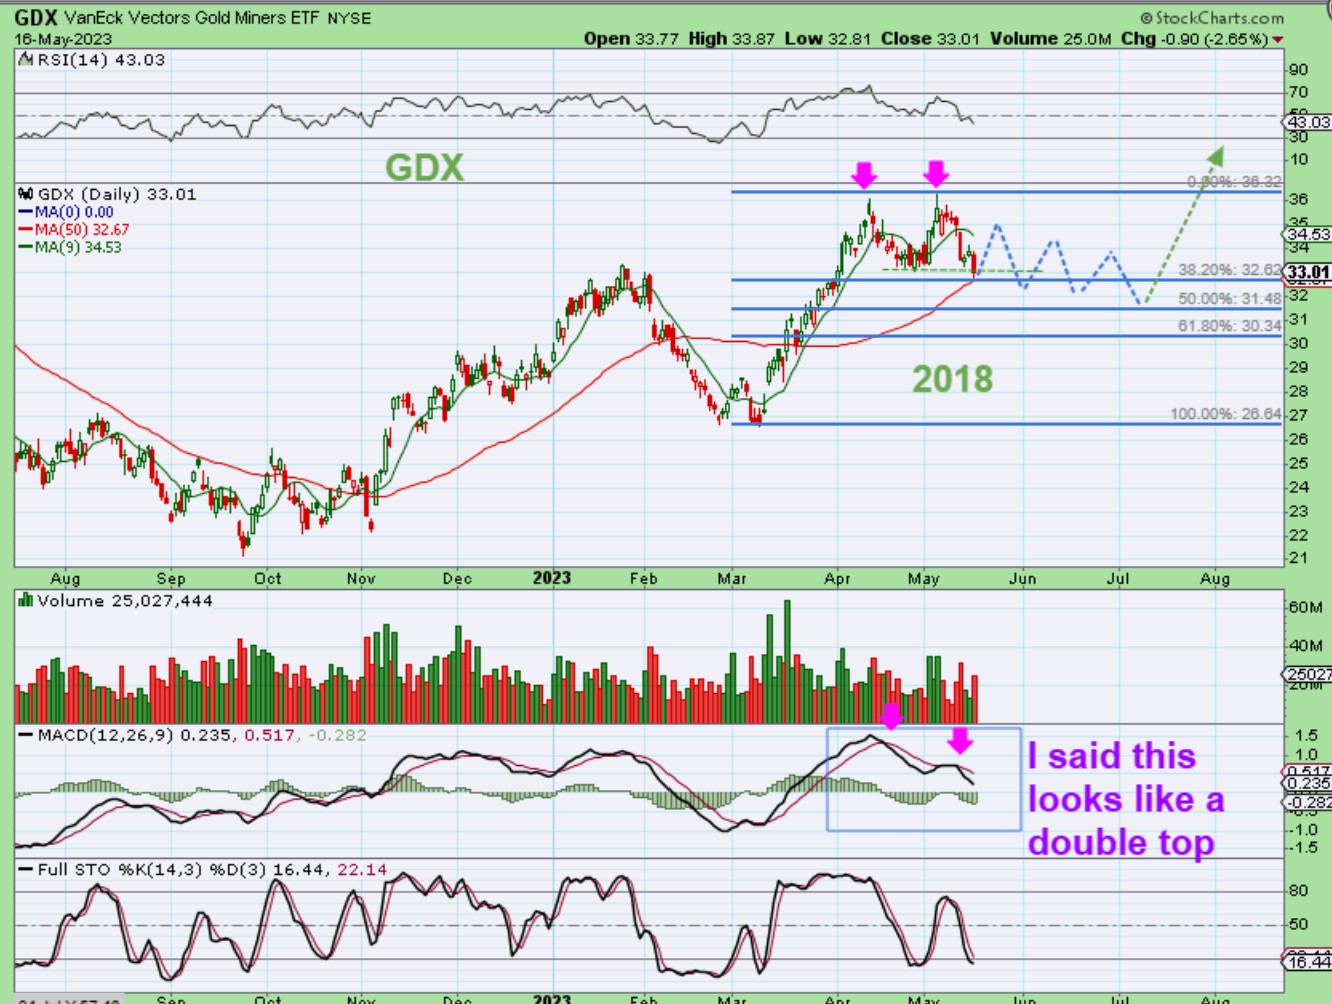
GDX could easily drop to the 50% or 61.8%, as shown here. We just don’t know, but remember that Feb -March sell off? Day after day it felt disheartening until that explosive rally showed up. That being said: Many have to make that choice now as to how much (if any) of this they are wanting to ride out. Some may sell, some may lighten up, etc.
.
This is The GDX in that 2018 drop to an ICL. It was mild and only made slightly new lows with each 1/2 cycle low and dcl. It formed a bullish wedge, but no doubt this action was still very frustrating day after day.
.
So that is where things stand at this point. It would have been so much better if the Feb – March sell off in Gold and rally in the USD played out their normal course of action, but that weekend that 2 banks failed caused Gold to rocket higher early, and the USD crashed down. The only thing that makes sense to me as to why the USD is showing strength after that ICL is that it was left incomplete.
.
I mentioned recently that when Silver crashed I sold all of my miners and would look for a place to get back in. Yesterdays dip to the 50sma by the GDX may have enticed me under normal conditions, but again, if Gold fails, we could be in for weeks of choppy action. You will also need to decide whether to cut any or all of your holdings until we can see how this will play out.
.
The USD may rise to that blue trendline again, and I have seen Gold ignore the USD at times, but if the Dollar bounces to that blue line and Gold breaks the dcl, we are likely in for choppy weeks of sideways price action, similar to the 2018 review above.
.
I know that this is a bit disappointing for the near term, but it still doesn’t change the big picture. Gold has not broken the lows yet, and there are times when Gold will ignore the USD as it rises, so we may still just be seeing a choppy 2nd daily cycle followed by a stronger 3rd one that breaks out Gold to new highs. Even if Gold does break the lows, a pullback now should still be that normal energy building action to prepare for a breakout to all-time highs and more. This is a very bullish looking chart of Gold, and when it breaks out to new highs, we want to be ready to ride that move higher. Enjoy your Wednesday trading!
.

