Friday At Last!
Last week we had a great reaction to the Fed Mtg with our Precious Metals Sector, so why is Silver falling apart now and will Gold follow? Lets do a market review and keep in mind that today is Friday, the last day of the week.
.
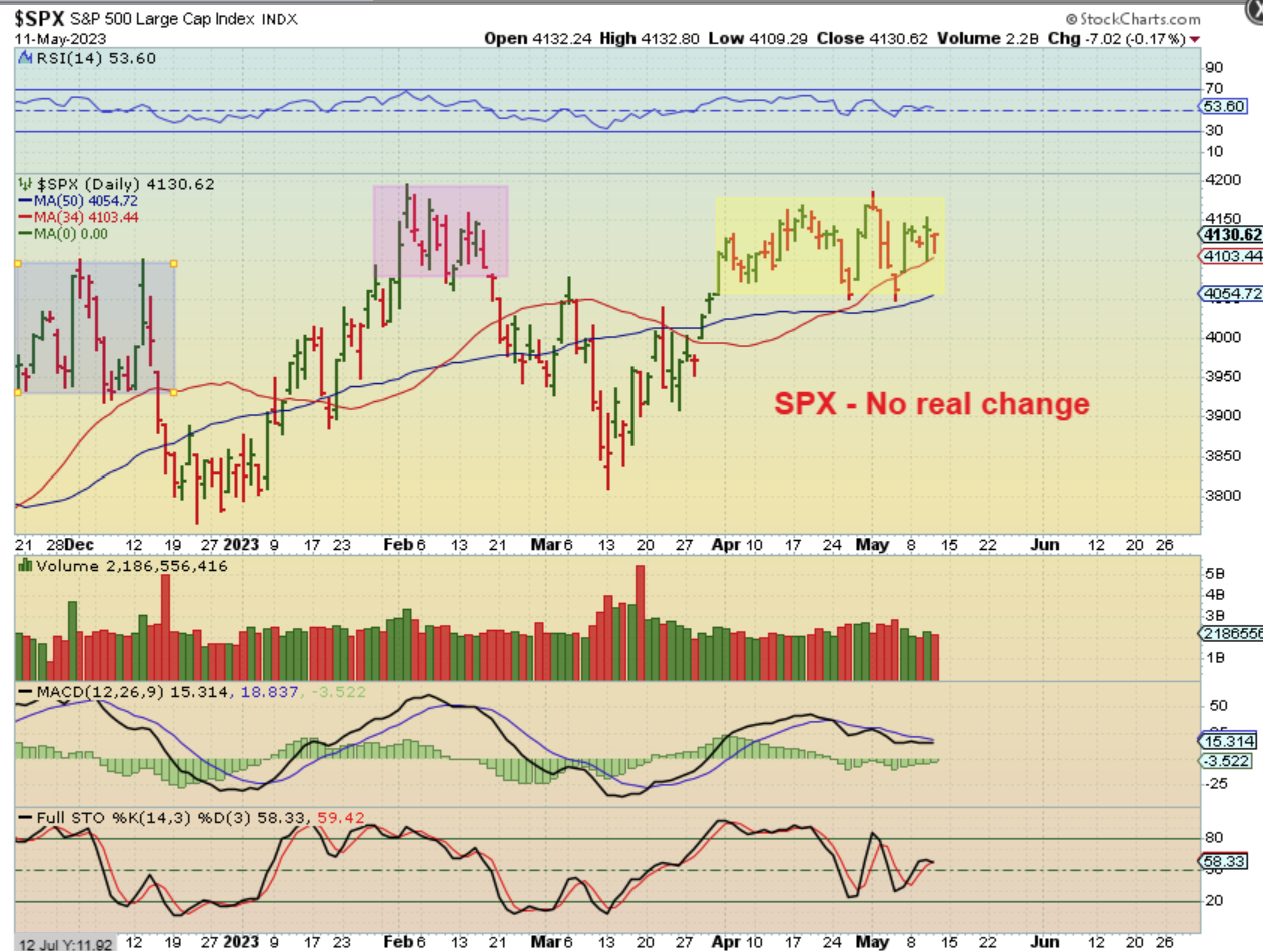
THE SPX actually sold off to the 50sma with the Fed Mtg, but Popped back up with the Friday Jobs report last week. This week it has churned sideways for 4 days. This week price has dropped each day, but starts to recover by the close. This still looks like a topping process as it chops sideways, with a dip into a dcl ahead. If you are long the red 34 sma line seems like a reasonable place to put a stop, or you could use the blue 50sma, but you’ll give back more.
.
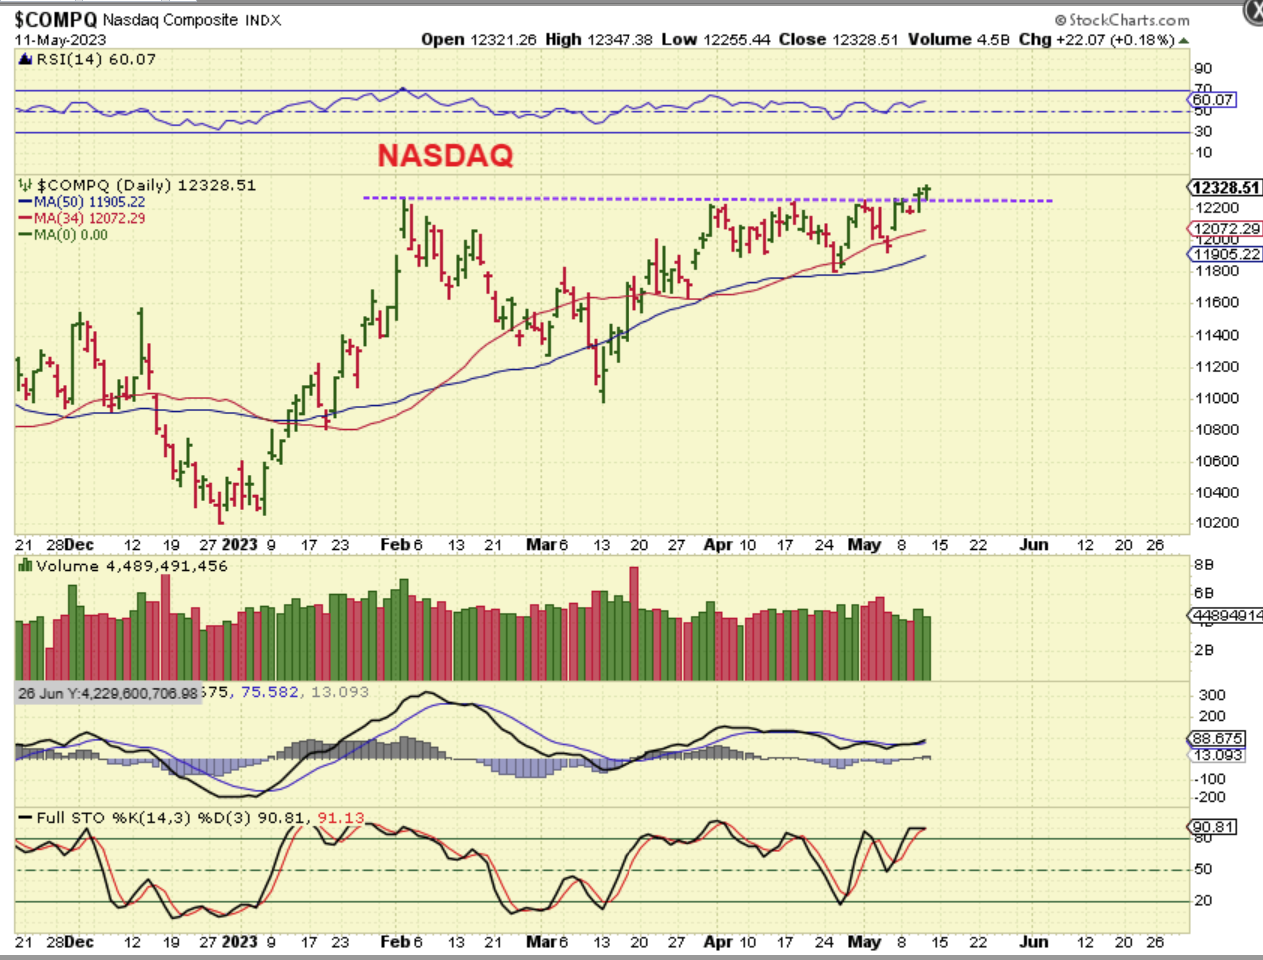
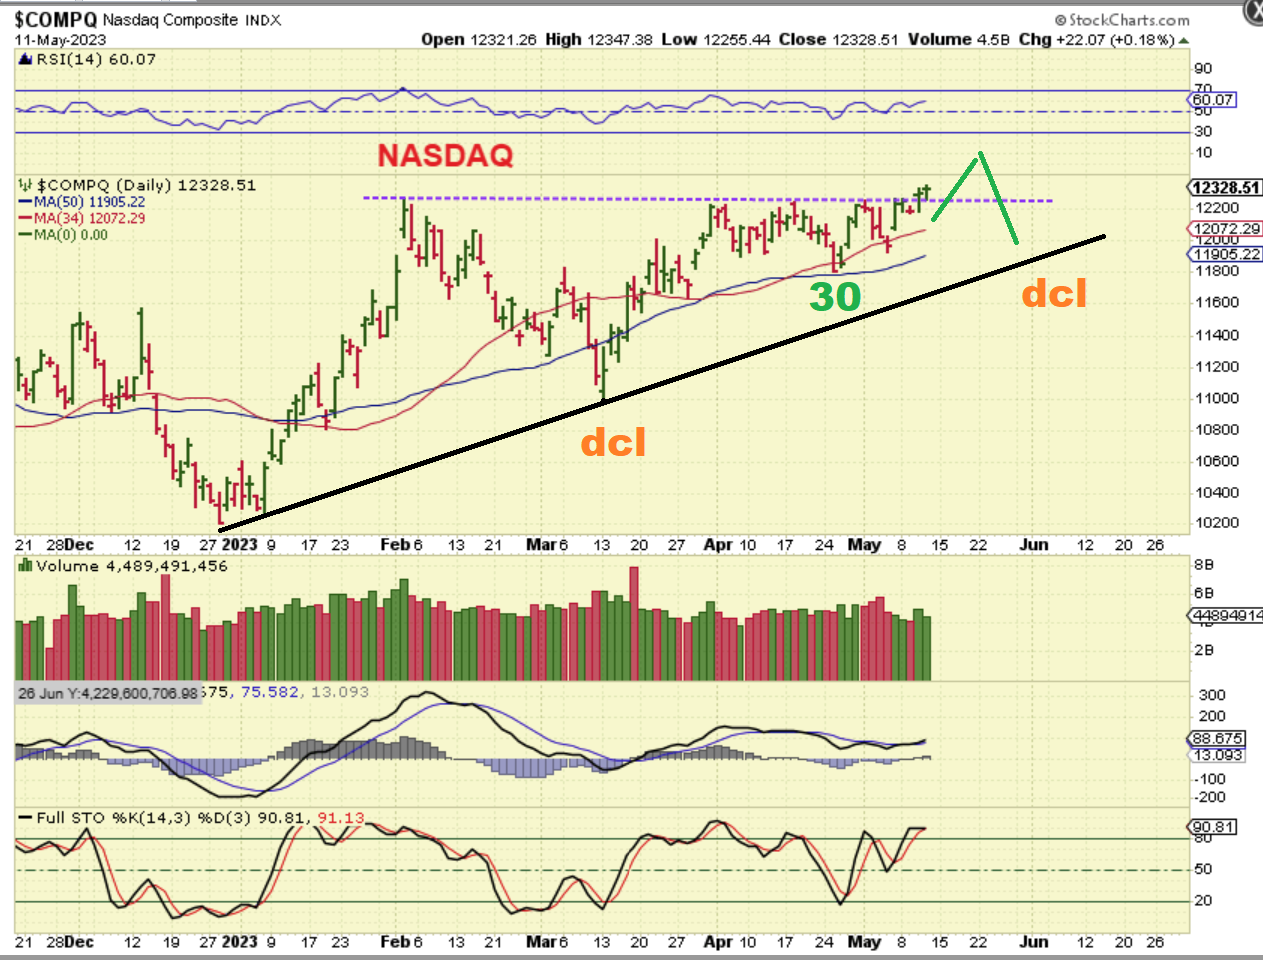
THE NASDAQ sold off last week with the Fed too, but surged on Friday with the jobs report and actually slowly broke to new highs this week. This actually looks bullish, so let me show you a little more…
.
The last dip to the 50sm was day 30, so that can be a 1/2 cycle dip and the next dcl would be another drop to the 50sma. Stepping back it would look like this…
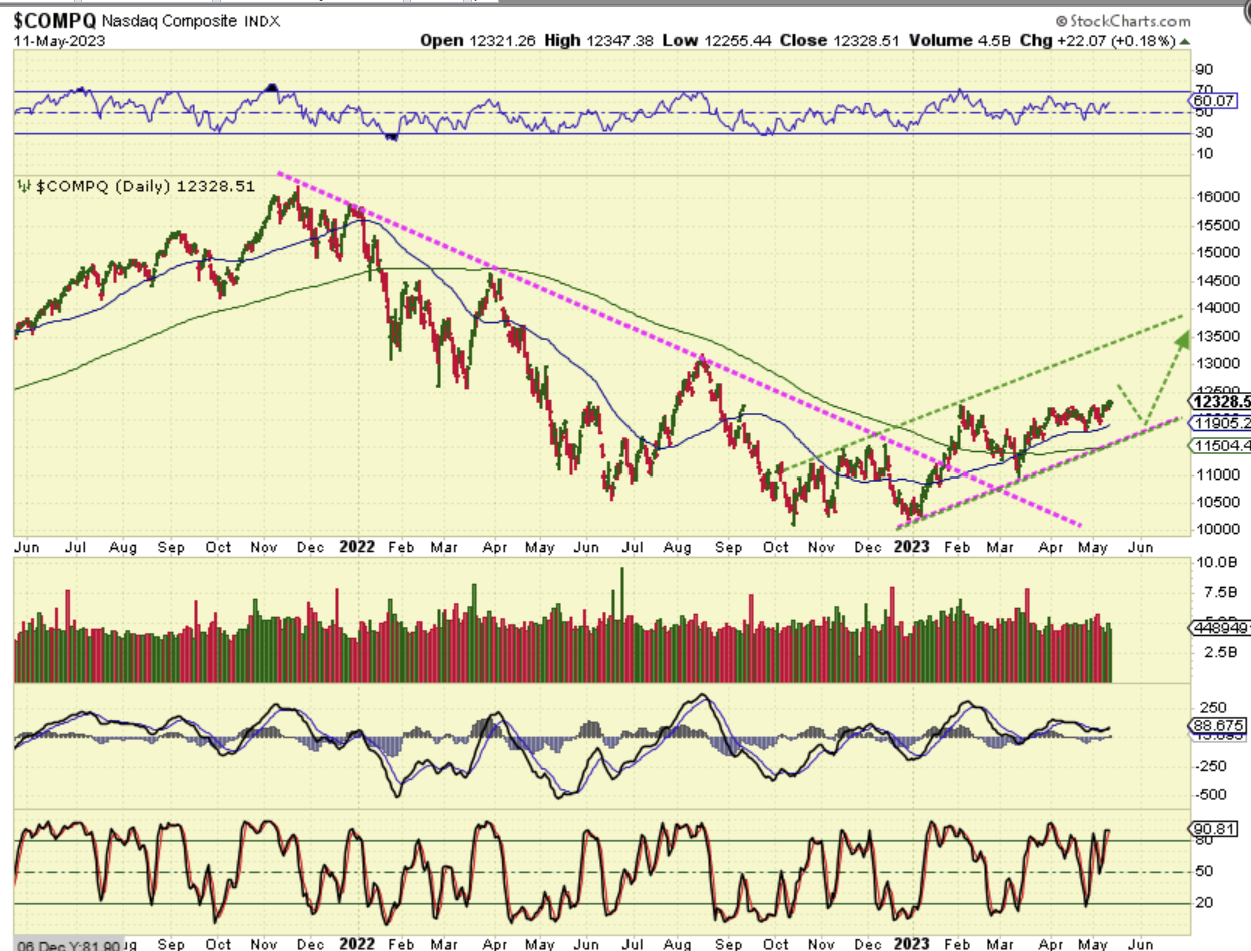
We see the bigger picture has The Nasdaq slowly climbing higher out of that bear market bottom.
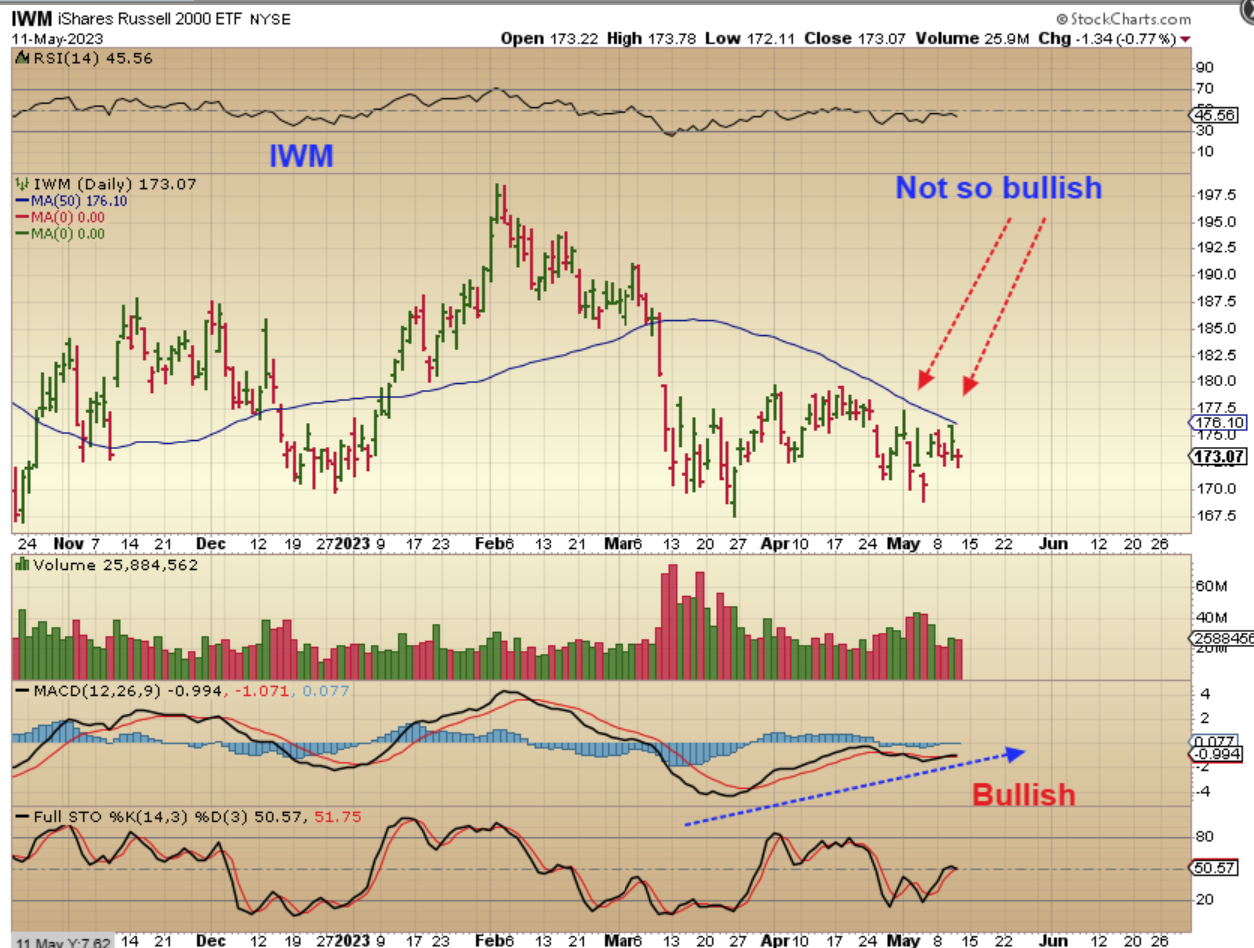
THE IWM has been noticeably weaker as it chops along the lows, still being trapped under the 50sma after that ICL sell off in March. The May low is day 28, today would be 34 (out of 40-50).
.
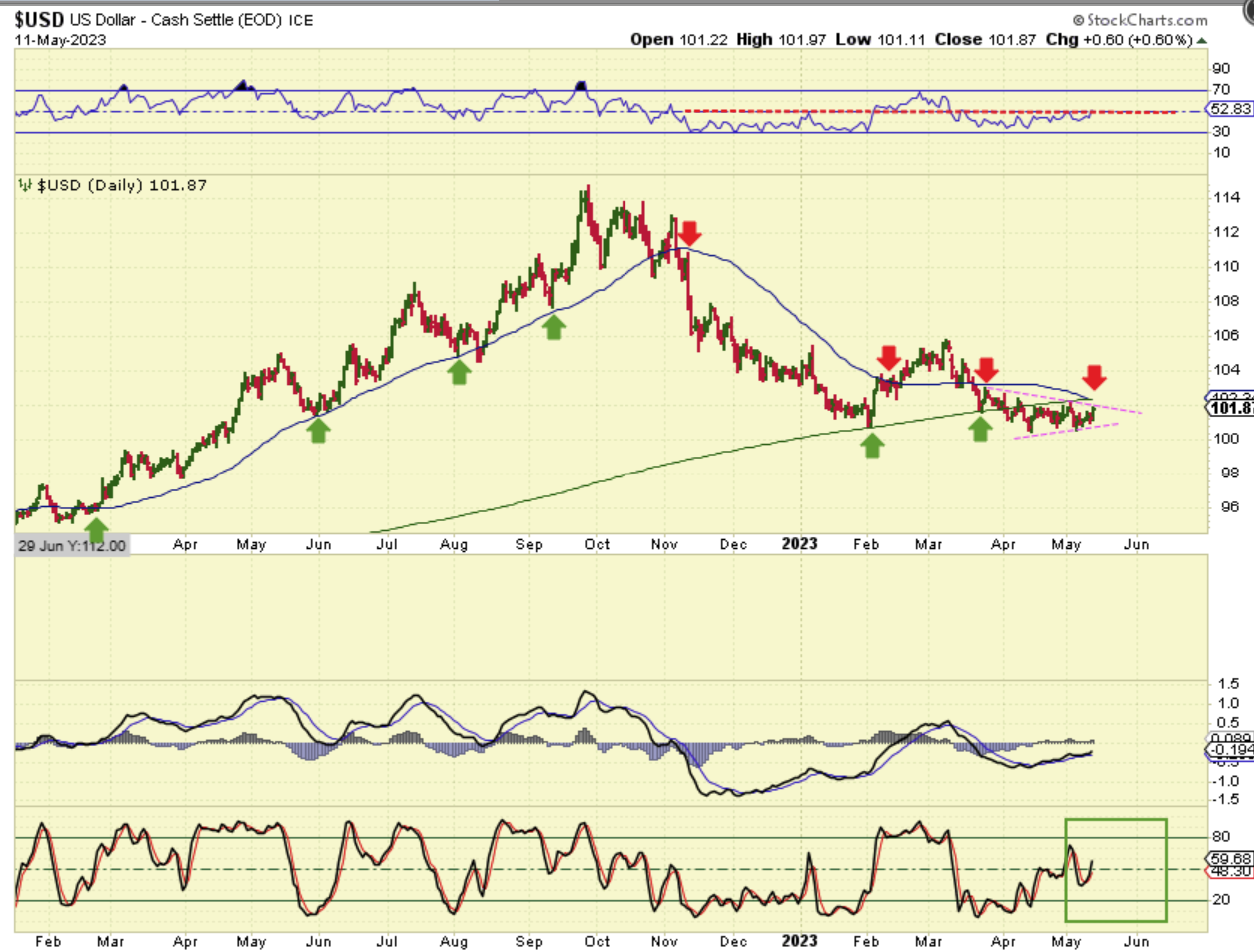
The USD has chopped sideways and overhead is a blue and green line that should act as resistance near 102.34. So far this is acting as expected as the USD travels lower to a 3 yr low, which is due around Jan 2023, but let me just discuss what we’d see if this broke out higher and ran.
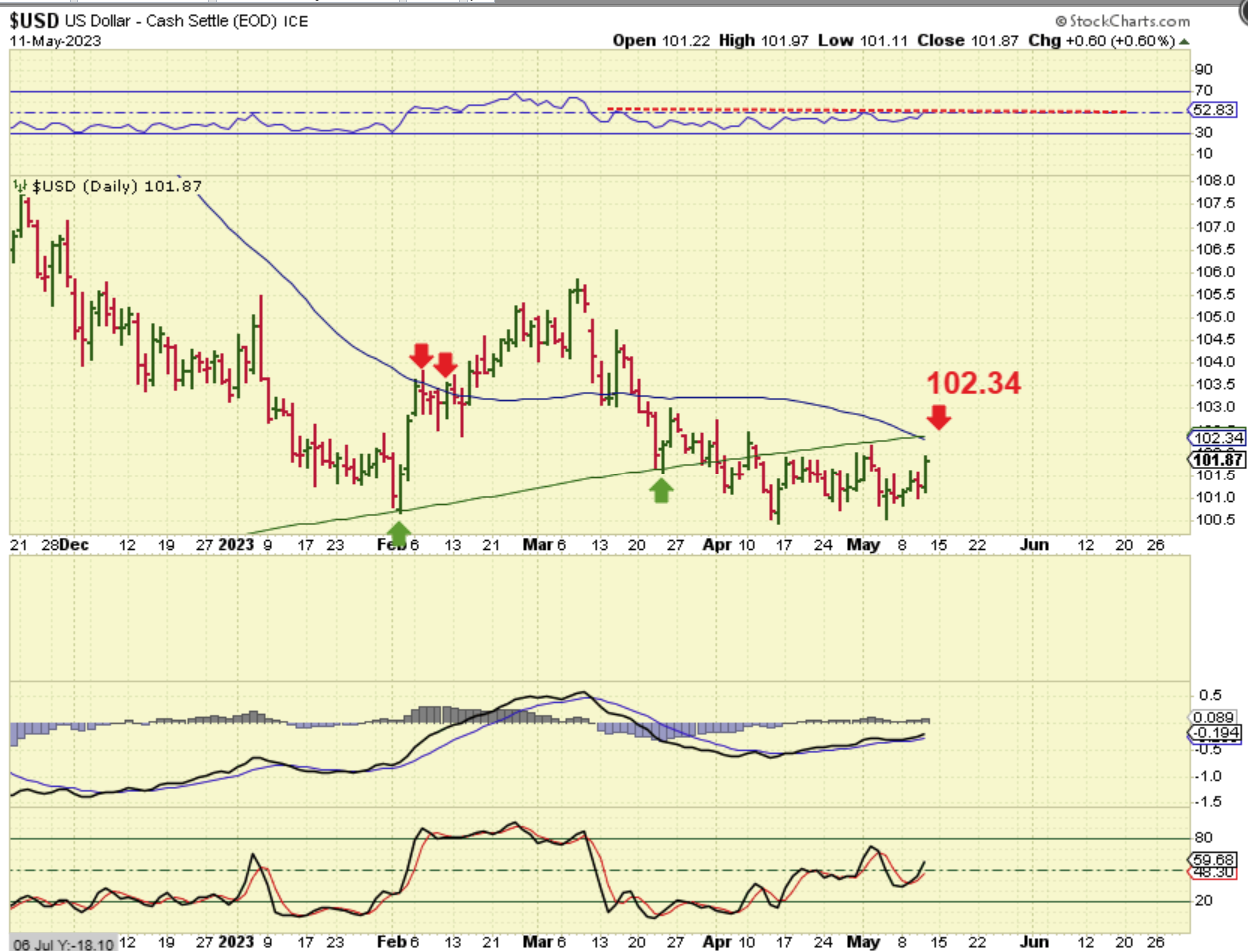
THE USD has chopped sideways and formed a wedge ( a bullish looking wedge, to be honest). The blue line that I pointed out was support turned resistance and the green line should be support turned resistance too. They are both just a little higher at roughly 102.34-ish. Right now this is still acting as expected, but if the USD were to break out and rally, we could have a serious problem. It is possible that THIS would mark the 3 yr cycle low about 6 months earlier than it is due to bottom, and that might stop the Gold break out to new all time highs. SO FAR NOTHING HAS CHANGED, but Silvers drop is concerning. We are at a critical area, but that USD Breakout has NOT happened yet, so we have to watch this chop sideways and view it as a midpoint to the drop.
.
The reason I mentioned the USD that way, is because even though Gold is acting just fine, Silver has suddenly broken down for no apparent reason. Lets look at Gold and Silver.
.
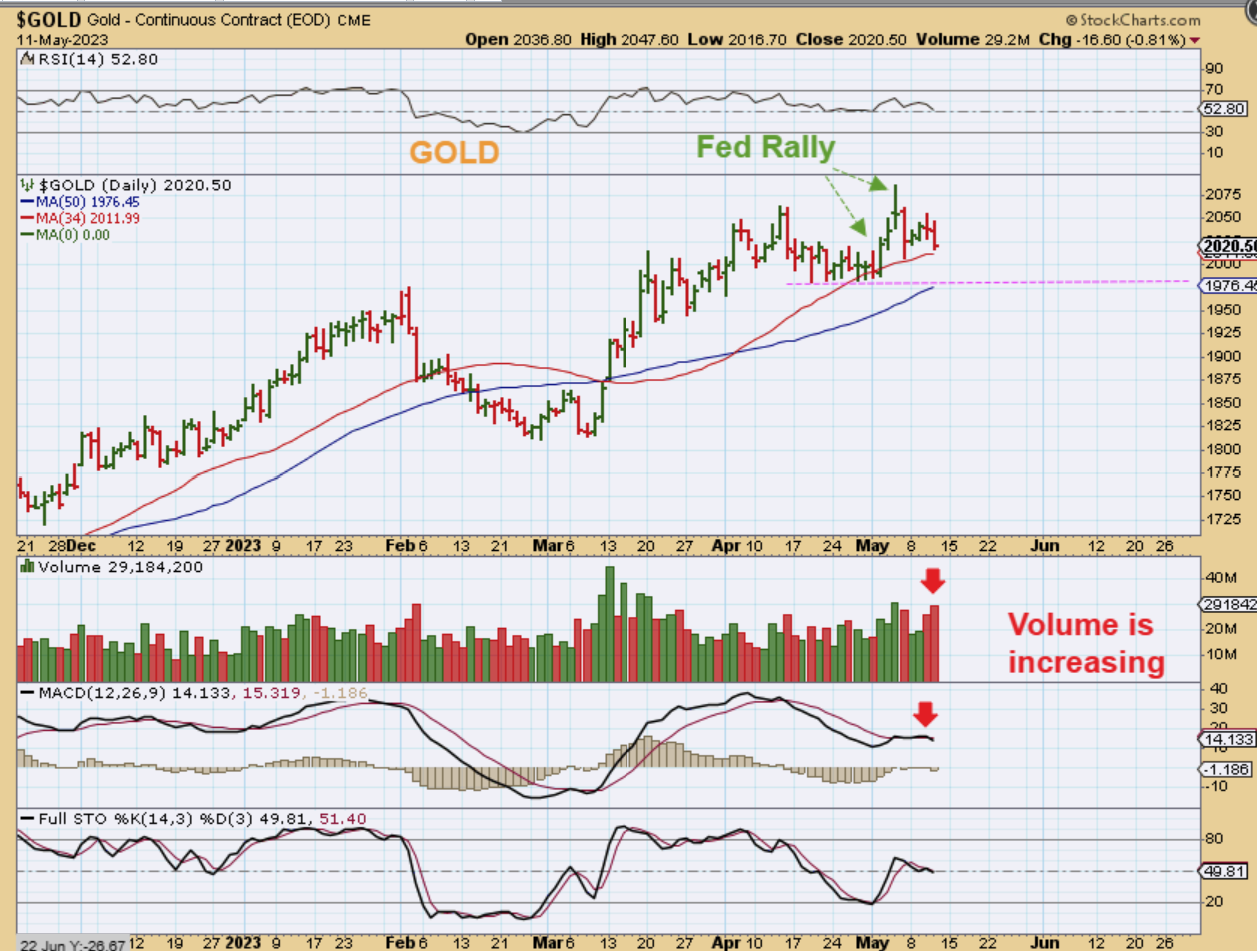
GOLD dropped on Thursday, but this is still perfectly fine. We saw Gold rally last week around the Fed Meeting and now it is dipping to the 34 sma and possibly the 50sma. That would keep Gold bullish. I do not like what Silver has done and I do not like the MACD and volume in Gold, because this looks like it could follow Silver.
.
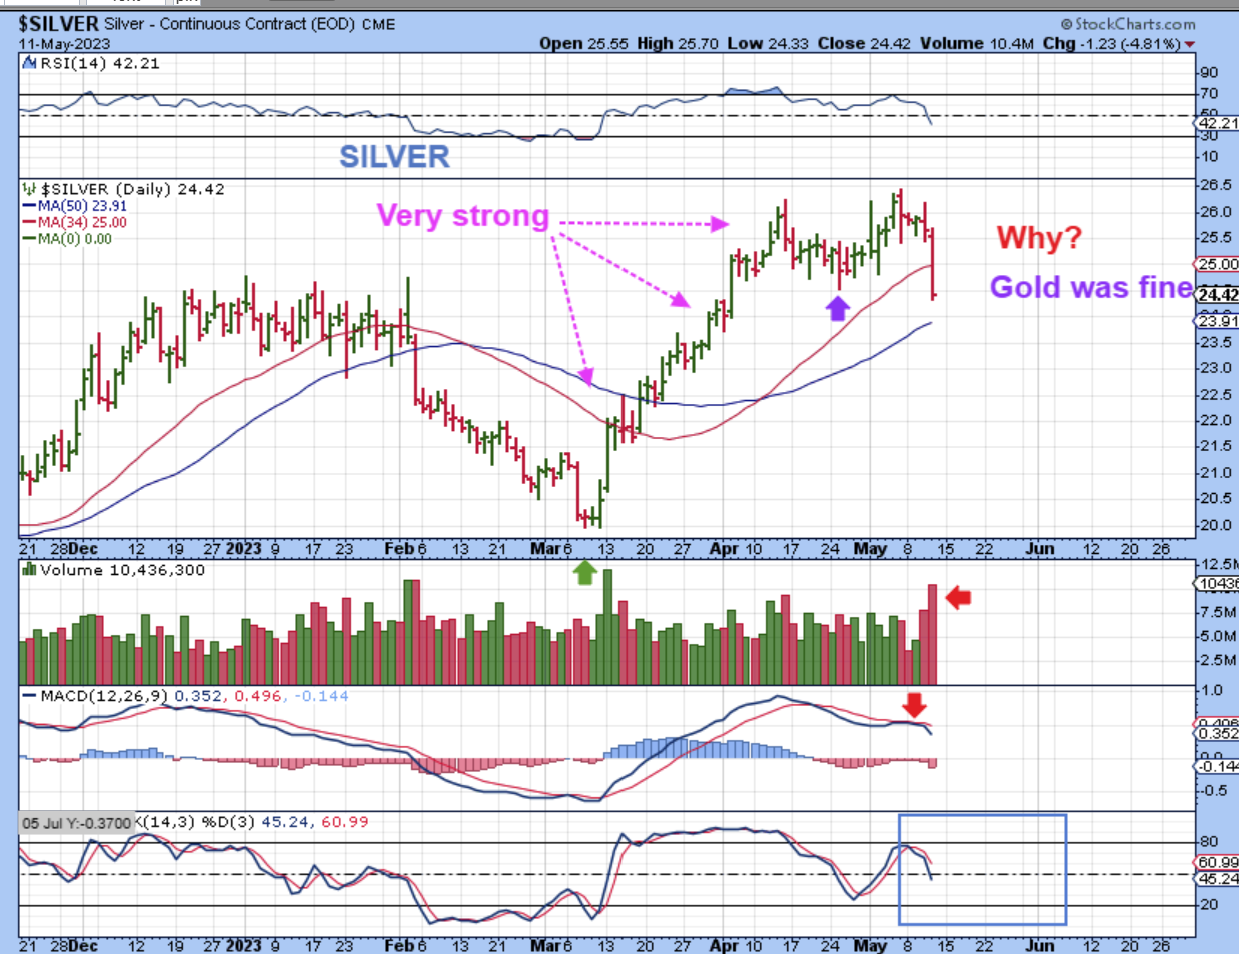
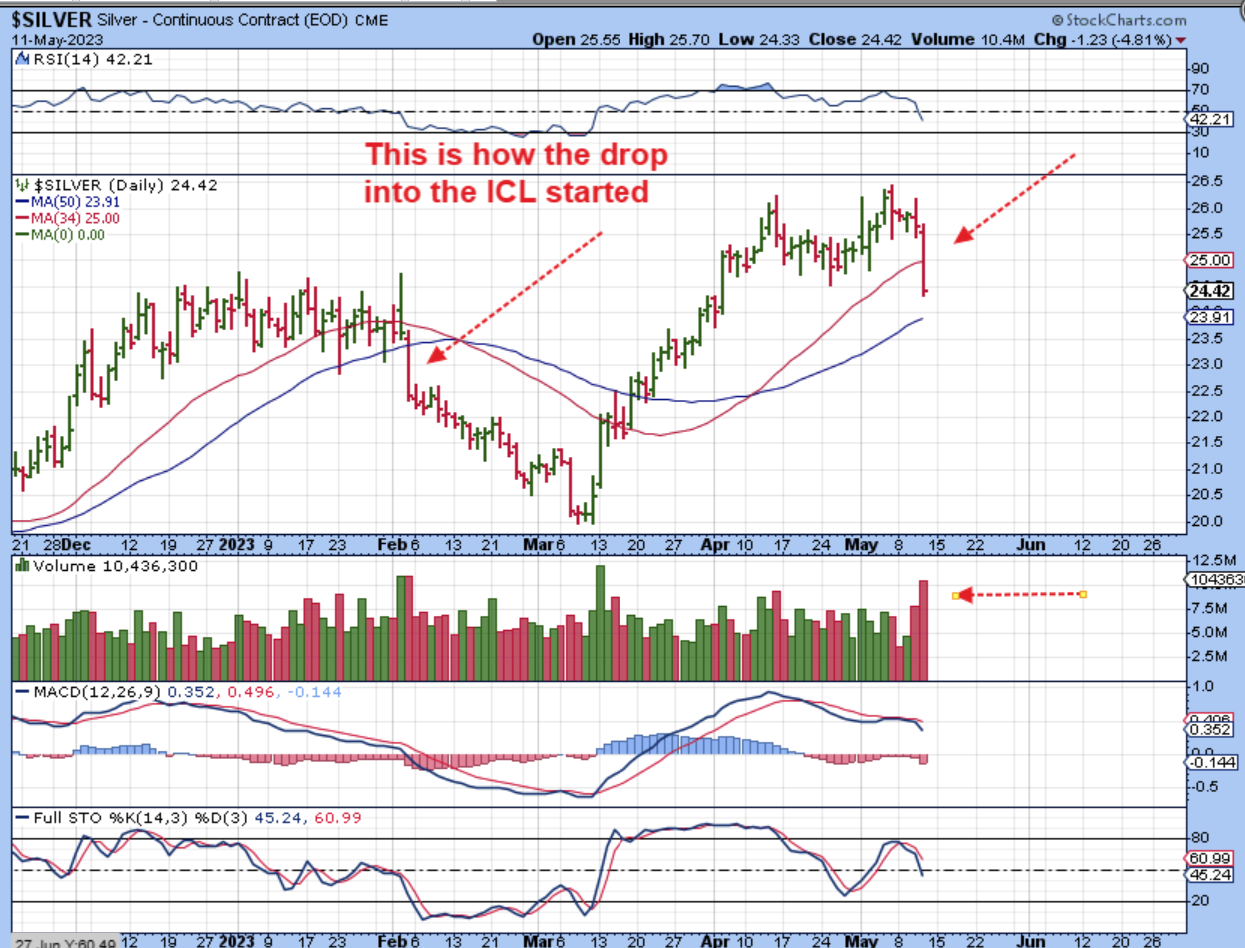
SILVER crashed yesterday for no apparent reason. We just had a deep sell off in March and then a very strong rally, so it doesn’t make sense that Silver is now breaking down, but just like EXK, HL, and FSM – Silver dropped sharply.
.
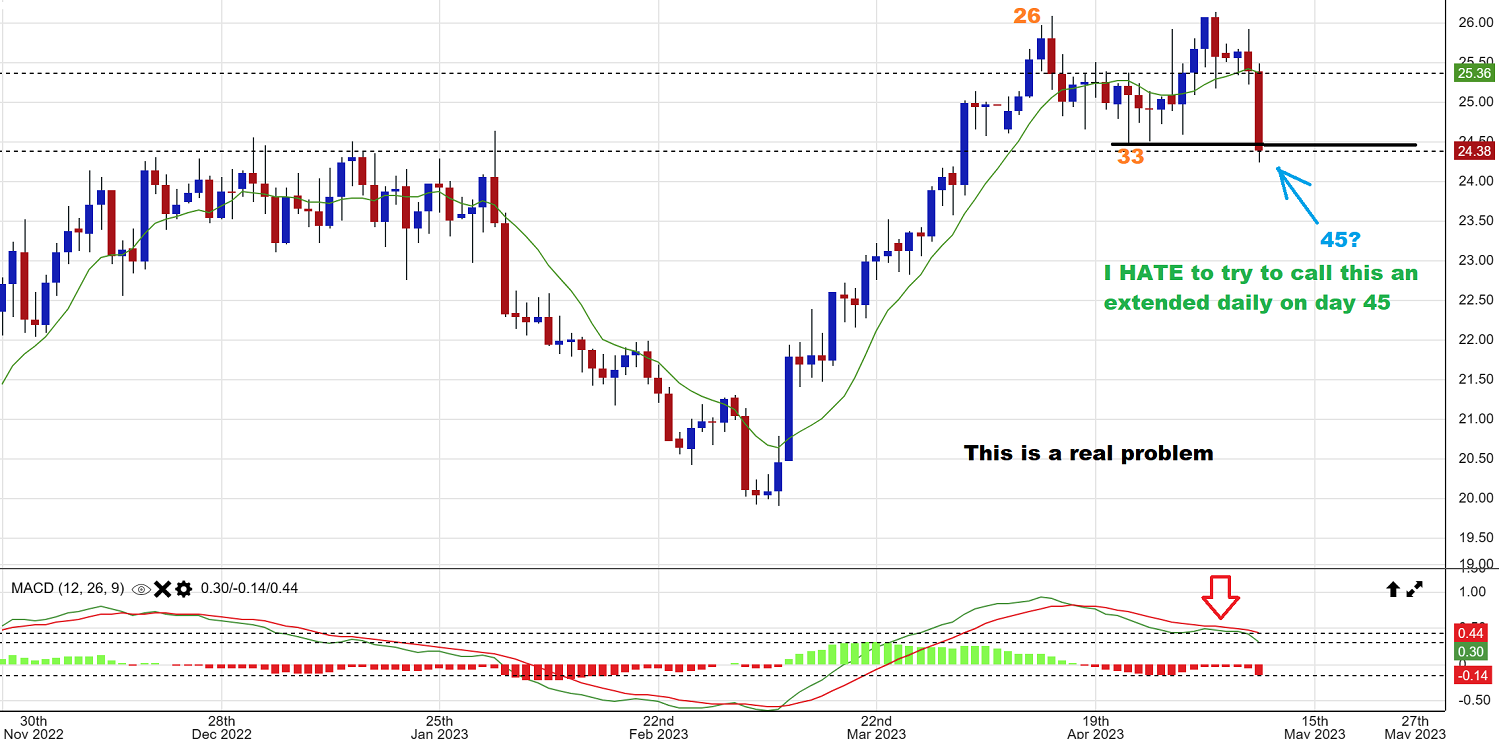
This broke what should have been a day 33 dcl, and that looks like a failed daily cycle out of an ICL. Or does it extend this daily cycle to a very long one? I hate to ignore a clear warning, but so far Gold hasn’t broken the lows, so this is possibly a larger sell off extending the drop.
SILVER – That said, take notice of how our ICL drop started. It started with a 1 day crash and then chopped slowly lower for weeks. That March sell off was Dreadful.
.
I posted this yesterday in the comments area. It is a possibility, but again, this is not normal smooth Cycle action if it happens. A drop to the 50sma is normal technical analysis action though.
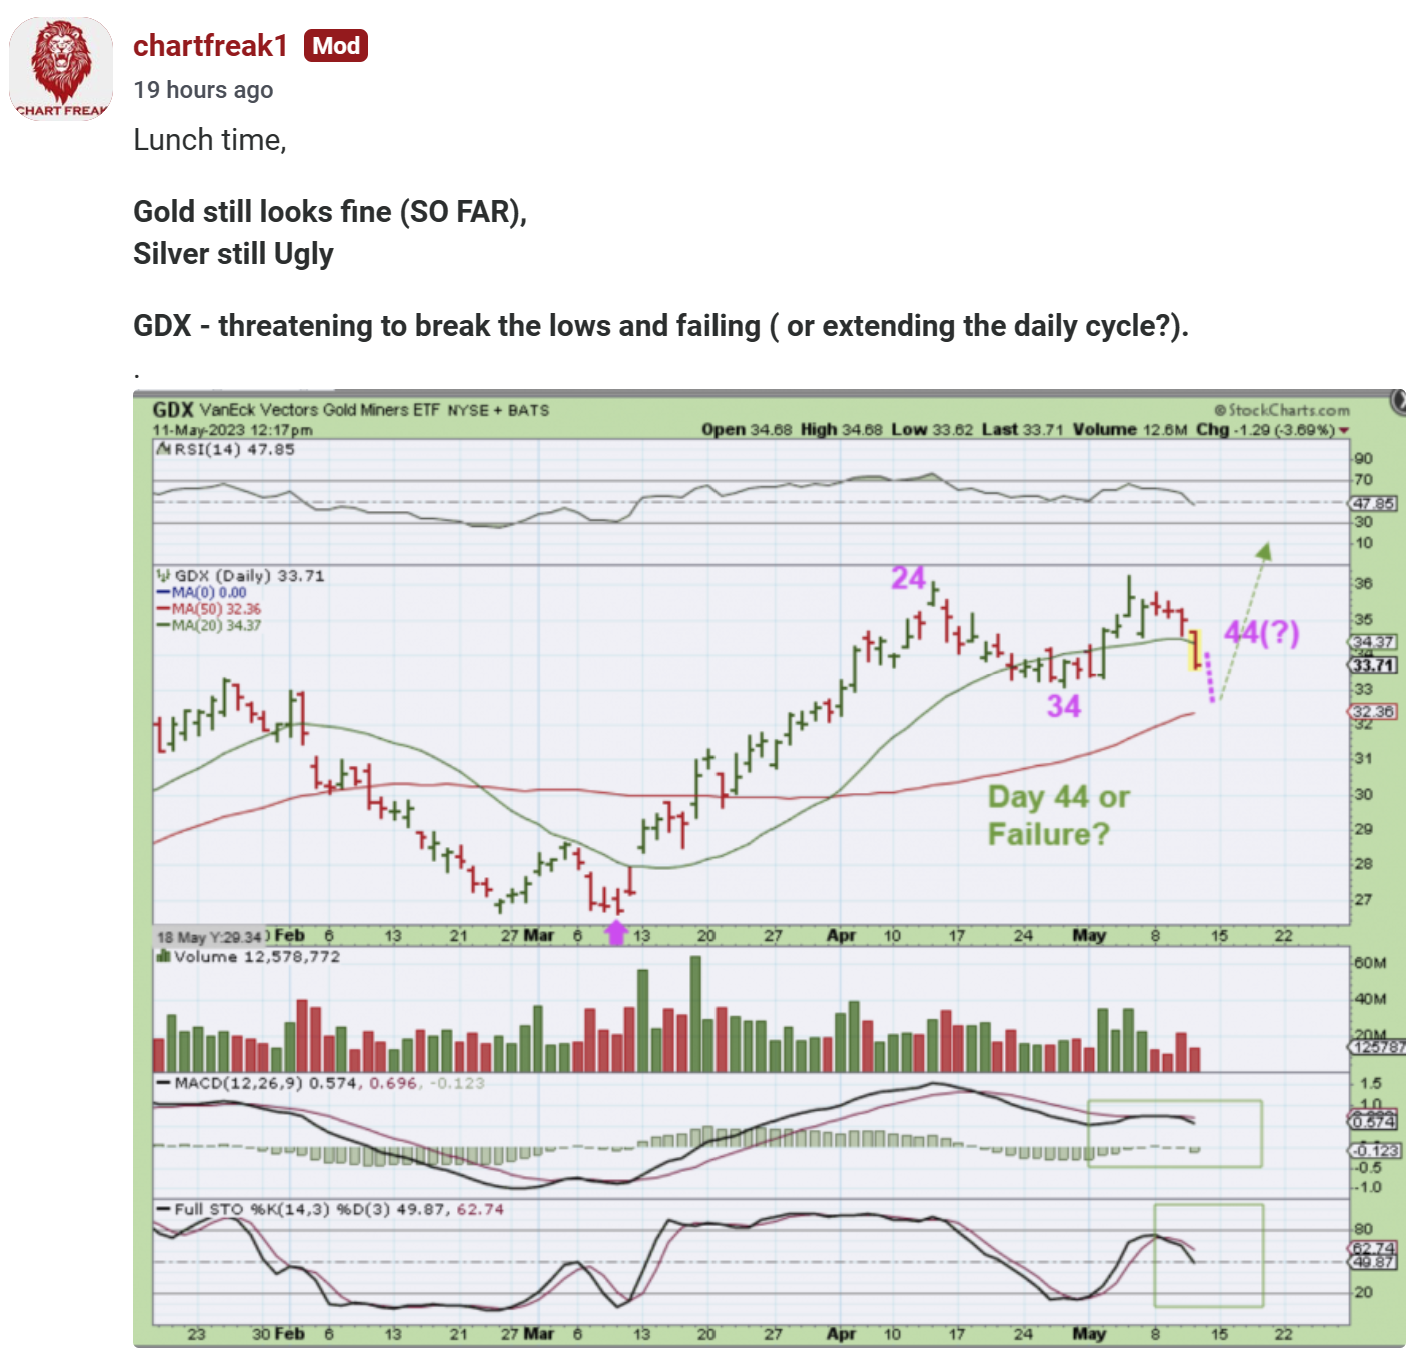
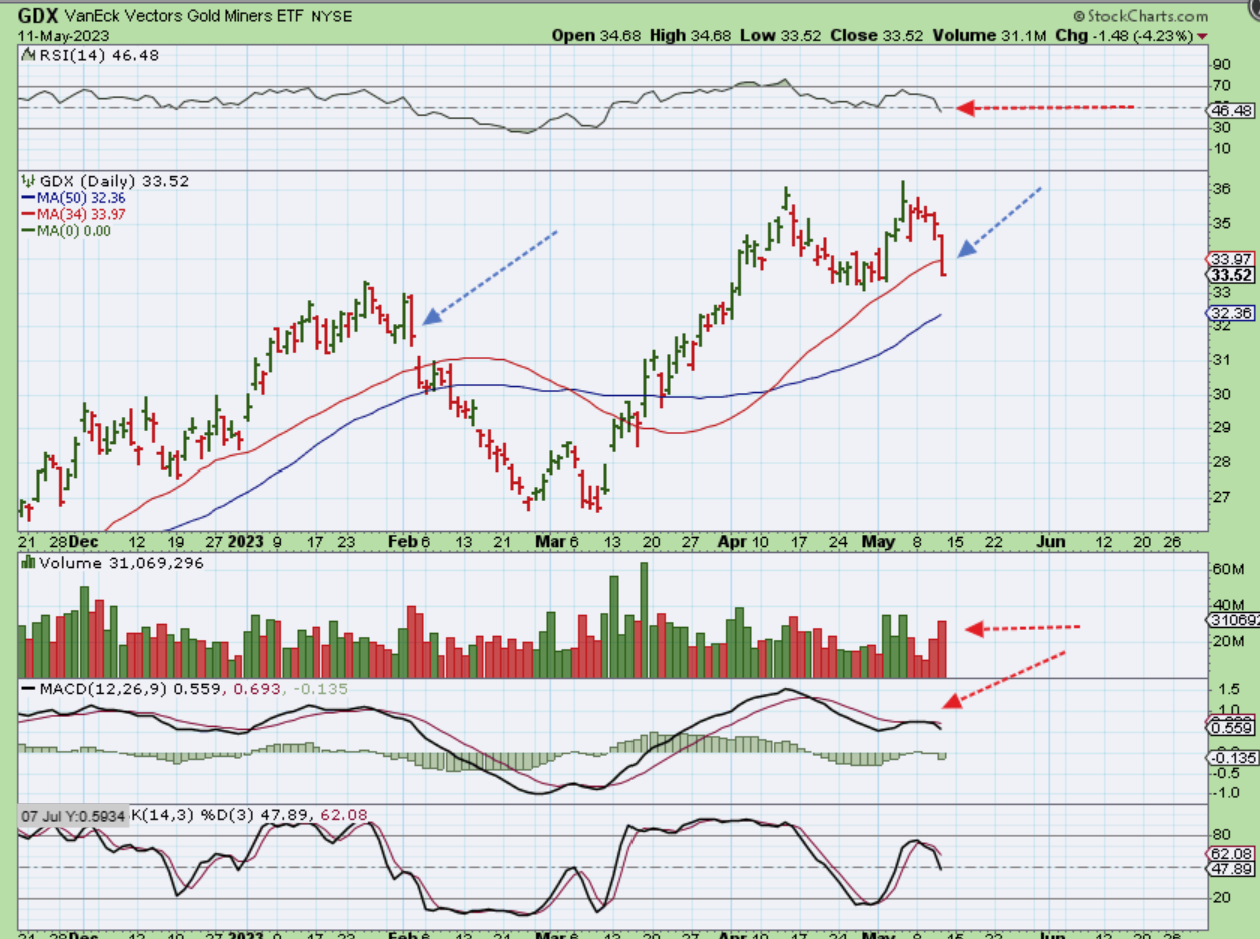
GDX started to follow Silver more than Gold. That drop with Silver stocks on Wednesday and Silver on Thursday caused many to raise stops or just sell miners to lock in gains before they fade away. We can always get back in later, but right now GDX is threatening to take out the recent lows too.
.
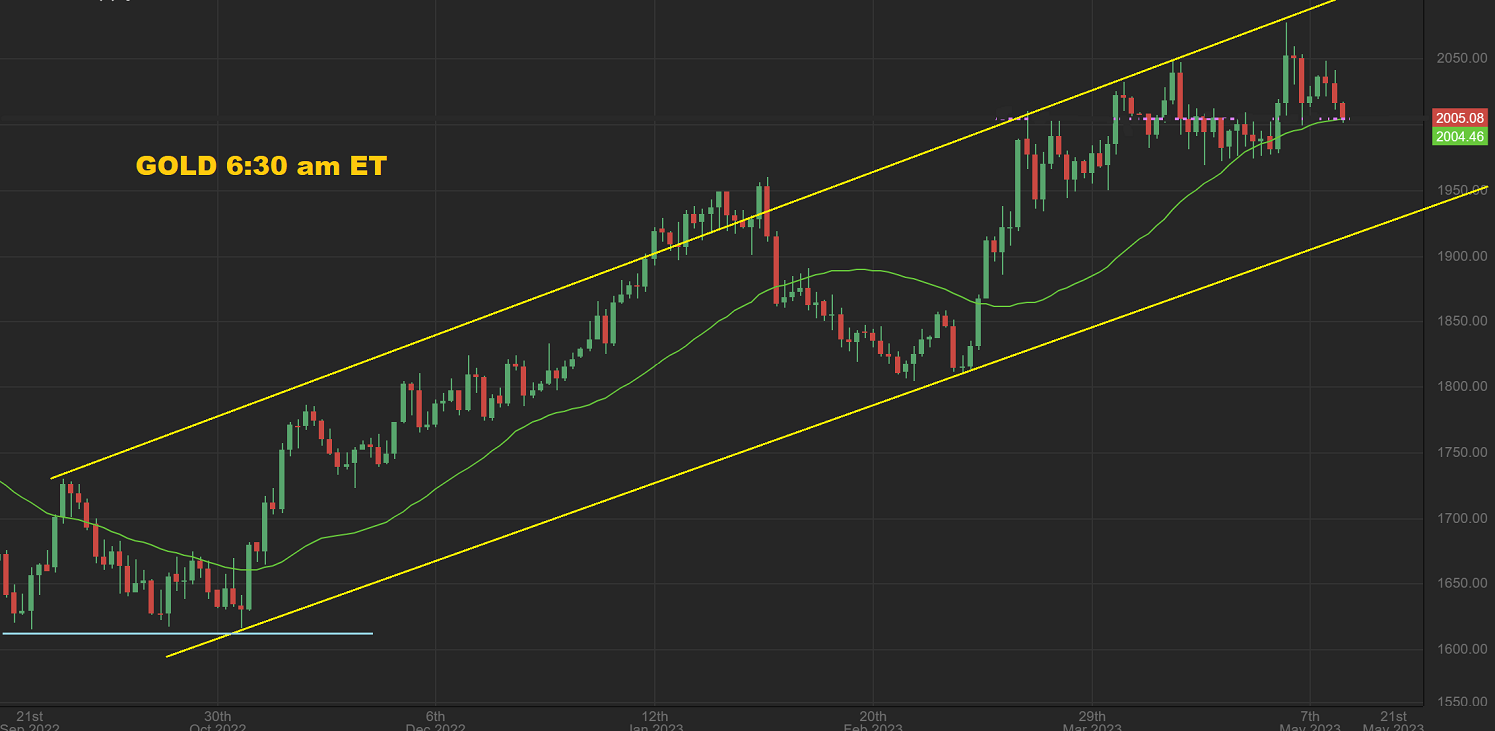
GOLD LIVE 6:30 am ET. I drew this trend line / channel to show that Gold is holding up at 6:30 Friday morning, but it could drop to the lower channel if it follows Silvers drop.
.
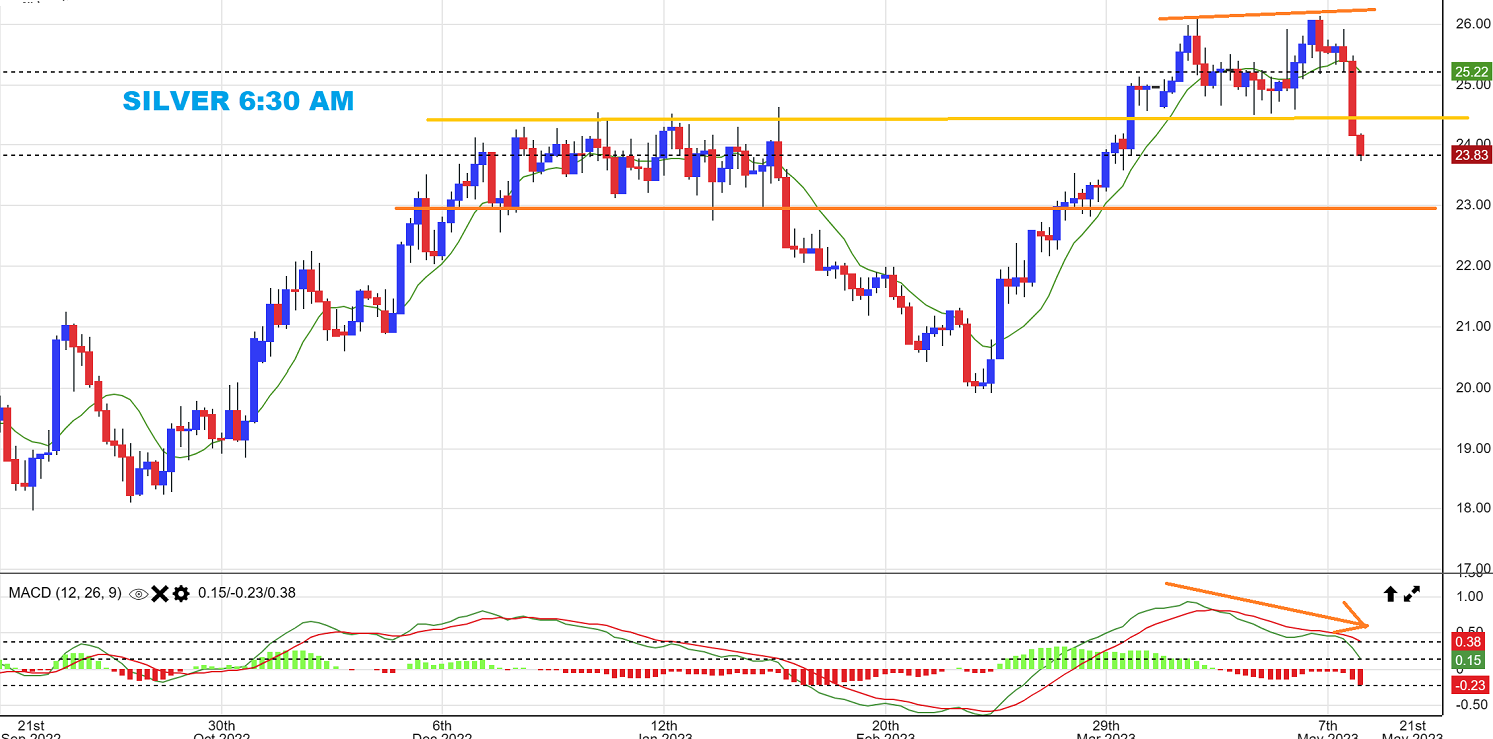
SILVER LIVE 6:30 am ET – Silver is still dropping at 6:30 am, and is entering what should be a support area. So far Silver is 1/2 way through that area and looks like steep sell off.
.
At this point, The Precious metals sector is mixed, but it is not stable. Silver broke down and Miners are starting to follow. I sold my Silver stocks Wednesday, because I had raised stops and sold everything else yesterday when Silver took a nose dive. Yesterday I mentioned that Some Gold stocks are still near the highs ( HMY, OR, DRD, KGC, etc), but I locked in everything. If The USD reached 102 and rolls over, then Gold will hold the dcl and Silver may flip higher and have a deeper dcl at day 45 or so, but right now I’ve given back some good gains that I had at the highs and would rather step aside and see how this plays out.
.
At this point there is no doubt that Silver is NOT acting correctly. If it’s just a quick shake out & flips higher soon? That is fine, I’ll get back in, but the Drop yesterday looks like a failure. We’ll see how Friday plays out and the big picture weekend report will discuss things further. The General Markets & Gold continue to act correctly, but Silver is very concerning for the Precious Metals sector, and that is where I was ‘buy and hold’. The Miners started to look like they will follow Silver, so the sector suddenly looks weak. The USD choped sideways but is threatening to push higher. We’ll see what Friday gives us. Again, I’ll cover these areas in the Big Picture Weekend report, but I am actually traveling all day Saturday, so the weekend report will be released on Sunday. Enjoy your Friday!
,
~ALEX
.
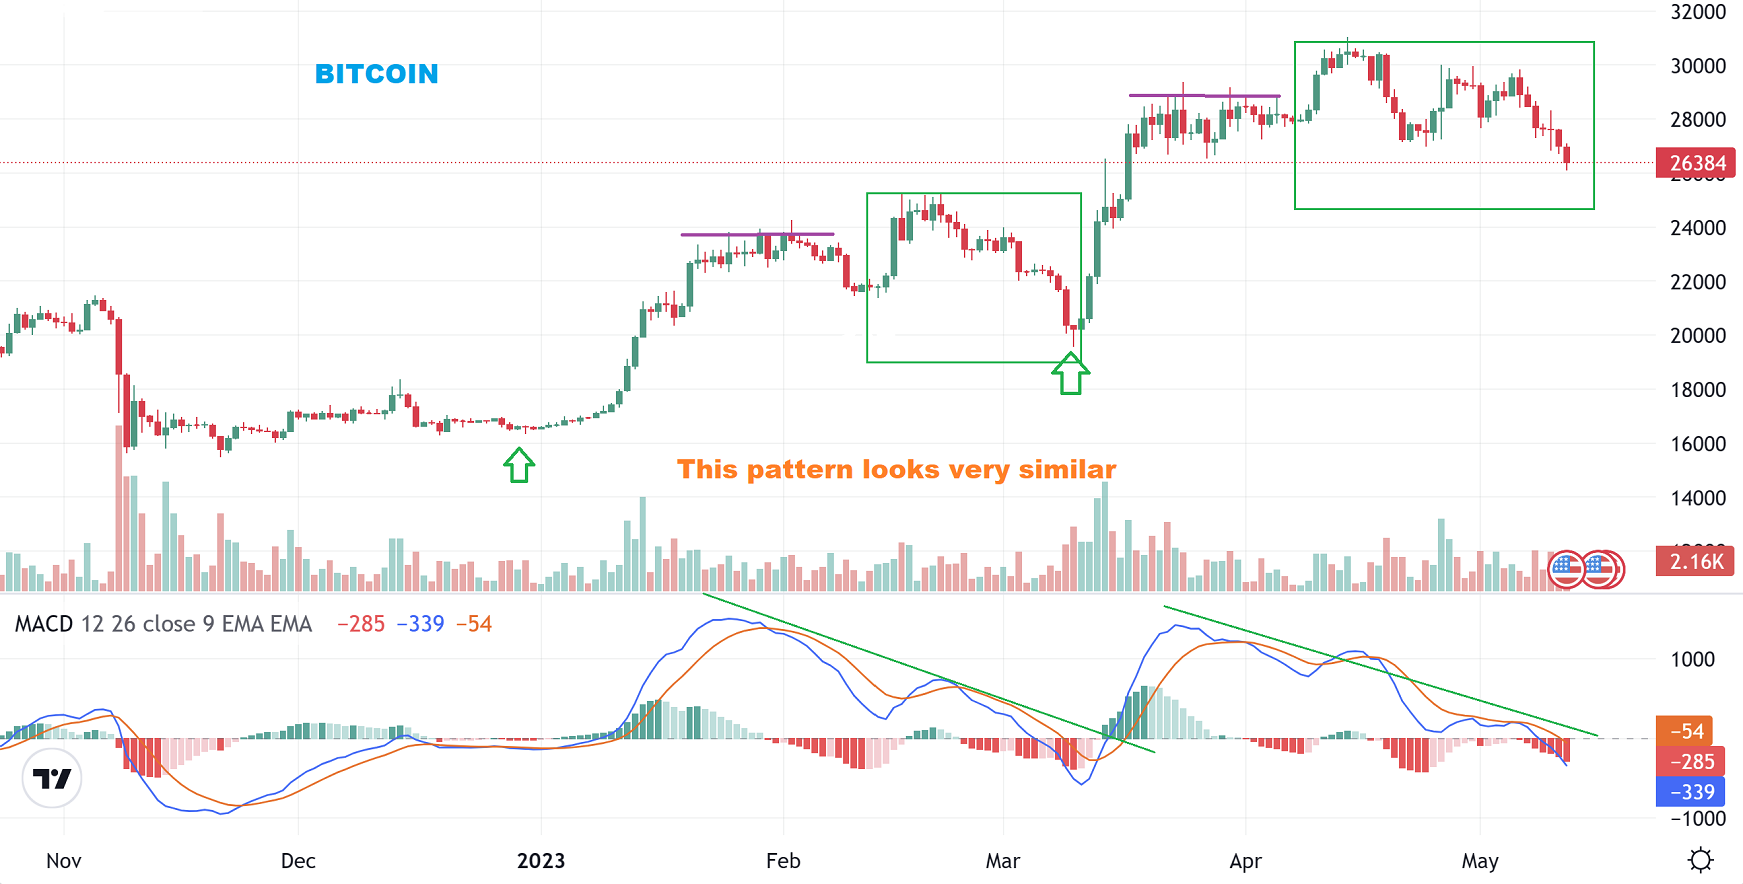
BITCOIN broke the day 45 lows and is on day 62 (or day 45 is the dcl early and this failed). It seems more likely that the dcl is still ahead because day 60 is normal for a bitcoin dcl and the pattern looks similar to the last lower low sell off, so I drew those similarities here. There is no ‘Buy’ signal until you get a swing low with follow through, because this can drop further. Let me show you…
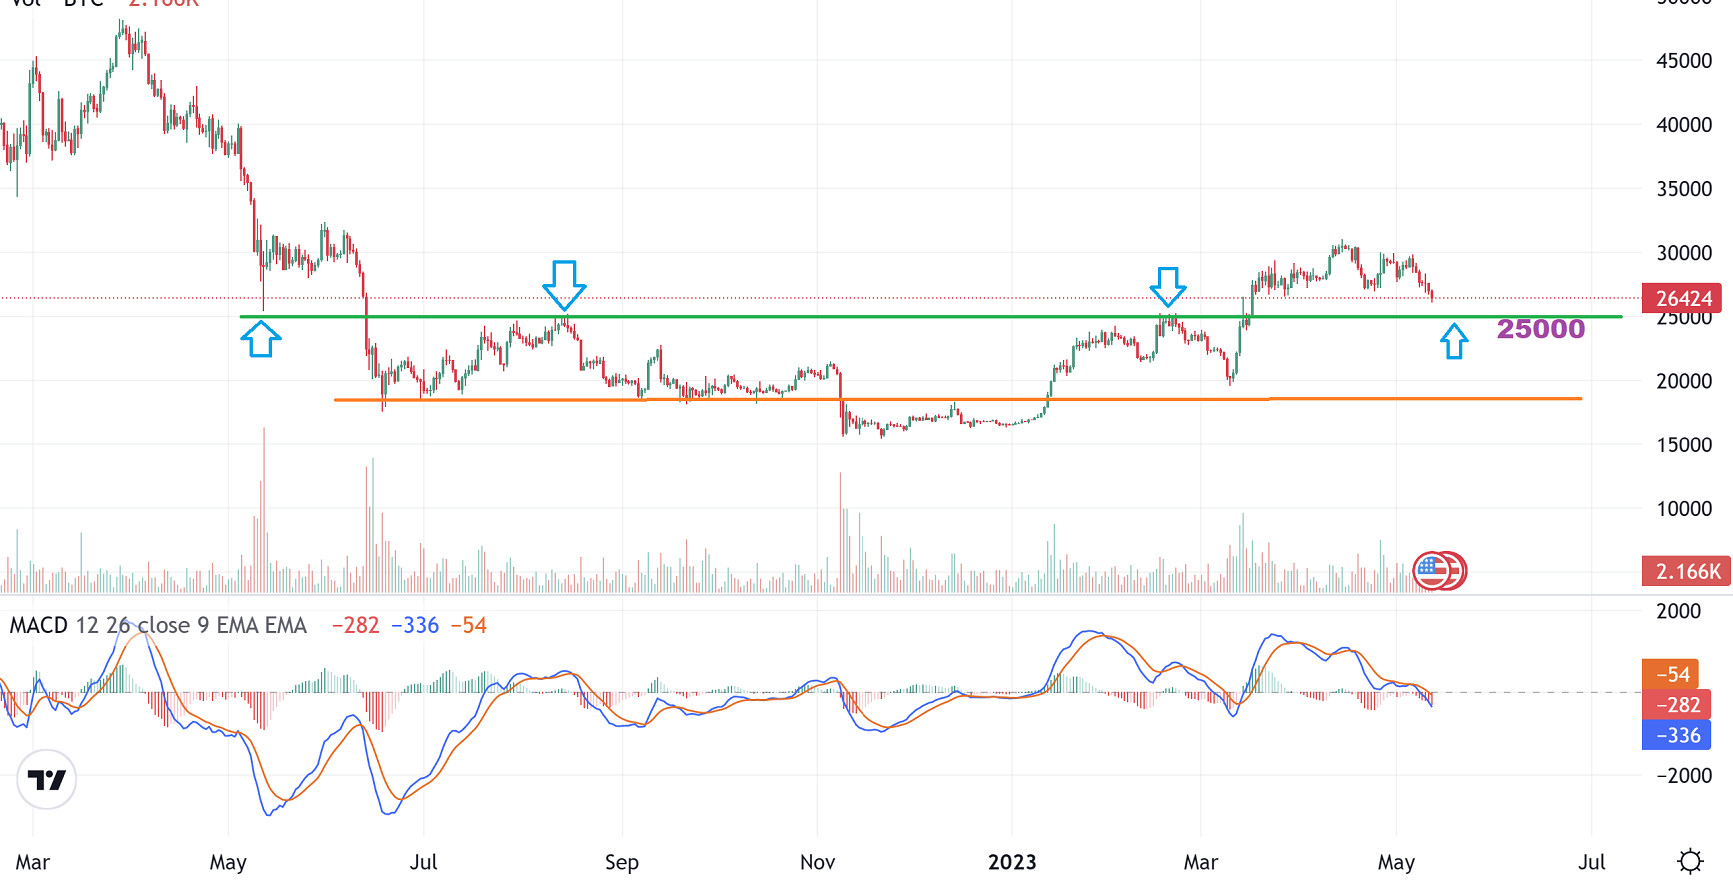
BITCOIN can drop to the area that was resistance on the way up. That would be the 25,000 area. We might get a reversal and a swing low in that area, but so far we do not have a swing low in place and the macd is pointing lower.
.
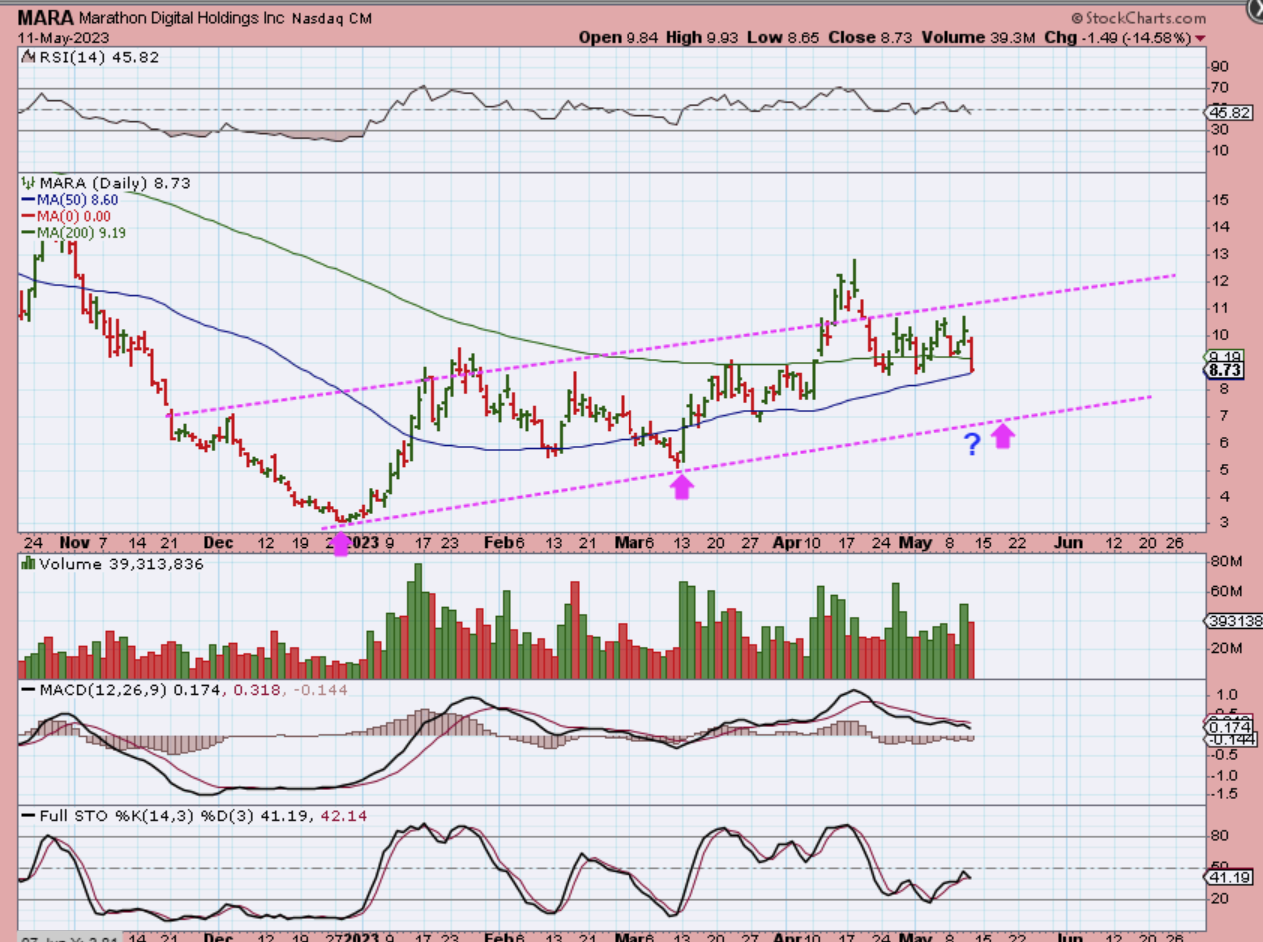
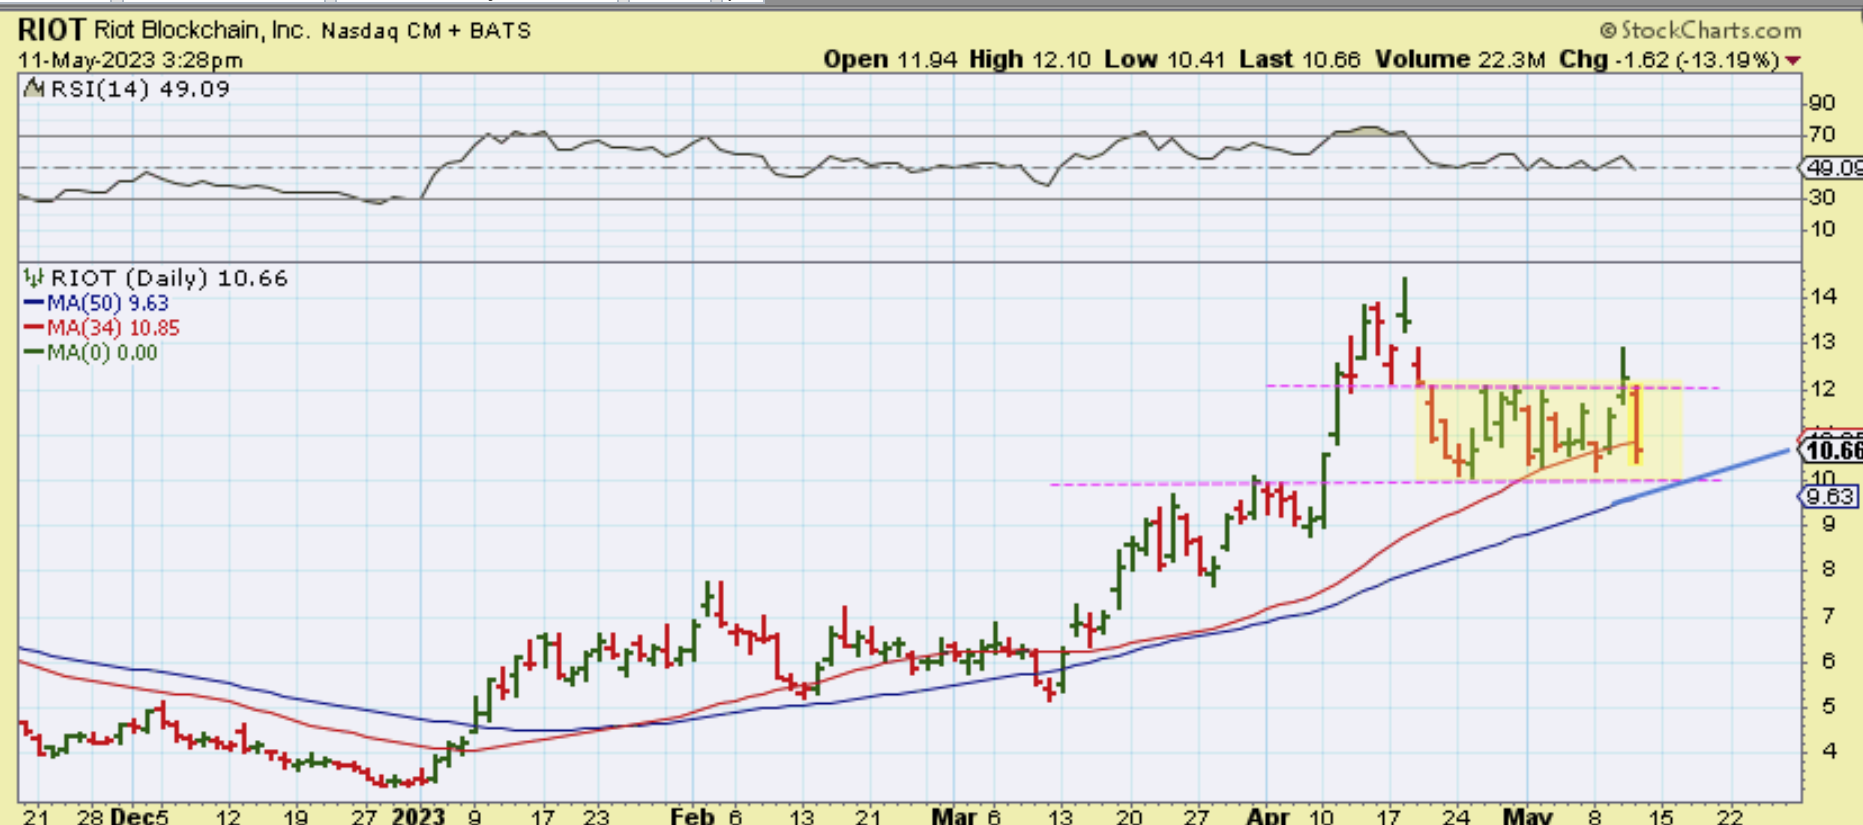
RIOT dropped 13% and I drew this. It is not breaking to new lows like Bitcoin, but as I have pointed out many times, these are simply very hard stocks to own, due to the large moves that they make. RIOT can drop further to the 50sma and remain bullish.
MARA, however, lost the 200sma and is sitting on the 50sma, so it may break down today. Could MARA drop to $7? Yes it could, if it loses the 50sma.