April 23rd Weekend Report
I was away this weekend, so I am going to put this together Sunday morning 5 a.m. and try to get it out by 9 a.m. ET, so I will not have time to proofread it for typos or small errors. Please excuse any typos, and thanks. 🙂 The good news is that despite a little pullback last week, the Big Picture set ups remain Bullish. Let’s get to the charts!
.
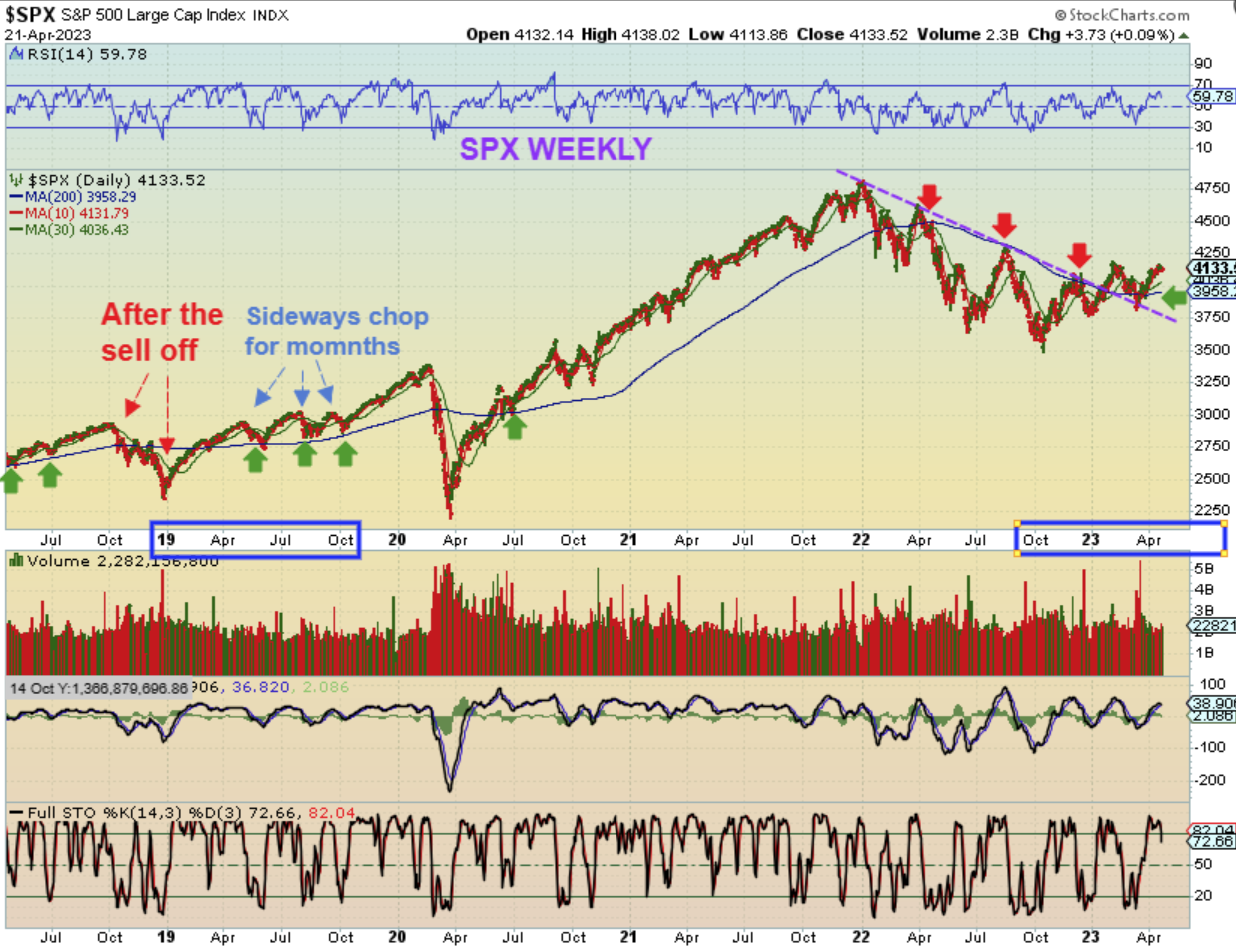
The SPX WEEKLY: The SPX was up slightly ($3.75) for the week, but it formed a doji and as mentioned in weekday reports, it could start to drop into a dcl. It remains a bullish set up. I pointed out the sideways choppy period that took place in 2019 for months. We may see a chop higher from here rather than a ramp up, since I am still seeing numbers point to a recession late this year.
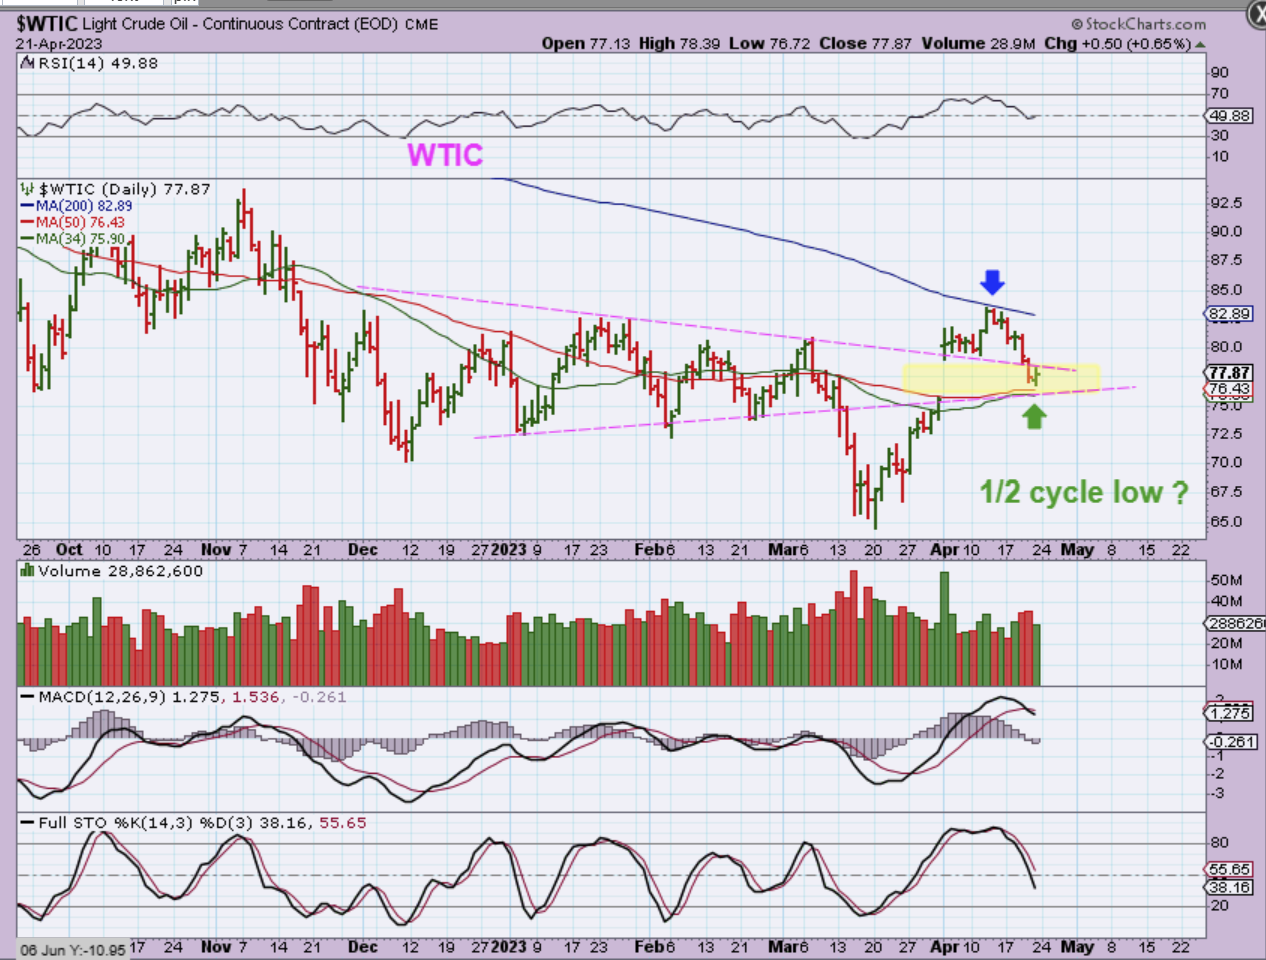
WTIC DAILY #1 – On a daily basis, Oil gapped up when OPEC discussed production cuts and instead of a GAP & GO run, it chopped sideways. I have been wondering if Oil could put in a 1/2 cycle low and gap fill at the 34 /50 sma area. On Friday Oil did drop into that gap & then put in a reversal. Oils daily cycles can run 40-50 days in length, and this is day 22, so it may just be a 1/2 cycle low…
.
#2 – From here it could now put in a higher low here at the 50sma and then break above the 200sma to remain bullish. Breaking down to the lows would be concerning, but it is possible, because…
If you look at Oil in 2019, it bounced off of the 200 week ma 3 times. Could that happen here? It is possible, but for now I’m watching the 50sma on the daily for support.
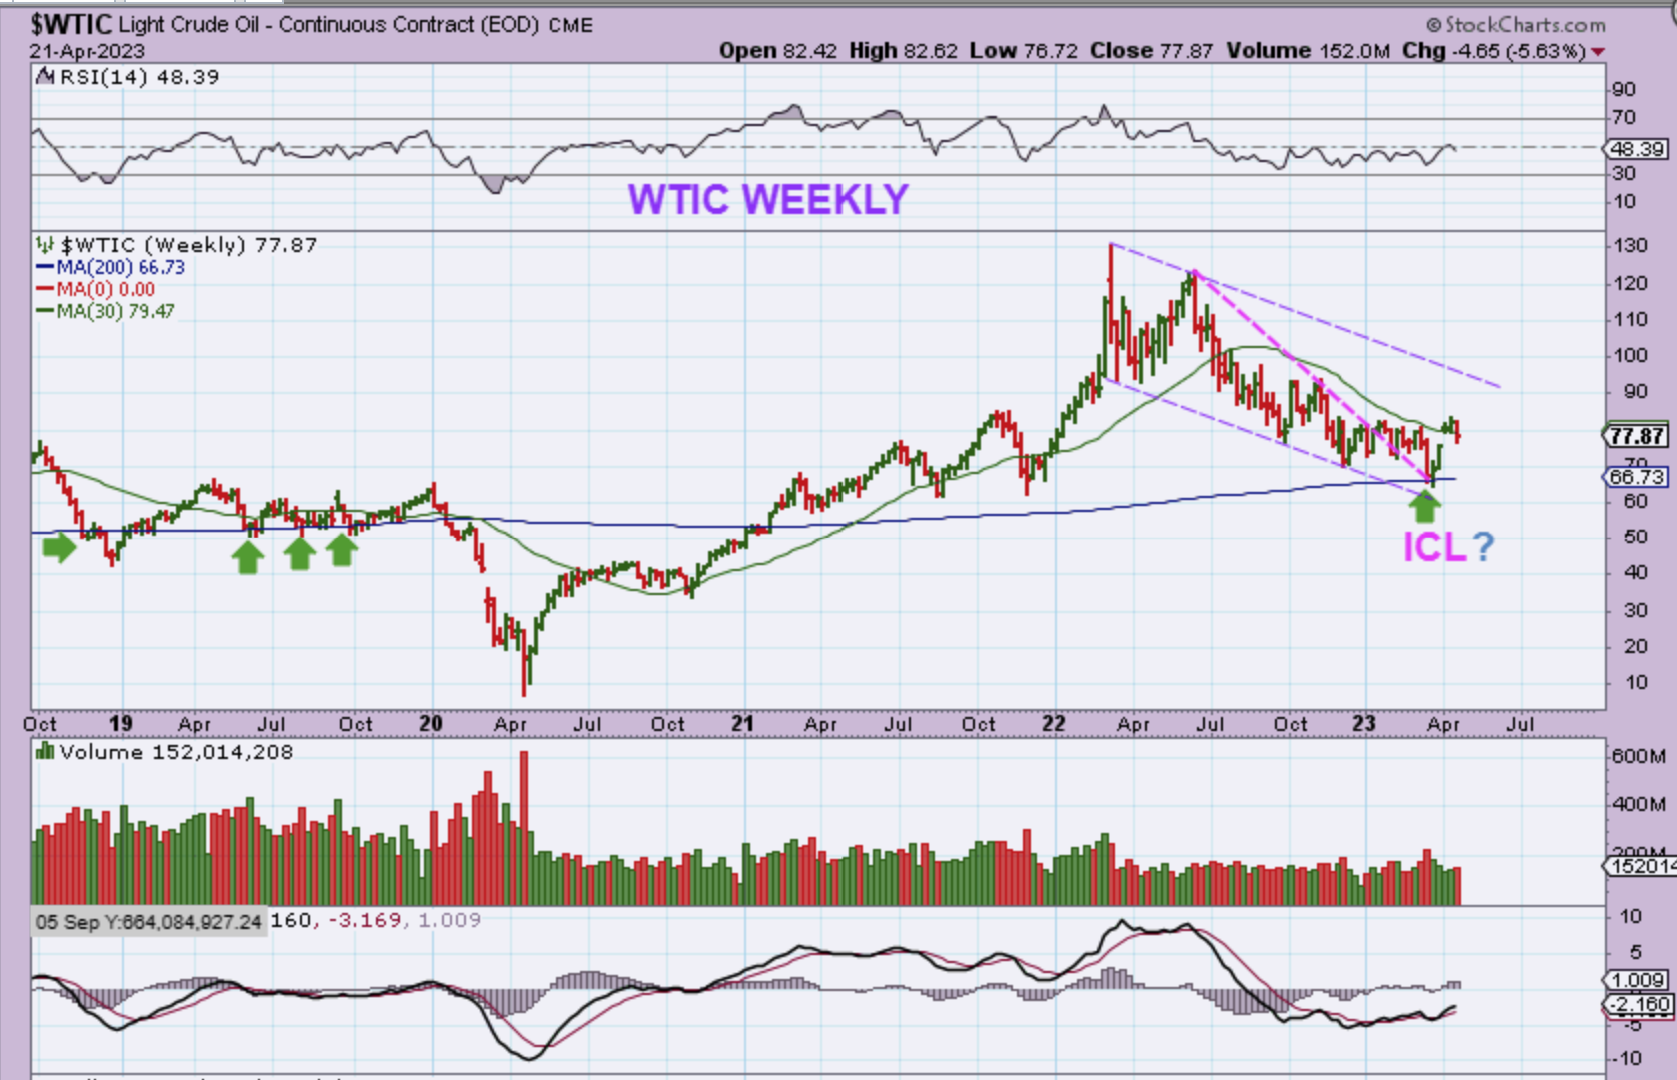
The bigger picture for Oil shows a strong reversal at the 200sma and that is where I think we have an ICL. That would be an “Intermediate Cycle Low’ and a run to $90 is possible. As it tried to fill the gap, Oil did lose the 30 week ma last week, so recovering that next week would be bullish in my opinion.
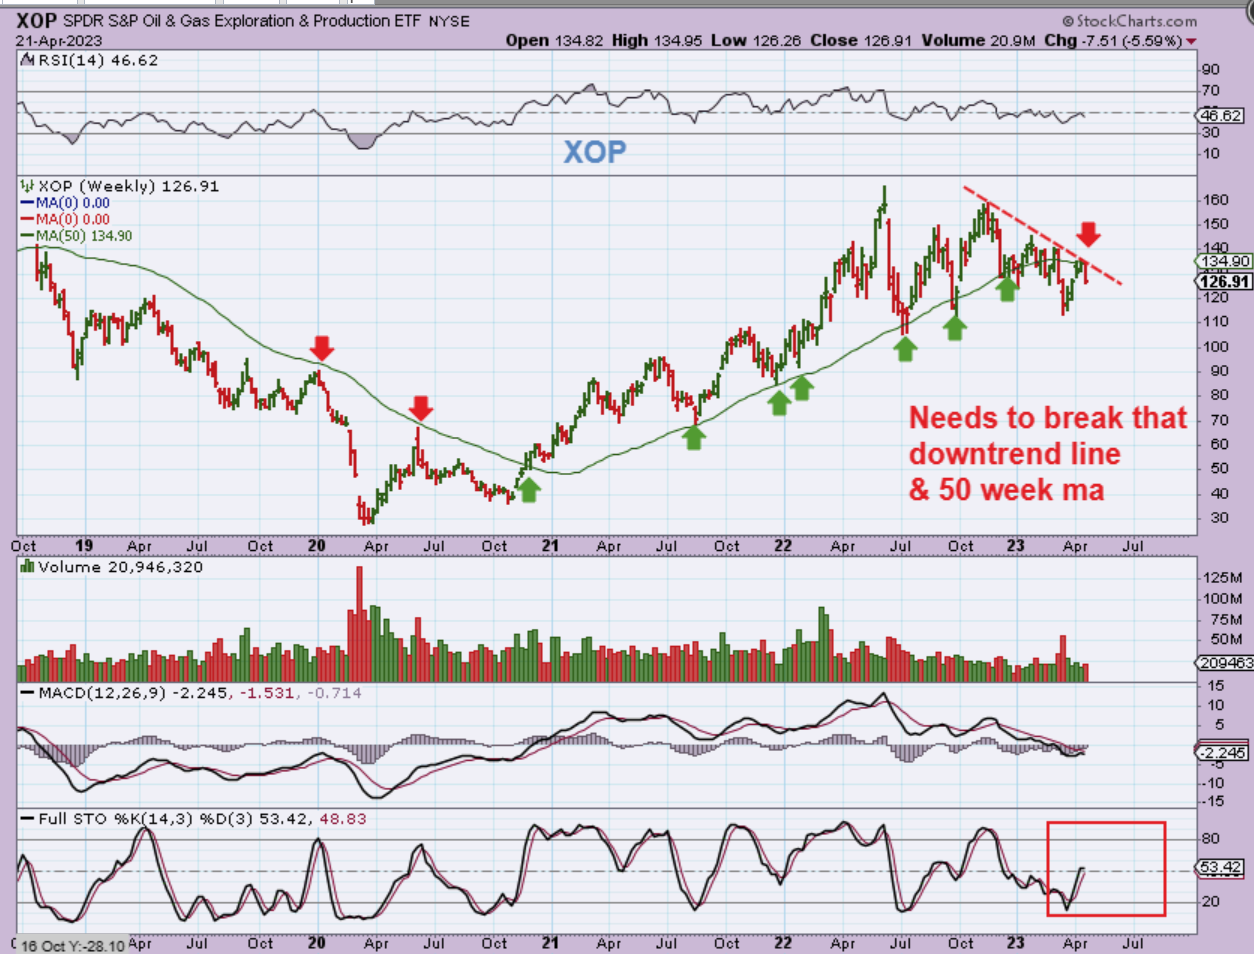
THE XOP : Take a look at the green 50 week ma, and you’ll see that it does affect the XOP. The XOP actually reversed lower at resistance last week too, so I think that it needs to move above that downtrend line to remain bullish. If this continues to drop lower, that downtrend remains in place. This is still somewhat oversold.
The USD Daily: The USD usually has shorter daily cycles, roughly 25 days in length, so it is hard for me to think that this is day 49 low. We also broke below the ICL of February (a weak failure), so I think that we saw a dcl on day 34 or 43 and this is just chopping sideways at the 20sma now after failing.
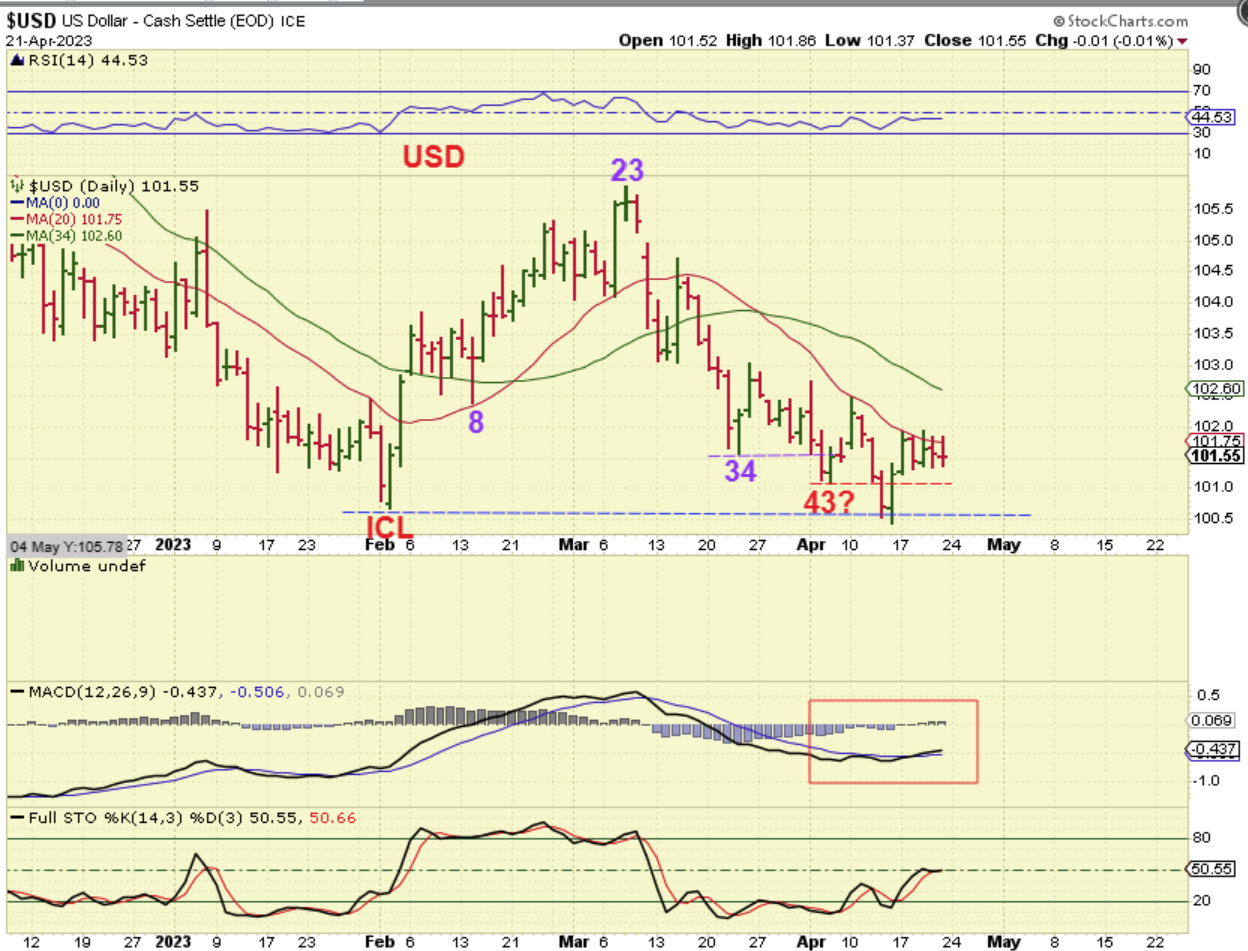
The first drop for The USD was pretty sharp and I think that we’ll see a second drop. As I have been mentioning for over a year and a half…
.
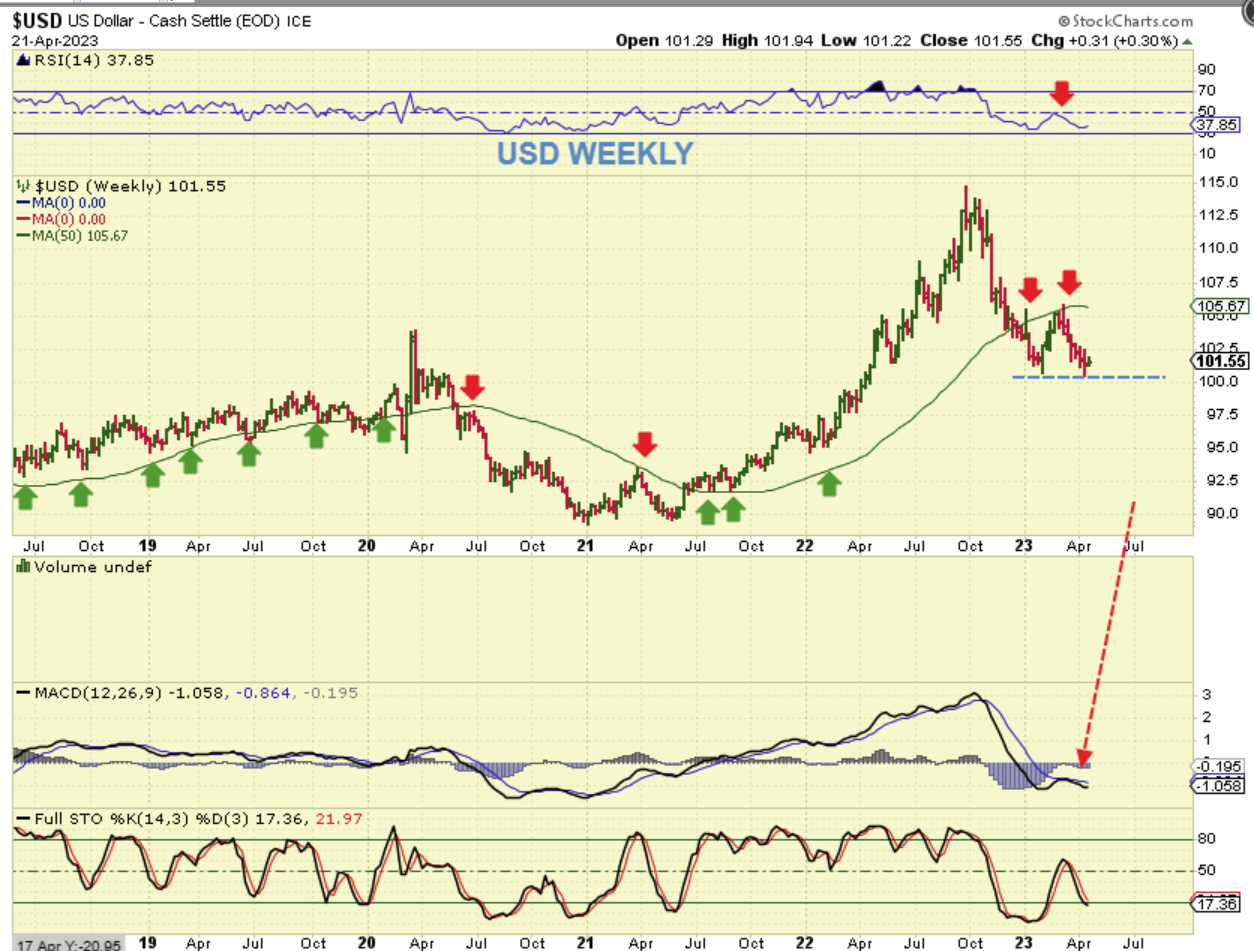
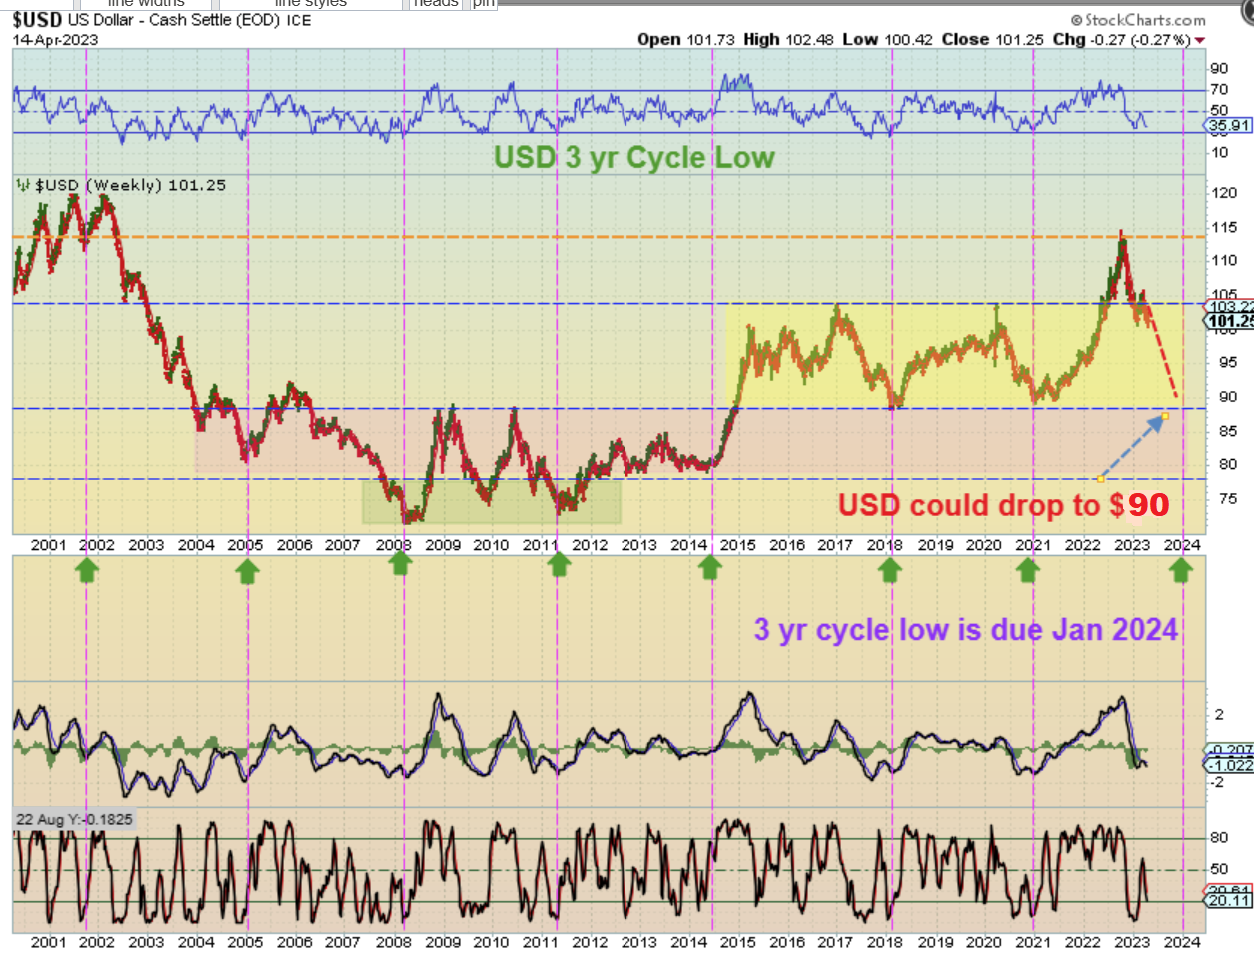
As I have been mentioning for over a year and a half: I expect a 3 yr cycle low at the end of this year or Jan 2024. I drew that drop in here, and we’d only be about 1/2 way there. As the USD drops, Precious Metals have been running higher. I expect that to continue.
.
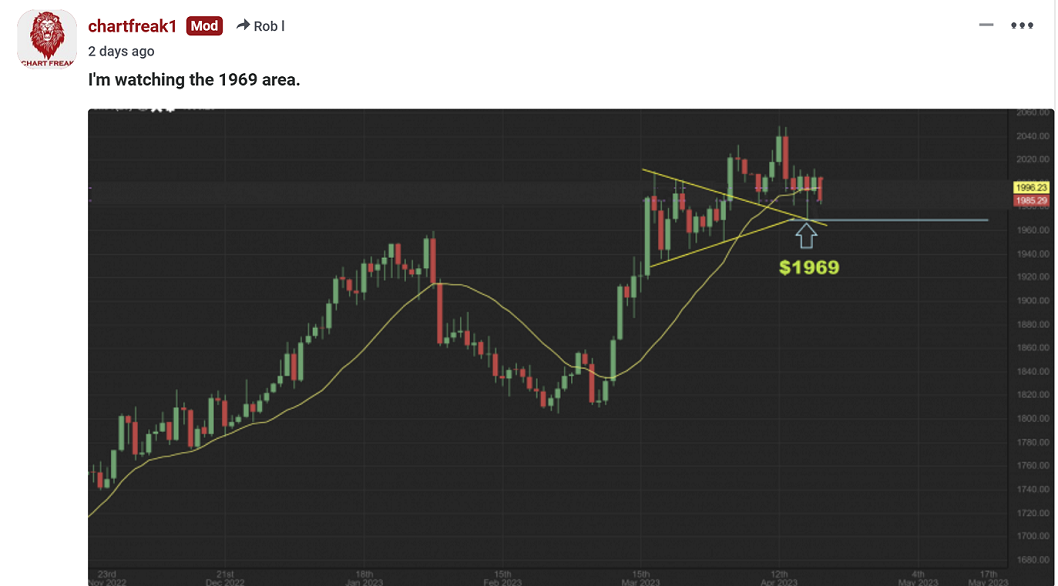
So with The GOLD DAILY Chart We could have a dcl in place and I was watching that $1969 level to hold up. I wrote this in Fridays comments.
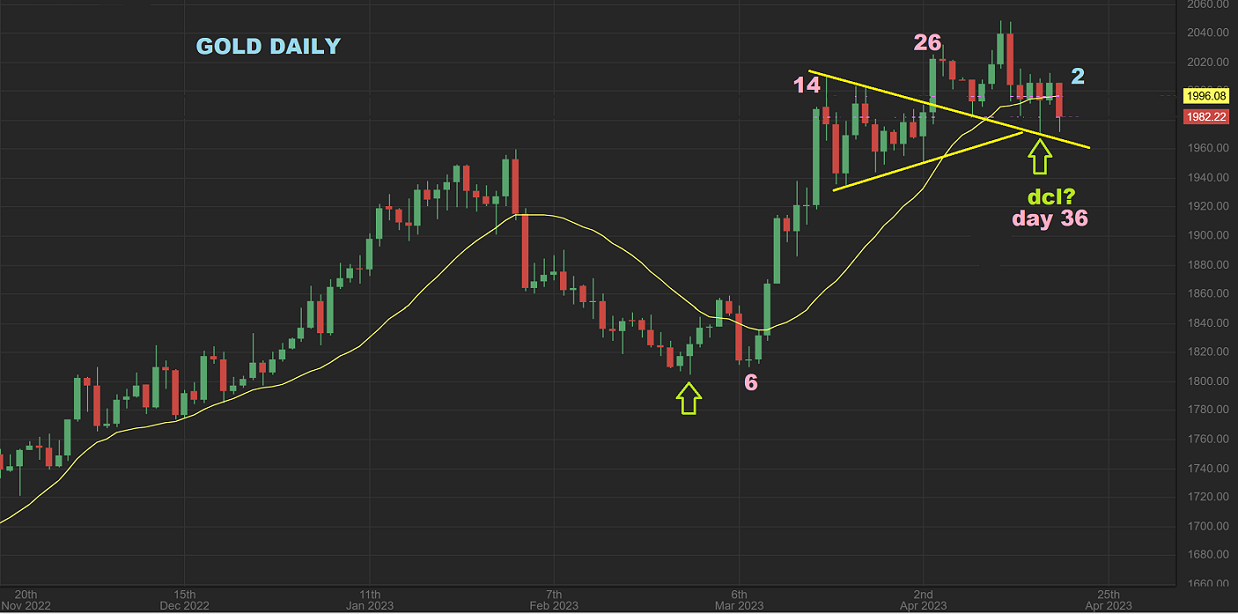
GOLD DAILY– So far those lows at day 36 did hold up and if the USD drops away from its 20sma and continues lower, Gold could start to move higher from here and Monday would be day 3.
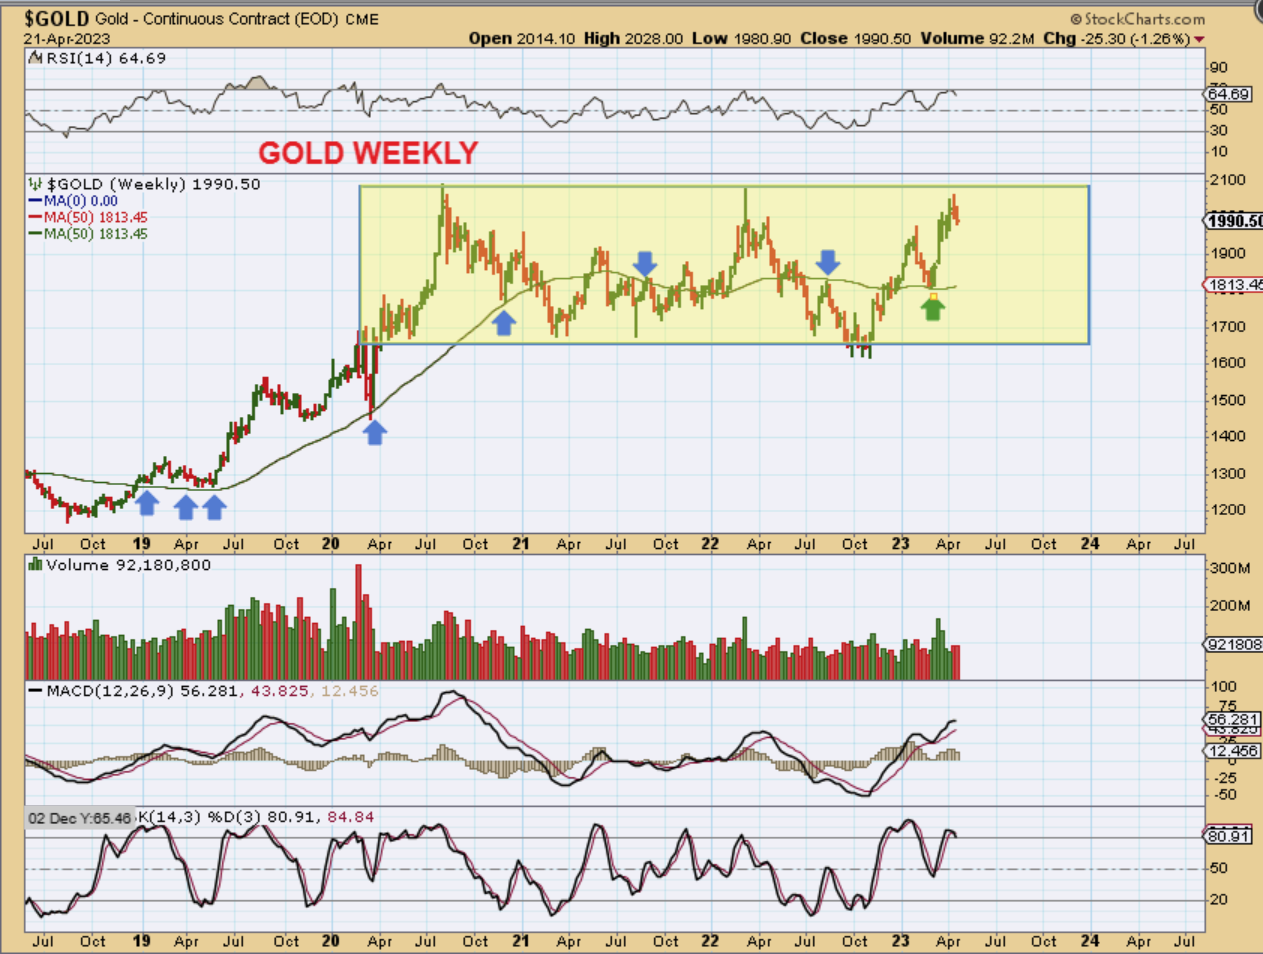
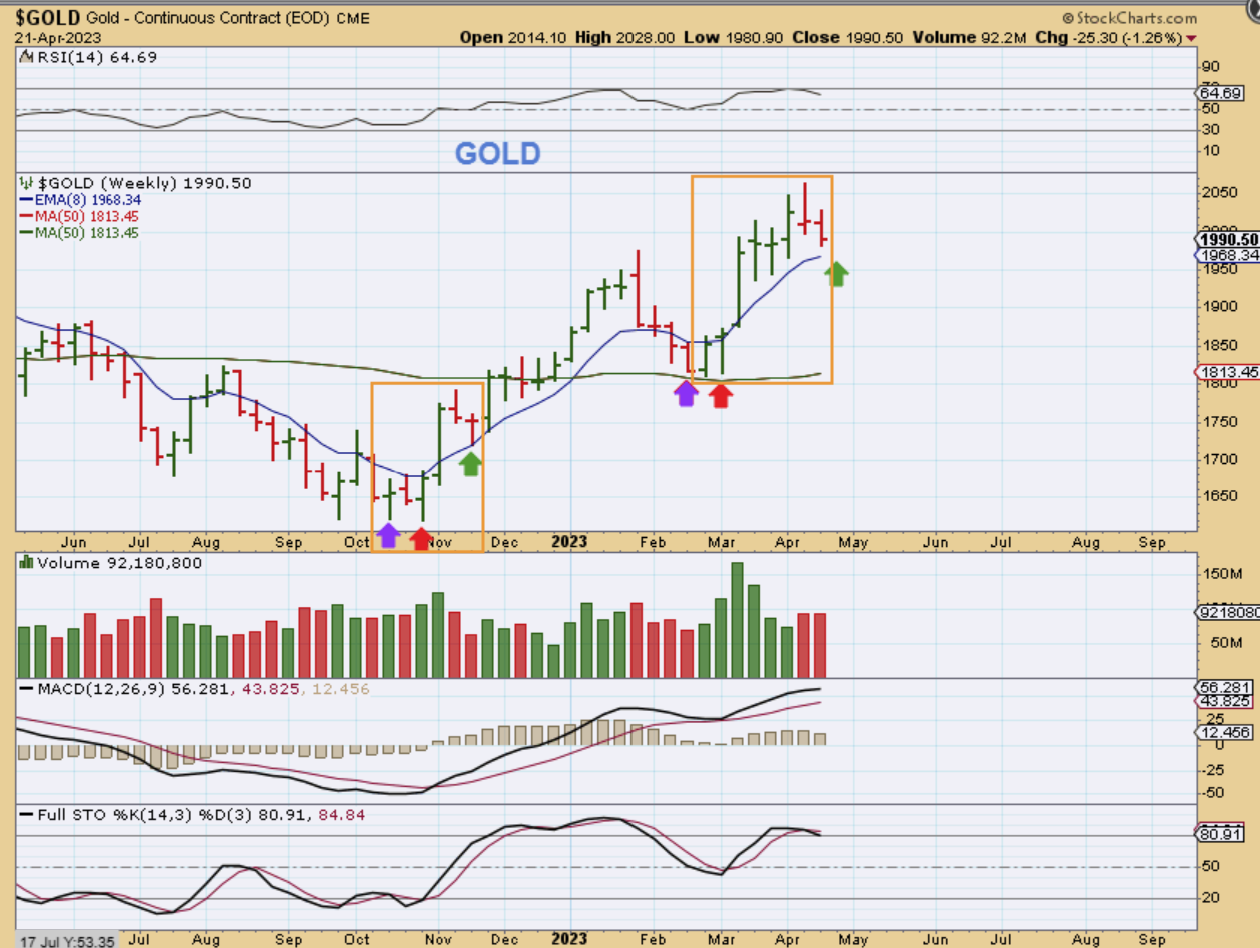
GOLD WEEKLY– The weekly chart shows a rally almost back to the highs and then a small dip as it seeks out that dcl. This is a bullish chart. We could actually see a major break out if the USD starts that drop again and Gold rallied higher next week. THAT break out would not go unnoticed!
GOLD WEEKLY– So we had our ICL at the end of 2022 and one when the Banks failed in March 2023. Let me zoom in on Gold now…
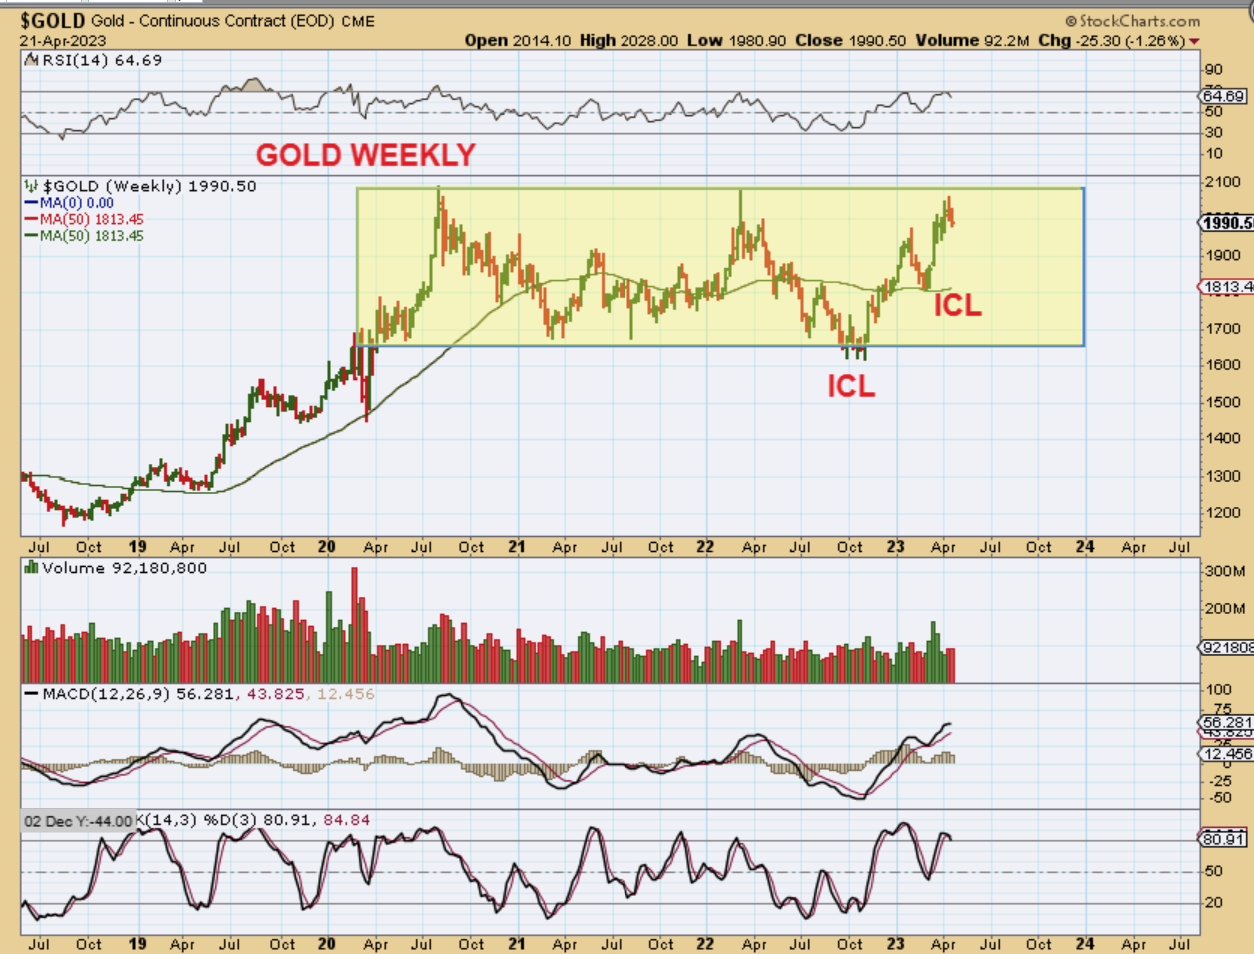
GOLD WEEKLY– Here I am comparing the last ICL with what we see now and it does look fairly similar. Using the 8 ema price rallied above that level and dipped back down to it. That is where we are now. After that a rally followed, though it was a bit choppy on the daily chart.
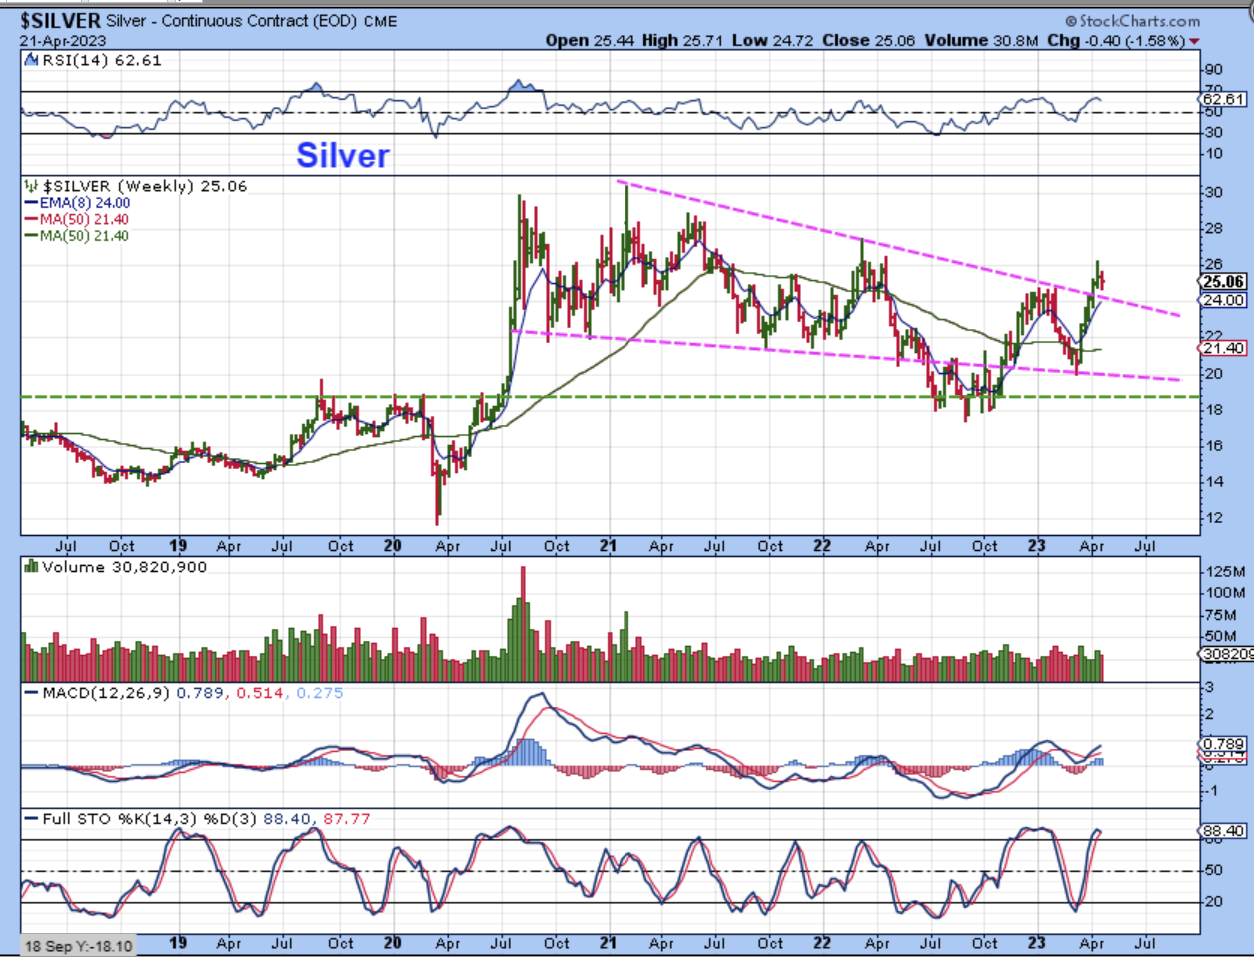
SILVER WEEKLY– Silver broke out above that downtrend for 2 week and last week ‘paused’ or dipped 1.58% last week. This also remains a bullish set up and should push higher after this pause.
.
Last week was boring for Miners as they dropped and it actually feels like Miners have been pulling back for a couple of weeks, right? Well…
.
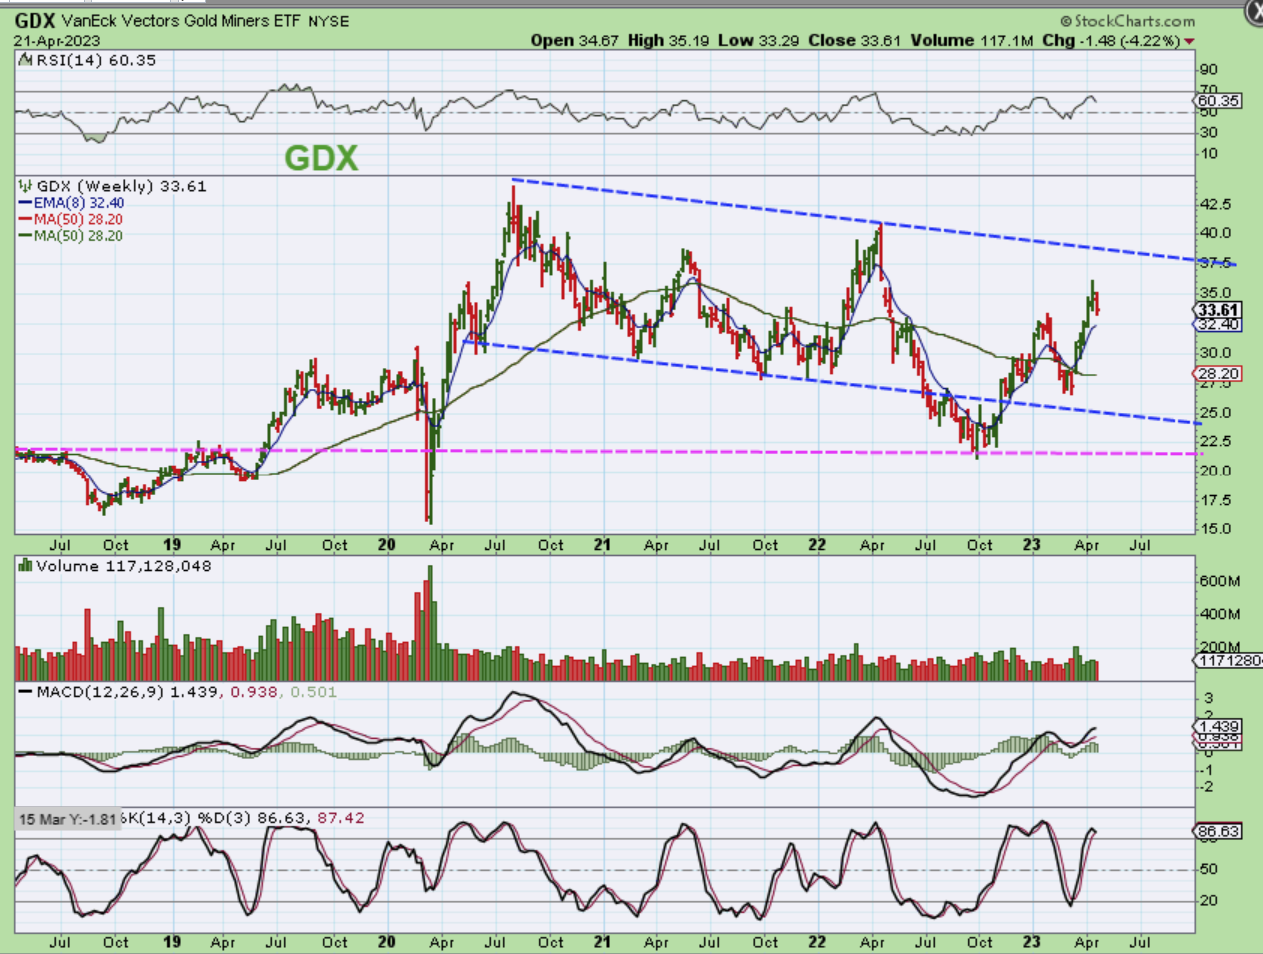
GDX WEEKLY– The Miners really only pulled back last week. In past rallies, you can see how price rode up along that 8 ema on a weekly chart. This remains quite bullish looking too. Let’s zoom in…
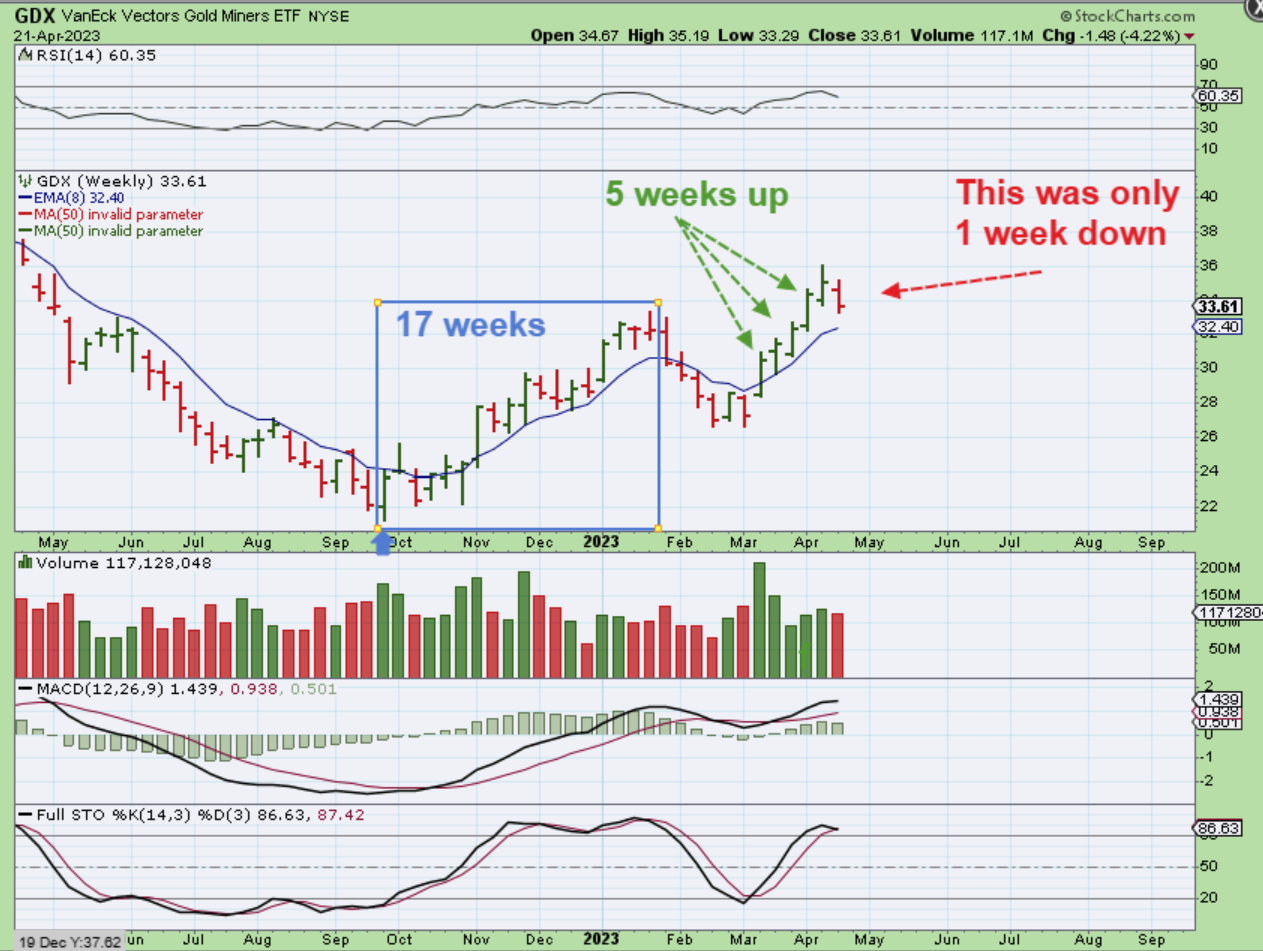
GDX WEEKLY- The rally out of the ICL in September lasted for 17 weeks from low to peak. We are only on week 6 (or maybe 8 if you go by that first low), so we have time to continue this run higher.
.
We had a pull back last week, but the good news is that the set up is still Bullish in the big picture for the General Markets and The Precious Metals. We had a nice run higher out of the ICLs, and a dip down into a dcl is normal, as the USD tried to bounce. Lately, whenever we get that slight sign of strength in the USD, price gets a bit choppy in these other sectors. We’ll see if this chop continues into next week or not, but it does look like it is time for the Precious Metals to continue higher. That likely depends on the chop or drop of the USD and the next Fed Interest Rate decision is not until May 3. Enjoy the rest of your weekend, see you on Monday!
.
~ALEX
.
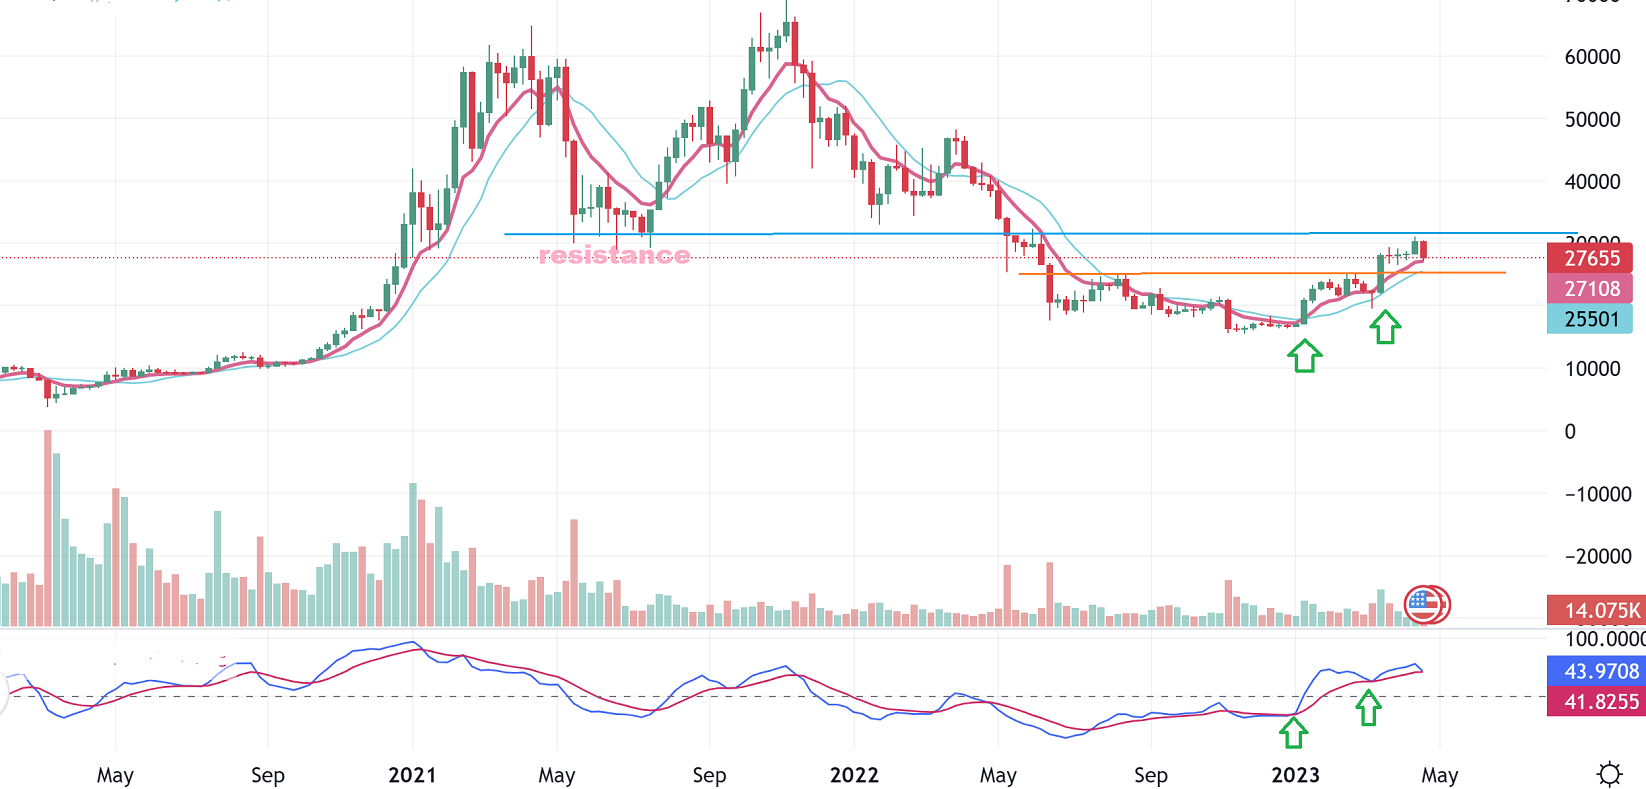
The overall picture for Bitcoin remains bullish too, as it put in a major low and ran higher. I just want to mention that I did manage to lose money in a couple of trades trying to pick the bottom in MARA and RIOT this week, and I got stopped out. They are so choppy! In one case my loss was 50 cents / share, so it happens. You can see that this happened with a Bitcoin dip, and the Crypto stocks really do move quite a bit when they get choppy, so I probably need to be more patient and not try to catch the exact lows. The Meat of the move in these often gives us excellent gains (sometimes 50 – 100 – 200%), so waiting for the next move to unfold or just buy and hold from the lows is just fine.