Wednesday April 12th
WE HAVE CPI NUMBERS DUE OUT AT 8:30 am ET (Inflation Numbers), and that often affects both the Markets and the USD, so we’ll see what happens at 8:30 am ET.
.
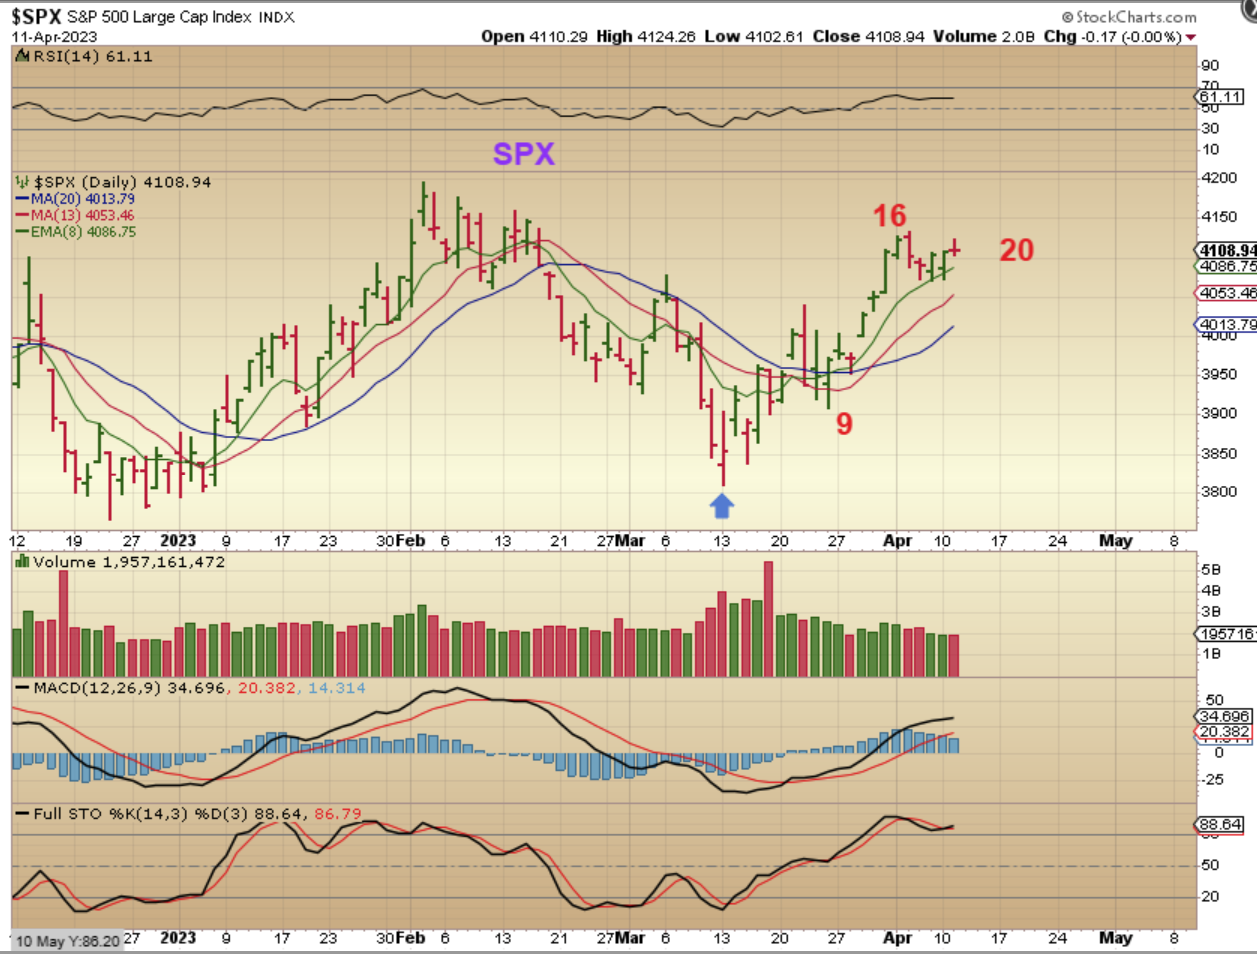
The SPX – After reversing at the 8 ema, the markets stalled on day 20. If the markets can push above the day 16 highs, it will likely become another right translated daily cycle. CPI Numbers are due today.
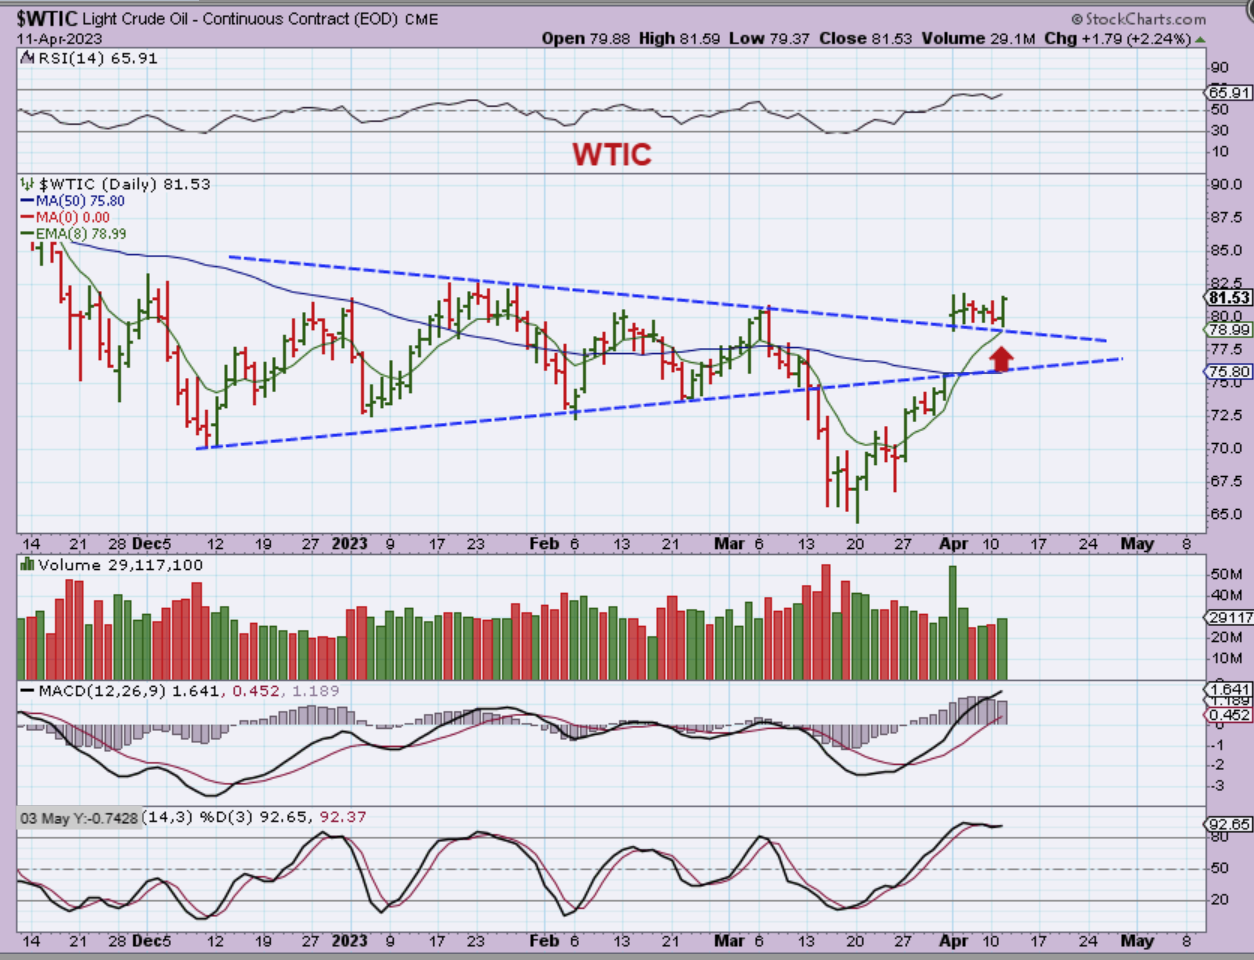
WTIC – AFTER OIL GAPPED UP WELL OVER THE 50SMA AND MY WEDGE, IT MOVED SIDEWAYS TO CONSOLIDATE THE GAINS. Reaching the 8 ema yesterday, it reversed higher and looks ready to move up again.
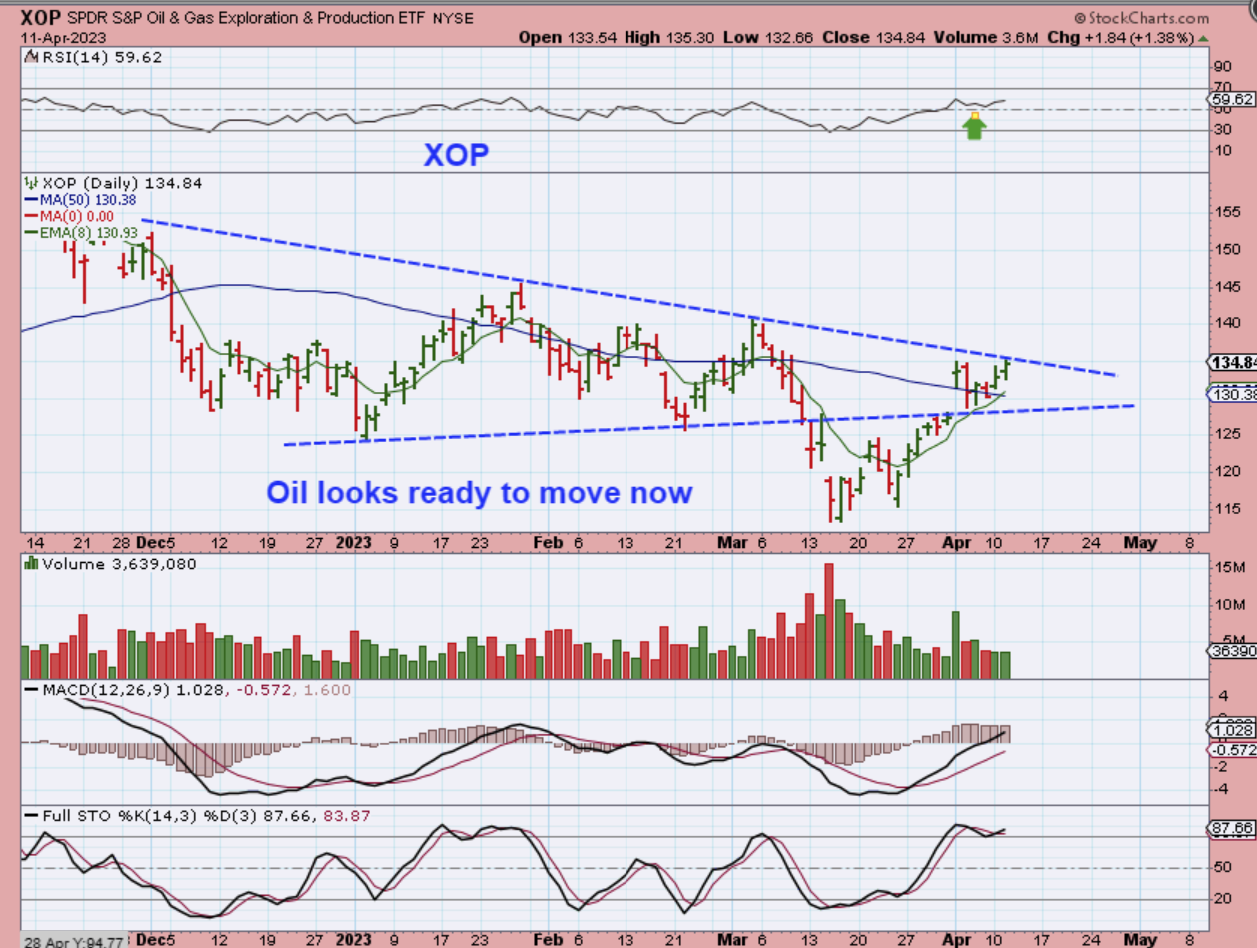
XOP – If Oil is ready to push higher, it may help the XOP to break out from the downtrend too. This reflects the GUSH trade from 2 weeks ago too, which was the Buy at the higher low reversal. So far that trade is working out well, up roughly 40%.
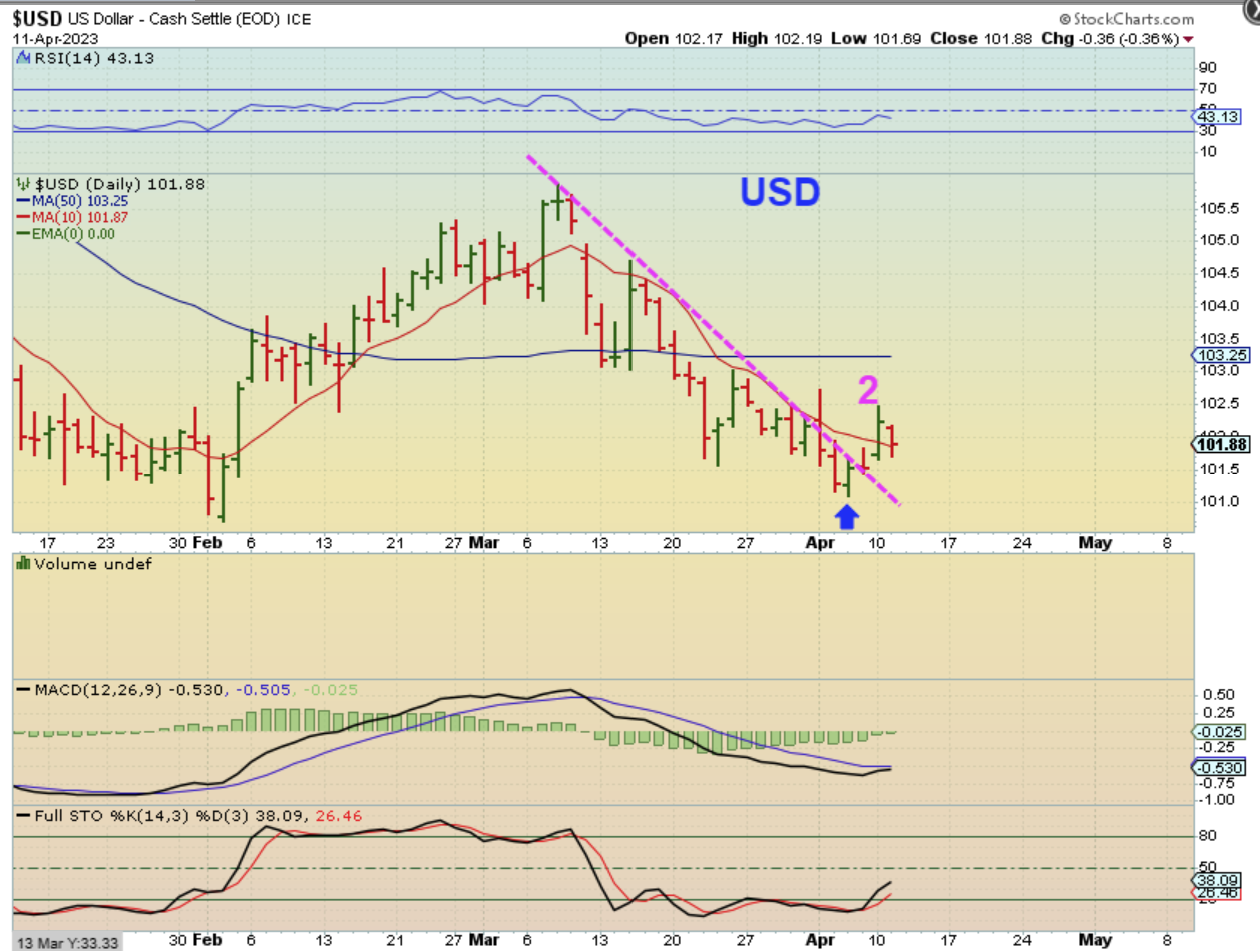
The USD is on day 3 (day 4 using a continuous price charting service). As things stand right now, if the USD goes higher, Gold and Silver seem to dip lower. If the USD dips lower, they move higher. The CPI Numbers may affect the next move. On Tuesday the USD dropped, so…
;
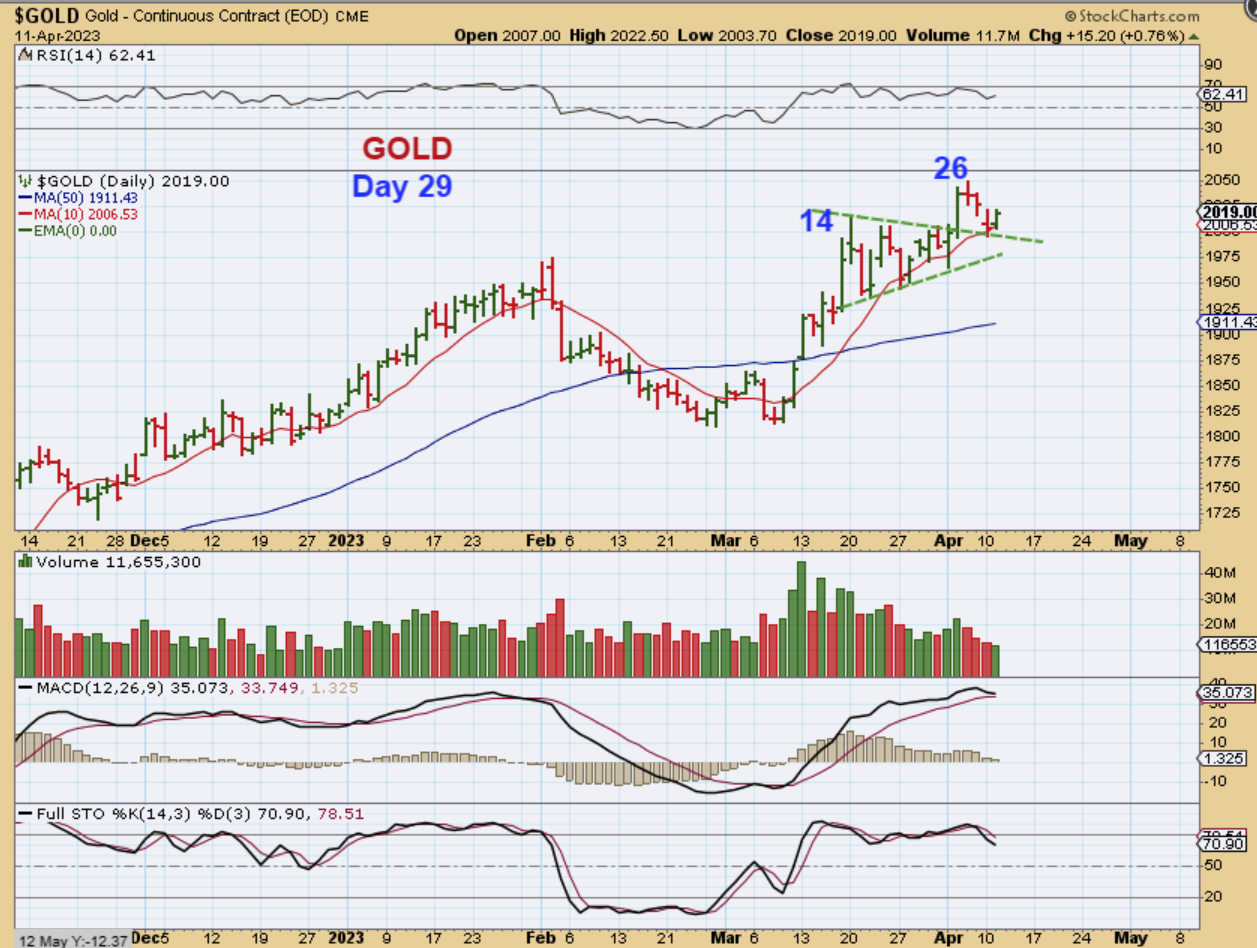
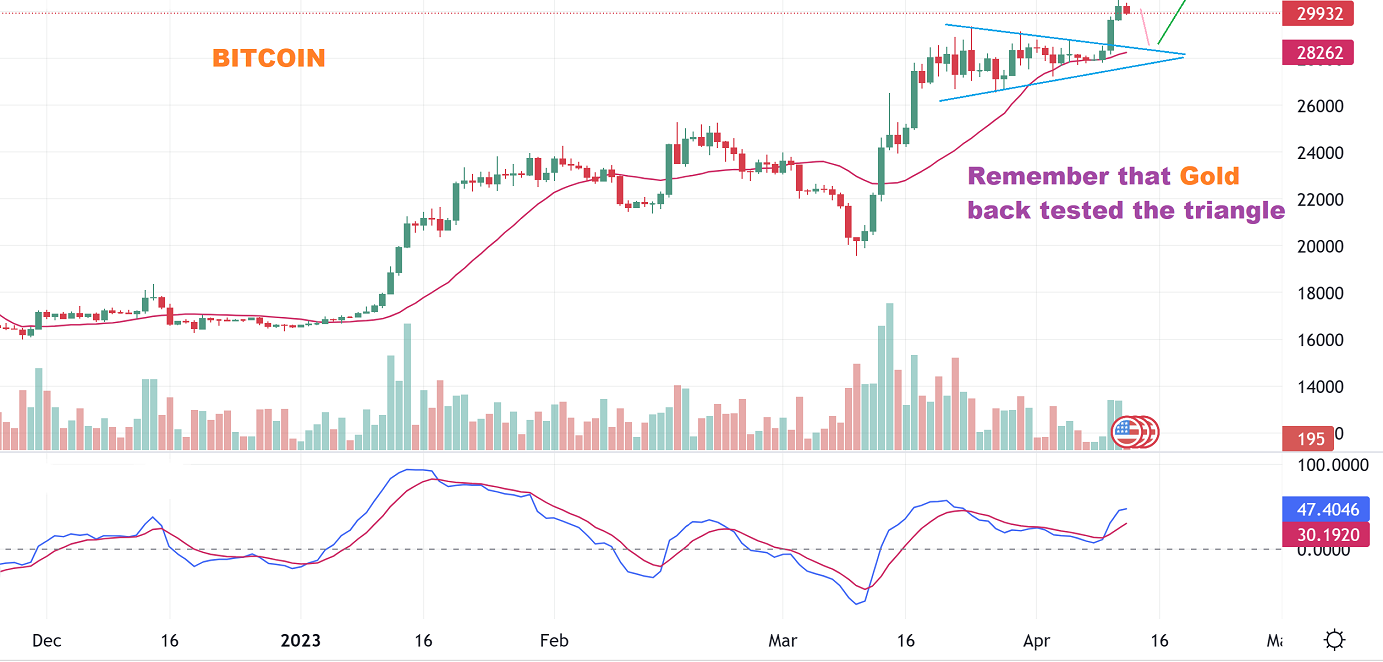
GOLD IS ON DAY 29 – On Tuesday the USD dropped, so we saw a reversal at support for Gold. This is a back test of the triangle and the 10sma so far. Gold is actually due for a dcl at this point (Often around day 32 or so) and it has a day 26 peak (Right translated). CPI can affect Gold.
.
That first run for Gold out of the ICL was one that did not dip deep at DCLs.
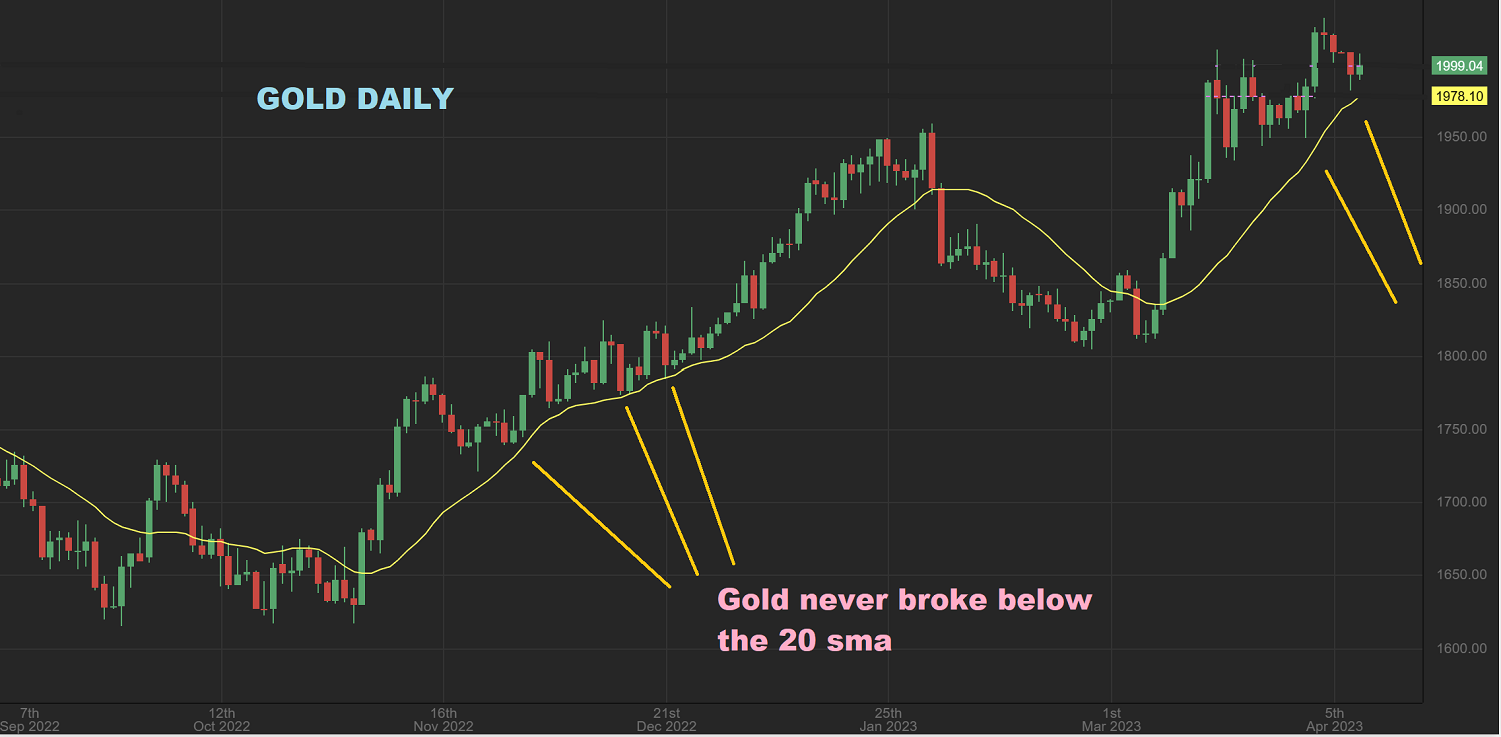
In fact, it was very hard to identify a dcl on the run, right? This was a strong yet choppy run. While looking back, I thought that it was interesting to note that Gold did not break down below the 20 sma, even when it was seeking out a dcl, until we got to that deeper sell off. My point? We are due for a dcl now, but we may not even break below the 20sma.
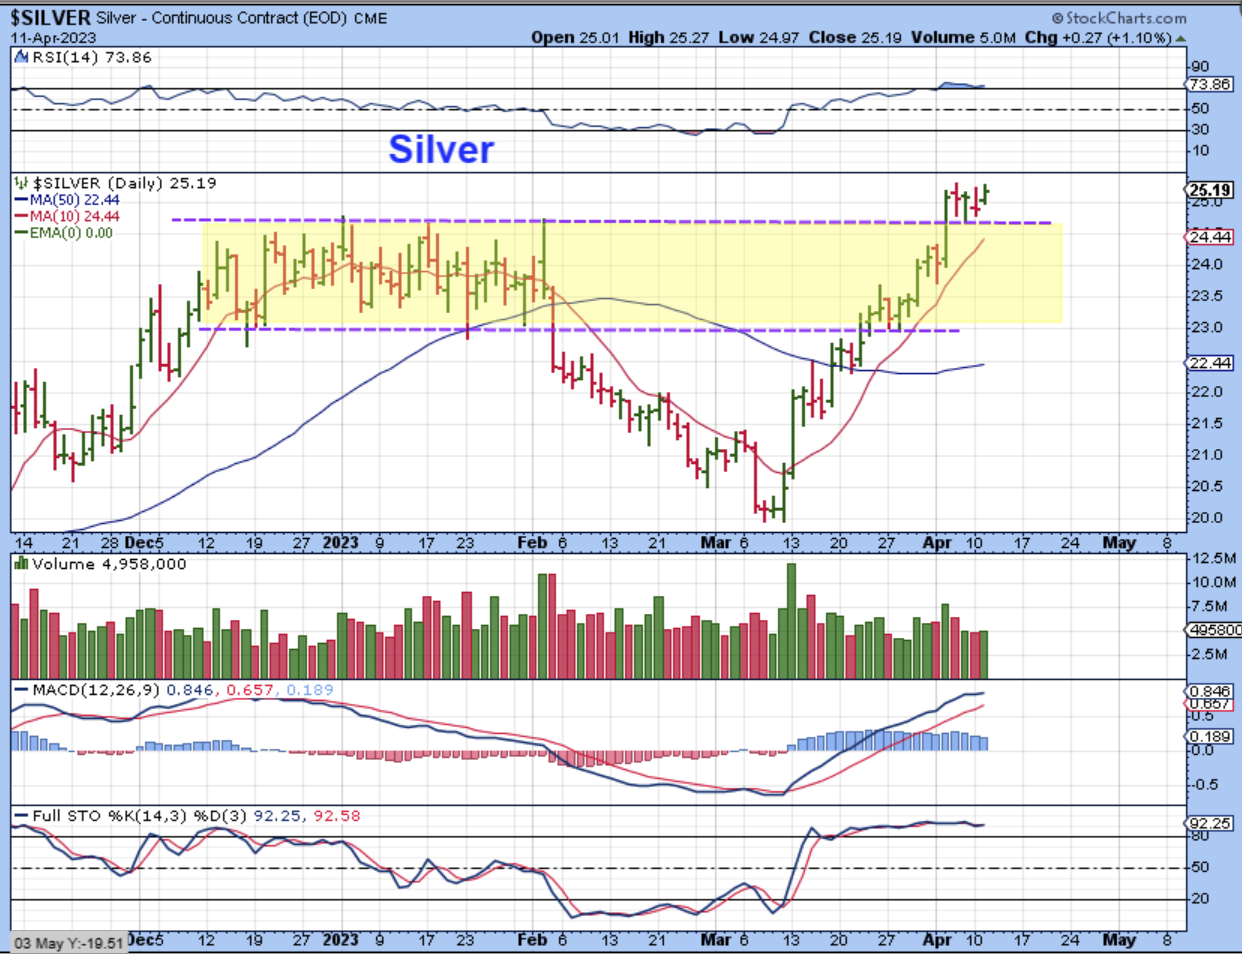
SILVER has been chopping sideways as the USD put in a dcl. So far it is riding above that yellow support area. Notice that on this steeper run, Silver went up, sideways, up, sideways, up and now sideways. You were told to buy at the 50sma, since Silver was lagging Gold. Now Silver has caught up to Gold run to former highs.
.
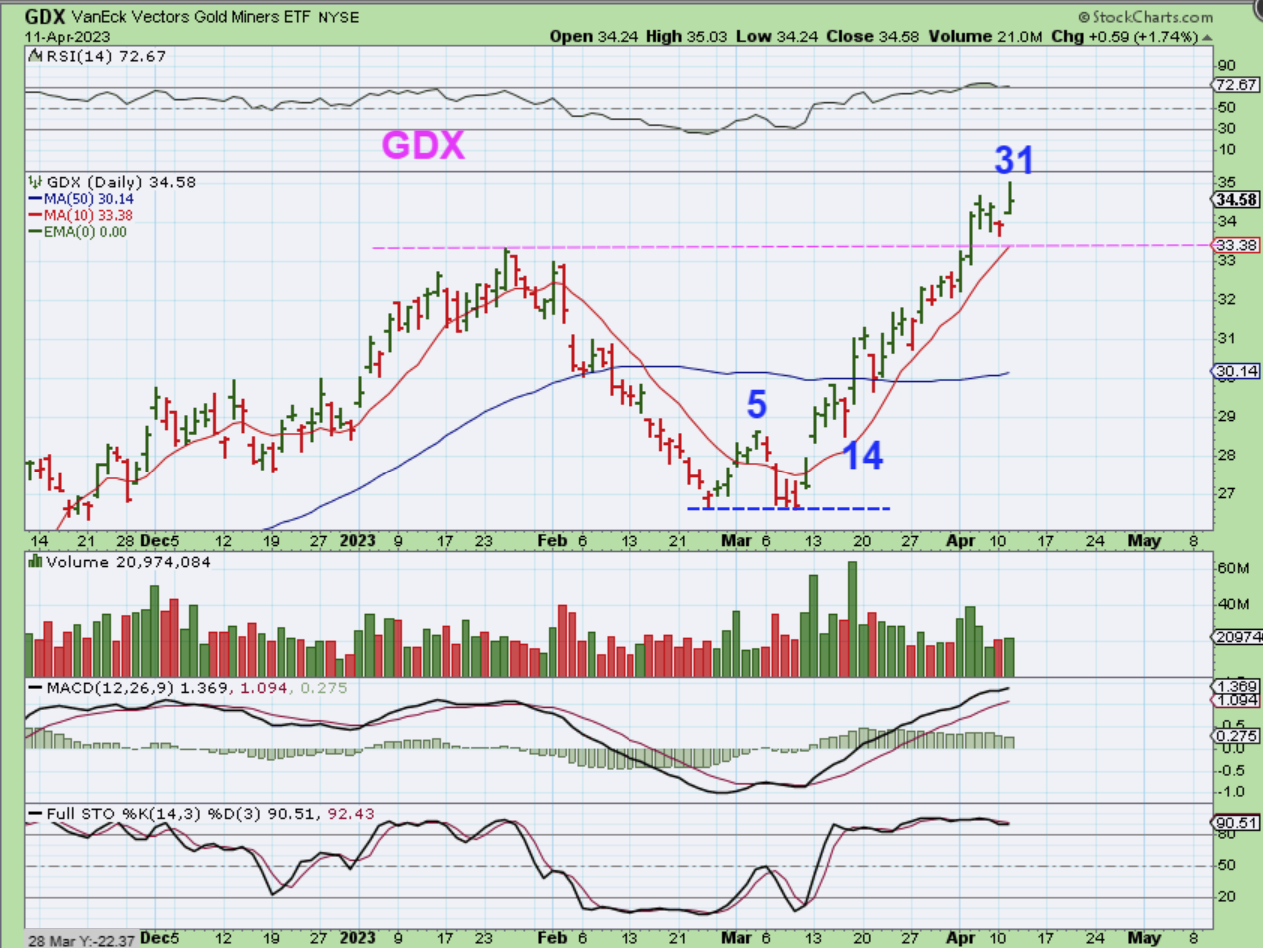
THE GDX ETF broke to a slightly lower low in March, but I am still following the Gold cycle count, so GDX made a new high on day 31.
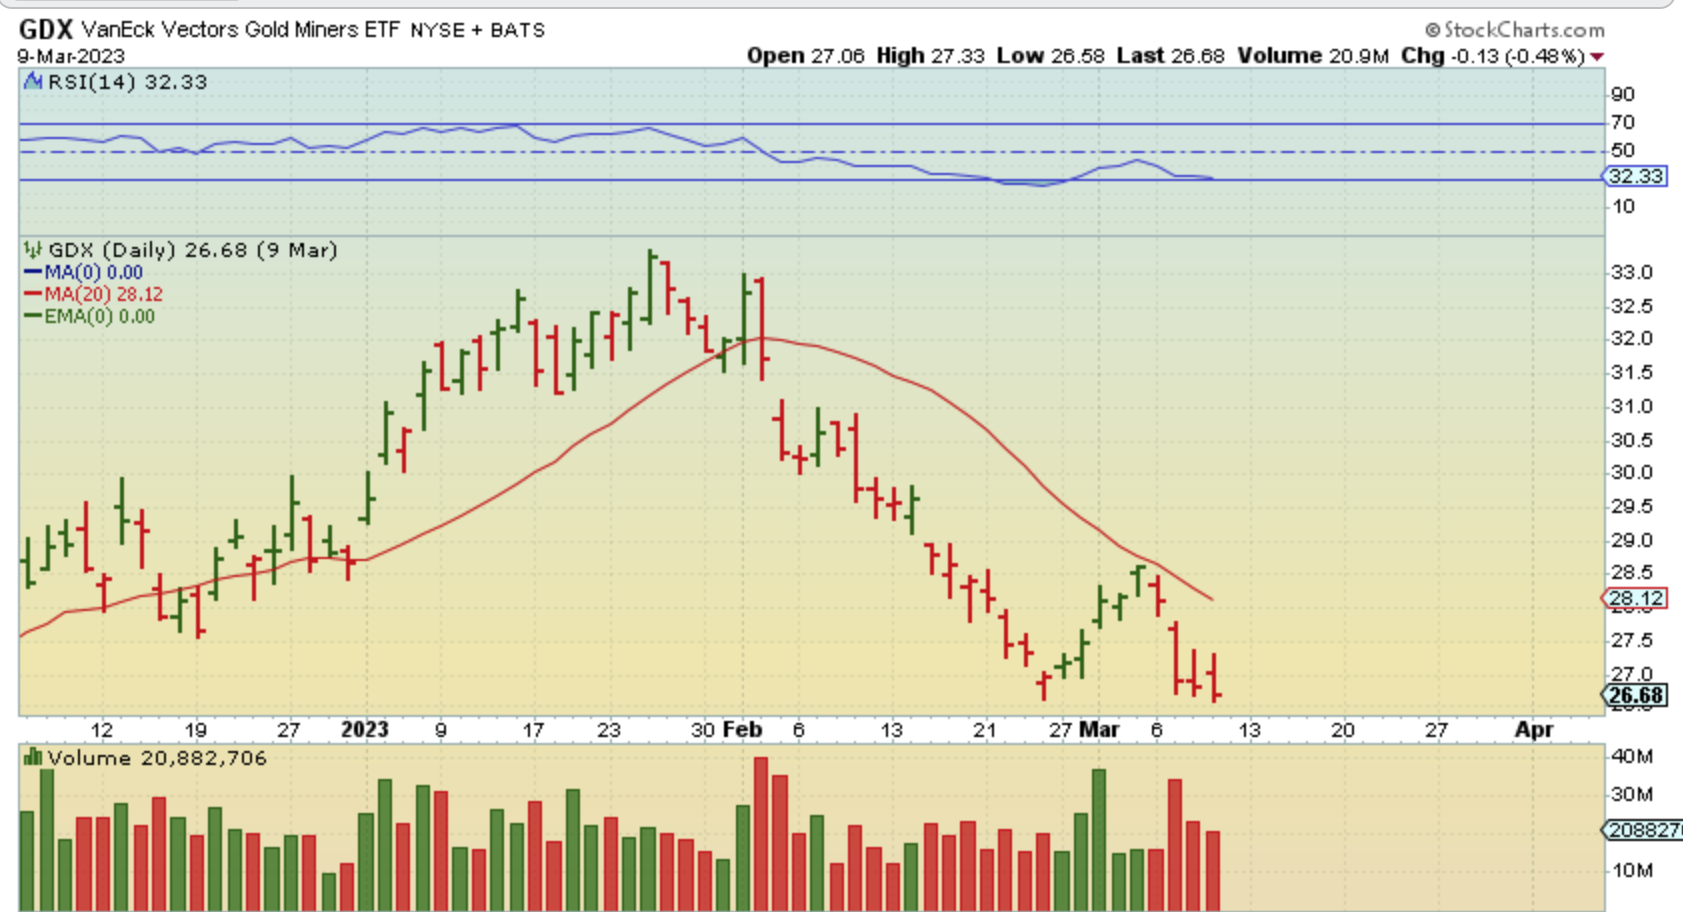
I want to remind everyone that this was The GDX ETF dropping into what was to be an ICL 1 month ago. As you can see, the drop was relentless and we saw red day after day after day at one point. I got emails saying that some wished they sold everything to start over at the next low and then…
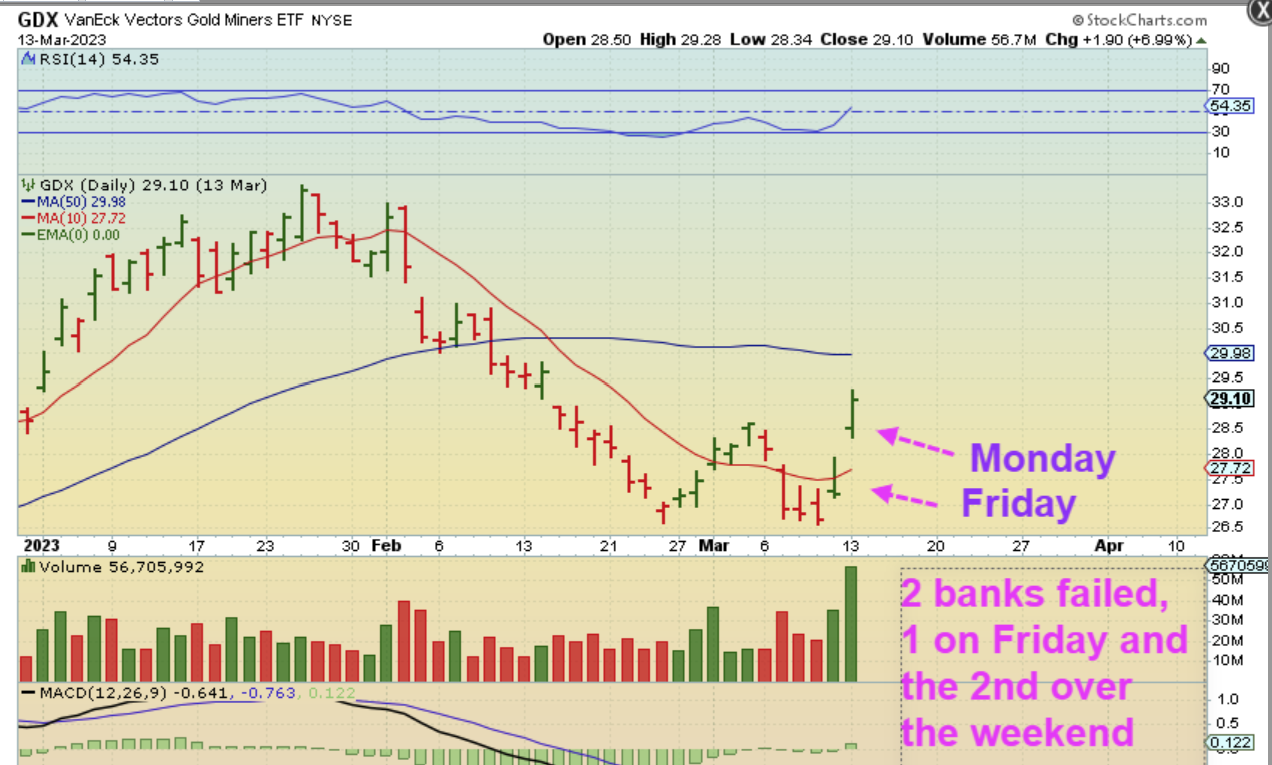
Gold and The GDX reacted as a safe haven when 2 banks failed. At this point on that Monday, we had to wonder if this would be the lows or would that gap fill and selling continue? You could buy Miners, but this didn’t follow the normal rules for an ICL, so the signal for going ‘All in’ was not there.
.
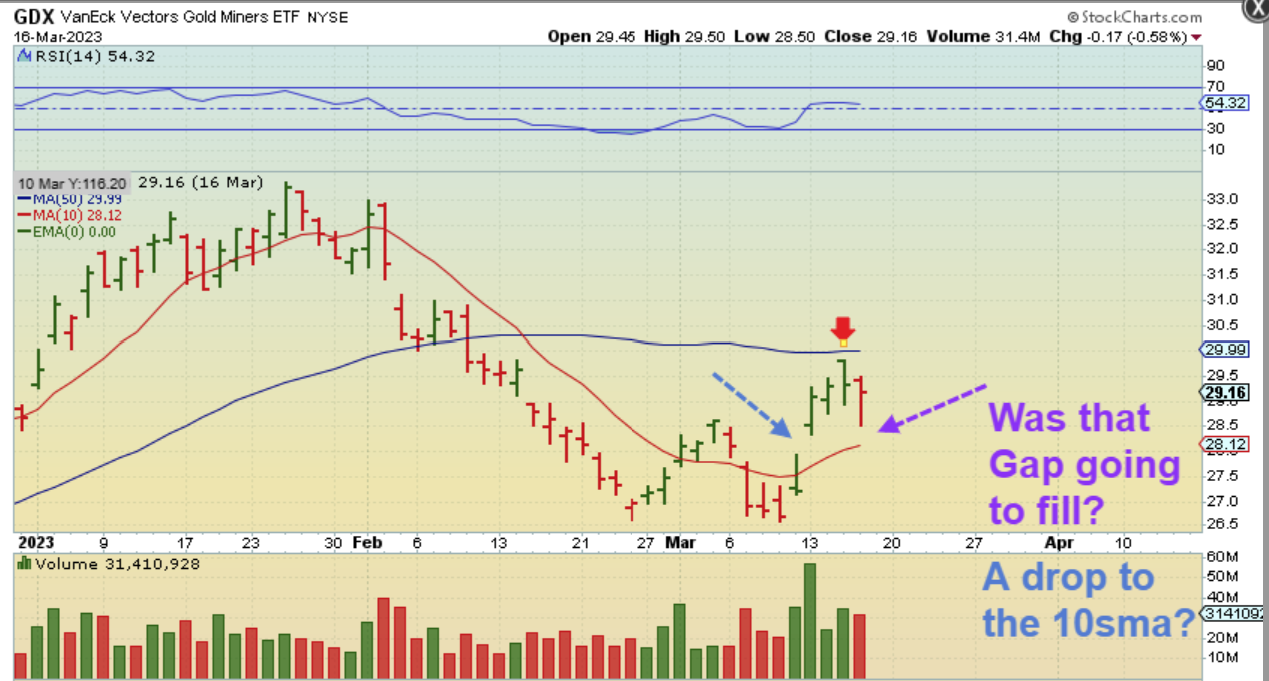
With Gold, I mentioned that it started to look like the ICL drop was cut short with the Bank Failures. When price was halted at the 50sma for GDX, it then looked like the gap might fill at the 10sma, but after this dip & reversal day, the sector took off higher.
Some traders actually did not sell their Miners heading into the ICL, and they were about to see Miners recover quickly. Those that did sell had to be willing to buy at or under the 50sma, and add as it progressed, so a few weeks ago I mentioned buying ‘lagging Gold stocks’ and especially Silver stocks, since they were still at the 50sma.
.
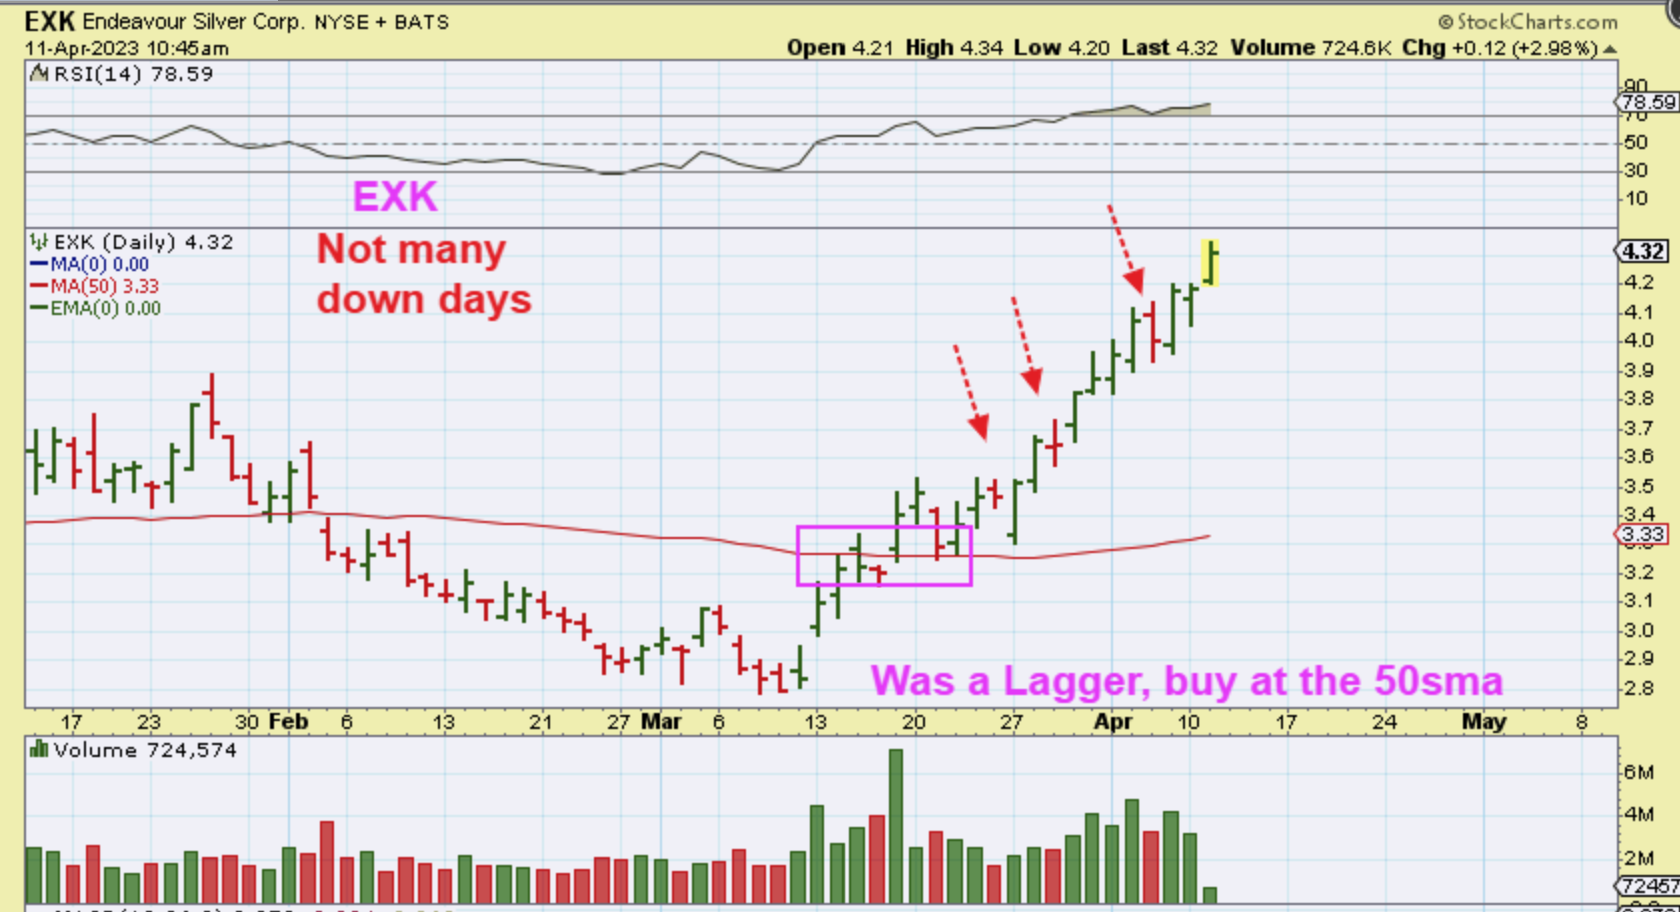
EXK – And ever since buying at the 50sma, you can see that some Miners have hardly had a down day. These red days that I pointed out were not big drops. This looks like a runaway move, similar to what we saw in 2016.
.
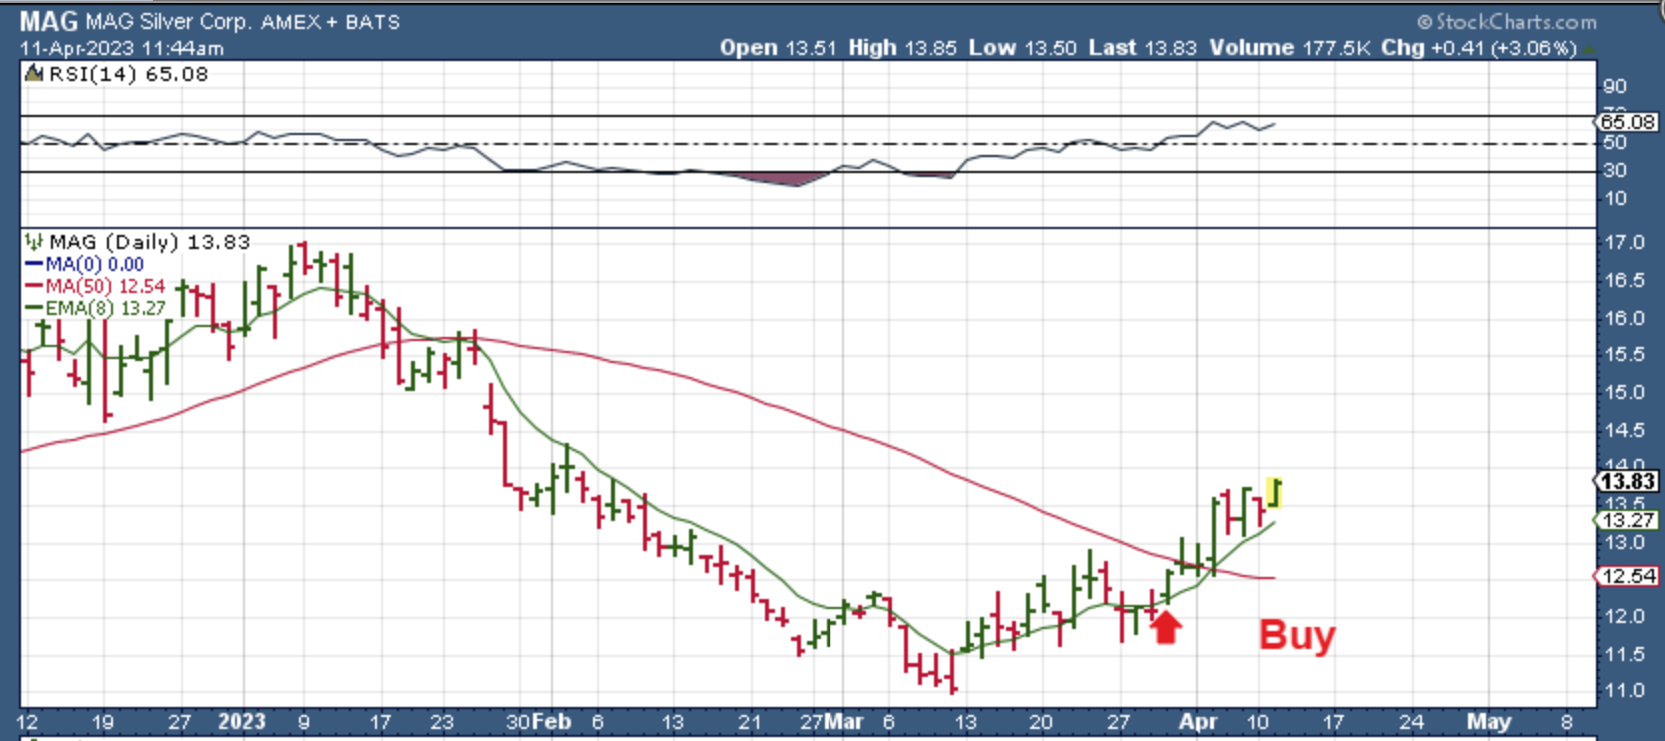
MAG -There are still some laggers, but they will eventually run back to the highs too, so adding now may be the last chance to do so.
.
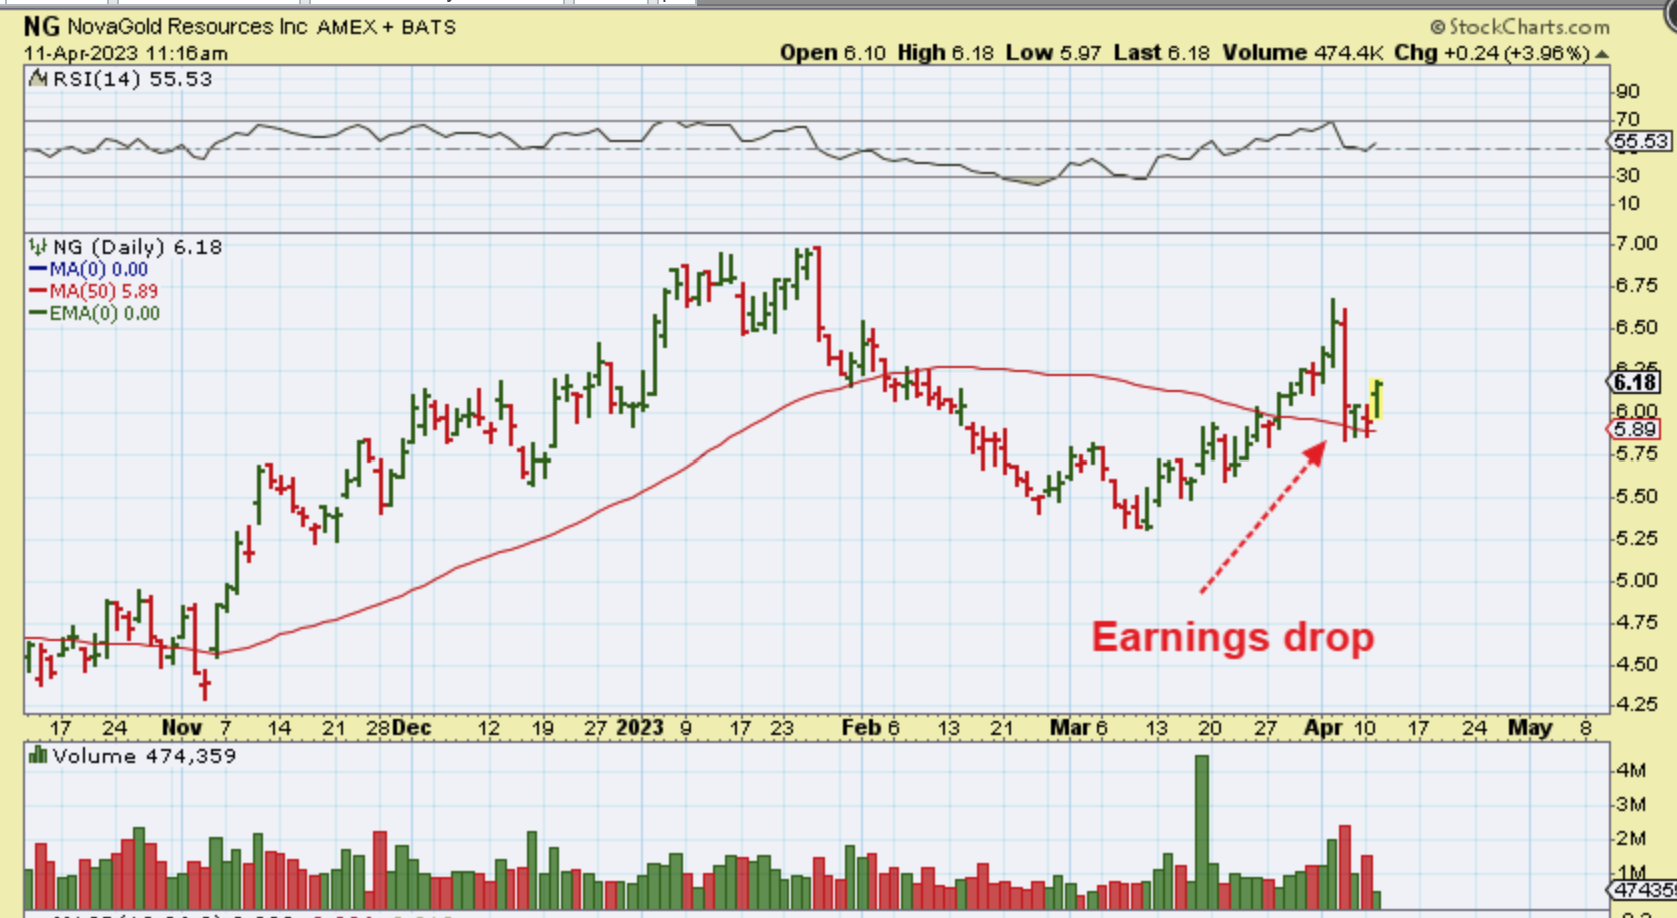
NG – Nova Gold got slammed down to the 50sma after their earnings report was released last week, but it did hold that area as support and is now trying to push higher. I think that you can buy this & add it to a basket of miners, using a stop under the 50sma.
.
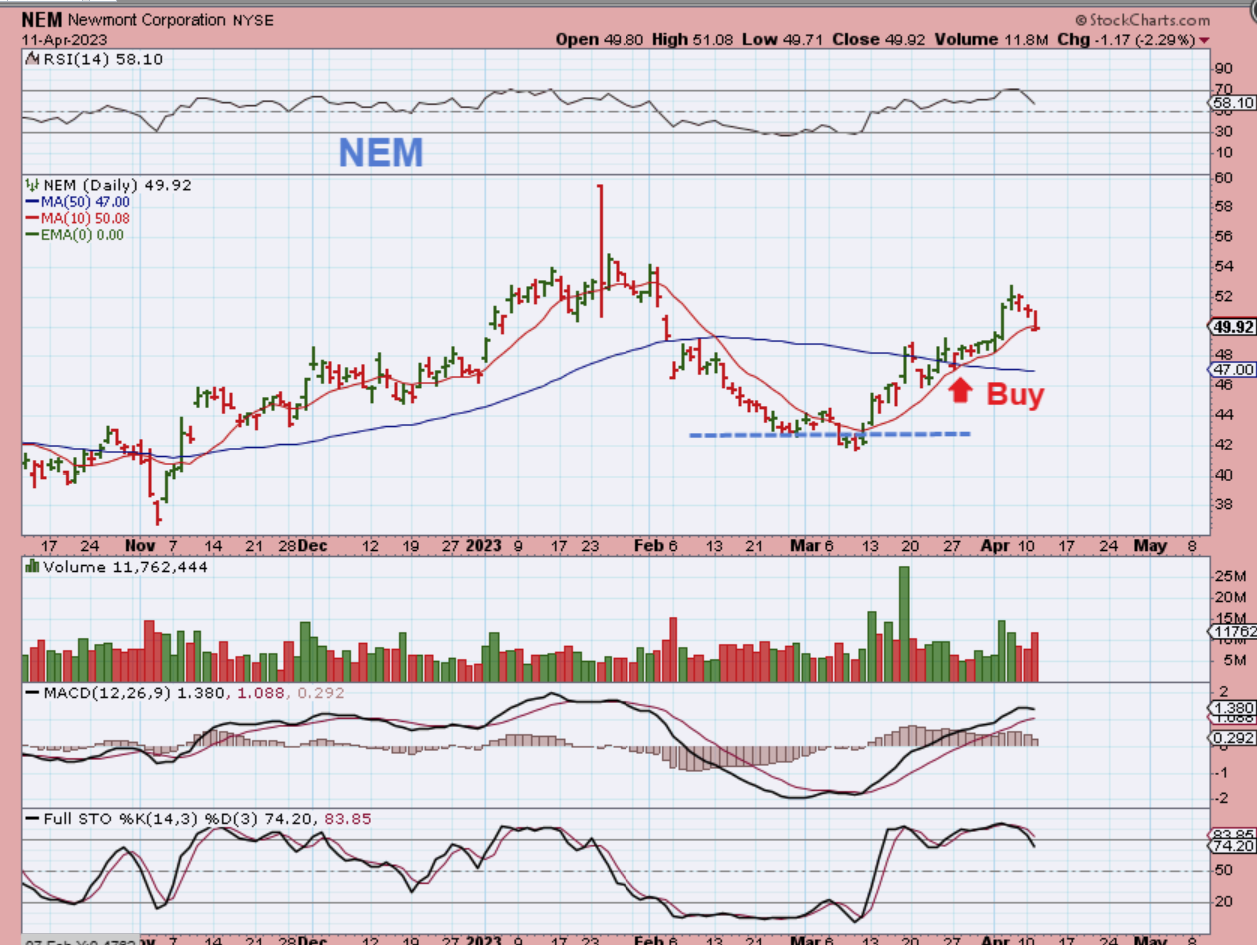
NEM – So you would have bought this lagger 2 weeks ago at the 50sma too. It ran higher last week, but has been dropping with Golds sideways move, so another buying opportunity here at $48 or $49.
.
The General Markets, Precious Metals, & now Oil & Oil Stocks continue to be bullishly set up. The USD is trying to bounce out of a dcl, so we can continue to look for pullbacks around support to add to Miners as the Dollar bounces. We will also have to wait and see what the CPI Numbers do to the USD and Gold. Enjoy your Wednesday trading!
.
~ALEX
.
BITCOIN broke out of the triangle that I have been pointing out and the Crypto Miners have put in some fast solid gains. It is possible that Bitcoin just keeps running, but if it dips back down like Gold did, a nice buying opportunity would develop in MARA, RIOT, HUT, etc again.
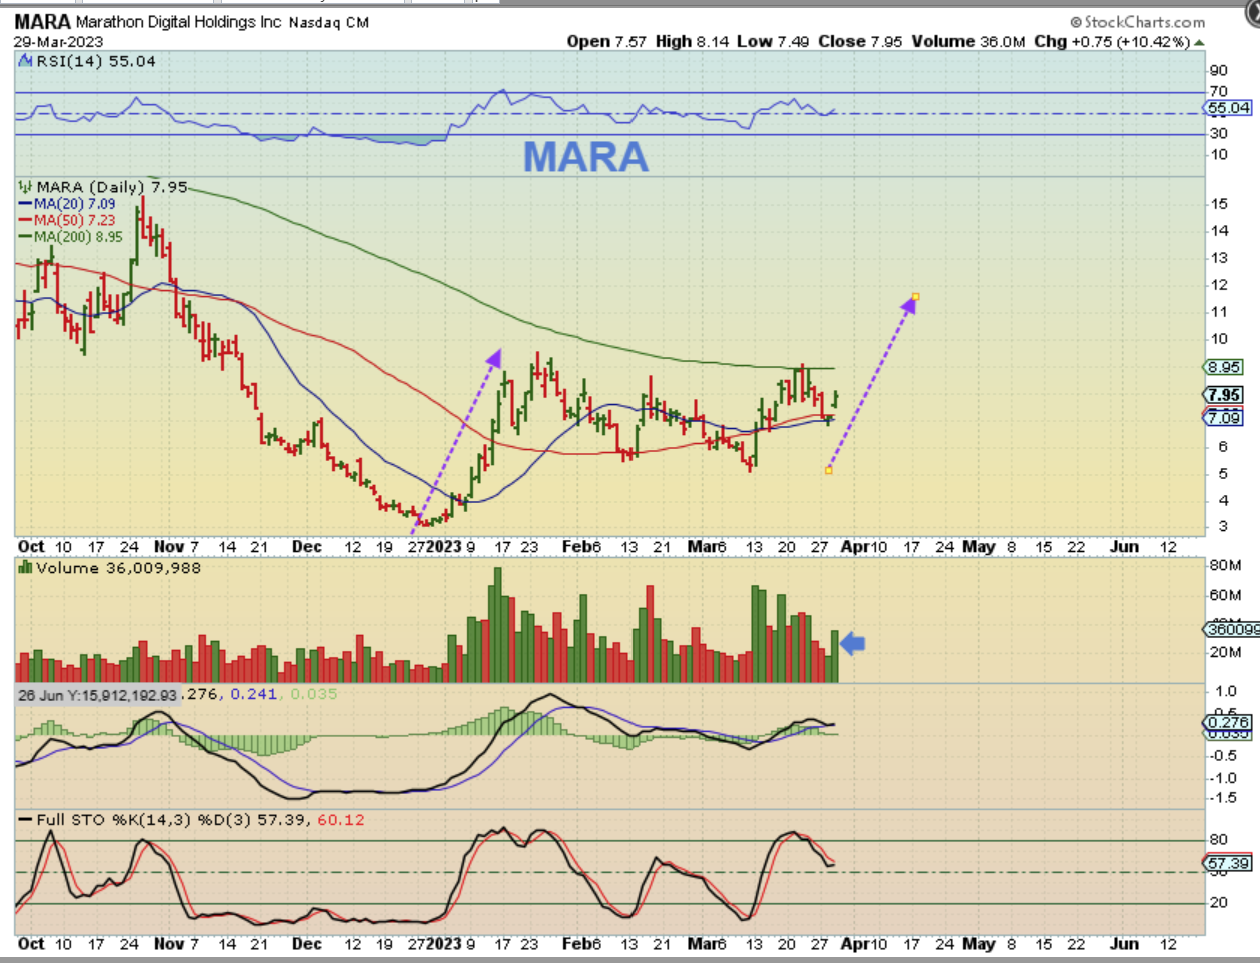
This was MARA under $8 when I mentioned that this consolidation was bullish and Bitcoin looked bullish.
I also used the long-term chart for MARA on that day. I said that price was pinched and crawling under the 200sma, and a breakout should be bullish for Mara longer term as well as short term.
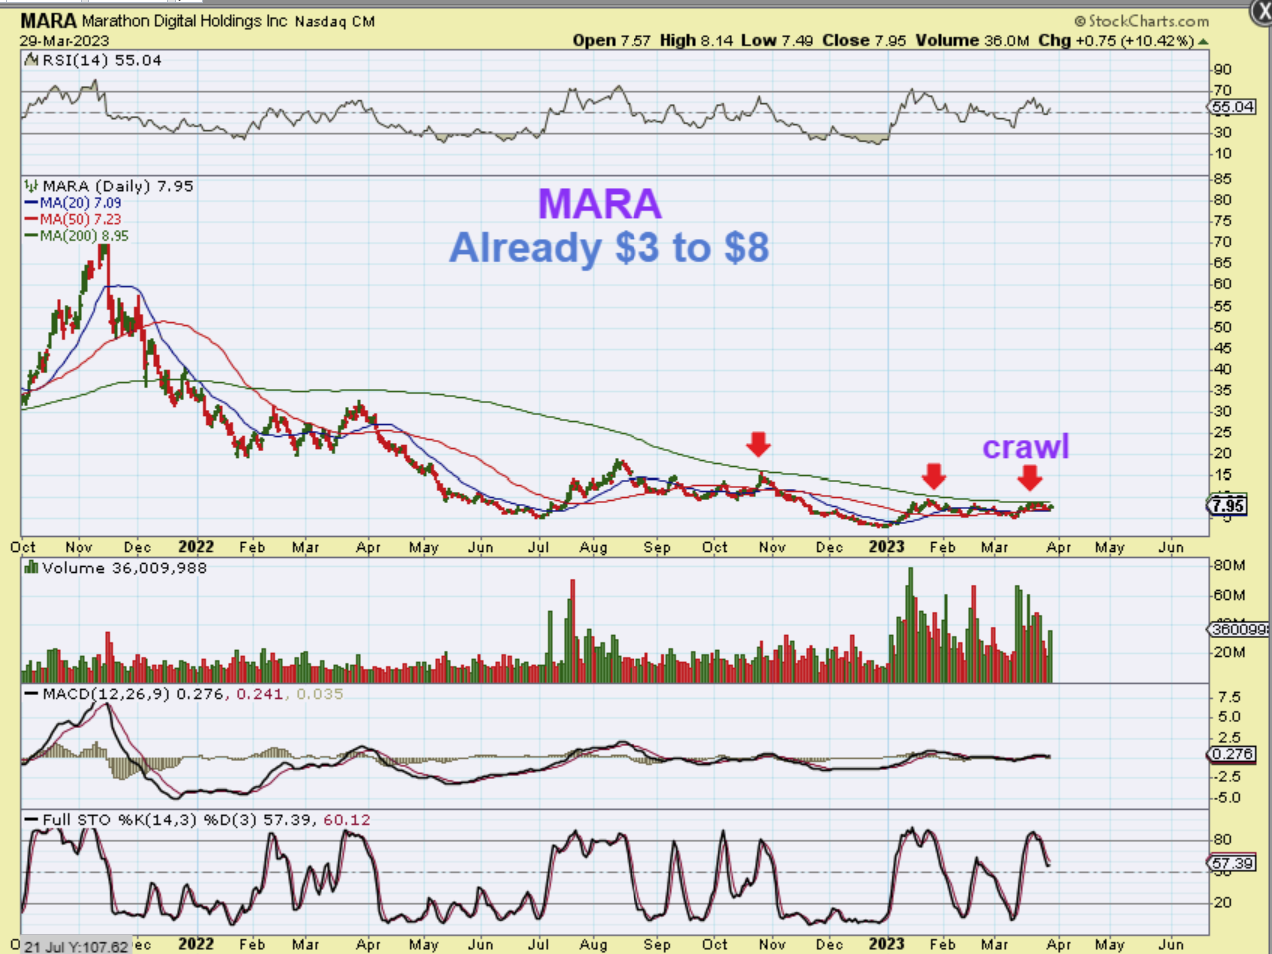
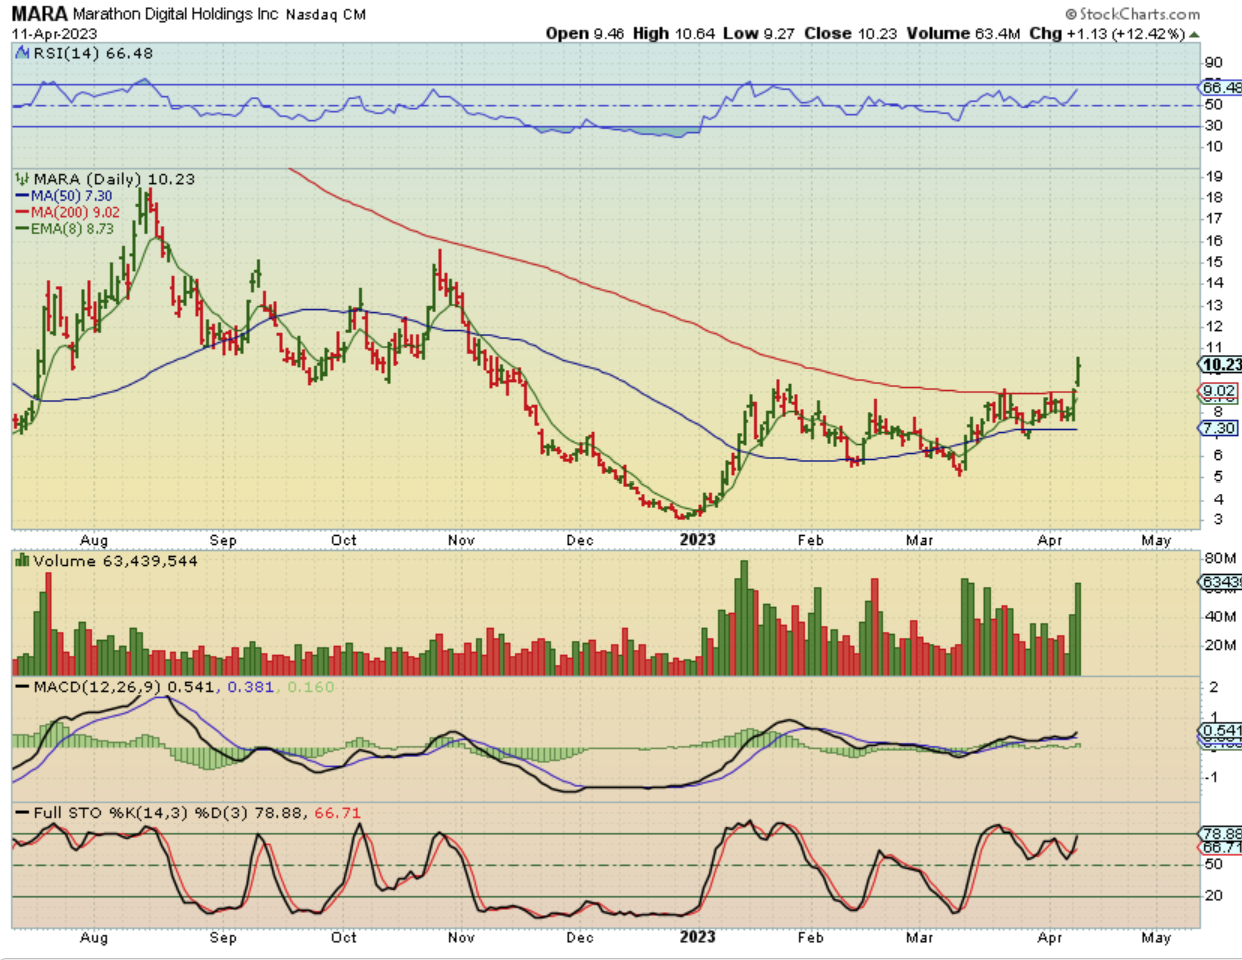
MARA broke out yesterday and the move has been $5 to $10 since those March lows. These are choppy and can be difficult to buy and hold, but the reward longer term is great. RIOT has actually been acting even better than Mara.
.
IN OTHER AREAS: Even with the General Markets heading back up near the highs, I’ve noticed that EV, CLEAN ENERGY, SOLARS, etc are still near the lows, as though they continued to seek out that ICL.
They are setting up a bounce with higher lows and might be ready to play catch up too, so let’s just look at a few charts. This may become the next area to trade, because these often make good gains too, if they can recover.
.
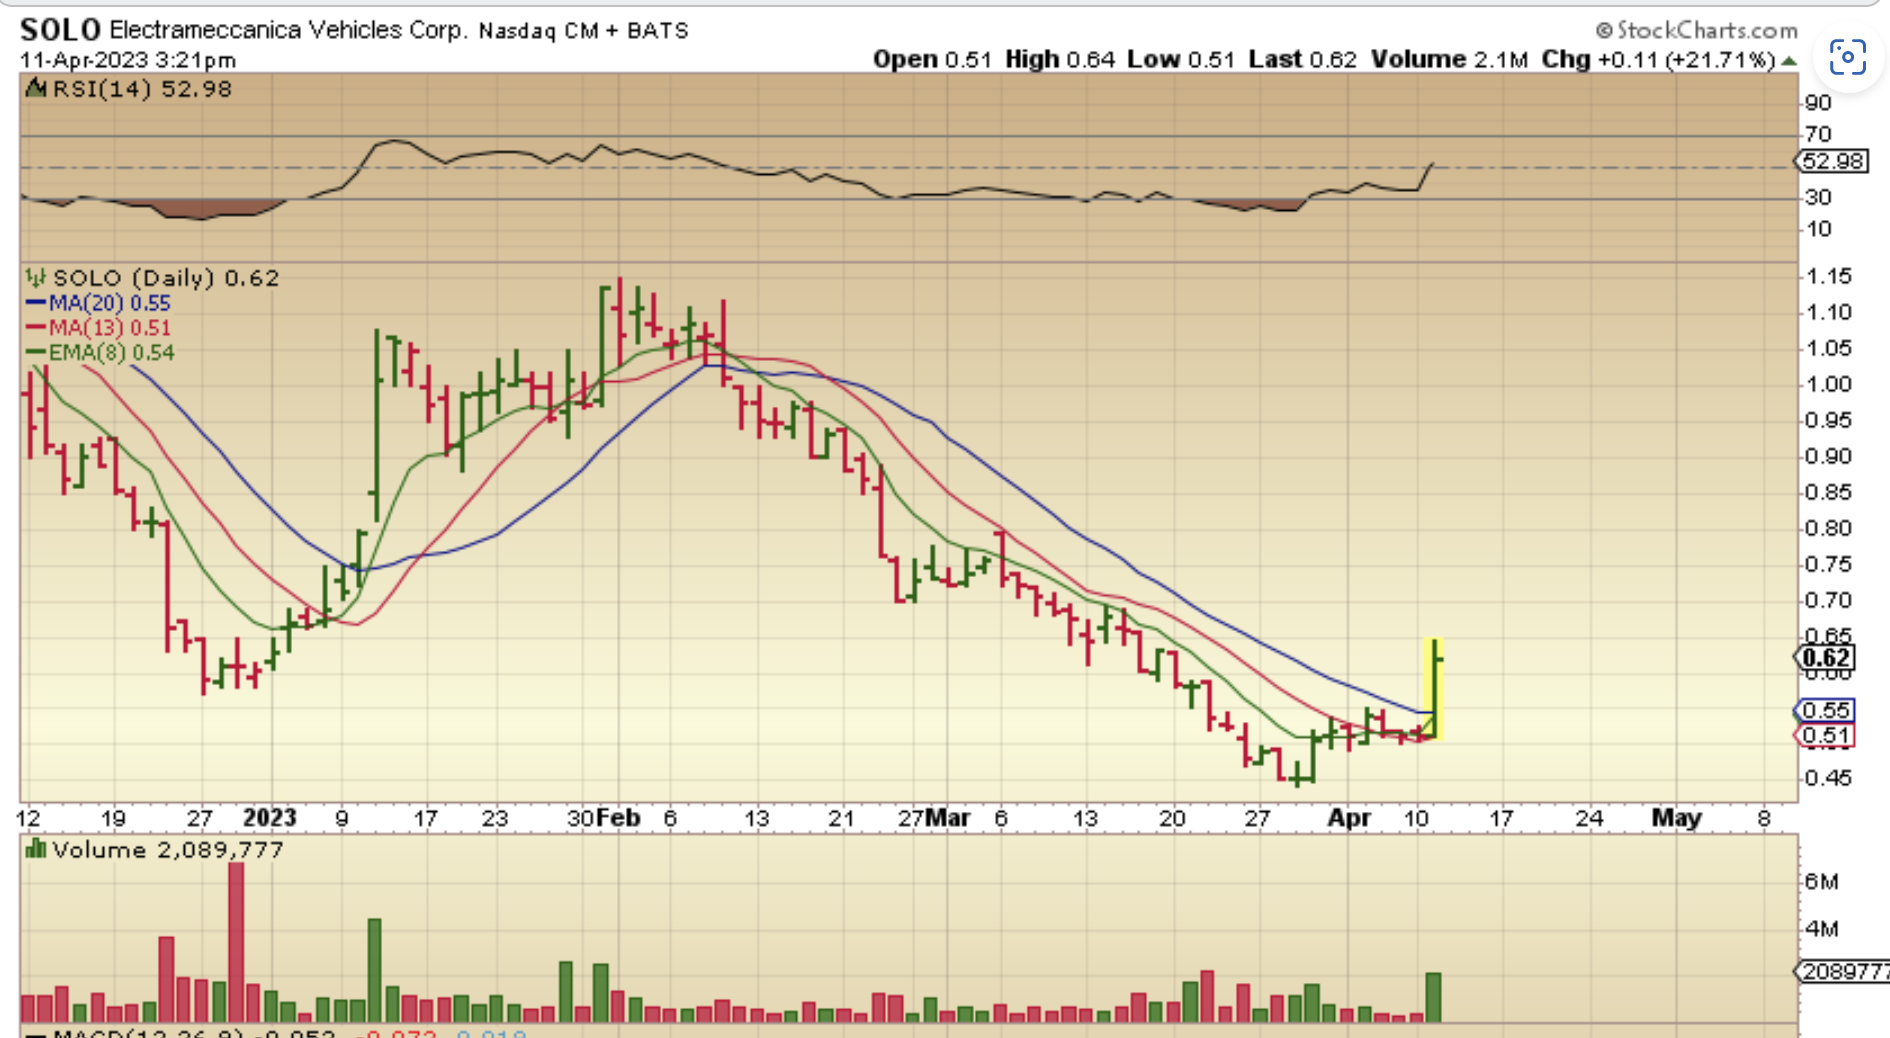
SOLO had a higher low and Popped 22% yesterday with some good news. Are other EV stocks forming bases or higher lows? Yes.
.
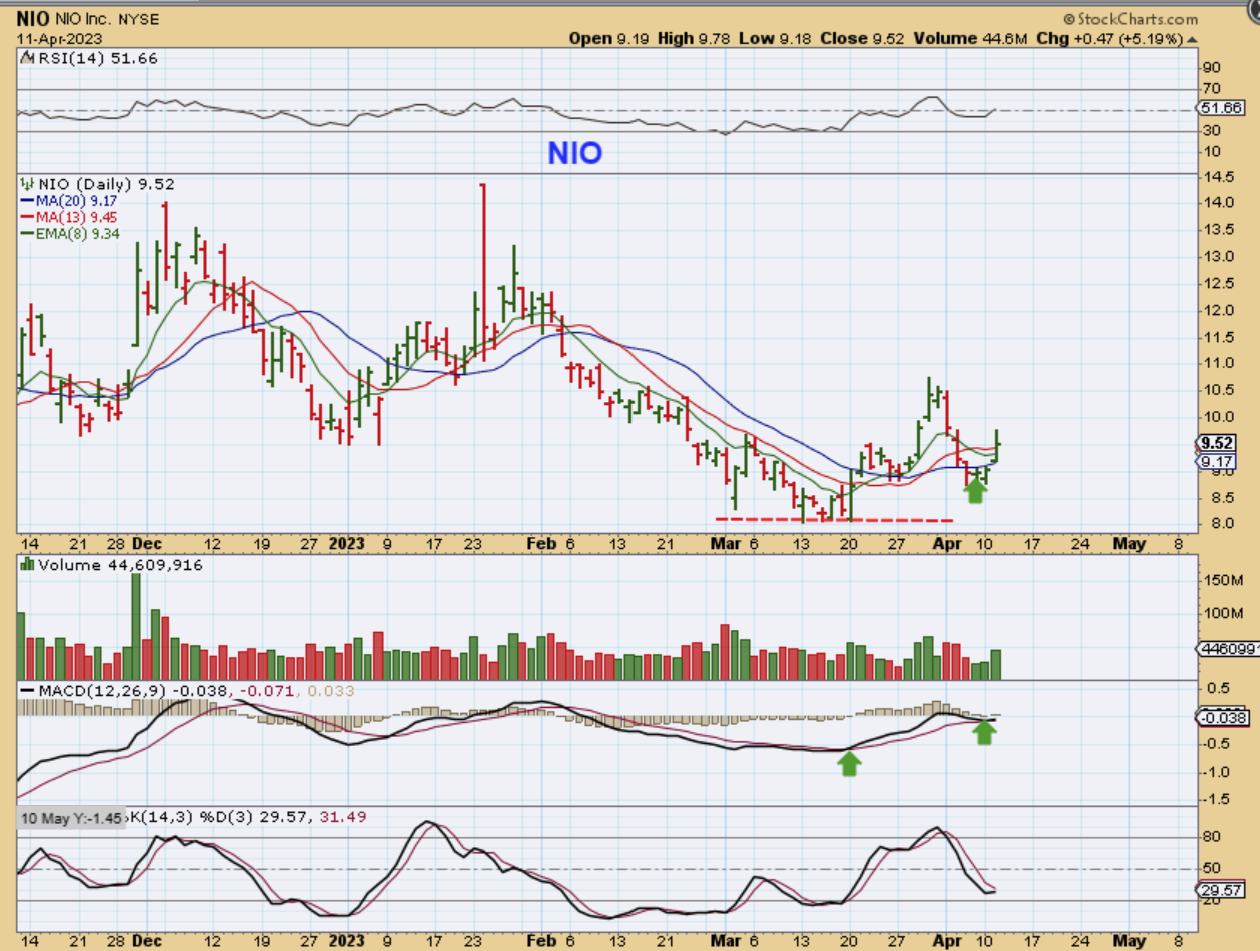
NIO is forming a higher low too. With the General Markets being set up bullishly, these may start to move higher and can be bought with a stop under the 2nd low. This first little pop was $8 to $10.50.
,
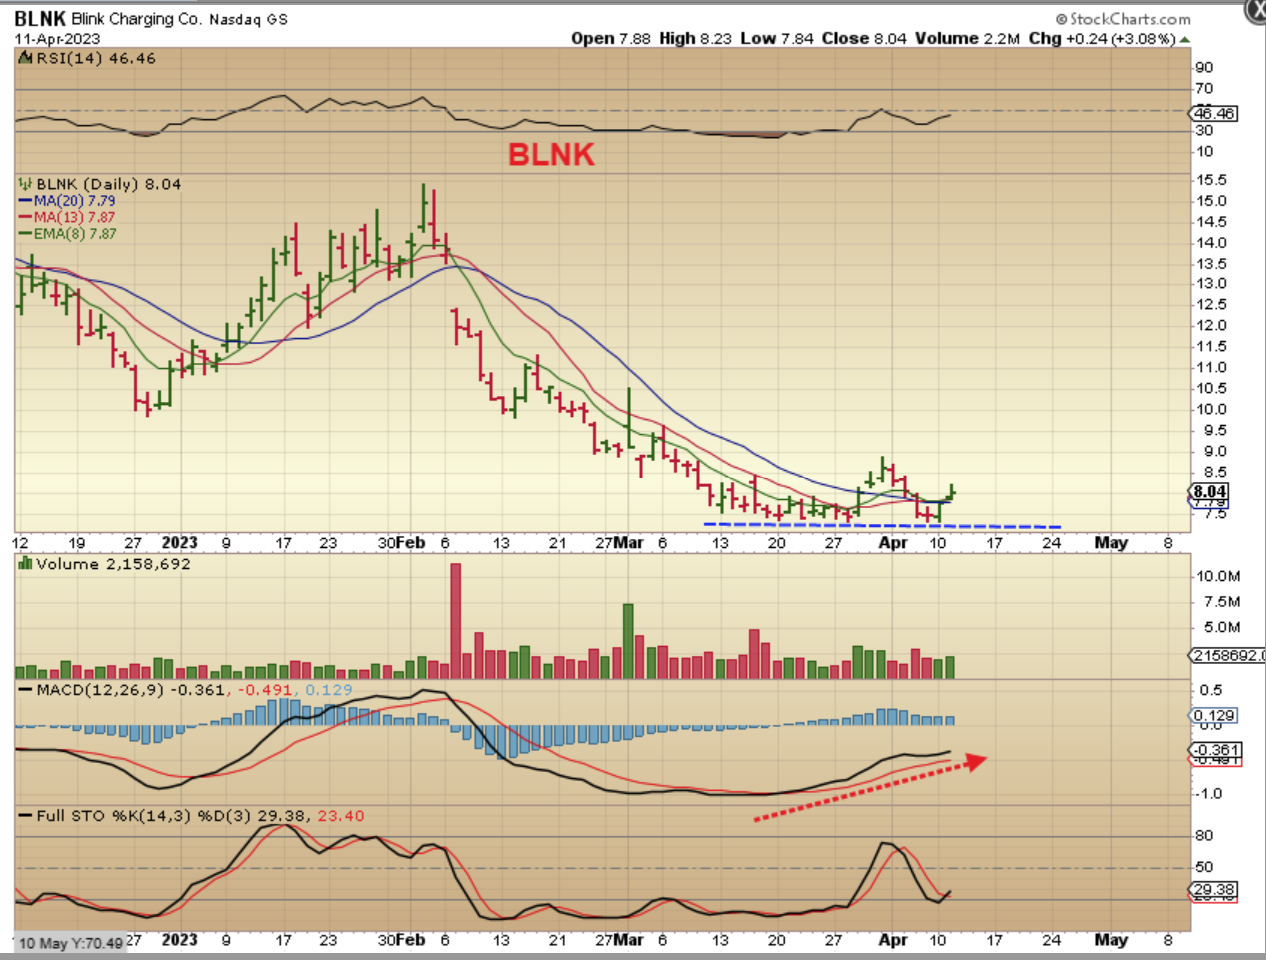
BLNK (Charging) – In January BLNK ran from $10 to $15, but got caught up in the sell off to an ICL. THESE are actually doing what I expected the markets to do when they sold off into an ICL. These really didnt react to the bank failures in a positive manner, but may be bottoming now.
.
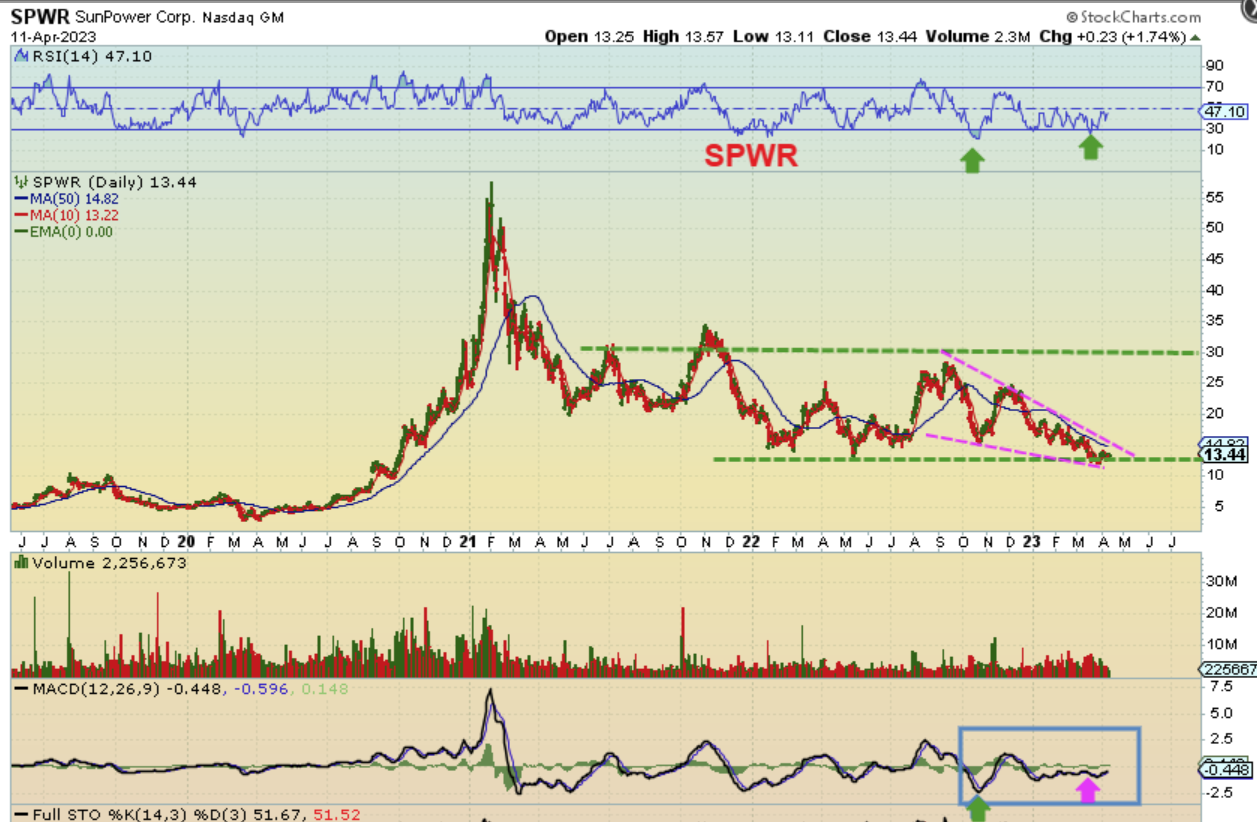
SPWR has a tendency to double from here over time. Many of the Solar stocks look to be bottoming very similarly to this chart, using a 3 yr chart. Companies like RUN, SOL, JKS, etc.