Tuesday April 18th – Picking the Fruitage
The DOLLAR is bouncing, so almost everything else was down at the start of the day, but as you’ll see, some areas clawed their way back to green again. On these smaller dips, the markets end up chopping sideways, but we can still look for buying opportunities too. I’ll discuss that throughout the report. Let’s get to the charts!
.
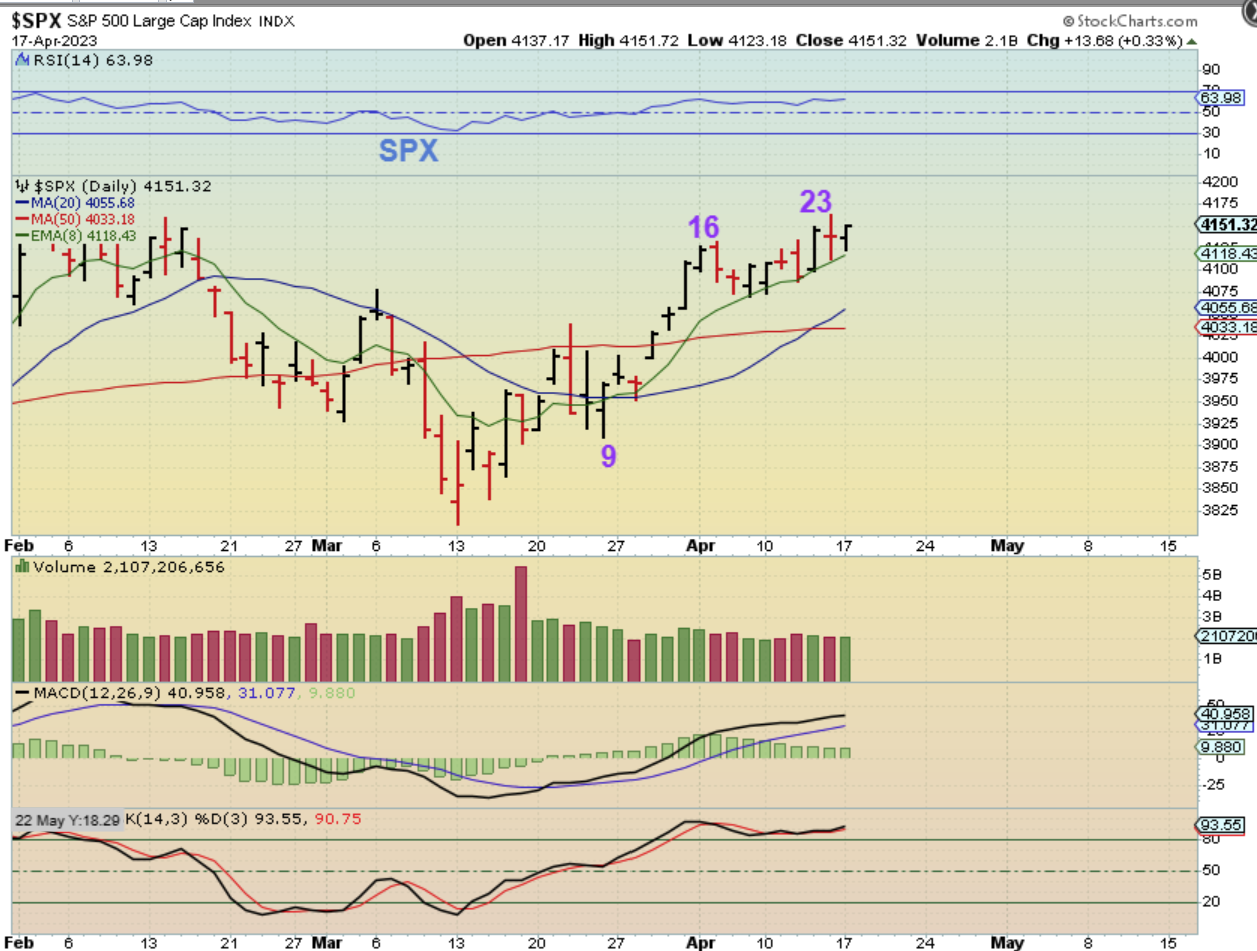
THE SPX sold off in the morning, but it was one of the areas that climbed back higher and closed green. Notice that the 8 ema is holding price so far. The NASDAQ, IWM, IBB, XBI, etc all closed green too, even with the USD up.
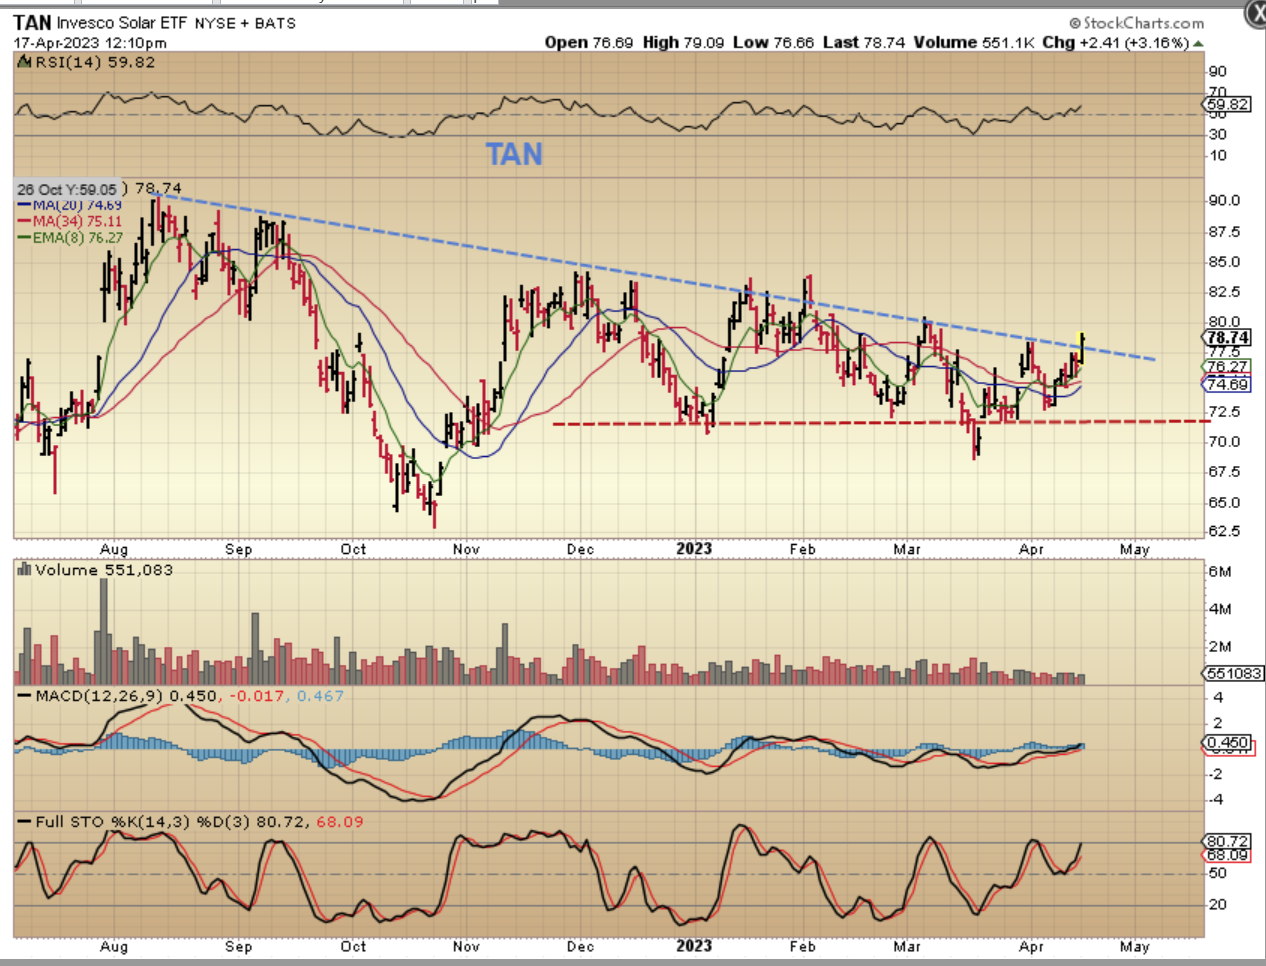
I want to point out again that the Solar Sector is bullish. I did have some of the Solar Stocks in a report not long ago, but they have been a little choppy rather than running straight up. Yesterday the ETF TAN started to break out from a downtrend as another buy opportunity. See the charts of SPWR, CSIQ, RUN, SOL, FSLR, ENPH, DQ, etc.
.
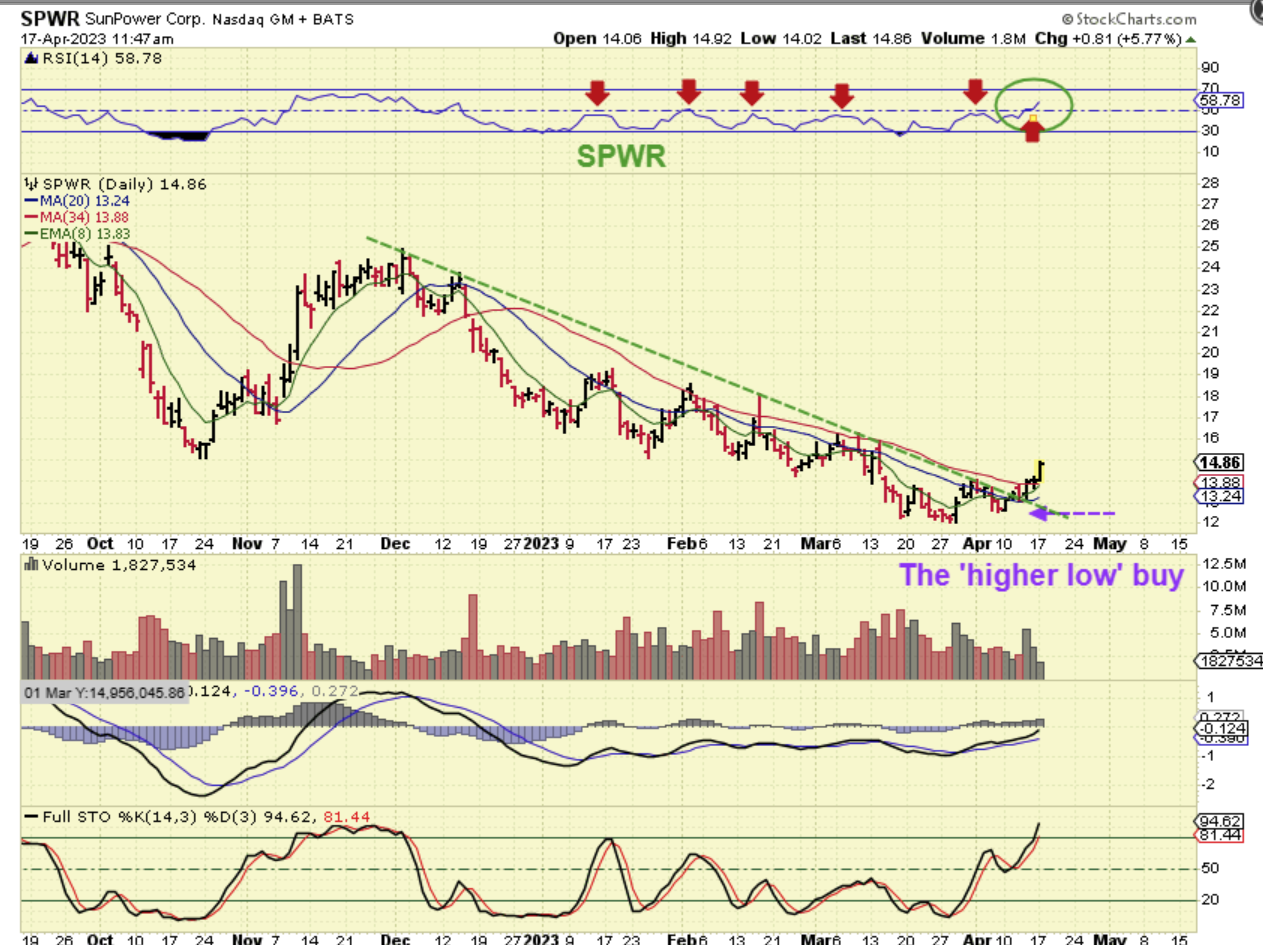
SPWR– On April 11 I used this chart to show the long term buy and hold with good potential. It was $13.44.
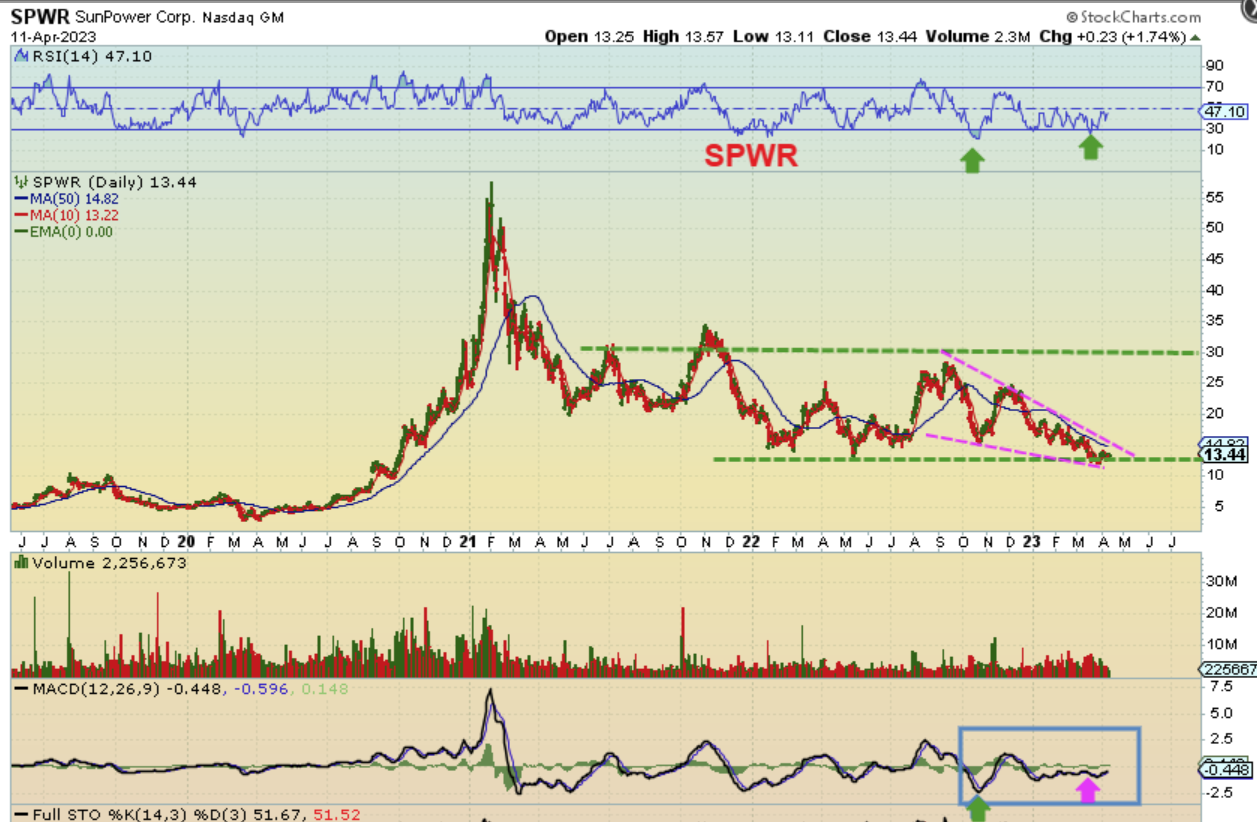
SPWR is a Solar stock that put in a higher low as a buy, and is now breaking the downtrend too. This is something to look for in this sector. Once these get running, they can move nicely higher.

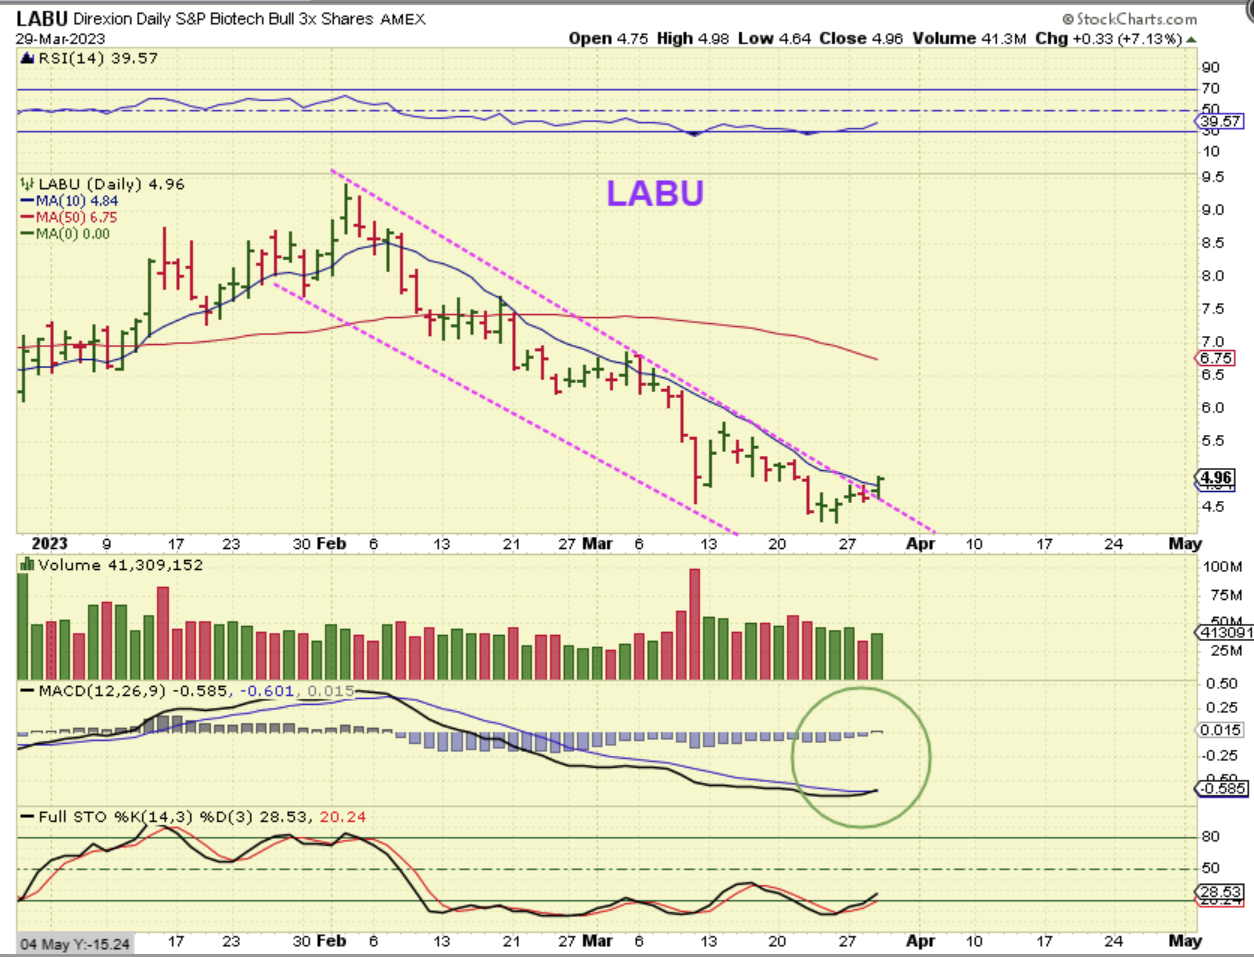
THE IBB and XBI are Biotech and they bottomed too, so LABU was in the report over 3 weeks ago. This was my LABU chart on March 29th showing a break of the downtrend as it bottomed with a MACD cross.
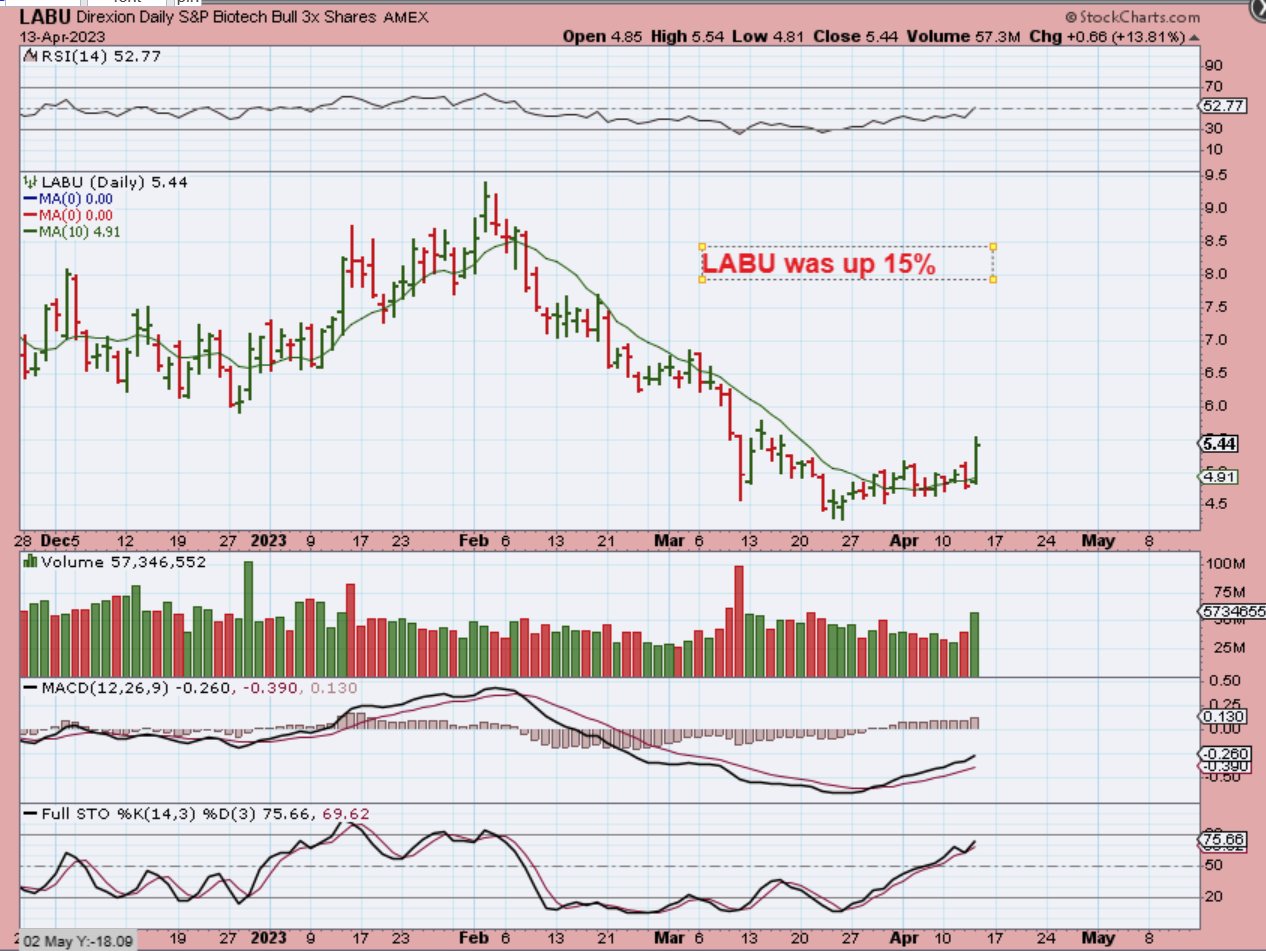
LABU was then in the report again on April 13th, since it went sideways and Popped 15%. This was last week and…
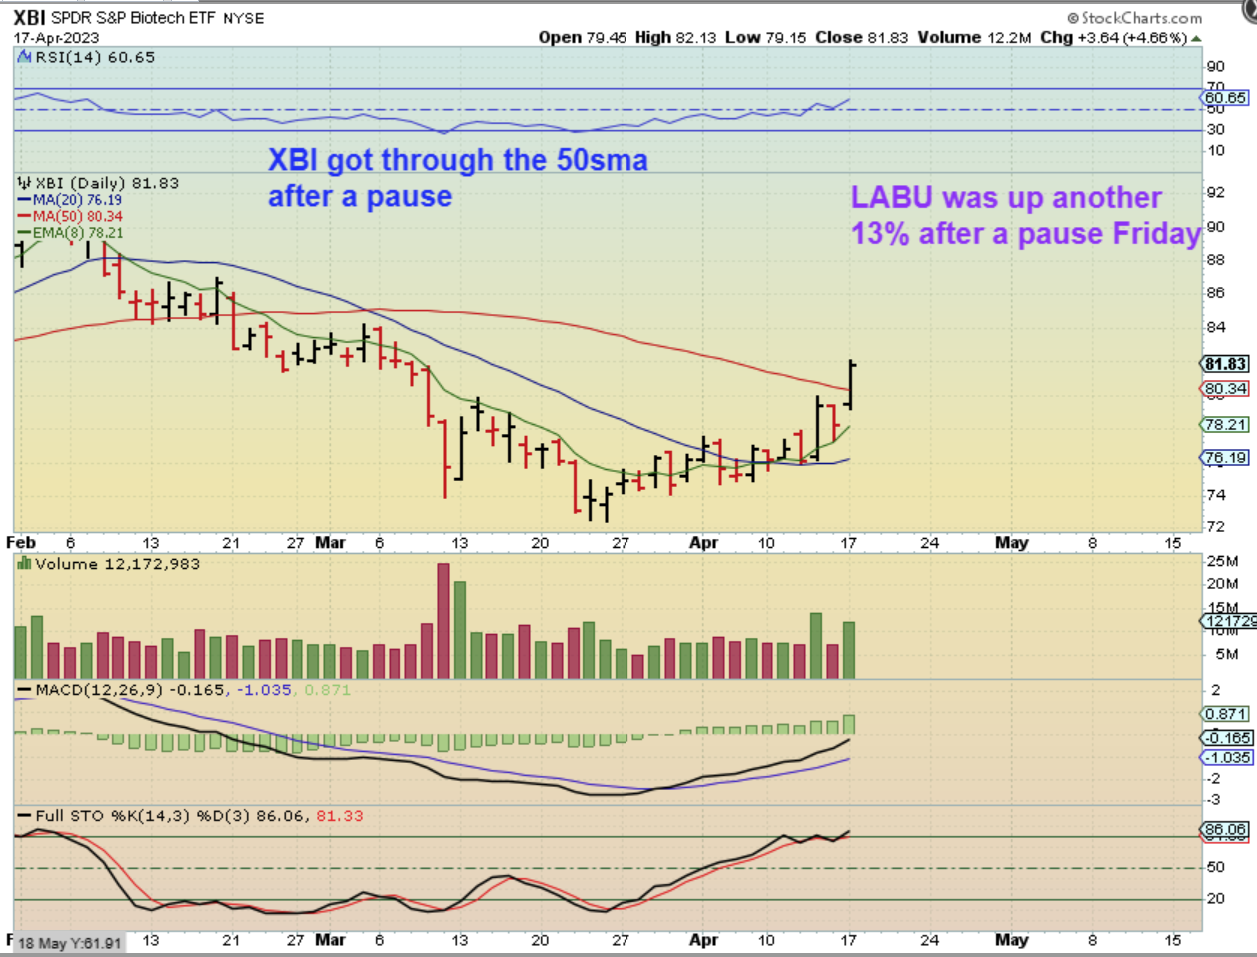
XBI Popped, stalled and Popped again yesterday, so the Biotech sector is Popping and continues to be making progress. The XBI broke through the 50sma.
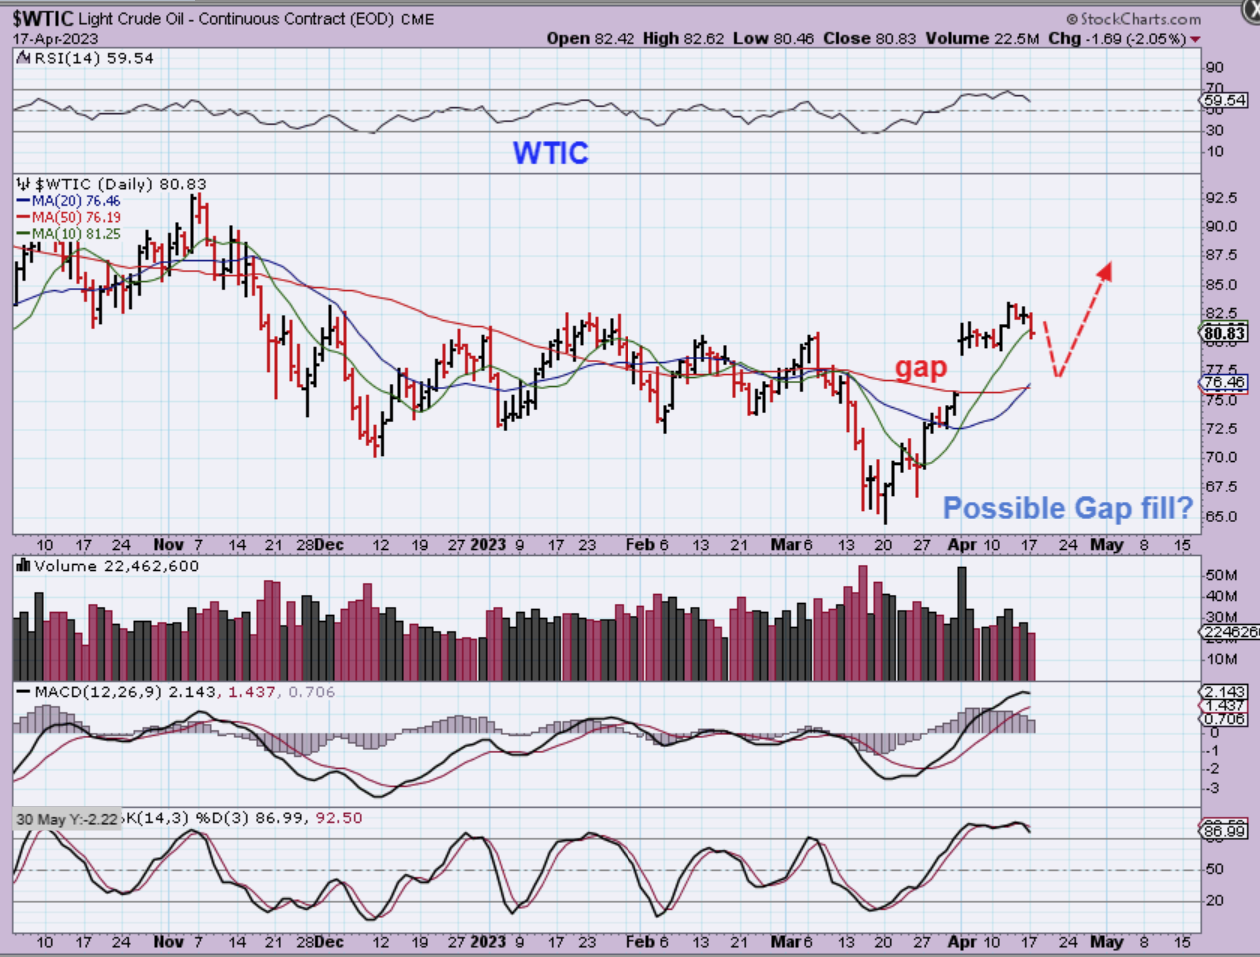
WTIC – Oil would not fill that gap over the past 2 weeks, so I did wonder if we’d just get a ‘gap and go’ run higher. Oil did drop yesterday to the 10sma after becoming overbought, so now it either moves higher from here or it could dip down and fill that gap on the 50sma support area.
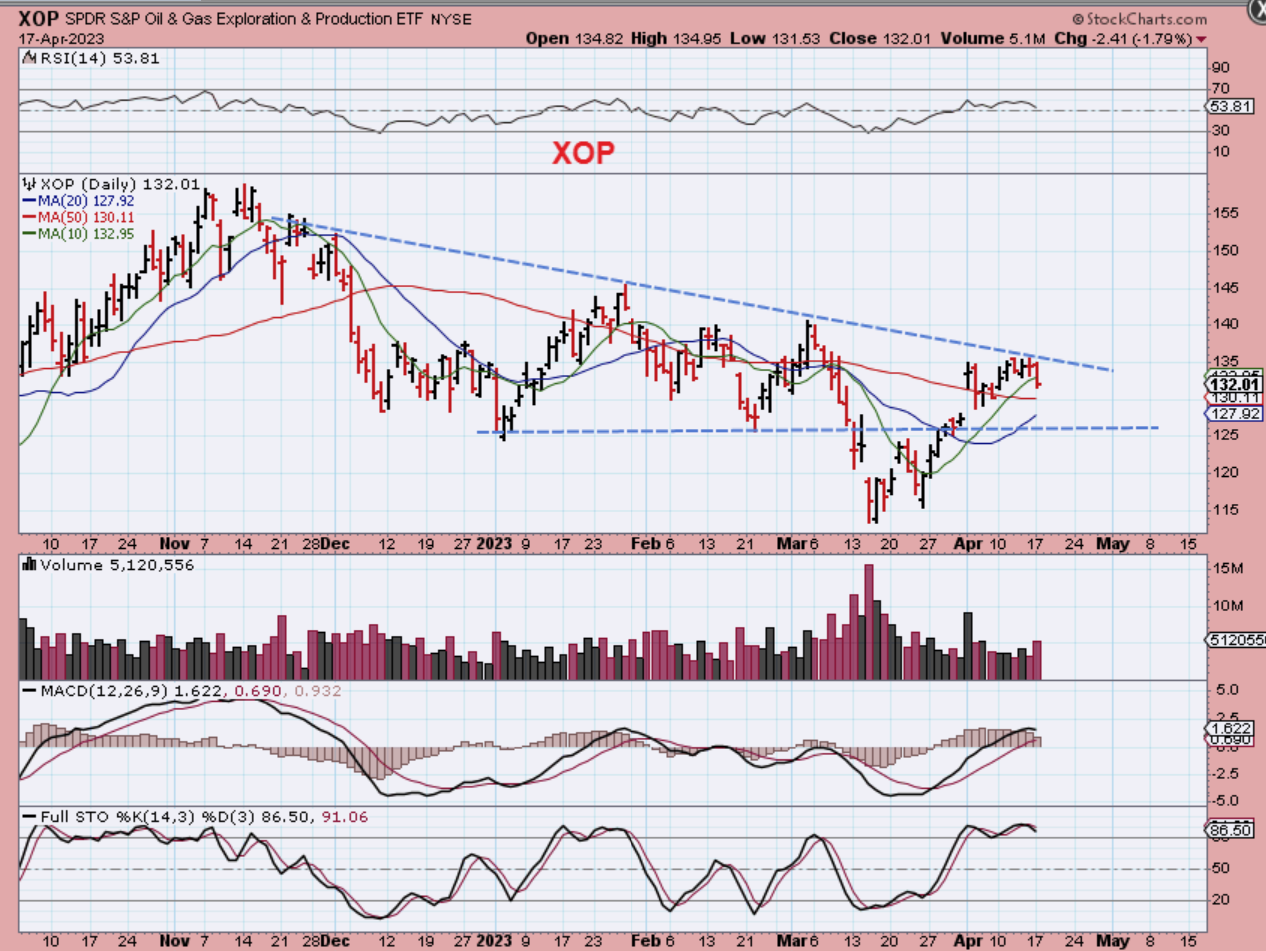
XOP – Oil stocks remained under the resistance that I have been pointing out, so they may follow Oil with a small dip (a buy opportunity) or a breakout. The sector still looks to have bottomed with an ICL, so either move can be bought for the longer term bullishness.
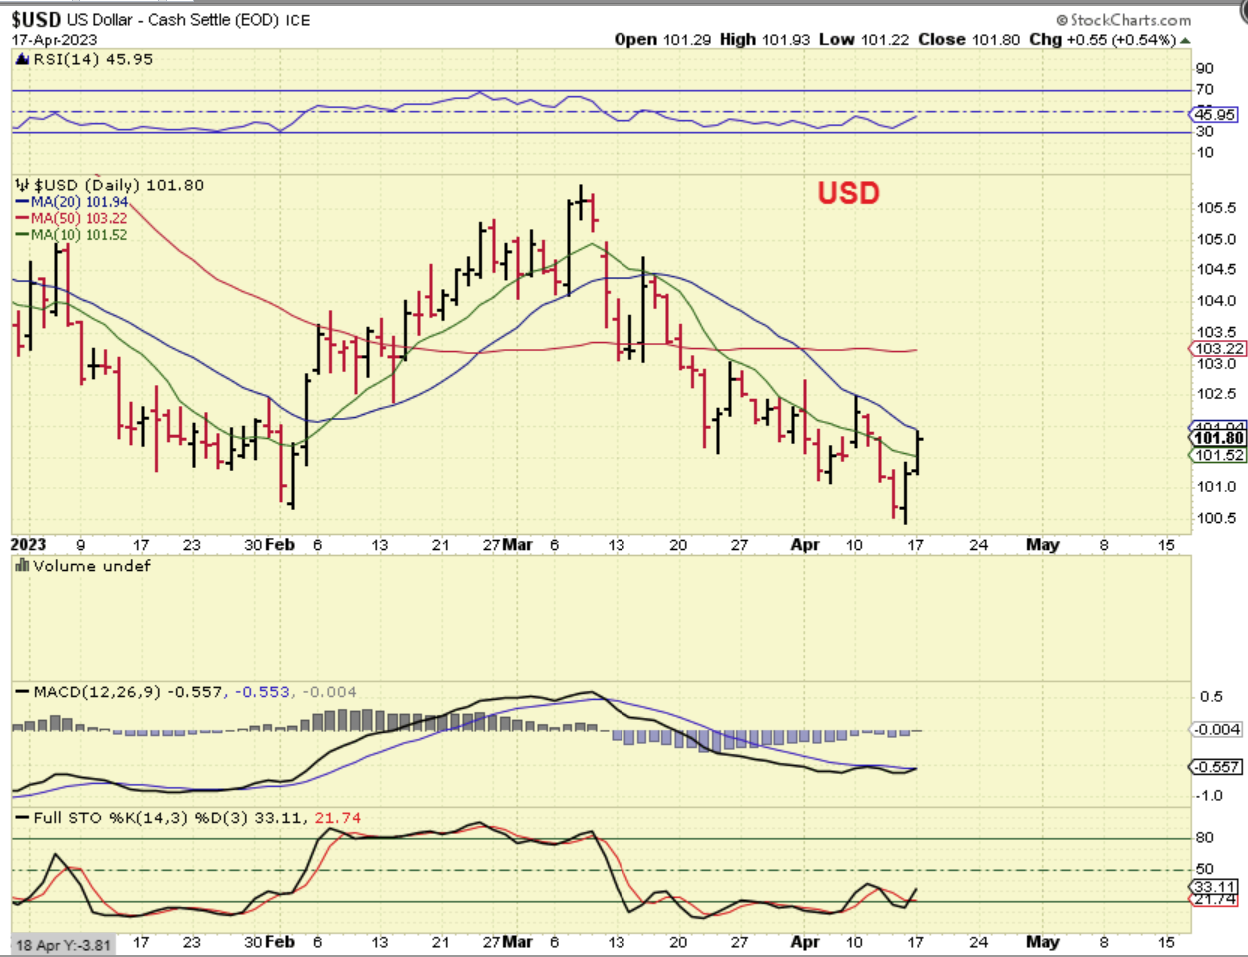
Here you can see that The USD pushed up to the 20sma, but remember that the General Markets, Solar Stocks, and even some EV stocks pushed higher and closed green, so that as encouraging. Next let’s just review this USD chart…
.
6 days ago it looked like we had a dcl, because the USD closed above the 10sma for 2 days. It then rolled over and that would give us a failed dcl. At the same time, it definitely broke below the Feb ICL, so this is still weak and a Failed Intermediate Cycle, after the bounce it should continue falling into the 3 yr cycle low. So in my opinion or analysis, the USD can be choppy, but it should not become strong.
.
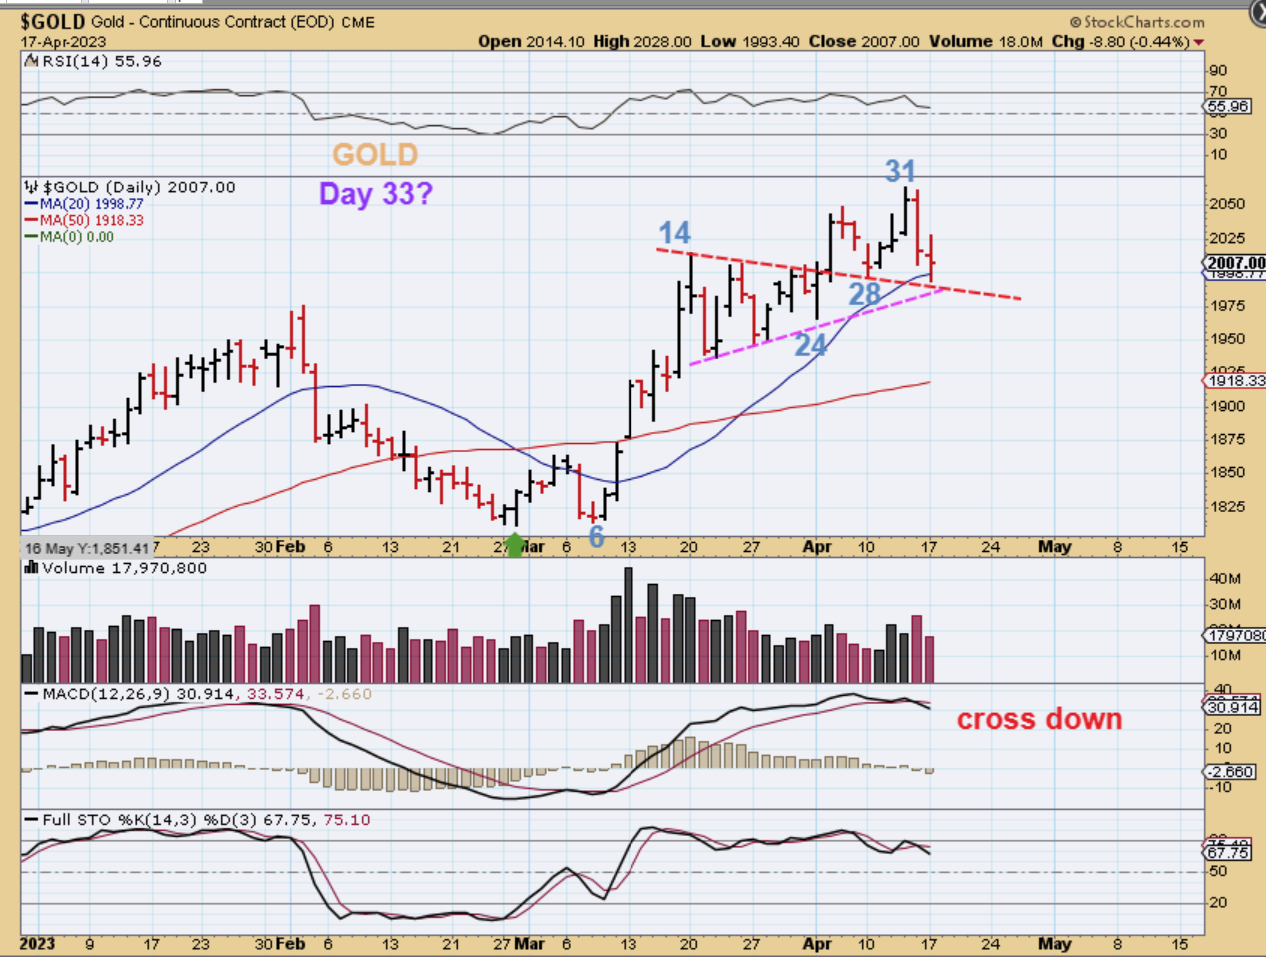
GOLD dipped down yesterday and started to bounce back. We have a Doji of indecision. We discussed a possible early dcl on day 28 with that back test of the triangle, but that low was slightly broken yesterday so it extends the cycle count to day 33. A dcl is due anytime and Gold is Bullish, but what about the MACD cross? Let’s take a step back for perspective…
.
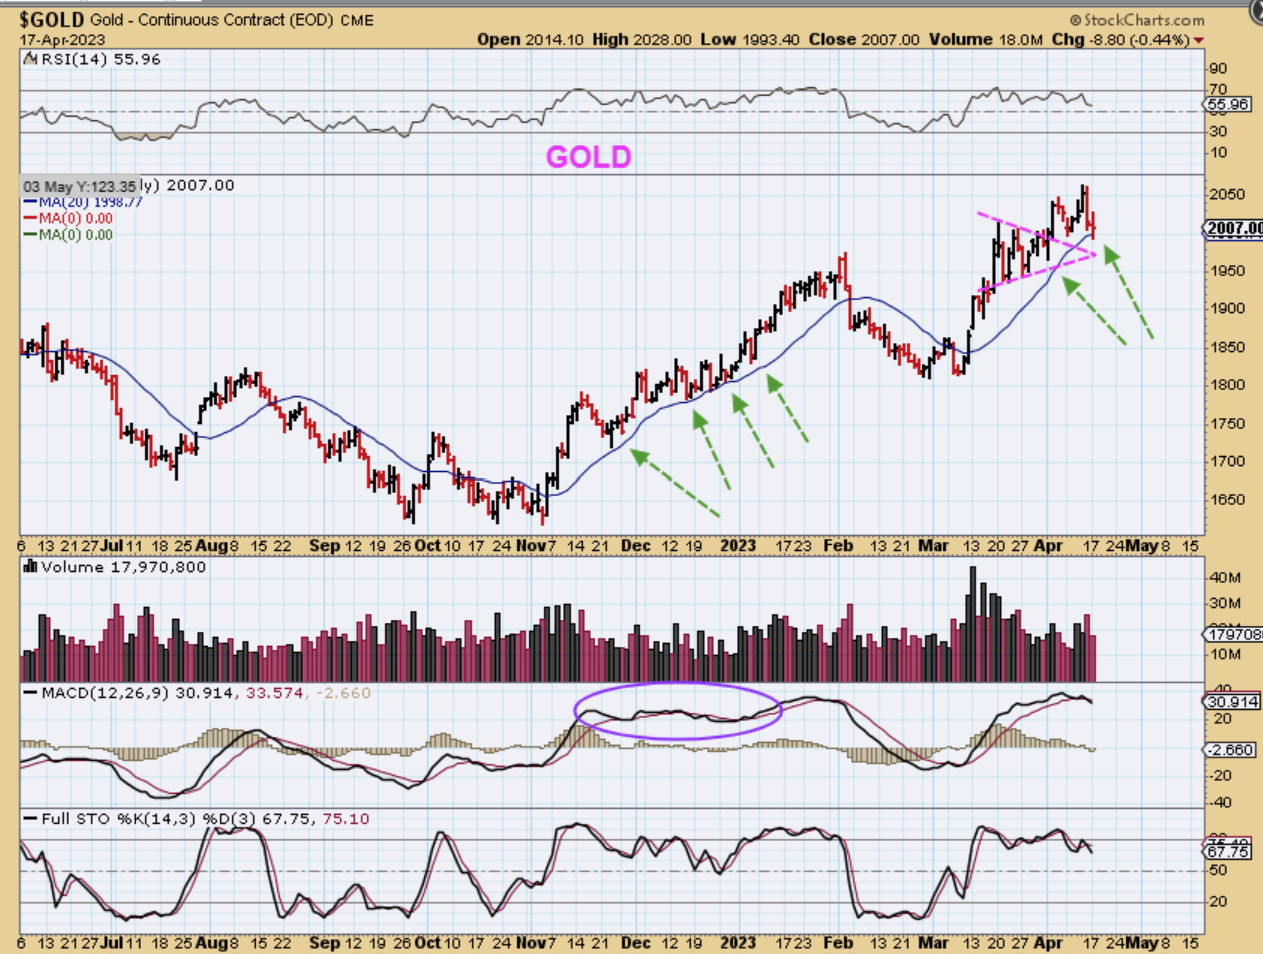
GOLD – In recent reports I mentioned a few times that on the last run higher, Gold didn’t break below the 20sma, but the MACD did briefly cross over and under during the choppiness. In past reports I said that I wondered if that 20sma would hold price up on this next run too. If it does not hold price here, I would expect another tag of that triangle, but overall Gold is bullish and many are looking to buy the dip, so I expect buying in Miners soon. Gold was Very Choppy on the last run higher too, and that may continue.
.
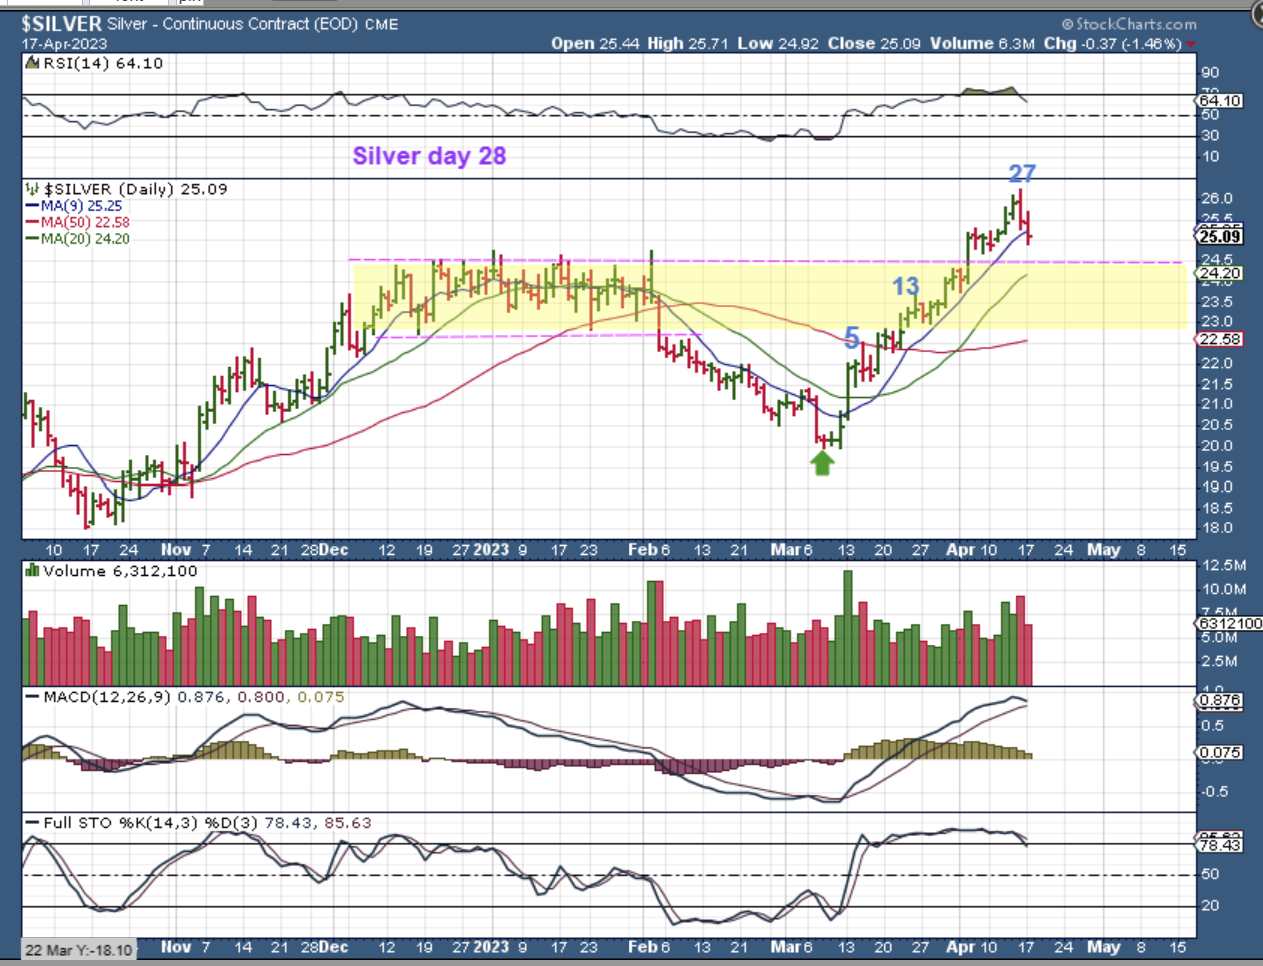
SILVER is due for a dcl and is finally dipping down on day 28. It has not broken below the 9sma until now, so here comes a buying opportunity if you didn’t buy at the 50sma. I’m not expecting a really deep dip, so I added that 20sma here and the yellow choppy area, and either can act as support.
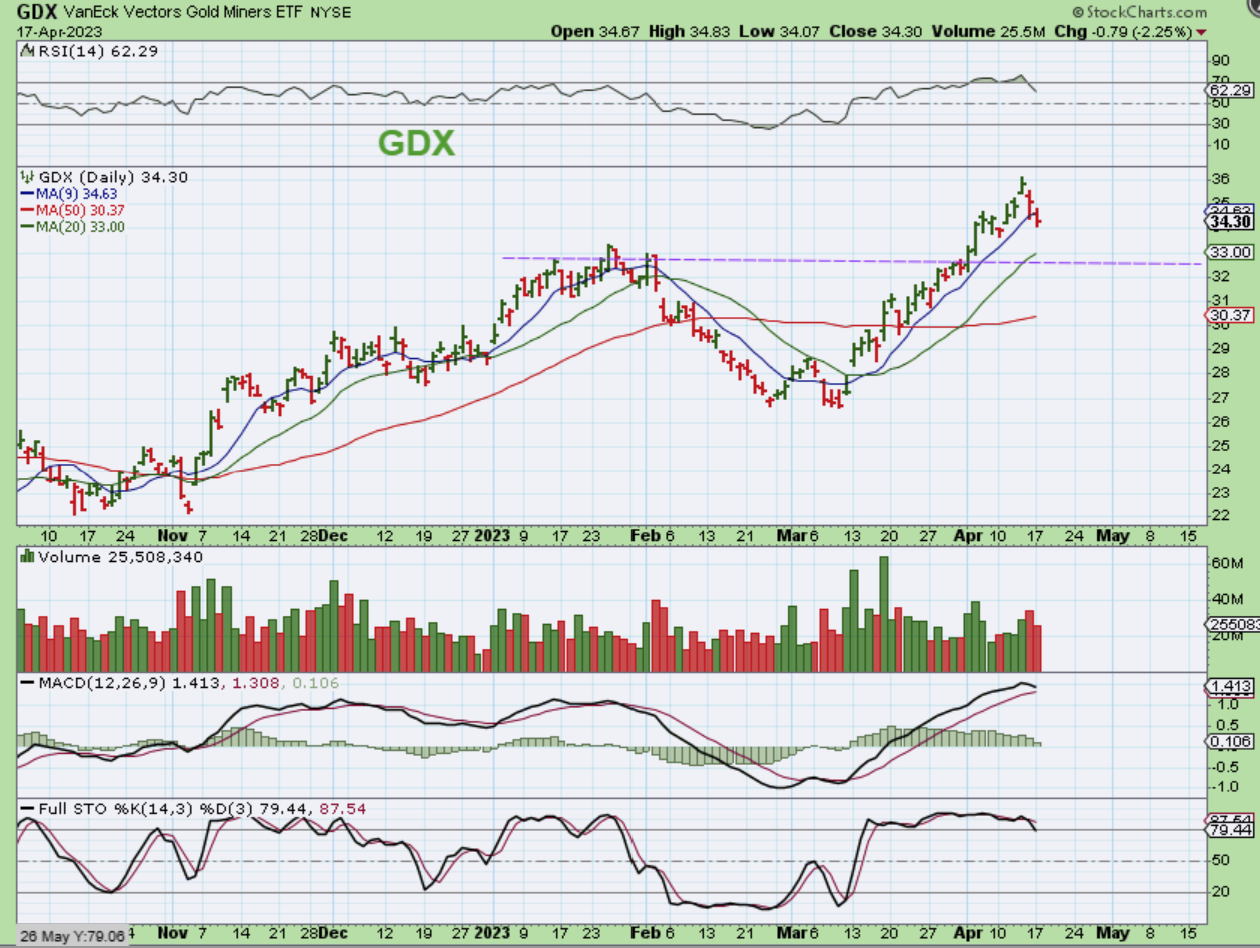
GDX is similar to Silver with a strong run that never broke the 9sma until now. I don’t expect a huge dip, so while the USD chops higher, Miners become a buying opportunity. Will GDX reach the purple support? Will it also reach that green 20sma line? If you see a reversal there, it will be within the timing for a dcl, so Miners will be a buy the dip opportunity. Let’s look at the ‘cycle count’…
,
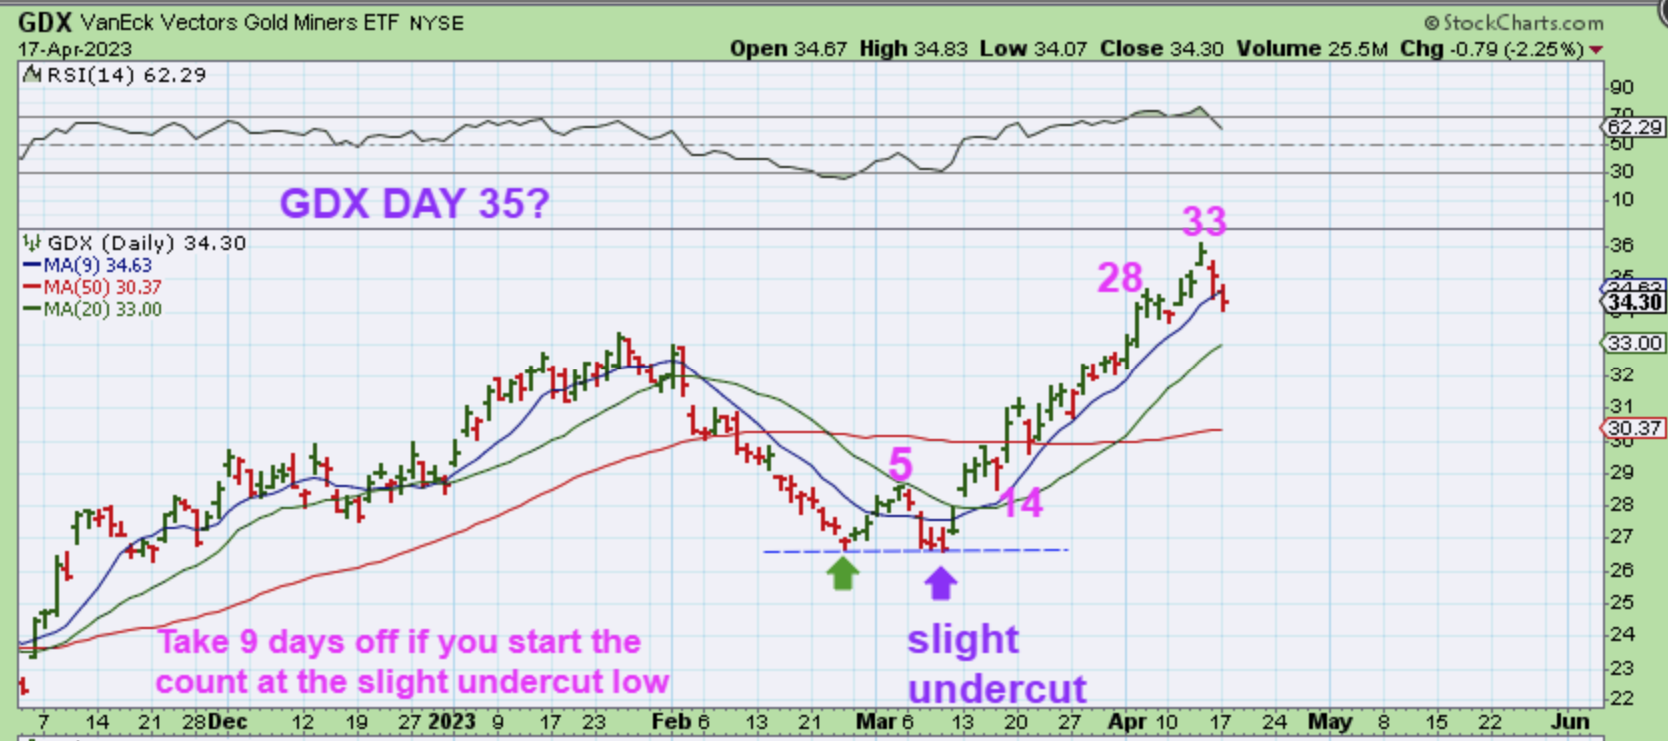
The count is a bit tricky, because the 2nd low Broke the first low, so you could count from there, but GOLD bottomed with the first low in Late Feb and Miners exaggerate the moves, so I’ll stick with that first low as the start.
.
GDX – If this is day 35, a dcl is slightly overdue. If I go by the 2nd low, it matches closer to Silver, so lets just say that
1. A dcl is due soon whether you use Gold or Silver
2. It will likely happen soon since I think that the USD will just be choppy and not strong
3. I added the 20sma and the prior highs could act as support here too. That would be GDX $32-$33 as a possible area to reverse.
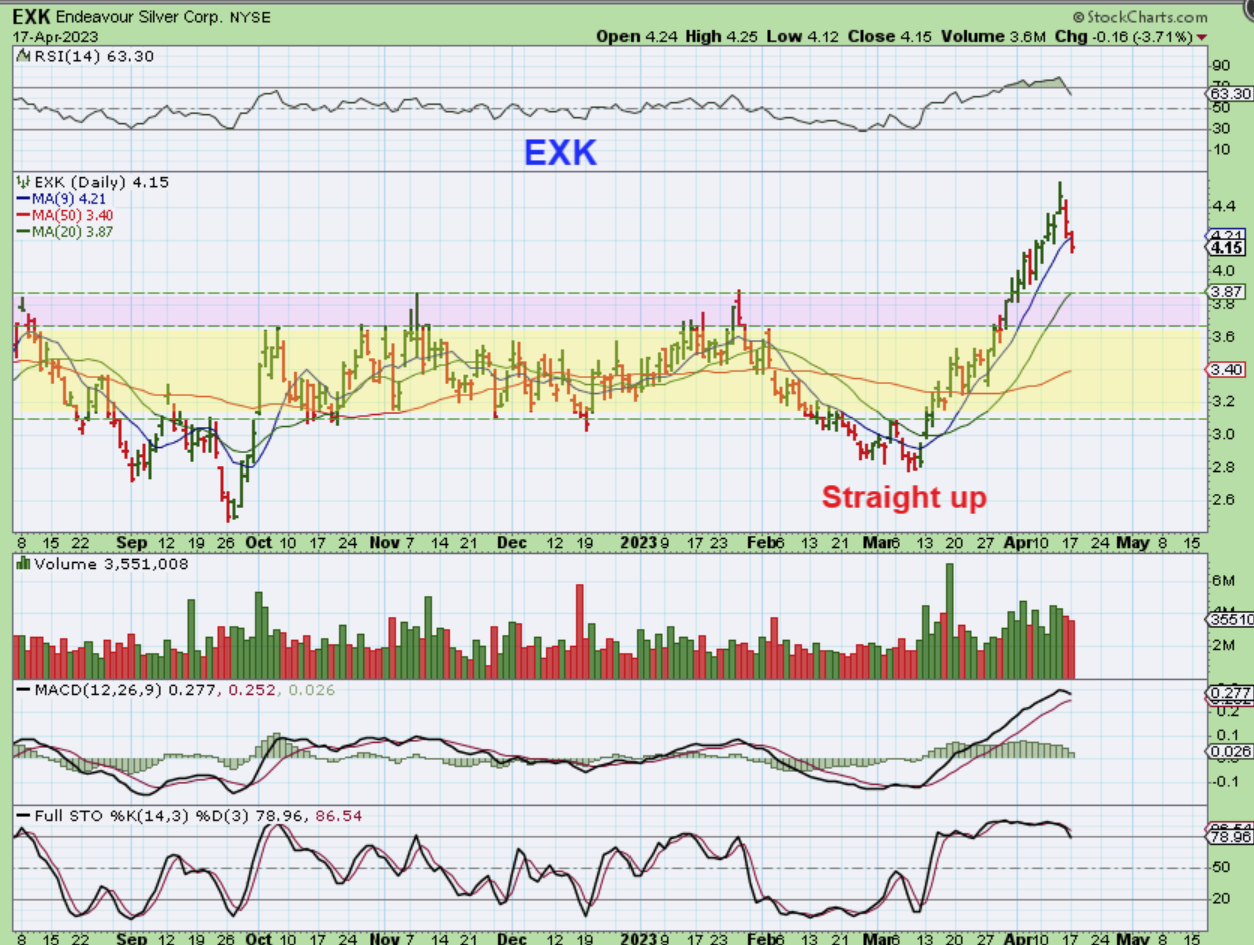
EXK – Many of these Silver Miners ran very strongly after we bought at the 50sma, and this dip is a buy because of that.
.
I have a few more thoughts below. Enjoy your Tuesday trading.
.
~ALEX
.
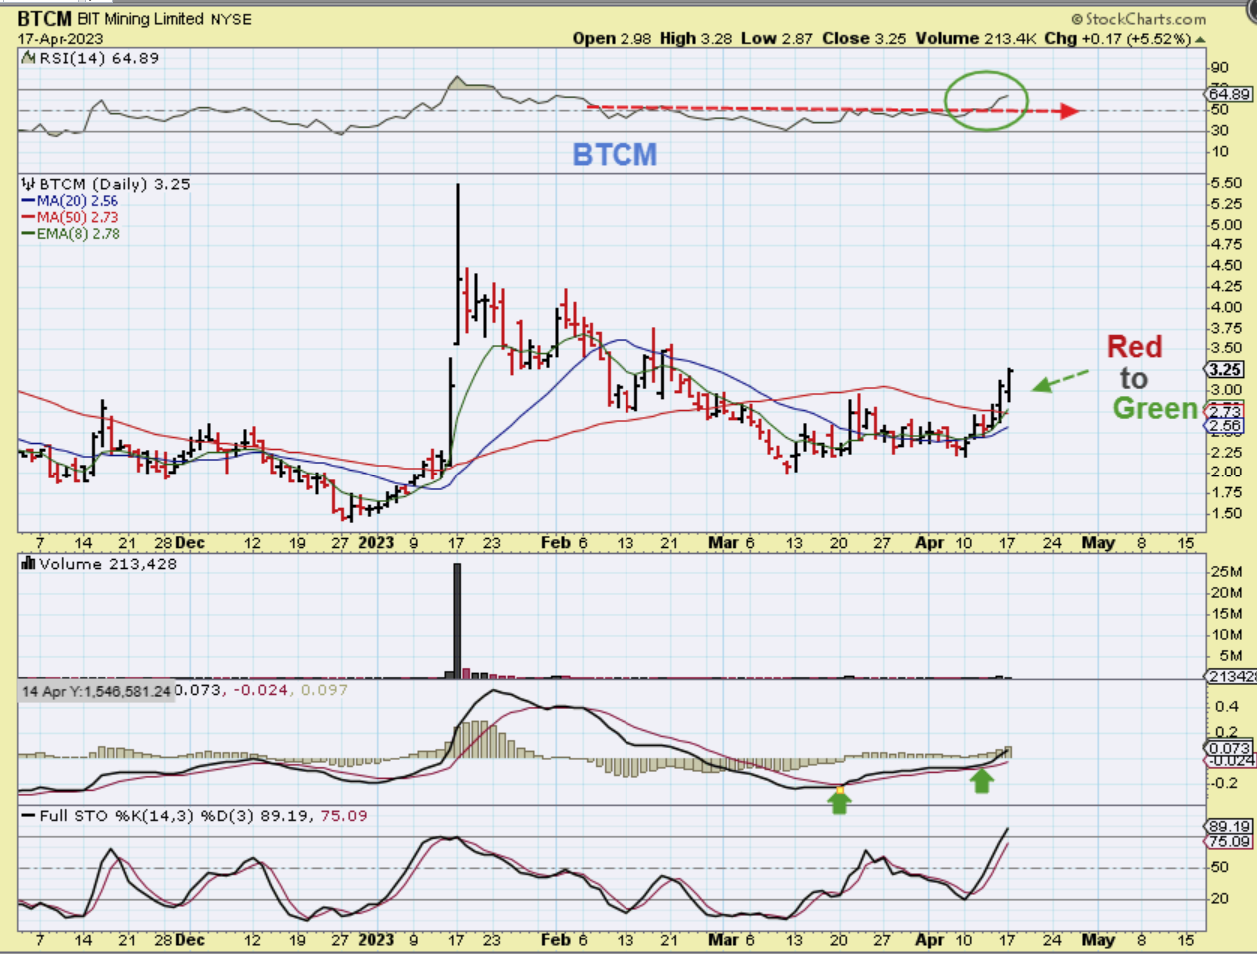
I noticed that while Bitcoin itself was doing a normal dip yesterday, some Miners went red to green. This is bullish price action for the sector.
.
BTCM was a bit of a lagger and did not run sharply higher like RIOT and MARA have, but notice what it did on a day when Bitcoin ( and MARA & RIOT) went red. BTCM, BTBT, CLSK, and a few others went Red to Green. BTCM may be ready to catch up to the others by rallying out of the lows.
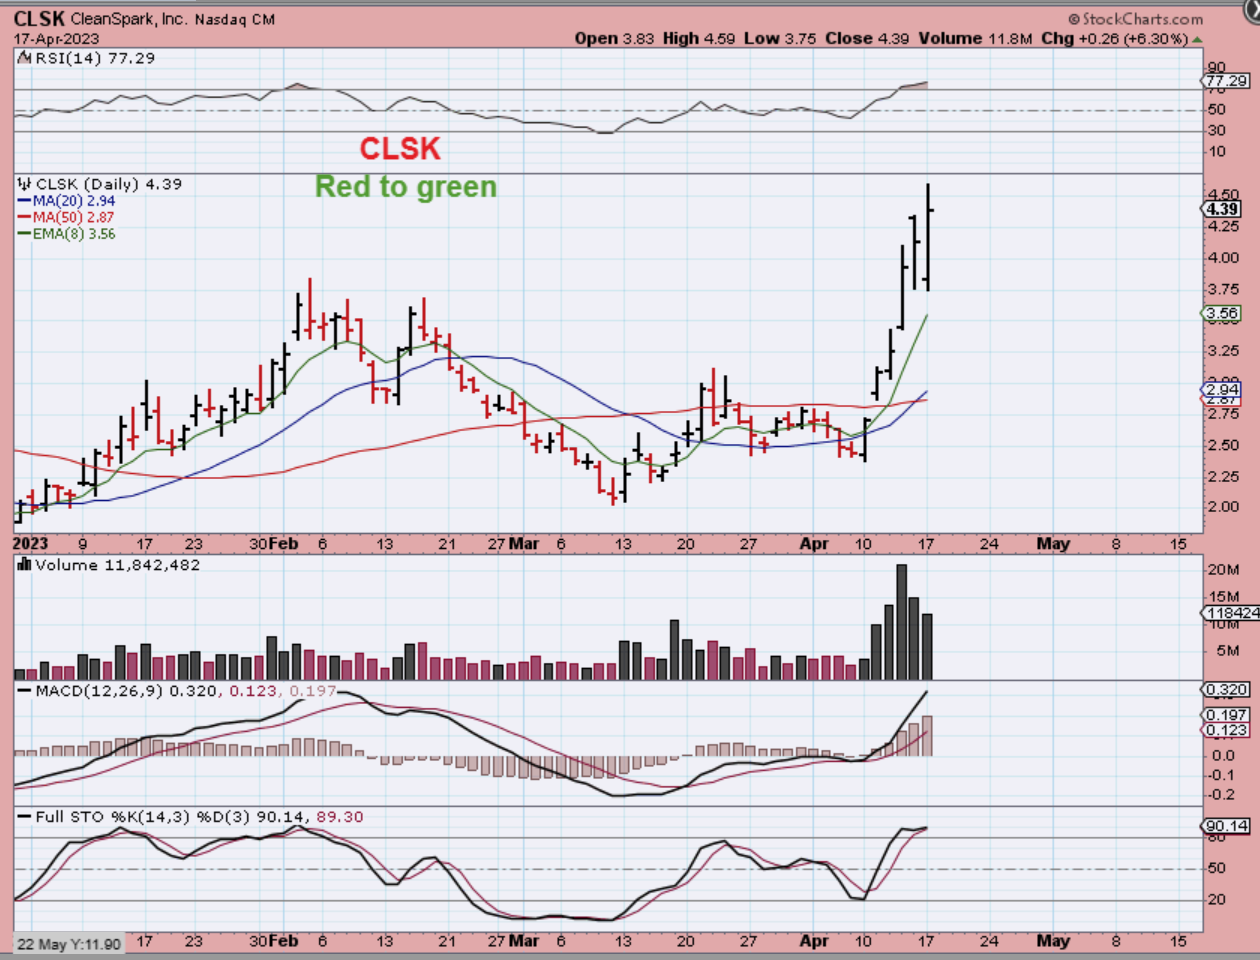
CLSK may be getting a bit extended here, but it started the day quite red with a big gap down, and then it recovered with a nice sign of strength. It has very good volume.
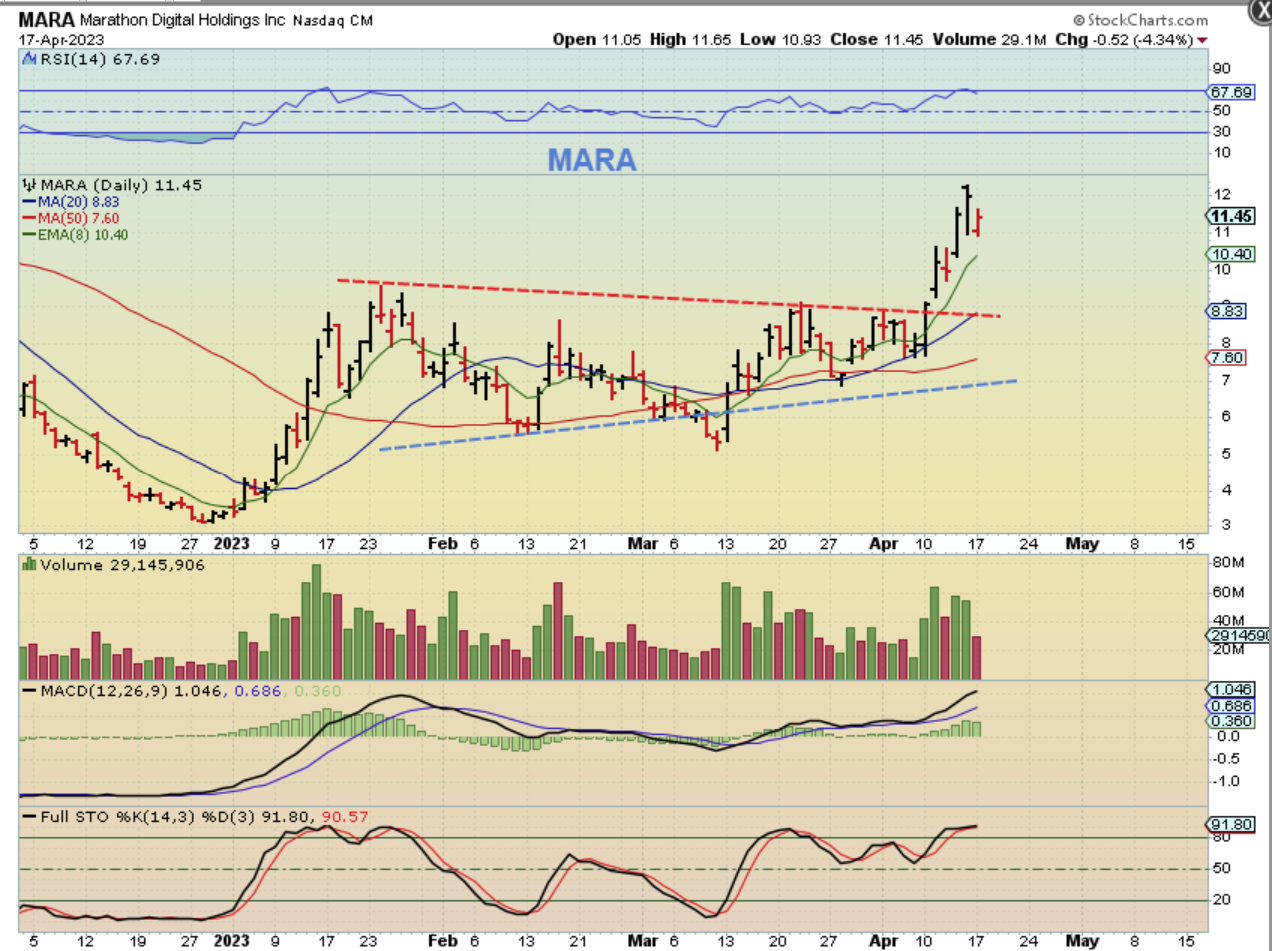
MARA dipped from $12 to $11 and did not go Green, but it was down about 8% in the morning and closed down only 4%. On the first run higher, notice that MARA and RIOT did occasionally only have 1 day dips on the run higher. That frustrated those that sold and tried to rebuy, so these are hard to trade, but $3 to $12 so far? They’ve been well worth the choppiness, and buying laggers .
.
EV, CLEAN ENERGY, AND SOLARS STILL LOOK TO BE BOTTOMING.
I mentioned that even thought the Bank Failures reversed the General Markets & Precious Metals before the complete ICL sell off followed through, one area that seems to have followed through into a normal ICL is the IWM/Small Caps, EV, SOLARS, etc. NOW IWM MAY BE STARTING TO PUSH HIGHER AFTER LAGGING.
.
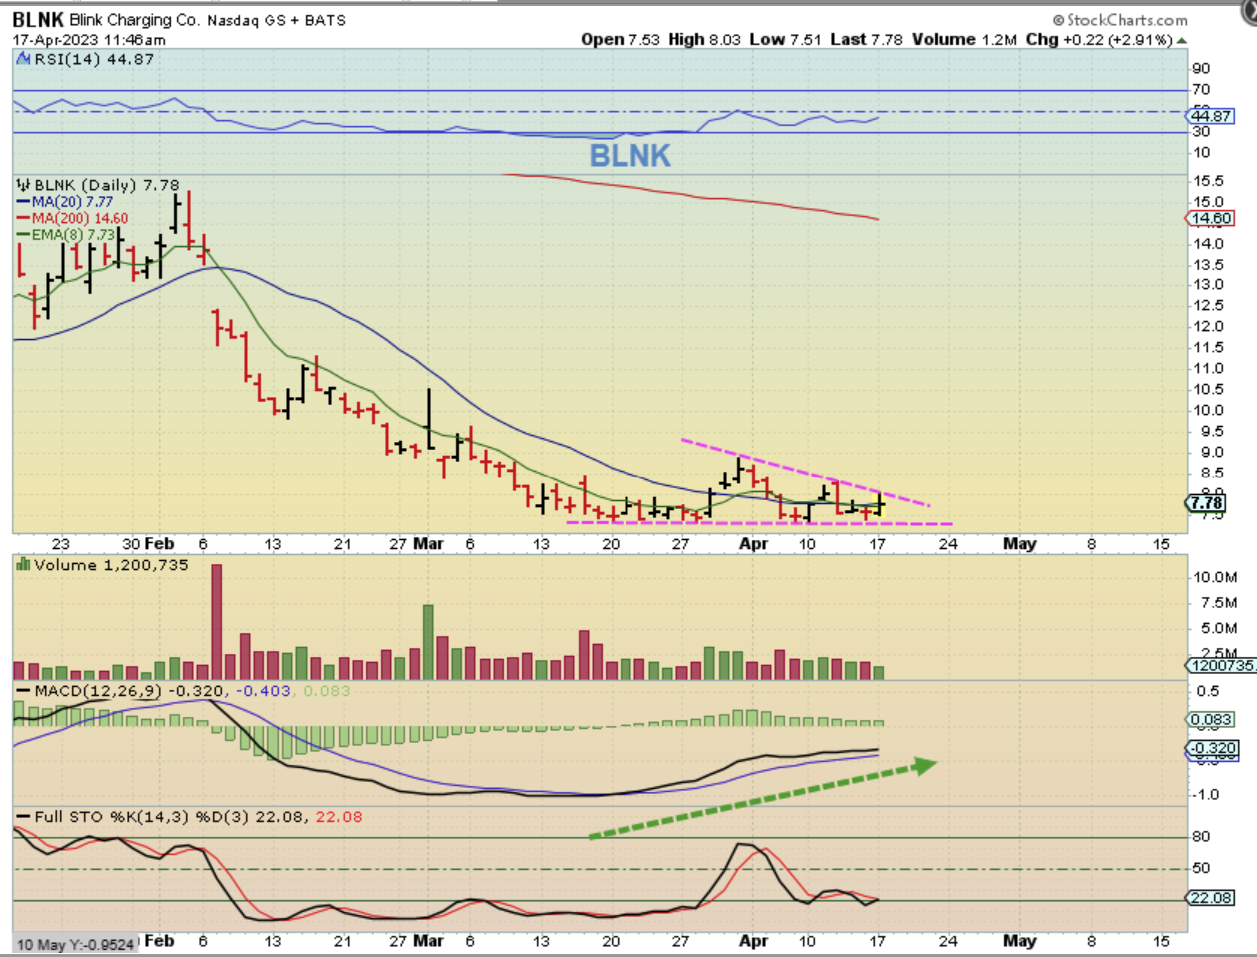
BLNK looks like it had an ICL sell off, but is bottoming and offers great potential. This is a bullish pattern at the low. BLNK under $8 seems like a bargain, we’ll see.
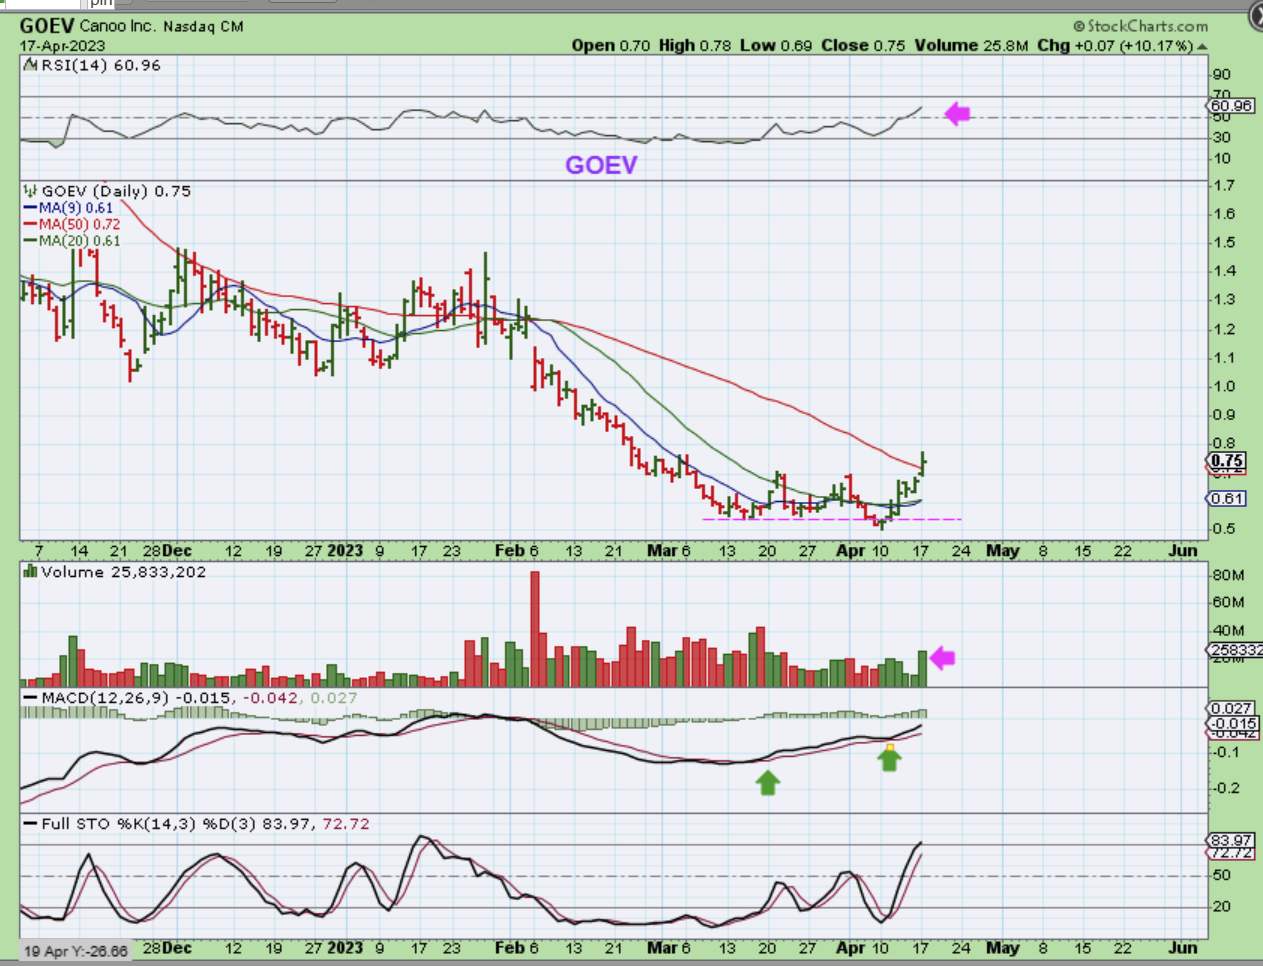
GOEV has been up for 5 days in a row and one of those days was up 11%, this one yesterday was over 12% at one point. GOEV is now up 50% in that time period. GOEV became a 50 cent stock, so not all want to buy it, but I just wanted to show how deep the selling was and much potential these may offer. Buy them and raise stops along the way.
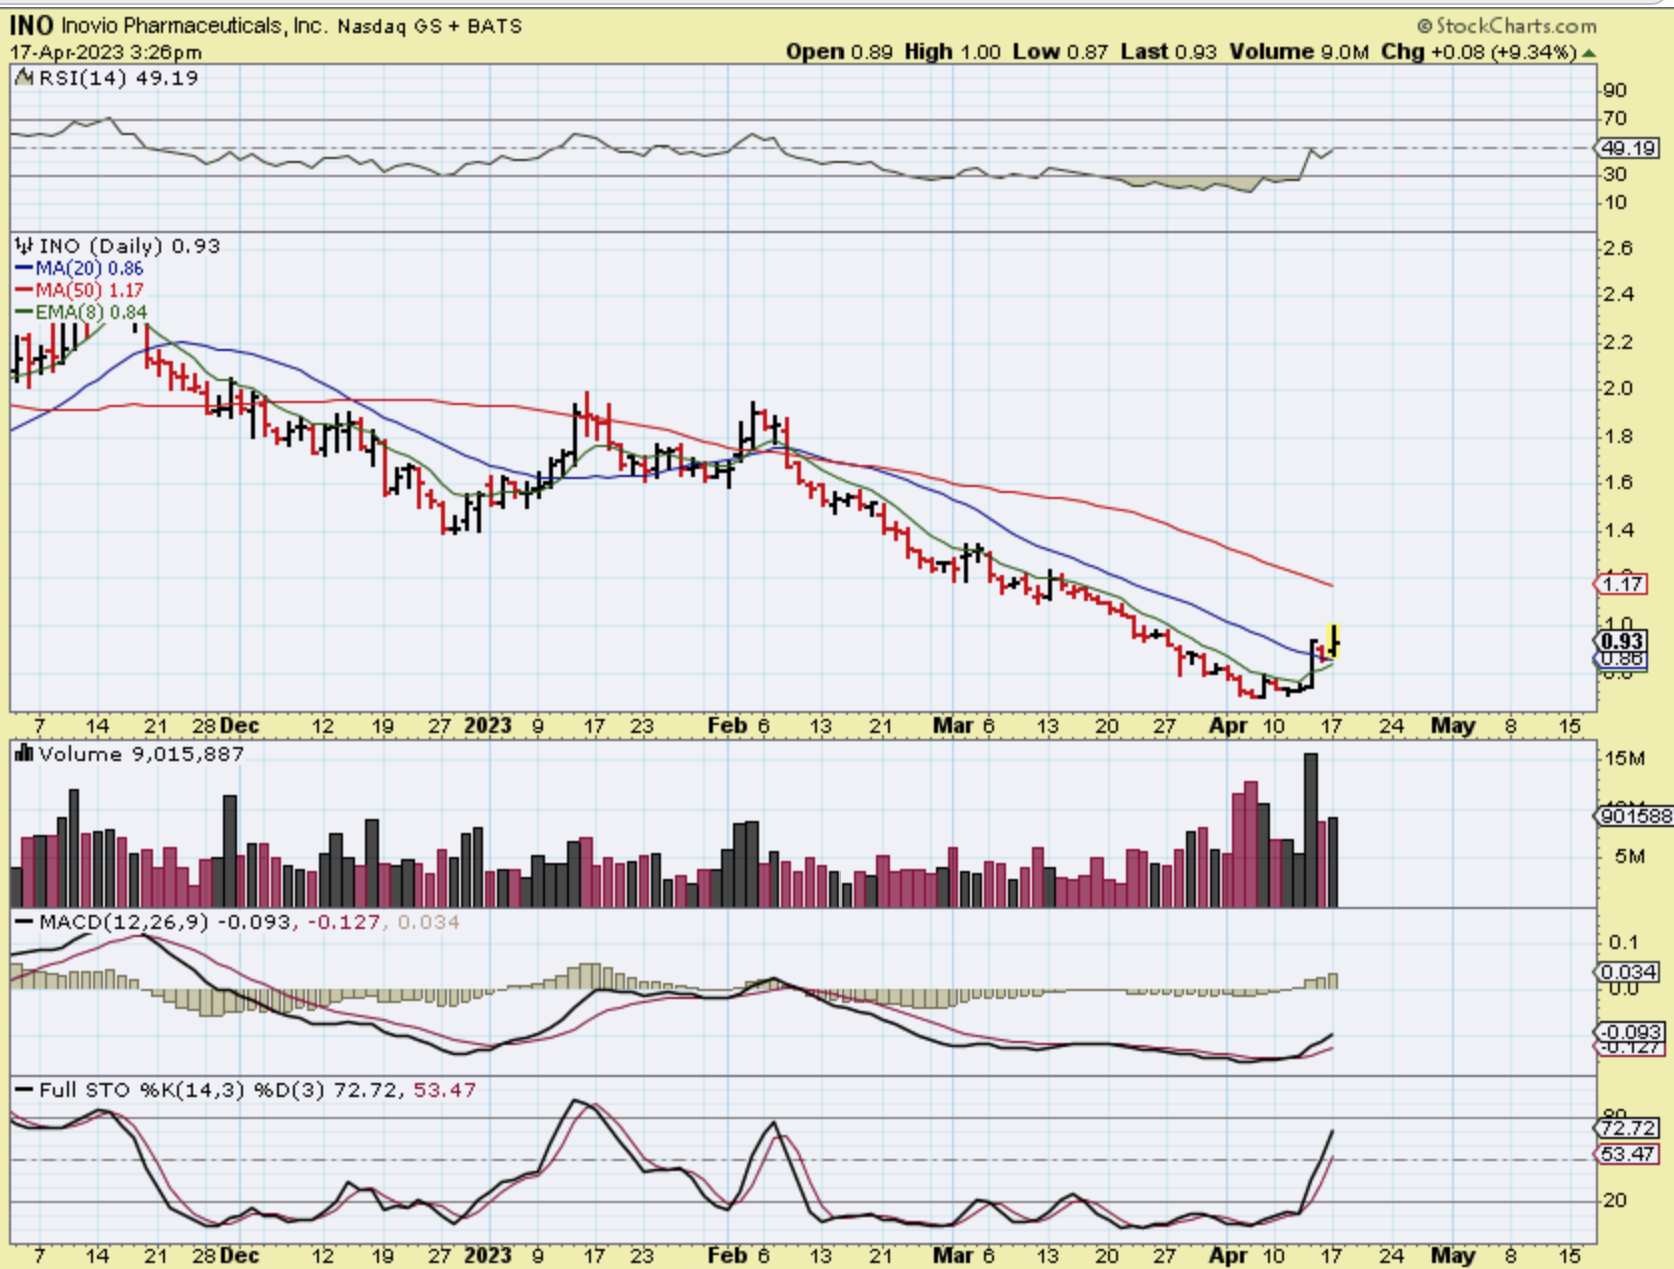
The Biotech stocks are Popping (Some in a BIG WAY), and so I’m looking at some that may be forming a higher low or have increasing volume. INO looks good to me as a possible BUY & HOLD, If this sector breaks out and runs.
Again as a reminder, Solar stocks like SPWR, CSIQ, RUN, SOL, etc ( & The TAN ETF) are setting up bullishly too.